10 Years of SOHO - Nasa
10 Years of SOHO - Nasa
10 Years of SOHO - Nasa
- No tags were found...

You also want an ePaper? Increase the reach of your titles
YUMPU automatically turns print PDFs into web optimized ePapers that Google loves.
<strong>10</strong> <strong>Years</strong> <strong>of</strong> <strong>SOHO</strong><strong>10</strong> <strong>Years</strong> <strong>of</strong> <strong>SOHO</strong>
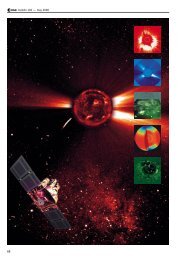
<strong>SOHO</strong>Bernhard Fleck, Daniel Müller, Stein Haugan,Luis Sánchez Duarte & Tero SiiliSolar and Solar-Terrestrial Missions Division,ESA Research & Scientific Support Department,NASA Goddard Space Flight Center, Greenbelt,MD, USAJoseph B. GurmanNASA Goddard Space Flight Center, Greenbelt,MD, USASince its launch on 2 December 1995,<strong>SOHO</strong> has revolutionised our understanding<strong>of</strong> the Sun. It has provided thefirst images <strong>of</strong> structures and flows below theSun’s surface and <strong>of</strong> activity on the far side.<strong>SOHO</strong> has revealed the Sun’s extremelydynamic atmosphere, provided evidence for thetransfer <strong>of</strong> magnetic energy from the surface tothe outer solar atmosphere, the corona, througha ‘magnetic carpet’, and identified the sourceregions <strong>of</strong> the fast solar wind. It hasrevolutionised our understanding <strong>of</strong> solarterrestrialrelations and dramatically improvedour space weather-forecasting by its continuousstream <strong>of</strong> images covering the atmosphere,extended corona and far side. The findings aredocumented in an impressive number <strong>of</strong>scientific publications: over 2500 papers inrefereed journals since launch, representing thework <strong>of</strong> over 2300 individual scientists. At thesame time, <strong>SOHO</strong>’s easily accessible,spectacular data and fundamental scientificresults have captured the imagination <strong>of</strong> thespace science community and the general publicalike. As a byproduct <strong>of</strong> the efforts to providereal-time data to the public, amateurs nowdominate <strong>SOHO</strong>’s discovery <strong>of</strong> over 1<strong>10</strong>0 Sungrazingcomets.esa bulletin 126 - may 2006 25
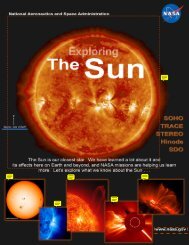
ScienceIntroductionWe all live in the extended atmosphere <strong>of</strong> amagnetically active star. While sunlightsustains life, the Sun’s variability producesstreams <strong>of</strong> high-energy particles andradiation that can affect life. Understandingthe changing Sun and its effectson the Solar System has become one <strong>of</strong> themain goals <strong>of</strong> the <strong>SOHO</strong> mission, whichwas launched to address three fundamentalscience questions: what is the structure anddynamics <strong>of</strong> the solar interior, how is thecorona heated, and how is the solar windaccelerated?A consortium <strong>of</strong> European spacecompanies led by prime contractor MatraMarconi Space (now EADS Astrium)built <strong>SOHO</strong> under overall managementby ESA, and international consortiadeveloped its suite <strong>of</strong> 12 instruments.NASA launched <strong>SOHO</strong> on 2 December1995, inserting it into a halo orbit aroundthe L1 Lagrangian point in February1996.The <strong>SOHO</strong> Experiment OperationsFacility (EOF), at NASA’s Goddard SpaceFlight Center, serves as the focal point formission science planning and instrumentoperations. Half <strong>of</strong> the 12 <strong>SOHO</strong> PrincipalInvestigator Teams have residentrepresentatives at the EOF, where theyreceive telemetry and send commandsdirectly from their workstations throughthe ground system to their instruments.An overview article cannot do justice tothe 2500-plus articles published in therefereed literature and an even greaternumber in conference proceedings andother publications. Here, we touch upon afew selected results. Highlights from thefirst 4 years <strong>of</strong> <strong>SOHO</strong> were described inBulletin <strong>10</strong>2 (May 2000).Making the Sun TransparentJust as seismology reveals the Earth’sinterior by studying earthquake waves,solar physicists probe the Sun’s interior via‘helioseismology’. The oscillationsdetectable at the visible surface are due tosound waves reverberating through theSun’s inner layers. By precisely measuringthe frequencies, we can infer the Sun’stemperature, density, atomic abundances,interior structure and the age <strong>of</strong> the SolarSystem, and even pursue such esotericmatters as testing the constancy <strong>of</strong> thegravitational constant.One <strong>of</strong> the most productive instruments,the Michelson Doppler Imager (MDI),shows oscillations <strong>of</strong> the whole Sun. It hasrevealed strong variations in the velocity<strong>of</strong> the plasma in the solar interior, andfound an ‘adjustment’ layer at the base <strong>of</strong>the convection zone. This layer, about220 000 km beneath the visible surface(about a third <strong>of</strong> the way down to theSun’s centre), connects the more orderlyinterior <strong>of</strong> the Sun (the radiative zone)with the more turbulent outer region(the convection zone). It is <strong>of</strong> particularinterest because this is where the solardynamo that creates the Sun’s magneticfield is believed to operate. In this region,the speed <strong>of</strong> the gas changes abruptly.Near the equator, the outer layers rotatefaster than the inner layers. At midlatitudesand near the poles, the situationis reversed.MDI data have revealed a fascinatingpicture <strong>of</strong> the large-scale, subsurfacedynamics <strong>of</strong> the Sun, with dramaticchanges with the solar cycle. We all knowSolar rotation and polar flows <strong>of</strong> the Sun deduced from MDImeasurements. The left side shows the difference in rotationspeed between various areas. Red-yellow is faster than average,while blue is slower than average. The light orange bands arezones that move slightly faster than their surroundings. Thecutaway reveals rotation speed inside the Sun. The large dark redband beneath the solar equator is a massive fast flow <strong>of</strong> hot,electrically-charged gas: plasma. The blue lines at right show thesurface flow from the equator to the poles. The return flowindicated at the bottom <strong>of</strong> the convection zone has not yet beenobserved<strong>of</strong> the crucial importance <strong>of</strong> large-scalestreams in our atmosphere (e.g. jet stream)and in the oceans (e.g. gulf stream) forEarth’s climate. MDI has for the first timeenabled us to observe such large-scalestreams inside the Sun. Researchersdiscovered transient storms, high- and lowpressurezones, and swirling wind flowsnear active regions that vary from day today like weather patterns on Earth’ssurface.Ever since MDI began to deliver helioseismicinformation at finer spatial scalesthan previously available, the new field <strong>of</strong>‘local-area helioseismology’ has developedrapidly. New methods allowed construction<strong>of</strong> the first true 3-D images and flow maps<strong>of</strong> the interior <strong>of</strong> a star, and even the firstimages <strong>of</strong> the far side <strong>of</strong> our Sun. Applyingthe novel ‘acoustic tomography’ methodto MDI data, scientists could for the firsttime study the structure <strong>of</strong> sunspots belowthe Sun’s surface. They were thus able tosolve two long-standing puzzles aboutthese blemishes on the Sun, which havebeen a source <strong>of</strong> wonder ever since theywere described (and drawn in painstakingdetail) by Galileo Galilei: how deepdo the spots extend below the surface,and how can sunspots last for severalweeks without breaking up? The MDIteam found the answers: strong, convergingdownflows stabilise the structure <strong>of</strong> thesunspots, and sunspots are relativelyshallow.‘Solar Subsurface Weather’ map, showing magnetic field(black/red) and average ‘wind’ flow (blue arrows) under thesolar surface26esa bulletin 126 - may 2006www.esa.int
<strong>SOHO</strong>dynamics <strong>of</strong> Earth’s upper atmosphere.Water vapour and ozone are especiallysensitive to changes in the Sun’s UVoutput. Fortunately, Earth’s atmosphereprotects us from this harmful radiation.This also means that we have to leaveEarth’s atmosphere behind and observethe Sun from space.<strong>SOHO</strong>’s Extreme ultraviolet ImagingTelescope (EIT) provides us with stunningimages <strong>of</strong> the Sun’s corona, showingdelicate coronal loops, bright flares andintriguing coronal holes. EIT and the UVspectrometers SUMER and CDS show usthat the outer solar atmosphere isextremely dynamic and changing, and thatplasma flows play an extremely importantrole.Gone With the Solar WindThe solar wind is a stream <strong>of</strong> mainlyelectrons and protons flowing from theUsing advanced analysis techniques, <strong>SOHO</strong>/MDI can reveal the temperature and flow structure beneath sunspotsJust a little over 4 years after the launch<strong>of</strong> <strong>SOHO</strong>, scientists published anastonishing result: the first successfulholographic reconstruction <strong>of</strong> features onthe far side <strong>of</strong> the Sun. An active regionon the far side reveals itself because itsstrong magnetic fields speed up the soundwaves. The difference becomes evidentwhen sound waves shuttling back andforth fall out <strong>of</strong> step with one another. Inthe meantime, the astonishing has becomeroutine, and MDI <strong>of</strong>fers daily far-sideimages online, at http://soi.stanford.edu/data/full_farside/.Violent solar activity occasionallydisrupts satellites, radio communicationsand power systems. Advancewarning <strong>of</strong> magnetic storms brewing onthe far side that could rotate with theSun and threaten Earth is therefore <strong>of</strong>vital importance for space weatherforecasting.The Sun’s Dynamic CoronaThe outer atmosphere <strong>of</strong> the Sun, thecorona, has a typical temperature <strong>of</strong> about1 million K and emits light mainly in theultraviolet (UV) part <strong>of</strong> the spectrum. It isthis radiation from the Sun’s hot coronathat controls the composition andHolographically reconstructed side view <strong>of</strong> the Sun showing thetwo large active regions <strong>10</strong>486 and <strong>10</strong>488 as they rotate fromthe far side (left) to the hemisphere visible from Earth (right).During the previous rotation, these two active regions were thesource <strong>of</strong> the powerful ‘Halloween’ storms in 2003, whichincluded the largest ever recorded X-ray flarewww.esa.int esa bulletin 126 - may 2006 27
Composite image <strong>of</strong> the solar corona with three wavelengths (171 Å as blue, 195 Å as yellow and 284 Å as red) combined to show features unique to each wavelength. The 171 Å filter captures emission atabout 1 million K, 195 Å at about 1.5 million K, and 284 Å at about 2.5 million KSun faster than 3 million km/h. It isessentially the hot solar corona expandinginto interplanetary and interstellar space.It deforms Earth’s magnetosphere andionises atoms in our upper atmosphere,causing beautiful aurorae.Interpreting data from the UltravioletCoronagraph Spectrometer (UVCS),scientists found evidence that the solarwind streams out <strong>of</strong> the Sun by ‘surfing’ onwaves produced by vibrating magneticfield lines, just like an ocean wavecarrying a surfer.Using SUMER, scientists have mappedthe outflow <strong>of</strong> plasma from coronal holes,and found a clear connection between theflow speed and the network structure <strong>of</strong>the chromosphere, a lower layer <strong>of</strong> theatmosphere. This is the first spectroscopicdiscovery <strong>of</strong> the source <strong>of</strong> the fastsolar wind. In a later study, a Chinese-German team has used SUMER andMDI data to show that the solar windThe solar wind emerges from coronal funnels. The magenta curves are open magnetic field lines, dark grey arches show closed ones.The lower plane shows the magnetic vertical component measured by MDI (blue to red). The upper plane shows Ne VIII Doppler shiftsfrom SUMER (hatched regions have large outflows), together with the inclination <strong>of</strong> the magnetic field (blue to red), as extrapolatedfrom the MDI measurements28esa bulletin 126 - may 2006www.esa.int
<strong>SOHO</strong>escapes from the Sun in funnels <strong>of</strong> openmagnetic fields.<strong>SOHO</strong>, the Space Weather WatchdogWhile the Sun’s total radiative output isreassuringly constant, it is at the same timea dynamic and violent star. Besidesemitting a continuous stream <strong>of</strong> plasmain the solar wind, the Sun periodicallyreleases huge amounts <strong>of</strong> matter in coronalmass ejections (CMEs). These are the mostpowerful eruptions in the Solar System,with billions <strong>of</strong> tonnes <strong>of</strong> electrified gaspropelled from the Sun’s atmosphere intospace at millions <strong>of</strong> km/h. If they hit Earth,these immense clouds can cause largemagnetic storms in our magnetosphereand upper atmosphere. Researchers believethey are launched when solar magneticfields become strained and suddenly snapinto a new arrangement, like a rubber bandtwisted to breaking point.Apart from causing beautiful aurorae,CME disturbances can damage satellites,disrupt telecommunications, endangerastronauts, lead to corrosion in oil pipelines and cause current surges in powerlines. As our society becomes increasinglydependent on space-based technologies,our vulnerability to ‘space weather’becomes more obvious, and the need tounderstand it and mitigate its effectsbecomes more urgent. In recent years,forecasting the conditions in the near-Earth environment and the ‘geoeffectiveness’<strong>of</strong> CMEs and solar flares hasbecome one <strong>of</strong> the key research areas insolar and solar-terrestrial physics; <strong>SOHO</strong>is playing a pioneering role in this newdiscipline. While satellites that makein situ measurements in near-Earth orbitscan give only about a 2-hour alert <strong>of</strong> solarstorms, <strong>SOHO</strong>’s coronagraphs and EUVThis fiery coronal mass ejection shows stunning details in the ejected material, revealed by <strong>SOHO</strong>’s LASCO coronagraph. The directsunlight is blocked (red disc), exposing the surrounding faint corona. The white circle represents the approximate size <strong>of</strong> the Sunimager observe the source <strong>of</strong> CMEs andflares and thus provide up to 3 days’warning, sufficient to save costly equipment.<strong>SOHO</strong>’s LASCO and EIT are theprimary source <strong>of</strong> operational informationon the location, speed and orientation <strong>of</strong>CMEs from the Earth-facing hemisphere<strong>of</strong> the Sun. These remote-sensing observationsare complemented by the CELIAS,COSTEP and ERNE in situ measurements<strong>of</strong> the arrival <strong>of</strong> the CME andenergetic particles at the L1 Lagrangianpoint.The LASCO team has compiled anextensive catalogue that summarises themass, speed, acceleration, angular width,position and so on <strong>of</strong> the more than <strong>10</strong> 000CMEs observed since launch. Thiscatalogue has been used in numerousstudies, including how the number <strong>of</strong>CMEs varies with the solar cycle: the rateincreases from 0.5 per day during solarminimum to over 6 per day during solarmaximum. Using LASCO data, scientistcan also for the first time reconstruct 3-Dimages <strong>of</strong> CME structures. CombinedA coronal mass ejection heading almost directly towards Earth,observed by LASCO C2. The size <strong>of</strong> the Sun is indicated by acircle, and the x-marked circle on the Sun shows the origin <strong>of</strong>the CME. Panel (a) shows the total intensity (darker meansmore intense) as imaged directly by LASCO. Panel (d) is atopographic map <strong>of</strong> the material shown in panel (a). Thedistance from the plane <strong>of</strong> the Sun to the material is colourcoded;the scale in units <strong>of</strong> solar radii is shown on the side.Panels (b) and (c) show the intensity as it would appear to anobserver positioned to the side <strong>of</strong> the Sun or directly above it,respectivelywww.esa.int esa bulletin 126 - may 2006 29
ScienceActive Region <strong>10</strong>486 unleashed a spectacular show on28 October 2003: an X 17.2 flare, a fast-moving coronal massejection and a strong solar energetic particle event. From top left:giant sunspot groups seen by MDI in white light; the flare as seenby EIT at 195 Å; the fast-moving CME in the LASCO C2coronagraph, then in the LASCO C3 coronagraph, with the particleshower becoming visible as ‘snow’ in the image. The cloud struckEarth’s magnetosphere only19 hours later, almost a record speedwith other views from the coronagraphs onthe STEREO satellite to be launched laterthis year, this technique shouldsignificantly reduce ambiguities in thereconstruction <strong>of</strong> interplanetary CMEmorphology.During 2 weeks in October/November2003, the Sun featured three unusuallylarge sunspot groups, which gave rise to11 X-class flares (including the strongestever recorded), numerous CMEs and twolarge proton storms. Satellites, power grids,radio communications and navigationsystems were significantly affected. Theevents, among the best-observed ever, willbe analysed for years to come. The eventstriggerred unprecedented attention fromthe media and public. <strong>SOHO</strong> imagesappeared in nearly every major newsoutlet. Furthermore, the great publicinterest wiped out all existing <strong>SOHO</strong> webtraffic records, with the web server servingover 31 million page requests and4.3 Terabyte <strong>of</strong> data in just one month.Measuring the Total Solar IrradianceA crucial question is whether the Sun’stotal irradiance is changing on longer timescales. Indications <strong>of</strong> such a change wouldhave a broad social and political impactas governments would have to devisestrategies in response to global warming.<strong>SOHO</strong>’s VIRGO instrument is monitoringthe total solar irradiance (TSI), also knownas the ‘solar constant’. The VIRGO teamhas constructed composites <strong>of</strong> TSImeasurements from <strong>SOHO</strong> and otherspacecraft over the last 26 years. Fromthis composite record, it now appears thatthere is no evidence for a significant longtermtrend in the TSI: the total radiationfrom the Sun does not show any systematicbrightness increase or decrease onobserved time scales. However, while thetotal solar irradiance varies by less than0.1% over the 11-year solar cycle, theirradiance in the extreme-UV (EUV) part<strong>of</strong> the spectrum changes by as much as30% within weeks and by a factor <strong>of</strong>The composite total solar irradiance (TSI) over two solar cycles,combining data from multiple spacecraft instruments, does notshow a long-term change. Different colours indicate differentdata sources; the blue data are from <strong>SOHO</strong>’s VIRGO30esa bulletin 126 - may 2006www.esa.int
<strong>SOHO</strong>Perihelion passage <strong>of</strong> comet NEAT (C/2002 V1) in February2003, as imaged by LASCO C32–<strong>10</strong>0 (depending on wavelength) overthe solar cycle. Detailed knowledge <strong>of</strong>the solar spectral irradiance is crucial forunderstanding climate variability, and todisentangle natural variations fromanthropogenic climate changes.<strong>SOHO</strong>, the Comet Finder<strong>SOHO</strong> is providing new measurements notonly about the Sun. On 5 August 2005,Toni Scarmato, a high school teacher fromCalabria, Italy, discovered <strong>SOHO</strong>’s 999thand <strong>10</strong>00th comets. As <strong>of</strong> February 2006,LASCO had detected over 1<strong>10</strong>0 comets,most <strong>of</strong> them ‘Sun-grazers’. These cometspass very close to the Sun and growprominent tails as their icy cores areheated. Nearly half <strong>of</strong> all comets forwhich orbital elements have beendetermined (since 1761) were discoveredby <strong>SOHO</strong>, and over two-thirds <strong>of</strong> thoseby amateurs accessing LASCO data viathe Web. This is a field where amateurscan actively contribute to scientificresearch; each day, numerous peoplefrom all over the world download thenear-realtime data to search for newcomets.As the brightest, most spectacularcomet ever observed by <strong>SOHO</strong>, cometNEAT (C/2002 V1) provided someenticing data for further study, thanks toa grazing encounter with a coronal massejection. The LASCO C3 observationsduring 16–20 February 2003 suggestinteraction between the comet’s ion tailand other magnetic fields in the outercorona at the time <strong>of</strong> the oblique impactwith the CME. This is the first time thatsuch an event has been imaged, and nocomet has ever been observed closer tothe Sun.The analysis <strong>of</strong> high-resolution spectroscopicobservations <strong>of</strong> comet C/2002 X5(Kudo-Fujikawa) from UVCS has revealeda near-spherical cloud <strong>of</strong> neutral hydrogenand a variable tail <strong>of</strong> ionised carbon (C +and C + 2) that disconnected from the cometand was subsequently regenerated.<strong>SOHO</strong>’s SWAN instrument monitoredthe break-up <strong>of</strong> comet LINEAR C/1999S4. The total amount <strong>of</strong> water vapourobserved by SWAN from 25 May to12 August 2000 was estimated at3.3 million tonnes. Only about 1% <strong>of</strong> thiswas left on 6 August, when observationsby the Hubble Space Telescope <strong>of</strong> thedying comet’s fragments gave an estimate<strong>of</strong> the total volume. Combining thenumbers gives a remarkably low value forthe density: about 15 kg/m 3 , comparedwith 917 kg/m 3 for familiar non-porousice. Even allowing for an equal amount <strong>of</strong>dust grains, 30 kg/m 3 is far less than the500 kg/m 3 <strong>of</strong>ten assumed by cometscientists.Conclusions and <strong>SOHO</strong>’s FutureThe journey has not always been easy. Forexample, an unexpected loss <strong>of</strong> contactoccurred on 25 June 1998. Fortunately, themission was completely recovered in one<strong>of</strong> the most dramatic rescue efforts inspace, and normal operations could beresumed in mid-November 1998 after thesuccessful recommissioning <strong>of</strong> thespacecraft and all 12 instruments. Despitethe subsequent failures <strong>of</strong> all threegyroscopes (the last in December 1998),new gyroless control s<strong>of</strong>tware installed byFebruary 1999 allowed <strong>SOHO</strong> to return tonormal scientific operations, providing anwww.esa.int esa bulletin 126 - may 2006 31
ScienceComposite image <strong>of</strong> comet C/2002 X5 (Kudo-Fujikawa) as it passed within 0.2 AU <strong>of</strong> theSun in late January 2003. The path <strong>of</strong> thecomet is in white, with arrows indicating thedirection <strong>of</strong> travel. The solar disc is shown asan EIT 304 Å image. The background is acombination <strong>of</strong> LASCO C2 and C3 images <strong>of</strong>the corona in visible light, and the blank ringrepresents the occulting disc <strong>of</strong> the C2camera. LASCO also reveals the comet in theoptical, as the fuzzy white dot to the right <strong>of</strong>the Sun. The zoomed-in images at right depictthe comet in the H I Lyman-alpha 1216 Å line(blue) and the C III 977 Å line (red-orange).The C III emission has never been seen beforein a comet. At upper right, the comet’s mainplasma tail has disconnected and is driftinganti-sunward even as a new, dim plasma tailis born from the nucleus. By the time <strong>of</strong> thesecond UVCS image, the new plasma tail hasbrightened and is beginning to turn as thecomet heads away from the Suneven greater margin <strong>of</strong> safety. This made<strong>SOHO</strong> the first 3-axis-stabilised spacecraftto operate without a gyroscope. A thirdcrisis occurred in June 2003, when<strong>SOHO</strong>’s main antenna became stuck.Using the secondary antenna and s<strong>of</strong>twarefor intermittent recording, however, eventhis problem was overcome, and theobservations continue.In complex areas <strong>of</strong> research such assolar physics, progress is not made by justa few people. The scientific achievements<strong>of</strong> the <strong>SOHO</strong> mission are the results <strong>of</strong>a concerted, multi-disciplinary effort by alarge international community <strong>of</strong> solarscientists, involving sound investment inspace hardware coupled with a vigorousand well-coordinated scientific operationand interpretation. The interplay betweentheory and observations has deliveredmany new insights and will continue to doso for many years.In its <strong>10</strong> years since launch, <strong>SOHO</strong>has provided an unparalleled breadth anddepth <strong>of</strong> information about the Sun,from its interior, through the hot anddynamic atmosphere, to the solar windand its interaction with the interstellarmedium. Research using <strong>SOHO</strong> observationshas revolutionised our understanding<strong>of</strong> the Sun and space weather.The coming years promise to be similarlyexciting and rewarding, when <strong>SOHO</strong>observations are complemented andenhanced by those from NASA’s STEREOand Japan’s Solar-B missions, affordingnew opportunities for improved understanding<strong>of</strong> the Sun-heliosphere system.After the launch <strong>of</strong> NASA’s SolarDynamics Observatory, <strong>SOHO</strong>’s directdescendant, the capabilities <strong>of</strong> some<strong>SOHO</strong> instruments will be eclipsed. Butnot all: the LASCO coronagraphobservations and VIRGO total solarirradiance measurements will continueto make crucial and unique contributionsto the International Living With a Star(ILWS) programme.AcknowledgementsThe great success <strong>of</strong> the <strong>SOHO</strong> mission isa tribute to the many people – too manyto name here – who designed and builtthis exquisite spacecraft and its excellentinstruments, to the engineers who broughtit back from the dead (twice), and to themany people who diligently work behindthe scenes to keep it up and running.eFurther information on <strong>SOHO</strong> and its achievements can befound at http://soho.esac.esa.int/32esa bulletin 126 - may 2006www.esa.int