10 Years of SOHO - Nasa
10 Years of SOHO - Nasa
10 Years of SOHO - Nasa
- No tags were found...

You also want an ePaper? Increase the reach of your titles
YUMPU automatically turns print PDFs into web optimized ePapers that Google loves.
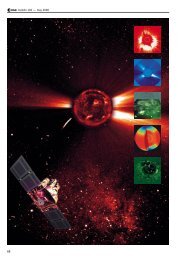
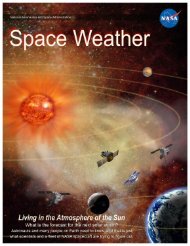
<strong>SOHO</strong>escapes from the Sun in funnels <strong>of</strong> openmagnetic fields.<strong>SOHO</strong>, the Space Weather WatchdogWhile the Sun’s total radiative output isreassuringly constant, it is at the same timea dynamic and violent star. Besidesemitting a continuous stream <strong>of</strong> plasmain the solar wind, the Sun periodicallyreleases huge amounts <strong>of</strong> matter in coronalmass ejections (CMEs). These are the mostpowerful eruptions in the Solar System,with billions <strong>of</strong> tonnes <strong>of</strong> electrified gaspropelled from the Sun’s atmosphere intospace at millions <strong>of</strong> km/h. If they hit Earth,these immense clouds can cause largemagnetic storms in our magnetosphereand upper atmosphere. Researchers believethey are launched when solar magneticfields become strained and suddenly snapinto a new arrangement, like a rubber bandtwisted to breaking point.Apart from causing beautiful aurorae,CME disturbances can damage satellites,disrupt telecommunications, endangerastronauts, lead to corrosion in oil pipelines and cause current surges in powerlines. As our society becomes increasinglydependent on space-based technologies,our vulnerability to ‘space weather’becomes more obvious, and the need tounderstand it and mitigate its effectsbecomes more urgent. In recent years,forecasting the conditions in the near-Earth environment and the ‘geoeffectiveness’<strong>of</strong> CMEs and solar flares hasbecome one <strong>of</strong> the key research areas insolar and solar-terrestrial physics; <strong>SOHO</strong>is playing a pioneering role in this newdiscipline. While satellites that makein situ measurements in near-Earth orbitscan give only about a 2-hour alert <strong>of</strong> solarstorms, <strong>SOHO</strong>’s coronagraphs and EUVThis fiery coronal mass ejection shows stunning details in the ejected material, revealed by <strong>SOHO</strong>’s LASCO coronagraph. The directsunlight is blocked (red disc), exposing the surrounding faint corona. The white circle represents the approximate size <strong>of</strong> the Sunimager observe the source <strong>of</strong> CMEs andflares and thus provide up to 3 days’warning, sufficient to save costly equipment.<strong>SOHO</strong>’s LASCO and EIT are theprimary source <strong>of</strong> operational informationon the location, speed and orientation <strong>of</strong>CMEs from the Earth-facing hemisphere<strong>of</strong> the Sun. These remote-sensing observationsare complemented by the CELIAS,COSTEP and ERNE in situ measurements<strong>of</strong> the arrival <strong>of</strong> the CME andenergetic particles at the L1 Lagrangianpoint.The LASCO team has compiled anextensive catalogue that summarises themass, speed, acceleration, angular width,position and so on <strong>of</strong> the more than <strong>10</strong> 000CMEs observed since launch. Thiscatalogue has been used in numerousstudies, including how the number <strong>of</strong>CMEs varies with the solar cycle: the rateincreases from 0.5 per day during solarminimum to over 6 per day during solarmaximum. Using LASCO data, scientistcan also for the first time reconstruct 3-Dimages <strong>of</strong> CME structures. CombinedA coronal mass ejection heading almost directly towards Earth,observed by LASCO C2. The size <strong>of</strong> the Sun is indicated by acircle, and the x-marked circle on the Sun shows the origin <strong>of</strong>the CME. Panel (a) shows the total intensity (darker meansmore intense) as imaged directly by LASCO. Panel (d) is atopographic map <strong>of</strong> the material shown in panel (a). Thedistance from the plane <strong>of</strong> the Sun to the material is colourcoded;the scale in units <strong>of</strong> solar radii is shown on the side.Panels (b) and (c) show the intensity as it would appear to anobserver positioned to the side <strong>of</strong> the Sun or directly above it,respectivelywww.esa.int esa bulletin 126 - may 2006 29