Business plans - UK Power Networks
Business plans - UK Power Networks
Business plans - UK Power Networks

Create successful ePaper yourself
Turn your PDF publications into a flip-book with our unique Google optimized e-Paper software.
l<br />
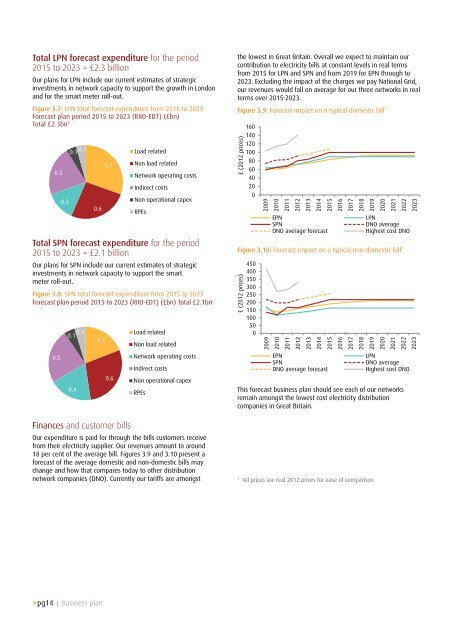
Total LPN forecast expenditure for the period<br />
2015 to 2023 = £2.3 billion<br />
Our <strong>plans</strong> for LPN include our current estimates of strategic<br />
investments in network capacity to support the growth in London<br />
and for the smart meter roll-out.<br />
Figure 3.7: LPN total forecast expenditure from 2015 to 2023<br />
Forecast plan period 2015 to 2023 (RIIO-ED1) (£bn)<br />
Total £2.3bn 5<br />
0.5<br />
0.3<br />
0.1 0.1 Load related<br />
0.6<br />
0.7<br />
Total SPN forecast expenditure for the period<br />
2015 to 2023 = £2.1 billion<br />
Our <strong>plans</strong> for SPN include our current estimates of strategic<br />
investments in network capacity to support the smart<br />
meter roll-out.<br />
Figure 3.8: SPN total forecast expenditure from 2015 to 2023<br />
Forecast plan period 2015 to 2023 (RIIO-ED1) (£bn) Total £2.1bn 5<br />
0.5<br />
Finances and customer bills<br />
Non load related<br />
Network operating costs<br />
Indirect costs<br />
Non operational capex<br />
RPEs<br />
0.1 Load related<br />
0.1<br />
0.4<br />
Non load related<br />
0.4<br />
0.6<br />
Network operating costs<br />
Indirect costs<br />
Non operational capex<br />
RPEs<br />
Our expenditure is paid for through the bills customers receive<br />
from their electricity supplier. Our revenues amount to around<br />
18 per cent of the average bill. Figures 3.9 and 3.10 present a<br />
forecast of the average domestic and non-domestic bills may<br />
change and how that compares today to other distribution<br />
network companies (DNO). Currently our tariffs are amongst<br />
the lowest in Great Britain. Overall we expect to maintain our<br />
contribution to electricity bills at constant levels in real terms<br />
from 2015 for LPN and SPN and from 2019 for EPN through to<br />
2023. Excluding the impact of the charges we pay National Grid,<br />
our revenues would fall on average for our three networks in real<br />
terms over 2015-2023.<br />
Figure 3.9: Forecast impact on a typical domestic bill 7<br />
£ (2012 prices)<br />
160<br />
140<br />
120<br />
100<br />
80<br />
60<br />
40<br />
20<br />
0<br />
2009<br />
2010<br />
2011<br />
2012<br />
2013<br />
2014<br />
2015<br />
2016<br />
2017<br />
2018<br />
2019<br />
2020<br />
2021<br />
2022<br />
2023<br />
EPN<br />
SPN<br />
DNO average forecast<br />
Figure 3.10: Forecast impact on a typical non-domestic bill 7<br />
£ (2012 prices)<br />
450<br />
400<br />
350<br />
300<br />
250<br />
200<br />
150<br />
100<br />
50<br />
0<br />
This forecast business plan should see each of our networks<br />
remain amongst the lowest cost electricity distribution<br />
companies in Great Britain.<br />
7<br />
All prices are real 2012 prices for ease of comparison<br />
LPN<br />
DNO average<br />
Highest cost DNO<br />
2009<br />
2010<br />
2011<br />
2012<br />
2013<br />
2014<br />
2015<br />
2016<br />
2017<br />
2018<br />
2019<br />
2020<br />
2021<br />
2022<br />
2023<br />
EPN<br />
SPN<br />
DNO average forecast<br />
LPN<br />
DNO average<br />
Highest cost DNO<br />
>pg14 | <strong>Business</strong> plan