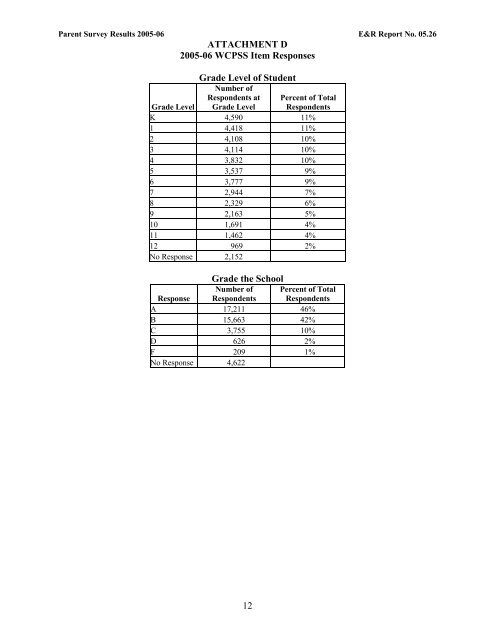
Parent Survey Results <strong>2005</strong>-<strong>06</strong> E&R Report No. 05.26 ATTACHMENT D <strong>2005</strong>-<strong>06</strong> WCPSS Item Responses Grade Level of Student Number of Grade Level Respondents at Grade Level Percent of Total Respondents K 4,590 11% 1 4,418 11% 2 4,108 10% 3 4,114 10% 4 3,832 10% 5 3,537 9% 6 3,777 9% 7 2,944 7% 8 2,329 6% 9 2,163 5% 10 1,691 4% 11 1,462 4% 12 969 2% No Response 2,152 Grade the <strong>School</strong> Response Number of Respondents Percent of Total Respondents A 17,211 46% B 15,663 42% C 3,755 10% D 626 2% F 209 1% No Response 4,622 12
Parent Survey Results <strong>2005</strong>-<strong>06</strong> E&R Report No. 05.26 ATTACHMENT D (continued) <strong>2005</strong>-<strong>06</strong> WCPSS Item Responses Strongly Agree Agree Disagree Strongly Disagree No Response Percent of Percent of Percent of Percent of Questions 2-11 Frequency Responses Frequency Responses Frequency Responses Frequency Responses Frequency My child's school is a safe place to learn. 19,603 47% 20,173 49% 1,426 3% 269 1% 615 My child's school provides a high quality educational program. 17,387 42% 21,371 52% 2,123 5% 281 1% 924 My child is given challenging work in all classes. 13,380 33% 22,250 55% 4,473 11% 491 1% 1,492 Students in my child's school are well behaved overall. 8,550 21% 25,697 64% 5,018 12% 1,082 3% 1,739 The rules of this school are fair. 15,202 37% 23,156 56% 2,159 5% 522 1% 1,047 Teachers in this school really seem to care about the students. 18,354 45% 19,882 49% 2,289 6% 444 1% 1,117 This school promotes understanding among students from various backgrounds. 14,039 35% 22,946 58% 2,236 6% 445 1% 2,420 Discipline of my child has been handled fairly at this school. 14,724 38% 21,913 56% 1,836 5% 561 1% 3,052 When I have concerns about my child, I can count on the school for support. 14,449 36% 21,546 54% 3,137 8% 696 2% 2,258 The buildings and grounds at my child's school are clean and safe. 16,847 41% 21,260 52% 2,412 6% 638 2% 929 Excellent Good Fair Poor No Response Questions 12 – 16: Percent of Percent of Percent of Percent of Rate your child’s school Frequency Responses Frequency Responses Frequency Responses Frequency Responses Frequency <strong>School</strong> Safety 18,713 45% 18,853 46% 3,233 8% 637 2% 650 Supporting student achievement 19,088 46% 18,227 44% 3,322 8% 521 1% 928 Encouraging <strong>parent</strong> involvement 19,411 47% 16,432 40% 4,522 11% 878 2% 843 Providing information to <strong>parent</strong>s 19,630 47% 16,457 40% 4,298 10% 978 2% 723 Quality of the school cafeteria's lunch service 8,298 21% 19,121 48% 9,446 24% 2,710 7% 2,511 13