parent survey results 2005-06 - Wake County Public School System
parent survey results 2005-06 - Wake County Public School System
parent survey results 2005-06 - Wake County Public School System

You also want an ePaper? Increase the reach of your titles
YUMPU automatically turns print PDFs into web optimized ePapers that Google loves.
Parent Survey Results <strong>2005</strong>-<strong>06</strong> E&R Report No. 05.26<br />
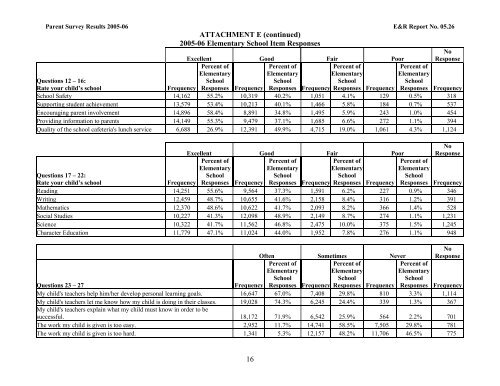
ATTACHMENT E (continued)<br />
<strong>2005</strong>-<strong>06</strong> Elementary <strong>School</strong> Item Responses<br />
Excellent Good Fair Poor<br />
Percent of<br />
Percent of<br />
Percent of<br />
Elementary<br />
Elementary<br />
Elementary<br />
<strong>School</strong><br />
<strong>School</strong><br />
<strong>School</strong><br />
Responses Frequency Responses Frequency Responses Frequency<br />
No<br />
Response<br />
Percent of<br />
Elementary<br />
<strong>School</strong><br />
Responses Frequency<br />
Questions 12 – 16:<br />
Rate your child’s school<br />
Frequency<br />
<strong>School</strong> Safety 14,162 55.2% 10,319 40.2% 1,051 4.1% 129 0.5% 318<br />
Supporting student achievement 13,579 53.4% 10,213 40.1% 1,466 5.8% 184 0.7% 537<br />
Encouraging <strong>parent</strong> involvement 14,896 58.4% 8,891 34.8% 1,495 5.9% 243 1.0% 454<br />
Providing information to <strong>parent</strong>s 14,149 55.3% 9,479 37.1% 1,685 6.6% 272 1.1% 394<br />
Quality of the school cafeteria's lunch service 6,688 26.9% 12,391 49.9% 4,715 19.0% 1,<strong>06</strong>1 4.3% 1,124<br />
Excellent Good Fair Poor<br />
No<br />
Response<br />
Percent of<br />
Elementary<br />
Percent of<br />
Elementary<br />
Percent of<br />
Elementary<br />
Percent of<br />
Elementary<br />
Questions 17 – 22:<br />
<strong>School</strong><br />
<strong>School</strong><br />
<strong>School</strong><br />
<strong>School</strong><br />
Rate your child’s school<br />
Frequency Responses Frequency Responses Frequency Responses Frequency Responses Frequency<br />
Reading 14,251 55.6% 9,564 37.3% 1,591 6.2% 227 0.9% 346<br />
Writing 12,459 48.7% 10,655 41.6% 2,158 8.4% 316 1.2% 391<br />
Mathematics 12,370 48.6% 10,622 41.7% 2,093 8.2% 366 1.4% 528<br />
Social Studies 10,227 41.3% 12,098 48.9% 2,149 8.7% 274 1.1% 1,231<br />
Science 10,322 41.7% 11,562 46.8% 2,475 10.0% 375 1.5% 1,245<br />
Character Education 11,779 47.1% 11,024 44.0% 1,952 7.8% 276 1.1% 948<br />
Often Sometimes Never<br />
No<br />
Response<br />
Percent of<br />
Elementary<br />
<strong>School</strong><br />
Percent of<br />
Elementary<br />
<strong>School</strong><br />
Percent of<br />
Elementary<br />
<strong>School</strong><br />
Questions 23 – 27<br />
Frequency Responses Frequency Responses Frequency Responses Frequency<br />
My child's teachers help him/her develop personal learning goals. 16,647 67.0% 7,408 29.8% 810 3.3% 1,114<br />
My child's teachers let me know how my child is doing in their classes. 19,028 74.3% 6,245 24.4% 339 1.3% 367<br />
My child's teachers explain what my child must know in order to be<br />
successful. 18,172 71.9% 6,542 25.9% 564 2.2% 701<br />
The work my child is given is too easy. 2,952 11.7% 14,741 58.5% 7,505 29.8% 781<br />
The work my child is given is too hard. 1,341 5.3% 12,157 48.2% 11,7<strong>06</strong> 46.5% 775<br />
16