parent survey results 2005-06 - Wake County Public School System
parent survey results 2005-06 - Wake County Public School System
parent survey results 2005-06 - Wake County Public School System

Create successful ePaper yourself
Turn your PDF publications into a flip-book with our unique Google optimized e-Paper software.
Parent Survey Results <strong>2005</strong>-<strong>06</strong> E&R Report No. 05.26<br />
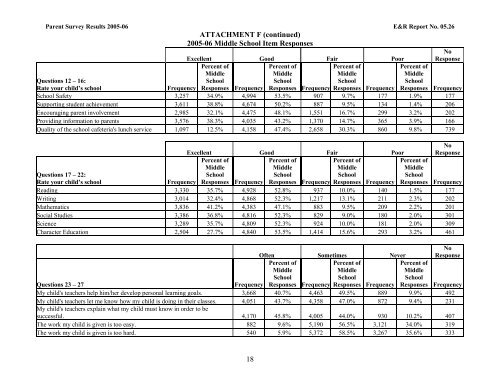
ATTACHMENT F (continued)<br />
<strong>2005</strong>-<strong>06</strong> Middle <strong>School</strong> Item Responses<br />
Excellent Good Fair Poor<br />
Percent of<br />
Percent of<br />
Percent of<br />
Middle<br />
Middle<br />
Middle<br />
<strong>School</strong><br />
<strong>School</strong><br />
<strong>School</strong><br />
Responses Frequency Responses Frequency Responses Frequency<br />
No<br />
Response<br />
Percent of<br />
Middle<br />
<strong>School</strong><br />
Responses Frequency<br />
Questions 12 – 16:<br />
Rate your child’s school<br />
Frequency<br />
<strong>School</strong> Safety 3,257 34.9% 4,994 53.5% 907 9.7% 177 1.9% 177<br />
Supporting student achievement 3,611 38.8% 4,674 50.2% 887 9.5% 134 1.4% 2<strong>06</strong><br />
Encouraging <strong>parent</strong> involvement 2,985 32.1% 4,475 48.1% 1,551 16.7% 299 3.2% 202<br />
Providing information to <strong>parent</strong>s 3,576 38.3% 4,035 43.2% 1,370 14.7% 365 3.9% 166<br />
Quality of the school cafeteria's lunch service 1,097 12.5% 4,158 47.4% 2,658 30.3% 860 9.8% 739<br />
Excellent Good Fair Poor<br />
No<br />
Response<br />
Percent of<br />
Middle<br />
Percent of<br />
Middle<br />
Percent of<br />
Middle<br />
Percent of<br />
Middle<br />
Questions 17 – 22:<br />
<strong>School</strong><br />
<strong>School</strong><br />
<strong>School</strong><br />
<strong>School</strong><br />
Rate your child’s school<br />
Frequency Responses Frequency Responses Frequency Responses Frequency Responses Frequency<br />
Reading 3,330 35.7% 4,928 52.8% 937 10.0% 140 1.5% 177<br />
Writing 3,014 32.4% 4,868 52.3% 1,217 13.1% 211 2.3% 202<br />
Mathematics 3,836 41.2% 4,383 47.1% 883 9.5% 209 2.2% 201<br />
Social Studies 3,386 36.8% 4,816 52.3% 829 9.0% 180 2.0% 301<br />
Science 3,289 35.7% 4,809 52.3% 924 10.0% 181 2.0% 309<br />
Character Education 2,504 27.7% 4,840 53.5% 1,414 15.6% 293 3.2% 461<br />
Often Sometimes Never<br />
No<br />
Response<br />
Percent of<br />
Middle<br />
<strong>School</strong><br />
Percent of<br />
Middle<br />
<strong>School</strong><br />
Percent of<br />
Middle<br />
<strong>School</strong><br />
Questions 23 – 27<br />
Frequency Responses Frequency Responses Frequency Responses Frequency<br />
My child's teachers help him/her develop personal learning goals. 3,668 40.7% 4,463 49.5% 889 9.9% 492<br />
My child's teachers let me know how my child is doing in their classes. 4,051 43.7% 4,358 47.0% 872 9.4% 231<br />
My child's teachers explain what my child must know in order to be<br />
successful. 4,170 45.8% 4,005 44.0% 930 10.2% 407<br />
The work my child is given is too easy. 882 9.6% 5,190 56.5% 3,121 34.0% 319<br />
The work my child is given is too hard. 540 5.9% 5,372 58.5% 3,267 35.6% 333<br />
18