2007-08 Adopted Plan - Wake County Public School System
2007-08 Adopted Plan - Wake County Public School System
2007-08 Adopted Plan - Wake County Public School System

Create successful ePaper yourself
Turn your PDF publications into a flip-book with our unique Google optimized e-Paper software.
Letter to <strong>County</strong> Commissioners3600 WAKE FOREST ROAD, P.O.BOX 28041RALEIGH, NORTH CAROLINA 27611-8041District 7 (West Raleigh/Morrisville)Patti Head, ChairPRHead@wcpss.netDistrict 4 (East Raleigh)Rosa Gill, Vice ChairRGill@wcpss.netDistrict 1 (Northeast <strong>Wake</strong>)Lori MillbergLMillberg@wcpss.netDistrict 2 (Southeast <strong>Wake</strong>)Horace TartHTart@wcpss.netDistrict 3 (North Raleigh)Carol ParkerCOParker@wcpss.netDistrict 5 (South Central Raleigh)Susan ParrySKParry@wcpss.netDistrict 6 (Central Raleigh)Beverley ClarkBSClark@wcpss.netDistrict 8 (Southern <strong>Wake</strong>)Ron MargiottaRMargiotta@wcpss.netDistrict 9 (Western <strong>Wake</strong>)Eleanor GoetteeEGoettee@wcpss.netApril 26, <strong>2007</strong>Dear <strong>Wake</strong> <strong>County</strong> Board of Commissioners:On behalf of the <strong>Wake</strong> <strong>County</strong> Board of Education,it is my pleasure to convey our <strong>2007</strong>-<strong>08</strong> <strong>Plan</strong> forStudent Success for your consideration. The <strong>Plan</strong> forStudent Success contains our requested operationalbudget for the <strong>2007</strong>-<strong>08</strong> school year, three-yearplanning projections, and business cases or growthcases for changes in expenditures.The mission of the <strong>Wake</strong> <strong>County</strong> <strong>Public</strong> <strong>School</strong><strong>System</strong> is to educate each student to be a responsibleand productive citizen who can effectivelymanage future challenges. To this end, the <strong>Wake</strong><strong>County</strong> Board of Education endorses and supportsSuperintendent Del Burns’ vision that alllstudentsgraduate on time, prepared for the future. In a time ofhigher standards -- whether from The No Child LeftBehind Act, the State Board of Education’s emphasison 21st Century preparedness, or our own citizens’expectations of excellence -- we must extend such avision to each individual student.<strong>Wake</strong> <strong>County</strong> citizens made a significant investmentin the capital needs of our schools last November,and a comprehensive independent curriculummanagement audit is currently underway. Therefore,our Board’s request for funding is aimed atmaintaining current levels of support for a rapidlygrowing student population. More than two-thirdsof the new local funding requested is tied directly toeither enrollment growth or state-legislated salary andbenefits. The only new program requested is an effortto make teacher and staff salaries more competitive,in an effort to improve our ability to retain and recruithigh quality teachers and staff.The <strong>Wake</strong> <strong>County</strong> Board of Education looks forwardto working with you as you balance the needs of ourcommunity and support our children as they work torealize their true potential.Sincerely,Patti Head, ChairFY <strong>2007</strong>-<strong>08</strong> <strong>Plan</strong> for Student Success
Table of ContentsINTRODUCTIONMessage from the Superintendent........................................................1Strategic Direction...................................................................1The <strong>2007</strong>-<strong>08</strong> <strong>Plan</strong> for Student Success...................................2Conclusion..............................................................................3Budget at a Glance...............................................................................4Drivers ................................................................................................. 6Trends/Events/Initiatives ..................................................................... 7Budget Process ................................................................................. 10Budget Highlights ...............................................................................11Total Budget ...........................................................................11Where do Funds Come From ................................................11Where are Funds Spent ....................................................... 12State <strong>Public</strong> <strong>School</strong> Fund ..................................................... 12<strong>County</strong> Appropriation ............................................................ 13Local Current Expense Fund ................................................ 18Federal Grants Fund ............................................................ 20Multiple Enterprise Fund ....................................................... 20Capital Outlay Fund .............................................................. 21Financial Reporting Recognition ........................................... 22Fiscal Accountability ............................................................. 23Board of Education and Administrative Leadership Team ................. 25Government Finance Offi cers Association DistinguishedBudget Presentation Award (GFOA) .............................................. 31ORGANIZATION<strong>Wake</strong> <strong>County</strong> <strong>Public</strong> <strong>School</strong> <strong>System</strong> Strategic Improvement<strong>Plan</strong> 2006-2009 .............................................................................. 33<strong>Wake</strong> <strong>County</strong> <strong>Public</strong> <strong>School</strong> <strong>System</strong> .................................... 34Administrative Services Division ........................................... 36Auxiliary Services Division .................................................... 38Communications Division ..................................................... 40Instructional Services Division .............................................. 42Technology Services Division ............................................... 48Organization Charts .......................................................................... 51<strong>Wake</strong> <strong>County</strong> <strong>Public</strong> <strong>School</strong> <strong>System</strong> .................................... 51Chief of Staff ......................................................................... 52Administrative Services ........................................................ 53Facilities and Operations ...................................................... 54Instructional Services ........................................................... 55Technology Services ............................................................. 56Communications ................................................................... 57Assignments for Area Assistant Superintendents .............................. 58Eastern ................................................................................. 59Central .................................................................................. 60Northern ................................................................................ 61South Central ........................................................................ 62Southern ............................................................................... 63Western ................................................................................ 64The Reporting Entity and Its Services ............................................... 65The <strong>School</strong> <strong>System</strong> .............................................................. 65Reporting Entity .................................................................... 66Economic Condition and Outlook ......................................... 66Budget and Financial Policies ........................................................... 68Reporting Entity .................................................................... 68<strong>Public</strong> <strong>School</strong> Financing ....................................................... 68Budget Basis ........................................................................ 68Budget Policies ..................................................................... 70Cash Management Policies and Practices ........................... 71Fund Balance ....................................................................... 71Interfund Transactions .......................................................... 71Budget Process ................................................................................. 72Operating Budget ................................................................. 72The Budget Cycle ................................................................. 72Goal 20<strong>08</strong> ............................................................................. 73Budget Guidelines ................................................................ 74Budget Process .................................................................... 75Capital Budget ...................................................................... 76Impact of Capital Improvement on the Operating Budget .... 77Citizen Involvement ........................................................................... 78What You Can Do ................................................................. 78Budget Activities During FY 2006-07 to Prepare FY <strong>2007</strong>-<strong>08</strong>Budget ............................................................................................ 79Budget Administration and Management Process ............................ 81Organization ......................................................................... 81Expenditure Control and Approvals ...................................... 81Encumbrance Control ........................................................... 81Transfers .............................................................................. 82Amendments ........................................................................ 82Funds Checking .................................................................... 82FY <strong>2007</strong>-<strong>08</strong> <strong>Plan</strong> for Student Success
Table of ContentsManagement Information and Reporting .............................. 82Quarterly Financial Reviews ................................................. 82Fraud Hotline ........................................................................ 82FINANCIALDistrict Financial Structure ................................................................ 83District Legal Authority .......................................................... 83Finance Structure ................................................................. 83Basis of Presentation – Fund Accounting ............................. 83Purpose Codes ..................................................................... 84Program Codes .................................................................... 84Object Codes ........................................................................ 84Level Codes .......................................................................... 85Cost Center Codes ............................................................... 85Debt Obligation ..................................................................... 85<strong>County</strong> Appropriation and Fund Balance History .............................. 86Fund Balance .................................................................................... 86Questions and Answers about Fund Balance ................................... 87History of Appropriated Fund Balance .................................. 88History of Undesignated (not appropriated) Fund Balance .. 88Budget Resolution ............................................................................. 89Budgetary Assumptions for Anticipated Revenue ............................. 93Anticipated Revenues ....................................................................... 94State <strong>Public</strong> <strong>School</strong> Fund ..................................................... 94Local Current Expense Fund ................................................ 97Federal Programs Fund ...................................................... 102Capital Outlay Fund ............................................................ 106Multiple Enterprise Fund ..................................................... 107All Funds ............................................................................. 1<strong>08</strong>Budget by Object Code – Operating Budget ................................... 109Staff Allotments .................................................................................116Months of Employment ........................................................116Allotment Process ................................................................116Flexibility ..............................................................................117Conversions .........................................................................117Effi cient and Effective Use of Resources ............................117Staff Budget ......................................................................................118Analysis of Increase (Decrease) in Months of Employment ............ 121Uniform Format ................................................................................ 128Uniform Budget Format ...................................................... 128Summary of Revenues and Expenditures .......................... 130Revenues from State & Federal Sources ........................... 132Capital Outlay ..................................................................... 134Statement of Revenues, Expenditures, and Changes in FundBalance ......................................................................................... 135Blueprint for Excellence 2006 Capital Improvement <strong>Plan</strong> ............... 136What Will the Capital <strong>Plan</strong> Provide ..................................... 136GROWTH REQUESTSClassroom Teacher ......................................................................... 139Teacher Assisants .......................................................................... 140Assistant Principals ......................................................................... 142<strong>School</strong>-Based Clerical Allotment ..................................................... 144Classroom Materials, Instructional Supplies and Equipment .......... 146Principals ......................................................................................... 147Textbooks for Elementary, Middle, and High <strong>School</strong>s ..................... 148Sick Leave Substitute Pay for Noncategorical State and LocalTeachers ...................................................................................... 149Teacher Assistants as Substitutes (Regular Education) .................. 150Contracted Services for <strong>School</strong>s ..................................................... 151Staff Development for Elementary, Middle, and High <strong>School</strong>s ........ 152Travel for Elementary, Middle, and High <strong>School</strong>s ............................ 153Instrument Repair ............................................................................ 154Early hires, purchased services, and staff development for newschools ......................................................................................... 155Eastern Area <strong>School</strong>s ...................................................................... 158South Central Area <strong>School</strong>s ............................................................ 160Southern Area <strong>School</strong>s ................................................................... 162Western Area <strong>School</strong>s .................................................................... 164Ninth Grade Centers ....................................................................... 166Graduation and Rehearsal Facilities ............................................... 167Student Due Process and Policy ..................................................... 168Career-Technical Education Months ............................................... 170K-5 Curriculum and Instruction Months ........................................... 171Academically Gifted Teacher Months .............................................. 172Media Specialists Months ................................................................ 173English as a Second Language Teacher Months of Employment...174Advancement Via Individual Determination (AVID) ......................... 175Local Literacy Teachers to support K-2 Intervention andCoaching ...................................................................................... 176
Table of ContentsIn-<strong>School</strong> Suspension Teacher Months of Employment .................. 177Online resources for new schools ................................................... 178Swimming Pool Rental for Heritage High <strong>School</strong> ............................ 179Minimum Competency Teacher Months of Employment ................. 180NovaNet Teacher Months of Employment ....................................... 181Costs to Administer Tests, Test Coordinator Travel, and SeasonalOvertime in Testing Offi ce ............................................................. 182Special Education Teachers ............................................................ 183Special Education Teacher Assistants, Transition TrainingFacilitators ..................................................................................... 185Counselors ...................................................................................... 187Speech Therapists ........................................................................... 189Psychologists .................................................................................. 190Social Workers ................................................................................ 191Accelerated Learning Program ........................................................ 192Occupational Therapists .................................................................. 193Challenged <strong>School</strong>s Program .......................................................... 194Physical Therapists ......................................................................... 195Transitional Counselors ................................................................... 196Audiologists ..................................................................................... 197High <strong>School</strong> Intervention Coordinators ............................................ 198Extra Duty Budget for New <strong>School</strong>s ................................................ 199Human Resources Personnel ......................................................... 201Courier ............................................................................................. 202Criminal Records Check ................................................................. 203Occupational Safety and Health Administration (OSHA) Nurse ...... 205Senior Budget Analyst ..................................................................... 206Benefi ts Technician .......................................................................... 207Payroll Technicians .......................................................................... 2<strong>08</strong>Director of Communications ............................................................ 209Communications Department Advertising ....................................... 210Child Nutrition Services ....................................................................211Utility budget for new square feet .................................................... 213Custodial dollars for new square feet .............................................. 215Maintenance dollars for new square feet ........................................ 216Maintenance dollars for landscape of new acreage ........................ 217Processing Technician ..................................................................... 218Integrated Pest Management .......................................................... 219Bus Drivers ...................................................................................... 222Exceptional Children Pupil Contract Transportation ........................ 224Bus Driver Substitutes ..................................................................... 225Oil, Fuel, Tires, and Bus Parts and Supplies ................................... 226Activity Buses .................................................................................. 228Bus Safety Assistants ...................................................................... 229Bus Mechnics .................................................................................. 230Salary differential increase for bus drivers, full-time bus driversubstitutes, and bus driver leads .................................................. 231Transportation District at Knightdale ............................................... 232Fuel Truck ........................................................................................ 233Exceptional Children contract transportation in cars andbuses for PreK Children ............................................................... 234Service Trucks to meet North Carolina State Boardrecommended ratio ...................................................................... 235Staff Development for bus drivers, bus substitutes andbus safety assistants .................................................................... 236Exceptional Children parent contract transportation for PreKchildren ......................................................................................... 237Perfect Attendance Incentive for Transportation DepartmentPersonnel ..................................................................................... 238Parent Contracts for Exceptional Children Transportation .............. 239<strong>School</strong> Buses .................................................................................. 240Charter <strong>School</strong>s ............................................................................... 241Intersession teachers and teacher assistants for new year-roundelementary schools ...................................................................... 244<strong>School</strong> Resource Offi cer ................................................................. 245Board of Education Workshop Expenses/Allowable Travel ............. 246Substitutes for 12 MOE staff for planning days at Year-Round<strong>School</strong>s .......................................................................................... 247Internal Audit ................................................................................... 248<strong>School</strong> Technology Fund ................................................................. 249SYSTEMWIDE ISSUESFiscal Accountability ........................................................................ 251Insurance ............................................................................ 251Fuel Management <strong>System</strong> (FMS) ...................................... 253Operations Staff for Contract Cars and Buses forExceptional Programs ...................................................... 254Real-time inventory for Parts Department .......................... 255Bookkeeping staff for the Transportation Department ........ 256Rate Increase .................................................................................. 257FY <strong>2007</strong>-<strong>08</strong> <strong>Plan</strong> for Student Success
Table of ContentsSwimming Pool Rental Rate Increase for High <strong>School</strong>s ..... 257Utility Rate Increase ........................................................... 258Facility Leases ................................................................................. 260Cost of existing and future mobile units ............................. 260Leases - Real Estate Services ........................................... 261Safety and Security ......................................................................... 263Transfer Security functions to Maintenance andOperations ........................................................................ 263Safety/Recruitment Offi cer for Transportation ................... 264New Computer and Diagnostic Software forMechanics ..................................................................... 265Fixed Asset Replacement and Capital Budget ................................ 266Replace of liquifi ed propane (LP) forklift ............................. 266Annual replacement of support vehicles ............................. 267Grounds equipment replacement ....................................... 269Activity Bus Service Trucks (Local Trucks) ......................... 270Forklift Replacement .......................................................... 271Capital Budget .................................................................... 272COMMITMENTS BY THE BOARD OF EDUCATION TO PROGRAMSFOR FUTURE FUNDINGTraditional to Year-Round Conversion ........................................... ..275Local Literacy Months ......................................................... 275Media Specialist Months ..................................................... 276In-<strong>School</strong> Suspension Teacher Months of Employment ..... 277Social Worker Months ........................................................ 278Psychologist Months ........................................................... 279Counselor Months .............................................................. 280Salary Increases for Year-Round Conversions .................. 281Additional month of employment for 11-month AssistantPrincipals ..................................................................... 282Utility Budget Increase ........................................................ 283Maintenance Dollars ........................................................... 284Custodial Dollars ................................................................ 285Intersession Teachers and Teacher Assistants ................... 286Substitutes for 12-month staff for planning days ................ 287East <strong>Wake</strong> High Whole <strong>School</strong> Conversion .................................... 288Extra Duty Pay - High <strong>School</strong> Band and Strings Teachers 293NEW PROGRAMS AND INCREASES TO EXISTING PROGRAMSNoncertifed Salaries ........................................................................ 295Salary Schedules - 12-month Noncertifi ed Employees ................... 297English as a Second Language Teachers ....................................... 299<strong>School</strong> Psychologist for Academically Gifted Program .................... 300Lacrosse Coaches for High <strong>School</strong>s ............................................... 301High Lift ........................................................................................... 302Custodial Focus Team for regional Custodial Services ................... 303Craftsman, Multi-Task Employees, and Master CraftsmanPlumbers ...................................................................................... 306Heating, Ventilation, and Air Conditioning (HVAC) fi lter upgradeto support Indoor Air Quality (IAQ) improvements ....................... 307Asphalt replacement ....................................................................... 3<strong>08</strong>Rubber Track Surfaces .................................................................... 309Indoor Air Quality ............................................................................. 310Magnetic Ballast in Florescent Lighting ............................................311SAVINGSSavings ............................................................................................ 313Budget Reductions .......................................................................... 314Middle <strong>School</strong> Resource Offi cers ....................................... 314Balance in Over/Under ....................................................... 315Facilities <strong>Plan</strong>ning and Construction ................................. 316Summer Testing and Review .............................................. 317Reduction of the Summer Help for the Bus Garage ........... 318Eliminate Payment for New Bus Drivers for InitialTraining ............................................................................. 319Shift Local Costs to State Resources .............................................. 320Technology ......................................................................... 320One-Time Costs from 2006-07 ........................................................ 321Technology ......................................................................... 321One-time allotments to schools for leave, class sizeand scheduling issues ...................................................... 322Tenth-Day Overages ........................................................... 324Capital Outlay ..................................................................... 325Salary Audit ........................................................................ 326Special Project - Credit Checking Contract ...................... 327One-time allotment to central services for leave situation .. 328Security ............................................................................... 329Internal Audit ....................................................................... 330
Table of ContentsGrants Ending ................................................................................. 331Smaller Learning Communities Grant ............................... 331Educational Technology Grant ............................................ 333Title V Innovative Education Learning Strategies ............... 334ESEA Title I <strong>School</strong> Improvement ....................................... 335Project Enlightenment Legislative Appropriation ................ 336INFORMATIONMembership Trends ......................................................................... 337Historical and Projected Enrollment 1996-2016 ................. 338Membership Growth FY 2001-20<strong>08</strong> ................................... 338Budgetary Assumptions ................................................................... 339State Sources ..................................................................... 339Local Sources ..................................................................... 339Federal Sources ................................................................. 339Enterprise Funds ................................................................ 339Enrollment .......................................................................... 339Salary Increases ................................................................. 340Fringe Benefi ts ................................................................... 340State and Local Allotment Formulas ................................... 341Federal Grant Descriptions ................................................. 352Federal Allotment Formulas ................................................ 354Budget Flexibility with State Allotments .............................. 356ABC Financial Flexibility ..................................................... 357Student Achievement ...................................................................... 358Changes in Standards ..................................................................... 361Historical Comparison of Revenues and Expenditures ................... 363Revenue by Source History-Operating Budget ............................... 365Budget by Object Code History- Operating Budget ......................... 366Staff History ..................................................................................... 371Historical Comparison of Expenditures Per Pupil(excluding child nutrition) ............................................................... 374Tax Data .......................................................................................... 377Counties with the Largest <strong>School</strong> Districts in NorthCarolina ............................................................................ 377Counties in North Carolina that Surround <strong>Wake</strong> <strong>County</strong> .... 377Historical Comparison of Assessed Value of TaxableProperty ............................................................................ 377Historical Comparison of Property Tax Levies andCollections ........................................................................ 378Historical Comparison of Property Tax Rates – AllOverlapping Governments ................................................ 379Ten Principal Taxpayers for <strong>Wake</strong> <strong>County</strong> .......................... 380Bonded Debt ....................................................................... 380<strong>Wake</strong> <strong>County</strong> Demographics ........................................................... 381Population ........................................................................... 381Households ......................................................................... 382Income and Poverty ............................................................ 382Housing and Housing Characteristics ................................ 382Employment ........................................................................ 383Education ............................................................................ 384Transportation .................................................................... 384GLOSSARYGlossary .......................................................................................... 387INDEXIndex ................................................................................................ 413Budget Department StaffTerri Kimzey Senior Director tkimzey@wcpss.netMeg Farris Senior Administrator mfarris@wcpss.netRegina Dobbins Senior Budget Analyst rdobbins@wcpss.netLynne Hinton Senior Budget Analyst lfhinton@wcpss.netCherie Wiggs Senior Budget Analyst cwiggs@wcpss.netWinter Todd Dissemination Specialist wtodd@wcpss.netKristie Weber Budget Specialist kweber2@wcpss.netEugenia Johnson Part-time Hourly ebjohnson2@wcpss.netVisit Our Home Page:http://www.wcpss.netFY <strong>2007</strong>-<strong>08</strong> <strong>Plan</strong> for Student Success
Message from the Superintendentcentral services employees. We are also providing expanded leadershiptraining at all levels in order to ensure that our employees are led bysupportive administrators and continue their development as membersof professional learning communities.(3) Developing and implementing systems and structures to supportschools, ensure accountability, and engage the community: Whileadditional resources are necessary to support our growing studentpopulation, they are only part of the answer. Since July 1, a number ofsteps have been taken to make WCPSS’s organizational structure morestreamlined and effective. Ten percent of the former senior leadershippositions were eliminated, including that of the deputy superintendent.Former area assistant superintendent positions were redefi ned as areasuperintendents with repurposed resources and accountability for schoolimprovement planning in each of our 147 schools.Long range planning for growth is being increased, including the use ofdata and methodology provided by the Operations Research/EducationLaboratory at North Carolina State University for determining the locationof future schools. We are also strengthening our community engagementby bringing together teacher, parent, principal and support staff advisorycouncils for regular unifi ed summits.(4) Expanding fiscal accountability: WCPSS and the <strong>Wake</strong> <strong>County</strong>Board of Education have taken a number of affi rmative steps to increasethe transparency and oversight of our fi nancial management. A ChiefBusiness Offi cer with MBA and CPA credentials along with more than 24years of for-profi t business experience has been hired and is assessingbusiness practices from a non-educator’s perspective. As recommendedby Summerford Accountancy following their fraud vulnerabilityassessment, WCPSS is currently conducting an internal risk assessment.Budget managers’ certifi cation requirements are under review as well.Signifi cantly, the <strong>Wake</strong> <strong>County</strong> Board of Education has established NorthCarolina’s fi rst independent Audit Committee to review the fi ndings ofexternal audits, similar to Sarbanes-Oxley requirements for publicly heldcorporations.THE <strong>2007</strong>-<strong>08</strong> PLAN FOR STUDENT SUCCESSWCPSS’s primary budget document is the <strong>Plan</strong> for Student Success. Itcontains a detailed budget for FY<strong>2007</strong>-<strong>08</strong>, including detailed businesscases for new or expansion items, and a further three-year strategicplan. The initial plan is developed by the superintendent and staff andsubmitted to the <strong>Wake</strong> <strong>County</strong> Board of Education. Once approved, theboard presents the plan to the <strong>Wake</strong> <strong>County</strong> Board of Commissioners,requesting the local funding needed to support it.As in the 2006-07 <strong>Plan</strong> for Student Success, this year’s plan is narrowlyfocused on responding to <strong>Wake</strong> <strong>County</strong>’s student enrollment growth,with a projected net gain of 8,000 students on the 20th day of classes.To respond, WCPSS opens seven new schools in <strong>2007</strong>: North ForestPines Drive, East Garner, and Sanford Creek elementary schools; EastCary and the “M5” Wendell middle schools; and the East <strong>Wake</strong> schoolsof Engineering <strong>System</strong>s and Arts, Education and Global Studies. (Thislast development completes East <strong>Wake</strong> High’s transition into a campusof four smaller schools with distinctive programs.) Three schools givenan “early start” on modular campuses move into their permanentfacilities: Forest Pines Drive, Holly Grove, and <strong>Wake</strong>lon elementaries.Three additional ninth grade centers will come into operation to provideadditional space for students while aiding students’ transition into highschool. Nineteen elementary and three middle schools will also transitionto multi-track year-round calendars in order to serve more students inexisting facilities.Opening new schools and expanding use of the year-round calendarrequires increased operational funding for the school system, includingapproximately $3.2 million in recurring expenses associated with thetransition of 22 schools to a multi-track year-round calendar in accordancewith the Capital Improvement <strong>Plan</strong> jointly adopted by the <strong>Wake</strong> <strong>County</strong>Board of Education and <strong>Wake</strong> <strong>County</strong> Board of Commissioners in 2006.The primary operational expense driven by enrollment growth lies inpersonnel. Approximately 82 percent of WCPSS’s total funding paysfor employee salaries and benefi ts, and approximately 95 percent ofWCPSS’s positions are school based. Regardless of where they arelocated, a projected 8,000-student increase requires additional teachers,teacher assistants, child nutrition specialists, bus drivers, and other staffto support them.2
Message from the SuperintendentAdditional funding is requested for improving certifi ed, non-certifi ed, andextra-duty compensation supporting Strategic Directive 2, “Retaining,recruiting and training high quality employees,” and for other adjustmentsrequested due to infl ation and commitments by the <strong>Wake</strong> <strong>County</strong> Boardof Education. Requests for funding new initiatives are sharply limitedfor two reasons. First, it is recognized that <strong>Wake</strong> <strong>County</strong> citizens madea signifi cant investment in the school system’s infrastructure throughthe November 2006 bond referendum. Second, the results of thecomprehensive independent curriculum management audit are not yetknown and may prompt other changes in WCPSS’s academic program.CONCLUSIONThe <strong>Wake</strong> <strong>County</strong> <strong>Public</strong> <strong>School</strong> <strong>System</strong> has a long and proud history ofcourageous choices made by the Board of Education, by strong leadersin our community and by administration. We are privileged to stand onthe shoulders of giants -- providing a vantage point to see how muchmore work is needed to extend academic success to all of our students.We are proud of our students’ current accomplishments and our schoolsystem’s current performance, but we are not content with a grade “onthe curve.”Instead, we choose to hold to the vision and redouble our efforts onbehalf of all of <strong>Wake</strong> <strong>County</strong>’s students.Respectfully Submitted,Del Burns, Ed.D.Superintendent3 FY <strong>2007</strong>-<strong>08</strong> <strong>Plan</strong> for Student Success
Budget at a GlanceDaily Operations $1,152,914,876Plus Capital Outlay (Mobile Units, Furniture,Vehicles)$3,929,301Equals Operating Budget $1,156,844,177Plus Building Program $632,903,517Equals total Budget $1,789,747,694This sheet summarizes theOperating Budget.Provided by taxpayer approved bonds.Where do Funds Come From?Federal7%State Sources 60% $699.3 million The state budget pays for:State <strong>Public</strong> <strong>School</strong> Fund & Grants• Position/Months of Employment Allotments• Dollar Allotments• Unbudgeted Categories (State coversactual expenditures but does not allot aspecifi c dollar amount for the following categories:longevity, annual leave, disability,recruitment/retention bonuses in specifi csubject areas)• Textbooks• Grants88,460 Teacher/Librarian/Counselor months23,255 Teacher Assistant months9,648 Transportation months6,353 Clerical months6,126 Custodial months3,687 <strong>School</strong>-based Administrator months1,604 Psychologist/Social Worker months1,<strong>08</strong>8 Technical months590 Other Professional months574 Central Offi ce Administrator months$20 million Purchased Services$19 million Supplies and Materials, TextbooksLocal Sources 33% $381.7 million The local budget pays for:Noncategorical (Most fl exible sources)• <strong>County</strong> Appropriation• Fund Balance Appropriation• Indirect Cost (charged to Enterpriseactivities for building use, utilities, maintenance,etc.)• Fines and Forfeitures• Investment Fund Interest• E Rate• Tuition and Parking Fees• Cellular LeaseUnused funds roll to fund balance. <strong>County</strong>appropriation is received 1/12 each month.Enterprise Funds (supported by outsidefees)• Child Nutrition• Tuition Programs (Before/After <strong>School</strong>;Summer Camp; Preschool)• Community <strong>School</strong>sBuilding Program ManagementLocal Grants/Local Contracts/Donations$300.7 m$19.0 m$5.5 m$3.7 m$2.5 m$1.5 m$1.0 m$0.1 m$26.0 m$7.1 m$6.1 m$6.4 m$2.1 mLocal salary supplement for all teachers & schoolbasedadministrators8,198 Teacher/Librarian/Counselor months8,136 Child Nutrition months5,940 Clerical months2,963 Transportation months2,691 Central Offi ce Administrator months1,860 Crafts/Trades months1,706 Technical months1,315 <strong>School</strong>-based Administrator months1,211 Teacher Assistant months1,165 Other Professional months804 Managers264 Warehouseman/Courier/Driver months35 Psychologist/Social Worker months6 Custodial months$67 million Purchased Services$29 million Utilities$31 million Supplies and Materials$ 6 million Capital Outlay (Mobile Units, Equipment, and Vehicles)$10 million Transfer to Charter <strong>School</strong>sLocal33%Where are Funds Spent?7%2% 1% 1%1%88%<strong>School</strong>s (people, supplies, training) $1,014,670,268 - 88%Auxiliary Services $83,245,222 - 7%Instructional Services $17,916,592 - 2%Technology $15,951,907 - 1%Business Services $13,894,286 - 1%State60%Chief of Staff $4,538,481, Communications $4,317,296, Area Superintendents$1,307,074, Board of Education $1,003,051 - 1%4
Budget at a GlanceFederal Sources 7% $75.8 million The federal budget pays for:Federal Grants• Routed through NC Dept. of <strong>Public</strong> Instr.• DirectCommodities (turkey, beef, cheese)MedicaidROTC$55.6 m$1.3 m$17.4 m$1.3 m$0.2 m5,258 Teacher months1,949 Teacher Assistant months524 Other Professional months97 Clerical months60 Central Offi ce Administrator months28 Psychologist/Social Worker months23 Technical months$20 million Supplies and Materials$9 million Purchased ServicesFederal grants support programs for students withspecial needs, remediation programs, magnetprograms, class size reduction, etc.OperatingBudgetStudentMembershipPer PupilBudgetState $699,263,727 136,<strong>08</strong>6 $5,138<strong>County</strong> Appropriation $300,744,100 140,780 $2,136Federal $75,814,184 136,<strong>08</strong>6 $ 557Subtotal of Tax $ $1,075,822,011 $7,831Fines and Forfeitures $3,775,000 140,780 $27Other Local $38,049,910 136,<strong>08</strong>6 $280Enterprise $39,197,256 136,<strong>08</strong>6 $288Total $1,156,844,177 $8,426<strong>County</strong> appropriation for charter schools fl ows through local schooldistricts. Therefore this student count includes charter students.Beginning in 2003-04, fi nes and forfeitures must be paid on a proratabasis to charter schools. State funds fl ow directly to charterschools from NC Department of <strong>Public</strong> Instruction.5 FY <strong>2007</strong>-<strong>08</strong> <strong>Plan</strong> for Student Success
DriversThe changes in funding included in the <strong>Plan</strong> for Student Success are driven by several key elements. The elements and the cost impact on thelocal budget in <strong>2007</strong>-<strong>08</strong> are summarized in this chart.Salary and Benefit Issues (estimates; actual changes will bedetermined by the General Assembly) $9.6 millionSalary increases(average increases; actualraises could be higher orlower based on grade/step)Employer matchinghospitalization costs7% certifi ed staff, principals, assistant principals3% noncertifi ed staff and central offi ce administrators0.5% central services administrator performance pay5% increase$3,854 to $4,047Growth $16.3 million3 YR Elementary <strong>School</strong>s1 YR Middle <strong>School</strong>1 Traditional Middle <strong>School</strong>2 Additional High <strong>School</strong>s on East <strong>Wake</strong> CampusFacility LeasesReal estate service leases, new units and relocation of mobile unitsSafety and SecuritySecurity functions to maintenance and operations, computer and diagnostic softwarefor mechanics, and transportation safety/recruitment offi cerFixed Asset ReplacementLiquifi ed propane forklift, support vehicles, grounds equipment, capital budget, activityservice trucks, and forkliftBoard of Education Commitment $3.6 millionIncremental costs of conversion of 19 elementary and 3 middle schools from traditionalto year-round calendarNew <strong>School</strong>sAdditional StudentsIncreases in special studentpopulationsSquare Footage IncreasesAcreage (landscaping)East Garner YR ElemNorth Forest Pines YR ElemSanford Creek YR ElemEast Cary YR MiddleWendell MiddleEast <strong>Wake</strong> <strong>School</strong> of Engineering <strong>System</strong>sEast <strong>Wake</strong> <strong>School</strong> of Arts, Education, and GlobalStudies8,014 increase or 6.3% WCPSS390 increase or 9% Charter <strong>School</strong>sSpecial Education, LEP, AG929,770 additional SF (custodial, utilities,maintenance)86 additional acres1,986,579 square feet converted from traditional to year-round calendarEast <strong>Wake</strong> High <strong>School</strong> Whole <strong>School</strong> ConversionAdditional extra duty payments for high school band and strings teachersNew Programs and Increases to Existing Programs $2.7 millionSalary increases for employeesSavings ($4.6 million)Budget ReductionsShift local costs to state budgetRemove one-time costs from 2006-07Expenditure Increases $30.5 millionTransportation issues Additional staffi ng and mileageAdjusting central services departments that have hit a critical mass due to growthCommunications, Courier, and Human ResourcesStartup dollars for new schools<strong>System</strong>wide $2.9 millionFiscal AccountabilityInsurance, bookkeeping staff for transportation, real-time inventory for partsdepartment, fuel management system, operations staff for contract carsand buses for exceptional programsRate IncreasesUtilities, swimming pool rentalRevenue Adjustments (other than county appropriation) $1.3 millionAdjusting revenues based on historical actual data and projected activity for the future:Interest Red Light Camera FinesFines and forfeitures TuitionIndirect CostFund Balance Appropriation Increase as of July 1 $4.3 millionAdditional dollars funded by <strong>Wake</strong> <strong>County</strong> $24.9 million6
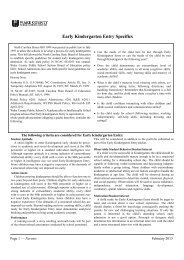
Trends/Events/InitiativesTrends/Events/Initiatives<strong>Wake</strong> <strong>County</strong> is consistently rated as one of the best places tolive, work, and raise a family in America as indicated in variouspublications and polls. Expansion Management ranked <strong>Wake</strong><strong>County</strong> as having a 5-Star Quality of Life in the May/June 2006edition and the 2nd Best <strong>Public</strong> <strong>School</strong> Education <strong>System</strong> in theApril 2005 edition. This area offers a combination of business andindustry, higher education, historic preservation, arts and culture, andrecreation and leisure services that provides a quality lifestyle for many<strong>Wake</strong> <strong>County</strong> residents, whether they prefer rural or urban settings.<strong>Wake</strong> <strong>County</strong> is the second most populous <strong>County</strong> in North Carolina.The <strong>County</strong> consists of 12 municipalities and includes Raleigh, thecounty seat and state capital. A unique mix of urban and rural townsdistinguishes <strong>Wake</strong> <strong>County</strong> from other counties and provides somethingfor every lifestyle.This continuous infl ux of newcomers into <strong>Wake</strong> <strong>County</strong> has resulted inthe county’s population growing from 517,000 residents in 1995 to aprojected number of 774,326 as of March, 2006. As the county’s populationcontinues to grow, so does the student population enrolled in the <strong>Wake</strong><strong>County</strong> <strong>Public</strong> <strong>School</strong> <strong>System</strong>.<strong>Wake</strong> <strong>County</strong>Population Growth Projections1,200,0001,000,00<strong>08</strong>00,000600,000400,000300,000250,000200,000150,000100,00050,0000WCPSSStudent Population Projections1985-861988-891991-921994-951997-982000-012003-042006-072009-102012-132015-162018-192021-222024-25This year, the school system experienced the largest growth inits history with the addition of 7,568 students, putting the studentpopulation at 128,072 students.A report by DeJONG, in collaboration with <strong>Wake</strong> <strong>County</strong> Government andWCPSS put student population at 210,941 students by the year 2016.With the student population expected to grow by more than 80,000 overthe next 10 years, <strong>Wake</strong> <strong>County</strong> will need approximately 90 new schools.Within the next two years, WCPSS’ enrollment will be roughly 20 timesthe number of students in an average United States school district.<strong>Wake</strong> <strong>County</strong> will soon have more than 150,000.The relocation of people from other parts of the country and the worldto <strong>Wake</strong> <strong>County</strong> brings new educational expectations and standardsfor district performance. Managing the demand for school facilities andservices created by growth, while meeting high educational expectations,continues to be both a challenge and an opportunity.200,00001980 1990 2000 2010 2020For over ten years, the system has compared its performance on selectedmeasures with other school systems as well as to state and nationalnorms. Charter, private, parochial/church schools, and an increasingnumber of families who choose to home school their children also serve7 FY <strong>2007</strong>-<strong>08</strong> <strong>Plan</strong> for Student Success
Trends/Events/Initiativesstudents in <strong>Wake</strong> <strong>County</strong>.The SAT is a national examination offered through the College Board.The exam is designed to assess a student’s potential for success atthe college level and is required for admission to many colleges anduniversities. SAT scores for 2006 WCPSS seniors averaged 1066, lowerthan the average for 2005, but still above the averages for seniors in NorthCarolina and in the nation. Since 1990, WCPSS students’ combinedverbal and quantitative scores have increased 67 points, exceedingNorth Carolina’s increase of 60, and the national increase of 20 points.The national average SAT score in 2005-06 was 1021 and the averagescore in North Carolina was 10<strong>08</strong>.11001<strong>08</strong>01060WCPSS2005 End-of-Grade Test ResultsPercentage at or above Grade LevelGrade 3 Grade 4 Grade 5 Grade 6 Grade 7 Grade 8Reading 87.7 89.5 91.8 88.0 90.7 91.0Math 77.0 75.1 72.8 73.1 72.6 71.8Source: http://disag.ncpublicschools.org/2006/The ABCs of <strong>Public</strong> Education is a statewide accountability model thatmeasures growth in student achievement from one year to the next inindividual schools as well as the percentage of students at or abovegrade level. A total of 138 WCPSS schools participated in the stateABCs program. The percentage of WCPSS schools meeting either HighGrowth or Expected Growth standards decreased from 86 percent in2004-05 to 80 percent in 2005-06. None of the schools were rated as lowperforming.It should be remembered that the State Board of Educationadopted new methods for measuring growth in 2005-06, which accountsfor some of the decline in schools identifi ed as “high growth” schools.1040ABCs of <strong>Public</strong> Education <strong>School</strong>s' Academic Growth 1997-20061020USA100%1000980NC90%80%70%9601997 1998 1999 2000 2001 2002 2003 2004 2005 2006WCPSS 1047 1052 1059 1061 1054 1067 1067 1063 1075 1066USA 1016 1017 1016 1019 1020 1020 1026 1026 1028 1021NC 978 982 986 988 992 998 1001 1006 1010 10<strong>08</strong>Percentage of WCPSS60%50%40%The EOG test score composite percentage, which includes reading andmath scores for all grades 3-8 students who took an EOG exam, declinedfrom 90.8 in 2004-05 to 81.8 percent in 2006. This decline is almostentirely attributable to the new cut-scores in mathematics set by theState Board of Education. There was no decline in percent of studentsat/above grade level in reading.30%20%10%0%1997 1998 1999 2000 2001 2002 2003 2004 2005 2006Less Than Expected Growth Expected Growth High Growth8
Trends/Events/InitiativesTen schools were named Honor <strong>School</strong>s of Excellence, while elevenschools were named by the North Carolina Department of <strong>Public</strong>Instruction (NCDPI) as <strong>School</strong>s of Excellence, and 48 schools werenamed <strong>School</strong>s of Distinction. Honor <strong>School</strong>s of Excellence have90 percent or more of students tested at or above grade level, meetboth expected or high growth for the year and the Adequate YearlyProgress goals of the federal No Child Left Behind Program. <strong>School</strong>s ofExcellence have 90% of students at/above grade level and meet at leasttheir expected growth goals. <strong>School</strong>s of Distinction have at least 80% ofstudents at/above grade level and also meet at least the expected growthtarget. Of the county’s eleven schools with a performance compositeabove 90 percent, eight met High Growth.The district’s 2005-2009 Technology <strong>Plan</strong> has been approved by theState Board of Education. Like the previous plan, the new plan isdesigned to advance student achievement, teacher effectiveness, andcommunications. A technology plan is a collaborative effort of districtadministrators, board members, business and community leaders, andteachers who share the vision that technology is a tool to enhancelearning, not a replacement for academic endeavor. The vision calls forongoing comprehensive staff development opportunities for teachers andadministrative personnel; maintaining a proper networking infrastructure(both voice and data) that will connect classrooms and administrativepersonnel to each other and to the Internet; and providing the needed“tools” in the way of hardware, software, and an e-mail messaging service.Despite the recognized need for updating the computers in use indistrict schools, there is no funding request for that purpose in thisplan for student success. The Fall 2006 bond includes funding tobegin implementation of a five-year PC Refresh program for districtschools.to graduate technology literate students who are armed with the 21stCentury skills needed to succeed in the global information economy,whether the path leads to higher education or the world of work.WCPSS is strengthening partnerships and building new alliances.The <strong>Wake</strong> Education Partnership (WEP) has taken a signifi cant leadershiprole in galvanizing community support. Other alliances, such as theBusiness Education Leadership Council (BELC), are also increasingtheir involvement. The district is working closely with the <strong>Wake</strong> <strong>County</strong>Department of Human Services and other community groups to betteralign options and opportunities for students.Magnet schools offer choice in WCPSS. The Board, in collaborationwith the Office of Magnet <strong>School</strong>s, is currently engaged in a review ofthe criteria for magnet schools. The magnet programs will begin anothercontinuous improvement cycle to revamp program models, explore newprogram themes, and create new ways of communication to increasestudent and parent interest in particular magnet schools. Maintaining themagnet schools’ attractiveness is critical to the roles that magnets playin our district.Year-round schools. In response to the tremendous growth that <strong>Wake</strong><strong>County</strong> has been experiencing, the Board of Education members decidedto convert nineteen elementary schools and three middle schools to amulti-track year-round calendar for the <strong>2007</strong>-<strong>08</strong> school year. In addition,four new schools opening in <strong>2007</strong>-<strong>08</strong> will operate on a multi-track yearroundcalendar bringing the total number of multi-track year-roundschools to forty-six.E-mail is provided to all faculty and staff and a majority of students atthe secondary level. Elementary students are granted access to e-mailwhen requested for instructional purposes. The district manages bothan Internet and Intranet site. The Internet site (www.wcpss.net) canbe accessed by anyone on the World Wide Web and provides a districtprofi le as well as pertinent information on past, present, and futureevents. The Intranet site (www2.wcpss.net) is accessible from withinthe district’s network and is fi lled with valuable information for internalstaff. All technology initiatives being utilized should enable the district9 FY <strong>2007</strong>-<strong>08</strong> <strong>Plan</strong> for Student Success
Budget ProcessBudget ProcessBudget development is a year-round process, beginning in the fall andculminating with the adoption of the budget resolution in June by the <strong>Wake</strong><strong>County</strong> Board of Education. Participation in the process of developmentincludes input from schools and central services departments, as wellas other stakeholders. The process of budget development has beenfocused by our efforts to have 95 percent of students at or above gradelevel.The superintendent’s strategy team develops the <strong>Plan</strong> for StudentSuccess to be delivered to the board of education. Following review, apublic hearing, and action, the board approves a <strong>Plan</strong> for Student Successto be delivered to the <strong>Wake</strong> <strong>County</strong> Board of Commissioners by May 15.The budget is adopted following action by the board of commissioners.Several drivers played an important role in the development of the <strong>2007</strong>-<strong>08</strong> budget for our school system.Salary and Benefi t Issues: Estimated salary and benefi t changes areincluded. Actual changes will be determined by the General Assembly.New Programs and Increases to Existing Programs: Dollars are includedfor new programs and increases to existing programs primarily foremployee pay issues.Savings: The base budget was reduced for one-time costs and savingsfrom the previous year.Revenue Adjustments: Fines and forfeitures, interest, indirect cost,tuition, red light camera fi nes, and parking fees were adjusted based onhistorical actual data and projected activity for the future. Fund balancewas appropriated to support the subsequent year budget.The General Assembly was not in session yet and planning allotmentshad not been released by North Carolina Department of <strong>Public</strong>Instruction (NCDPI) when this budget was prepared. The state budgetin this document was built by applying existing state funding formulasto projected student counts. Federal dollars are estimates and will beadjusted as actual awards are received.Growth: Costs were included to accomodate over 8,000 additionalstudents, five new schools, 929,700 additional square feet, and 86additional acres. Costs were included for the remaining two small schoolson the East <strong>Wake</strong> campus and closing East <strong>Wake</strong> High <strong>School</strong>.<strong>System</strong>wide: Costs were included for additional resources to maintainfi scal accountability, facility leases, safety and security, fi xed assetreplacement, and to accommodate rate increases.Board of Education Commitments: Costs were included for theconversion of nineteen elementary schools and three middle schoolsfrom traditional calendar to year-round calendar. Costs were included forthe conversion of 1,986,599 square feet from traditional calendar to yearroundusage. Dollars were included for the fi nal year of the East <strong>Wake</strong>High Whole <strong>School</strong> conversion, and for additional extra duty paymentsfor high school band and strings teachers.10
Budget HighlightsTotal BudgetThe total budget for <strong>2007</strong>-<strong>08</strong> is $1,789,747,694. Thereare two major components of the total budget: operatingbudget and capital improvements budget.The operating budget pays for day-to-day costs of runningthe school system, like salaries, supplies, maintenance,transportation, and utilities. This is called the currentexpense portion of the operating budget. It is paid bya combination of state, county, and federal tax dollars,as well as by grants, fees, interest earned, and fi nes andforfeitures. The operating budget also pays some capitalcosts such as vehicle and equipment replacement andlease and relocation of mobile units.The capital improvements budget is also called thebuilding program. Building program dollars pay for designand construction of new schools, expansion of existingschools, and major renovation and replacement of olderfacilities to meet educational standards. The costs arepaid primarily by bonds, where voters authorize the stateor county to borrow money. The bonds are paid over anumber of years through taxes.The <strong>Adopted</strong> <strong>Plan</strong> for Student Success is the result ofthe process of preparing the operating budget proposalfor <strong>2007</strong>-<strong>08</strong>. Capital improvement dollars for the buildingprogram are included in many schedules; however, thatbudget was prepared separately.Total Budget FY <strong>2007</strong>-<strong>08</strong>Operating Budget Building Program TotalState $ 699,263,727 60% $ 0 0% $ 699,263,727 39%<strong>County</strong> AppropriationCurrent expenseCapital outlay$ 296,964,7993,779,301$ 000%0%$ 296,964,7993,779,301$ 300,744,100 26% $ 0 0% $ 300,744,100 17%Local CapitalImprovements $ 0 0% $ 632,903,517 100% $ 632,903,517 36%Enterprise Funds 39,197,256 3% 0 0% 39,197,256 2%Other Local 41,824,910 4% 0 0% 41,824,910 2%Local $ 381,766,266 33% $ 632,903,517 100% $ 1,014,669,783 57%Federal $ 75,814,184 7% 0 0% 75,814,184 4%Total $ 1,156,844,177 100% $ 632,903,517 100% $ 1,789,747,694 100%Where Do Funds Come From?Operating Budget$ 1,156,844,177Federal7%Local33% <strong>County</strong> Appropriation 26%Other Local 7%State60%11 FY <strong>2007</strong>-<strong>08</strong> <strong>Plan</strong> for Student Success
Budget HighlightsWhere are Funds Spent?Operating Budget11%$ 1,156,844,1776%1%0%State <strong>Public</strong> <strong>School</strong> FundState allotments are funded on a formula basis. The state funds schoolswith three basic types of allotments: position allotments, dollar allotments,and categorical allotments. Due to our phenomenal student enrollmentgrowth, the state budget is expected to increase by nine percent in <strong>2007</strong>-<strong>08</strong>.Ninety-four percent of state funding is spent on salaries and employeebenefi ts. We anticipate 8,045.66 new months of employment based ongrowth in student projections:82%Salaries and Benefits $946,276,282 Purchased Services $124,804,372Supplies and Materials $69,510,870 Transfers to Charter <strong>School</strong>s $10,025,007Capital Outlay $6,227,646ReferencePages3,806.00 Classroom Teacher months 1391,1<strong>08</strong>.00 Teacher Assistant months 140937.00 Special Education Teacher months 183440.00 <strong>School</strong>-Based Clerical months 144374.00 Bus Driver months 222230.00 Career-Technical Education months 171226.00Special Education Teacher Assistants andTransition Facilitator months185212.00 Counselor months 187, 280141.00 Assistant Principal months 14286.00 Academically Gifted months 17279.00 Psychologist months190, 279,30077.00 Media Specialist months 173, 27672.00 Principal months147,288-29272.00 Bus Mechanic months 23065.00 English As A Second Language months 17463.66 Social Worker months 191, 27822.00 In-<strong>School</strong> Suspension Teacher months 177, 27712.00 Early Hire Principal months 155-15712.00 Bus Operations Team Leader 232, 25411.00 Transition Counselor months 196The state portion of this budget was based upon applying 2006-07formulas to <strong>2007</strong>-<strong>08</strong> projected student membership. North CarolinaDepartment of <strong>Public</strong> Instruction (NCDPI) released planning allotmentson February 13, <strong>2007</strong>, after this budget had been prepared. Budgetadjustments required due to action of the General Assembly will beincorporated after the state budget is fi nalized. The impact of theseitems will be recorded in the school system’s budget and will be reportedto the board in the fi rst quarter of <strong>2007</strong>-<strong>08</strong>.12
Budget HighlightsState Months of Employment ComparisonFY 2005-06 FY 2006-07 FY <strong>2007</strong>-<strong>08</strong> Increase %Administration 3,837.96 4,047.96 4,260.96 213.00 5%Professional 77,650.91 83,003.97 88,449.97 5,446.00 7%EducatorProfessional 1,928.15 2,051.50 2,194.16 142.66 7%- OtherTechnical 21,063.25 23,0<strong>08</strong>.55 24,342.55 1,334.00 6%Offi ce/Clerical 5,141.63 5,900.60 6,352.60 452.00 8%Crafts/Trades 963.00 936.00 1,020.00 84.00 9%Other 14,885.45 14,390.06 14,764.06 374.00 3%Total 125,470.35 133,338.64 141,384.30 8,045.66 6%Budget <strong>2007</strong>-<strong>08</strong> $688,579,048Budget 2006-07 $629,027,715Increase $59,551,333<strong>County</strong> AppropriationDevelopment of the <strong>2007</strong>-<strong>08</strong> budget presented a great challenge.Projections for new student growth for the coming year exceed 8,000.Seven new schools and signifi cant expansions are adding more than 1.0million square feet of space. Health insurance premiums are projectedto increase fi ve percent. The school system has utilized resourceseffi ciently and has reallocated available fi nancial and human resourcesin order to support the strategic plan. The impact of growth and infl ationon budgets has been substantial.The amount of revenue approved by <strong>Wake</strong> <strong>County</strong> for <strong>2007</strong>-<strong>08</strong> is$300,744,100. The budget is based on several assumptions.(1) Additional expenditures are projected for the <strong>2007</strong>-<strong>08</strong> school year forlegislative issues for salary increases and employer’s matching benefi tchanges.Cost/Salary and Benefit IssuesIncrease/(Decrease)(Savings)per StudentBOE Member Fees (5% increase) $6,341 $0.05Certifi ed Employees (7% increase to base) $2,420,521 $17.79Certifi ed Employees (7% increase to$4,982,700 $36.61supplement)Noncertifi ed Employees (3% increase) $1,759,533 $12.93Central Services Administrators$1<strong>08</strong>,000 $0.79Performance Pay (0.5%)Salary Subtotal $9,277,095 $68.17Employer’s matching hospitalizationinsurance - 5% increase annually ($3,854 in06-07 to $4,047 in 07-<strong>08</strong>; $4,249 in <strong>08</strong>-09;and $4,461 in 09-10)$371,488 $2.73Employer’s Matching Benefit Increases $371,488 $2.73SubtotalSubtotal Salary and Benefit Issues $9,648,583 $70.90(2) Additional expenditures projected for the <strong>2007</strong>-<strong>08</strong> school year basedon growth. Growth requests are needed due to increase in studentmembership, numbers of staff, square footage, acreage, and numberof facilities.Growth-Related IncreasesReferencePageIncrease/(Decrease)Cost/(Savings)perStudentClassroom Teachers 139 $2,268,301 $16.67Teacher Assistants 140 $25,706 $0.19Assistant Principals 142 $465,027 $3.42<strong>School</strong>-Based Clerical 144 $9,187 $0.07Classroom Materials 146 $276,335 $2.03Principals 147 $157,334 $1.16Sick Leave Substitutes 149 $345,942 $2.54Contracted Services 151 $49,446 $0.3613 FY <strong>2007</strong>-<strong>08</strong> <strong>Plan</strong> for Student Success
Budget HighlightsGrowth-Related IncreasesReferencePageIncrease/(Decrease)Cost/(Savings)perStudentTravel 153 $7,736 $0.06Instrument Repair 154 $2,000 $0.01Early hires, purchased services, andstaff development for new schools155 ($32,159) ($0.24)Eastern Area <strong>School</strong>s 158 $12,847 $0.09South Central Area <strong>School</strong>s 160 $4,861 $0.04Southern Area <strong>School</strong>s 162 $11,812 $0.09Western Area <strong>School</strong>s 164 $1,960 $0.01Ninth Grade Centers 166 $330,233 $2.43Graduation and Rehearsal Facilities 167 $7,129 $0.05Offi ce of Student Due Process andPolicy168 $12,500 $0.09Career-Technical Education 170 $163,424 $1.20K-5 Curriculum and InstructionTeachers171 $1,239,832 $9.11Academically Gifted Teachers 172 $40,413 $0.30Media Specialists 173 $31,954 $0.23English as a Second LanguageTeachers174 $30,545 $0.22Advancement Via IndividualDetermination175 $237,776 $1.75Local Literacy Teachers to support K-2Intervention and Coaching176 $76,429 $0.56In-<strong>School</strong> Suspension Teachers 177 $7,519 $0.06Online resources for new schools 178 $3,820 $0.03Costs to Administer Tests 182 $34,888 $0.26Special Education Teachers 183 $1,247,052 $9.16Special Education Teacher Assistants,Transition Training Facilitators185 $570,686 $4.19Counselors 187 $139,118 $1.02Speech Therapists 189 $795,931 $5.85Growth-Related IncreasesReferencePageIncrease/(Decrease)Cost/(Savings)perStudentPsychologists 190 $49,602 $0.36Social Workers 191 $40,128 $0.29Accelerated Learning Program 192 $191,311 $1.41Occupational Therapists 193 $173,363 $1.27Challenged <strong>School</strong>s Program 194 $84,920 $0.62Physical Therapists 195 $57,788 $0.42Transitional Counselors 196 $11,572 $0.09Audiologists 197 $33,164 $0.24High <strong>School</strong> Intervention Coordinators 198 $24,328 $0.18Extra Duty Budget for New <strong>School</strong>s 199 $103,265 $0.76Human Resources Personnel 201 $96,575 $0.71Courier 202 $55,340 $0.41Criminal Records Check 203 $16,222 $0.12OSHA Nurse 205 $2,786 $0.02Director of Communications 209 $99,523 $0.73Communications DepartmentAdvertising210 $2,500 $0.02Utility budget for new square feet 213 $1,455,440 $10.70Custodial dollars for new square feet 215 $675,598 $4.96Maintenance dollars for new squarefeet216 $795,000 $5.84Grounds maintenance of new acreage 217 $167,000 $1.23Bus Drivers 222 $798,863 $5.87Exceptional Children Pupil ContractTransportation224 $476,106 $3.50Bus Driver Substitutes 225 $583,583 $4.29Oil, Fuel, Tires, and Bus Parts andSupplies226 $26,227 $0.19Activity buses 228 $289,064 $2.12Bus Safety Assistants 229 $239,220 $1.76Bus Mechanics 230 $2,794 $0.0214
Budget HighlightsGrowth-Related IncreasesReferencePageIncrease/(Decrease)Cost/(Savings)perStudentSalary differential for bus drivers, fulltimebus driver substitutes, and busdriver leads making over the state231 $141,198 $1.04maximum hourly rateTransportation District at Knightdale 232 $112,451 $0.83Fuel truck 233 $73,842 $0.54Exceptional Children contracttransportation in cars and buses for 234 $66,625 $0.49PreK ChildrenService Trucks to meet North CarolinaState Board recommended ratio235 $56,250 $0.41Exceptional Children parent contracttransportation for PreK children237 $16,014 $0.12Perfect Attendance Incentive forTransportation Department Personnel238 $14,923 $0.11Charter <strong>School</strong>s 241 $413,363 $3.04Intersession teachers and teacherassistants for new year-round244 $283,952 $2.09elementary schoolsBoard of Education WorkshopExpenses/Allowable Travel246 $7,631 $0.06Substitutes for 12 month staff forplanning days at year-round schools247 $7,105 $0.05Subtotal Growth $16,320,220 $119.92(3) Additional expenditures are projected for systemwide issues such asfi scal accountability, rate increases, facility leases, safety and security,and fi xed asset replacement.<strong>System</strong>wide IssuesReferencePageIncrease/(Decrease)Cost/(Savings)perStudentFiscal AccountabilityInsurance 251 $95,661 $0.70Fuel Management <strong>System</strong> (FMS) 253 $135,000 $0.99Operations StaffContract Cars and Buses for254 $71,211 $0.52Exceptional ProgramsReal-time inventory for PartsDepartment255 $46,052 $0.34Bookkeeping staff for theTransportation Department256 $36,827 $0.27Rate IncreasesSwimming Pool Rental Rate Increasefor High <strong>School</strong>s257 $8,531 $0.06Utility budget increase for expectedincrease in utility rates258 $1,216,675 $8.94Facility LeasesFund the lease costs of existingmobile units and future mobile units260 $531,516 $3.91Leases - Real Estate Services 261 $123,472 $0.91Safety and SecuritySecurity functions to Maintenance andOperations263 $82,994 $0.61Safety/Recruitment Offi cer forTransportation264 $55,065 $0.40Computer and diagnostic software formechanics265 $50,000 $0.37<strong>System</strong>wide Fixed Asset ReplacementReplace liquifi ed propane (LP) forkliftwith an electric unit266 $28,430 $0.21Support vehicles 267 $370,355 $2.72Grounds equipment 269 $99,000 $0.7315 FY <strong>2007</strong>-<strong>08</strong> <strong>Plan</strong> for Student Success
Budget Highlights<strong>System</strong>wide IssuesReferencePageIncrease/(Decrease)Cost/(Savings)perStudentActivity Bus Service Trucks (LocalTrucks)270 $34,990 $0.26Forklift in Parts Department inTransportation271 $33,170 $0.25Capital Budget 272 ($92,012) ($0.68)Subtotal <strong>System</strong>wide Issues $2,926,937 $21.51(4) Additional expenditures are projected for commitments by the Boardof Education to programs for future funding. These are items the boardhas approved in committee, but for which the budget is not yet in place.Commitments by Board of EducationTraditional to Year-Round ConversionReferencePageIncrease/(Decrease)Cost/(Savings)perStudentLocal Literacy Months 275 $113,987 $0.84Media Specialist Months 276 $6,918 $0.05In-<strong>School</strong> Suspension Teacher Monthsof Employment277 $4,125 $0.03Social Worker Months 278 $19,166 $0.14Psychologist Months 279 $21.547 $0.16Counselor Months 280 $43,471 $0.32Salary differential for year-round schoolpositions: principal, assistant principal,lead school secretary, and NC Wisedata manager281 $206,719 $1.52Assistant Principal Months 282 $136,488 $1.01Utility budget increase 283 $536,376 $3.94Maintenance dollars to maintain yearroundconversion square feet284 $317,853 $2.34Commitments by Board of EducationCustodial dollars to includehousekeeping of year-round conversionsquare footageIntersession Teachers and TeacherAssistantsSubstitutes for 12 month staff forplanning daysEast <strong>Wake</strong> High Whole <strong>School</strong>ConversionAdditional extra duty payments for highschool band and strings teachersSubtotal Commitments by Board ofEducationSubtotal Prior to New Programs andIncreases to Existing ProgramsReferencePageIncrease/(Decrease)Cost/(Savings)perStudent285 $39,732 $0.29286 $1,798,360 $13.21287 $53,609 $0.39288 $23,036 $0.17293 $246,799 $1.81$3,568,186 $26.22$32,463,926 $238.55(5) Additional expenditures are requested based on increased fundingfor new or existing programs. These requests are aligned to the strategicdirectives of the school system.New Programs and Increases toExisting ProgramsReferencePageIncrease/(Decrease)Cost/(Savings)perStudentIncrease Noncertifi ed Salaries 295 $1,992,886 $14.64Increase hourly rates for 12-monthnoncertifi ed employees to the hourlyrates for 10-month and 11-month297 $651,871 $4.79noncertifi ed employeesLocal Supplement <strong>School</strong>Psychologist for Academically Gifted 300 $8,906 $0.07ProgramExtra Duty Compensation -Lacrosse Coaches301 $100,000 $0.7316
Budget HighlightsNew Programs and Increases toExisting ProgramsSubtotal for New Programs andIncreased Funding for ExistingProgramsReferencePageIncrease/(Decrease)Cost/(Savings)perStudent$2,753,663 $20.23(6) Savings and reduction of one-time costs from the previous year wereidentifi ed.Savings and reductionsReferencePageIncrease/(Decrease)Cost/(Savings)per StudentBudget ReductionsReduce the baseline operatingbudget for WCPSS for Middle314 ($188,000) ($1.38)<strong>School</strong> Resource Offi cersBalance in Over/Under Account 315 ($116,684) ($0.86)<strong>Plan</strong>ning and Construction localoperating budget316 ($123,588) ($0.91)Summer Testing and Review 317 ($53,193) ($0.39)Reduction of the Summer Help forthe Bus Garage318 ($47,064) ($0.35)Eliminate Payment for New BusDrivers for Initial Training319 ($22,958) ($0.17)One-Time Costs from 2006-07Technology 321 ($722,203) ($5.31)One-time allotments to schools in2006-07 for leave, class size, and 322 ($618,944) ($4.55)scheduling issuesOne-time allotments to schools in2006-07 for Tenth Day Overages324 ($429,390) ($3.16)Capital Outlay 325 ($41,322) ($0.30)Salary Audit 326 ($152,591) ($1.12)Special project - credit checkingcontract and associated help deskcosts327 ($103,000) ($0.75)Savings and reductionsReferencePageIncrease/(Decrease)Cost/(Savings)per StudentOne-time allotments to centralsupport areas in 2006-07328 ($30,958) ($0.23)Security 329 ($8,000) ($0.06)Internal Audit - one-time costs fromprevious year330 ($7,138) ($0.05)Shift Local Costs to State SourcesShift local costs to state resources- Technology320 ($2,014,535) ($14.80)Subtotal Budget Reductions ($4,679,568) ($34.39)TOTAL INCREASE IN LOCALNONCATEGORICAL EXPENDITURES$30,538,021 $224.39(7) Changes in noncategorical local revenues were identifi ed.Noncategorical local revenueIncrease/(Decrease)Interest Current Expense $700,000Fines and Forfeitures $200,000Indirect Cost $200,000Indirect Cost - Child Nutrition $150,000Red Light Camera Fines $75,000Tuition ($45,000)TOTAL $1,280,000(8) Based upon analysis of 2006-07 expenditure and revenue patterns,$12.9 million of fund balance can be appropriated toward the <strong>2007</strong>-<strong>08</strong>budget. This is $4.3 million more than was appropriated July 1, 2006.The district’s undesignated fund balance at the end of 2005-06 equaledeight percent of the 2006-07 county appropriation. We are appropriating56 percent of that towards the <strong>2007</strong>-<strong>08</strong> budget.The budget development process is based upon a strategic plan to attaingoals. The use of fund balance is clearly necessary and represents thestrong commitment of WCPSS to focus all available resources on studentachievement.17 FY <strong>2007</strong>-<strong>08</strong> <strong>Plan</strong> for Student Success
Budget HighlightsEach year there are fund balance appropriations after July 1. Fundsare appropriated for carryover purchase orders. These dollars areencumbered in the prior year budget for services or goods. Due toearly fi nancial processing cutoffs in June, the bills are not paid until Julyfor services completed and goods received in late June. Funds areappropriated for startup dollars for new schools. Dollars allotted in thespring prior to a school opening remain available to the principal throughSeptember 30. Other appropriations are approved by the board for onetimecosts such as salary audit, curriculum audit, and insurance items.In 2006-07 the additional appropriations after July totalled $13.7 million.They are not included as estimates for <strong>2007</strong>-<strong>08</strong>. We removed theseone-time costs from the revenue and expenditure budgets. They are notrefl ected in the above charts. There will be carryover purchase orders in<strong>2007</strong>-<strong>08</strong>. This figure will not be included until fi rst quarter 20<strong>08</strong> budgettransactions are prepared for the board.(9) The amount of dollars funded by <strong>Wake</strong> <strong>County</strong> Commissioners wasidentifi ed. The <strong>Wake</strong> <strong>County</strong> Commissioners funded $24.9 million of the$29.9 million dollar request from the <strong>Wake</strong> <strong>County</strong> Board of Education.The impact of $30.5 million increase in expenditures, an increase of $1.3million of revenues and an increase of $4.3 million from fund balanceto support those items results in an increase of $24.9 million funded bycounty appropriation.Increase in Local NonCategorical ExpendituresLess Increase in Local RevenuesLess Increase in Fund Balance AppropriationEquals Increase in Funding from <strong>County</strong> Commissioners$30,538,021$1,280,000$4,340,921$24,917,1002006-07 <strong>2007</strong>-<strong>08</strong> Increase Percent<strong>County</strong> AppropriationCurrent Expense $264,738,496 $287,063,160 $22,324,664 8%- WCPSSCurrent Expense9,490,516 9,901,639 411,123 4%- Charter <strong>School</strong>sCapital Outlay 1,597,988 3,779,301 2,181,313 137%$275,827,000 $300,744,100 $24,917,100 9%Student MembershipWCPSS 128,072 136,<strong>08</strong>6 8,014 6%Charter <strong>School</strong>s 4,304 4,694 390 9%132,376 140,780 8,404 6%Allocations perstudent $2,<strong>08</strong>4 $2,136 $52 2%Local Current Expense FundThe local current expense budget includes all local revenues of the schoolsystem. The largest of these is the county appropriation. Others includefi nes and forfeitures, indirect cost, interest earned, E Rate, tuition andparking fees, fund balance appropriation, and categorical programs.The local current expense budget for <strong>2007</strong>-<strong>08</strong> is $349,487,236, which isan increase of $26,663,812 from 2006-07.Ongoing, rapid growth and efforts to improve student achievementcontinue to be the most signifi cant fiscal challenges for our school system.Student membership projections total 136,<strong>08</strong>6 students (excluding 4,694students projected to be enrolled in charter schools). Our net projectedincrease in students for <strong>2007</strong>-<strong>08</strong> is 8,014 students or six percent.WCPSS manages resources in an effi cient and effective manner, whichhas been confi rmed by numerous audits and studies by independent citizengroups. We are proud of our effi ciency, and we continually seek waysto make the best use of every dollar spent. We utilize a purchasing cardthroughout the system to decrease the time between order and delivery18
Budget Highlightsby teachers and other staff, as well as to reduce purchase orders andaccounts payable transactions. We utilize a systemwide e-mail systemto reduce paper transactions and improve timeliness of communication.We have eliminated option pay and require direct deposit for employeepay. This reduced cost, saved processing time, and signifi cantly reducedsalary audit exceptions from NCDPI. The chief business offi cer, fi nanceoffi cer, and budget director meet with each division and the principalsquarterly to review fi nancial issues, spending and collection patterns,and to discuss risks. A $1 million reduction remains in the base budgetto be recouped from a 60-day freeze of all central services vacancies.During the year, vacancies occur in positions in the school system asemployee turnover occurs. Dollar savings occur for each day positionsremain vacant and salaries are not paid. Based on historical experience,data generated from our fi nancial system, and the state of the economy,we are able to track where and how often this occurs. In order to gainmaximum use of our resources, we include positions in our budget withno assigned costs to be paid from these lapsed dollars. We budget 198positions to be paid from lapsed salaries, including 38 teacher assistants,35 regular education teachers, 33 career and technicial teachers, 29custodians, 20 clerical positions, 15 accelerated learning teachers, 15instructional support, 10 special education teachers, and 3 central offi ceadministrator positions. This is very aggressive and can vary basedon turnover. We constantly monitor these areas throughout the year tomake sure we will be within budgeted dollars.We continually monitor state funding. We shift local costs onto statedollars whenever possible to make the most of state funding. Wecharge indirect costs on all enterprise programs to help support the localbudget.<strong>School</strong>s process conversions during the year within State ABC transferpolicies. This allows schools to move dollars between program codesas defi ned in legislation in order to meet the needs of that particularschool.Our goal is to maintain undesignated fund balance at 6 percent of thesubsequent year’s county appropriation. We allocate fund balance aspart of our beginning budget. At the same time, we attempt to maintain areserve at a level we feel is necessary to support the district in cases ofemergency, unusual circumstances, or negative budget variances.We seek additional sources of revenue. The grants offi ce supportsschools and assists with identifi cation of new sources of funding. Weadjust fees annually as needed for tuition and parking fees.REVENUES BY SOURCEINCREASE/DECREASE2006-07 <strong>2007</strong>-<strong>08</strong> Dollars Percent<strong>County</strong> Appropriation $274,229,012 $296,964,799 $22,735,787 8%Fund Balance Appropriated 12,137,342 17,730,668 5,593,326 5%State (Textbooks, Grants) 14,425,266 10,638,337 (3,786,929) 1 (26%)Local Sources-Unrestricted 7,052,327 7,795,060 742,733 11%Local Sources-Restricted 7,761,730 7,544,090 (217,640) (3%)Operating Transfers In 4,887,827 6,393,502 1,505,675 3%Federal (Impact Area Grants, 1,340,505 1,495,000 (154,495) (12%)ROTC)Local Sources – Tuition/Fees 989,415 925,780 (63,635) (6%)Total $322,823,424 $349,487,236 $26,663,812 8%1 Decrease of $3.7 million is due to ordering patterns for textbooks. 2006-07 budget is infl ated fromFebruary until June. The <strong>2007</strong>-<strong>08</strong> budget is advanced to schools during that time to allow textbooks tobe ordered and delivered before schools starts.Local Months of Employment ComparisonFY 2005-06 FY 2006-07 FY <strong>2007</strong>-<strong>08</strong>Increase/Decrease PercentAdministration 3,595.14 3,872.94 3,957.44 84.50 2%Professional Educator 6,384.21 7,015.60 8,145.28 1,129.68 16%Professional - Other 1,189.65 1,194.23 1,200.23 6.00 0%Technical 2,822.70 2,456.74 2,948.70 491.96 20%Offi ce/Clerical 6,002.13 5,862.16 5,940.16 78.00 1%Crafts/Trades 2,253.00 2,352.00 2,376.00 24.00 1%Other 1,565.00 2,549.49 3,351.49 802.00 31%Total 23,811.83 25,303.16 27,919.30 2,616.14 10%19 FY <strong>2007</strong>-<strong>08</strong> <strong>Plan</strong> for Student Success
Budget HighlightsFederal Grants FundThe federal funding budget for <strong>2007</strong>-<strong>08</strong> is $56,965,065, which is adecrease of $1,629,9<strong>08</strong> or three percent from 2006-07.The federal budget included in the <strong>Plan</strong> for Student Success was builtbased on grant awards from 2006-07, including an estimate of carryoveramounts. Federal grants typically have different fi scal years than thoseof the school district. Therefore, carryover funds will occur.Federal Months of Employment ComparisonFY2005-06FY2006-07FY<strong>2007</strong>-<strong>08</strong>Increase/(Decrease)PercentAdministration 148.00 72.00 60.00 (12.00) (17%)ProfessionalEducator5,419.00 5,286.00 5,257.50 (28.50) (1%)Professional654.20 553.04 552.04 (1.00) 0%- OtherTechnical 1,999.00 1,975.00 1,961.00 (14.00) (1%)Offi ce/Clerical 102.00 97.50 97.50 0.00 0%Other 186.50 11.00 11.00 0.00 0%Total 8,5<strong>08</strong>.70 7,994.54 7,939.04 (55.50) 1%special education services are served in full-time programs that require aclassroom teacher assistant. Additionally, some students require a oneon-oneteacher assistant to meet their individual needs.Also, the Occupational Course of Study (OCS), one of the four pathwaysleading to a diploma, requires fi eld-based training and employmentexperiences (600 hours/student). Due to increases in the number ofstudents served in the OCS program, one transition training facilitatorfor each new high school and four additional positions for four new sitesare needed to provide the required fi eld-based training for OccupationalCourse of Study students.For the <strong>2007</strong>-<strong>08</strong> school year, 45.4 additional teacher assistant andtransition training facilitator positions are needed. Local and state fundingwill be required to fund the required teacher assistant and transitiontraining facilitator positions.Often special education students require related services. A total of 16.5local positions, including three occupational therapists, one physicaltherapist, a half-time audiologist, and twelve speech therapists, arerequired for the <strong>2007</strong>-<strong>08</strong> school year to meet the needs of some studentswith disabilities.Positions funded with federal carryover dollars are recurring costs to thesystem and will require local support for subsequent years.Special education growth from April 2001 to April 2006 averaged 4.3percent per year. The April 2006 special education child count indicatesthat more than 15 percent of projected student growth will require specialeducation services.Using a projected ratio of one teacher per 13 new students and a projectedincrease in <strong>2007</strong>-<strong>08</strong> of 1,216 students, 94 new special education teacherswill be required to meet the needs of the additional students. In addition,18.7 positions are needed for the schools being converted to year round.Of the 112.7 positions needed, 93.7 can be funded with the projectedincrease in state funds and 19 positions will require local funding.State and federal funds are not available to cover all required positions.State funding is capped at 12.5 percent, and federal dollars do notprovide full funding. Twenty to twenty-fi ve percent of students receiving20Budget <strong>2007</strong>-<strong>08</strong> $56,956,065Budget 2006-07 $58,585,973Decrease ($1,629,9<strong>08</strong>)Multiple Enterprise FundThe multiple enterprise fund includes the Child Nutrition program andother self-supporting programs such as Before- and After-<strong>School</strong> Care,Summer Camp, and Preschool Programs. Tuition or fees solely supportthese programs. We charge indirect costs at the unrestricted maximumrate of 13.995 percent on these programs.
Budget HighlightsThe multiple enterprise funding budget for <strong>2007</strong>-<strong>08</strong> is $56,606,717an increase of $4,286,733 or eight percent from 2006-07. The budgetincludes $43,444,265 for the Child Nutrition program and $13,162,452 intuition and fee-supported programs.Child Nutrition Services is projecting 6.3 percent average annual growthin revenues and expenses through fi scal year 20<strong>08</strong>-09. When thisoccurs, existing 10 Months of Employment (MOE) positions change to12 MOE and new positions do not need to be created. This saves asignifi cant percentage in labor costs. Year-round schools also generaterevenue 12 months per year to offset labor and benefi ts paid duringsummer months when there is no revenue at traditional schools to coverbenefi ts paid out in June and July. At this time, CNS is assuming allnew elementary schools will be opened on the year-round calendar.An area supervisor and training specialist will be added to CNS centralstaff for each additional 15 schools. A clerical position will be addedfor processing lunch applications and another central staff position fortechnology.Breakfast and lunch prices remained the same. The meal prices arecomparable to the other large school systems in North Carolina.BREAKFAST 2005-06 2006-07 <strong>2007</strong>-<strong>08</strong> Inc./Dec.Student Full-Paid K-5 $0.80 $0.80 $0.80 $0.00Student Full-Paid 6-8 $1.00 $1.00 $1.00 $0.00Student Full-Paid 9-12 N/A N/A N/A N/AStudent Reduced $0.30 $0.30 $0.30 $0.00Adult A la carte A la carte A la carte N/ALUNCH 2005-06 2006-07 <strong>2007</strong>-<strong>08</strong> Inc./ Dec.Student Full-Paid K-5 $1.75 $1.75 $1.75 $0.00Student Full-Paid 6-8 $2.00 $2.00 $2.00 $0.00Student Full-Paid 9-12 $2.00 $2.00 $2.00 $0.00Student Reduced $0.40 $0.40 $0.40 $0.00Adult A la carte A la carte A la carte N/AMultiple Enterprise Months of Employment ComparisonFY2005-06FY2006-07FY<strong>2007</strong>-<strong>08</strong>Increase/DecreasePercentAdministration 210.00 240.00 240.00 0.00 0%Professional 25.00 25.00 25.00 0.00 0%EducatorProfessional 12.00 12.00 12.00 0.00 0%- OtherTechnical 94.00 232.00 232.00 0.00 0%Offi ce/Clerical 126.00 138.00 174.00 36.00 26%Crafts/Trades 990.00 1,022.00 1,090.00 68.00 7%Other 6,075.70 6,280.00 6602.00 322.00 5%Total 7,532.70 7,949.00 8,375.00 426.00 5%Budget <strong>2007</strong>-<strong>08</strong> $56,606,717Budget 2006-07 $52,319,984Increase $4,286,733Capital Outlay FundThe capital budget for <strong>2007</strong>-<strong>08</strong> totals $638,118,628. The budgetincludes $632,903,517 in building program funds, $3,779,301 countyappropriation, $1,285,810 fund balance appropriation and $150,000interest earned.Developing the budget based on the school board’s Goal 20<strong>08</strong> requiresfocusing on classroom improvements and coordinating the needs ofseveral departments. WCPSS staff and support personnel provide theservices to enhance the education of our children.The capital budget contains two parts: 1) the capital building fund; and 2)the operating budget capital outlay fund.Capital Building Fund: Enrollment in <strong>Wake</strong> <strong>County</strong> <strong>Public</strong> <strong>School</strong> <strong>System</strong>(WCPSS) is expected to grow by 42,000 students by the 2010-11 schoolyear--an increase of 35 percent over the 2005-06 school year. This21 FY <strong>2007</strong>-<strong>08</strong> <strong>Plan</strong> for Student Success
Budget Highlightsmeans that more schools and more support facilities for schools will beneeded prior to the arrival of these students. Capital funding providedby PLAN 2004 allowed the opening of four elementary schools andtwo high schools in 2006-07 and will provide six additional elementaryschool buildings for <strong>2007</strong>-<strong>08</strong>. A new Capital Improvement <strong>Plan</strong> (CIP)was needed to address enrollment growth from <strong>2007</strong> through 2010.After extensive review and discussion of staff proposals, the Board ofEducation adopted a Capital Improvement Program with a total cost of$1,055,874,837. Key considerations in the fi nal CIP were: the limitationof year-round conversion in elementary schools to that level requiredto generate 3,000 seats to address crowding in <strong>2007</strong>-<strong>08</strong>; conversionof some middle schools to year-round calendars in order to generateat least some of the 2,000 additional seats needed in middle schoolsby 20<strong>08</strong>-09; and to provide families in elementary and middle schoolthe opportunity to have siblings on the same track. In November 2006,<strong>Wake</strong> <strong>County</strong> voters approved the bond referendum for CIP 2006, whichprovides funds for construction of 17 new schools, complete renovationof 13 existing schools, purchase of land for new schools, purchase ofurgently needed technology upgrades, and many other critical projects.The CIP, or capital building fund, provides adequate classroom spacefor teaching and learning to serve a 35 percent increase in enrollmentover fi ve years, and makes some progress on deferred major renovationand life-cycle projects at existing schools to protect student health andsafety and maintain adequate instructional environments. The plan alsoaddresses repairs and maintenance projects at nearly 100 schools acrossthe county. These deferred life-cycle replacements involve roofs, airconditioning systems and boiler replacements. To determine renovationneeds, WCPSS evaluates building system life-cycle costs, and projectsmajor renovations on a 40-year cycle. <strong>School</strong>s are prioritized based on afacility condition index--a ratio of the cost of work needed at the buildingdivided by the building replacement value.Operating Capital Outlay Budget: The operating budget capitaloutlay budget contains funds for minor improvements in schools andadministrative buildings. A signifi cant part of the FY <strong>2007</strong>-<strong>08</strong> budget isdedicated to the provision of additional space for the <strong>Wake</strong> Early Collegeof Health and Science to accommodate the planned expansion of thisinnovative program in cooperation with <strong>Wake</strong> Medical Center and <strong>Wake</strong>Technical College. A major portion of the remainder of the capital outlaybudget is for the annual relocation of mobile and modular classroomunits needed to accommodate growth across the school system, and forpayment of the annual lease cost for these units.Budget <strong>2007</strong>-<strong>08</strong> $638,118,628Budget 2006-07 $881,150,559Decrease ($243,031,931)Financial Reporting RecognitionThe school system has faced many challenges over the past ten years.During this time, we have successfully managed a building program, whichis one of the largest in the nation. We have received an “unqualifi ed”audit opinion each of the last sixeen years.For the past seventeen years, we have received the Certifi cate ofExcellence in Financial Reporting from both the American <strong>School</strong>Business Offi cials (ASBO) and the Government Finance Offi cersAssociation (GFOA). We have also received the Distinguished BudgetPresentation Award from the GFOA the past fourteen years. This awardis the highest form of recognition in governmental budgeting.The <strong>Wake</strong> <strong>County</strong> Board of Education won the 2005-06 State Treasurer’sAward for Excellence in Accounting and Financial Management in thecategory of <strong>School</strong> Units with Average Daily Membership (ADM) of12,000 and over. This award recognized the <strong>Wake</strong> <strong>County</strong> <strong>Public</strong> <strong>School</strong><strong>System</strong> for their innovative approach to responsible fi scal managementand improvements to their current operations. WCPSS was recognizedfor the establishment of a Fraud Prevention Program, internal controlimprovements, and implementing a budget manager certifi cation program.These improvements will safeguard the school system’s assets and savemoney, as well as promote effectiveness and effi ciency.We also received the 2004-05 State Treasurer’s Award for Excellencein Accounting and Financial Management in the category of <strong>School</strong>Units with Average Daily Membership (ADM) of 12,000 and over. Thisaward was received based on our innovative approach to responsiblefi scal management and improvements to current operations. The entrysubmitted involved signifi cant enhancements in the budgetary process,which highlights requests that are related to growth.22
Budget HighlightsWe have aggressively managed our budget and wisely invested availableresources. These accomplishments are the result of a dedicatedand competent staff, a supportive board, and a caring and supportivecommunity. The end result of all this has been continued improvementof programs and outcomes for our students.Fiscal AccountabilityCommittee on WCPSS Employee Compensation April 1993A committee of community-based citizens formed by the Board of<strong>County</strong> Commissioners and the Board of Education, and chaired byMel Finch (retired from The News & Observer), developed a set ofrecommendations:1) Establish committees to advise and provide continuous study oncompensation issues for various groups of employees.2) Increase the salaries of teachers and other specifi c groups ofemployees.Offi ce of the State AuditorPerformance Audit Report October 1993While the implication had been that the central administration was“overstaffed,” the state performance audit of the <strong>Wake</strong> <strong>County</strong><strong>Public</strong> <strong>School</strong> <strong>System</strong> discovered that the central administration was“understaffed.”Site-based Advisory Committee Fall of 1995The committee consisted of principals, central offi ce staff, businessadvisors, school board members, and county commissioners whostudied the district to determine the adequacy and appropriateness ofspending..The study found an effi ciently run and modestly staffed organization.KPMG Peat Marwick LLPManagement Audit Report February 1997Over the years, a consistent question has been: “How well is <strong>Wake</strong><strong>County</strong>’s central offi ce doing?” KPMG’s management audit found that“<strong>Wake</strong> <strong>County</strong> is a very good district, with central offi ce effi ciency andeffectiveness that many other districts would envy.”Citizens’ Perception StudyThe Gallup Organization March 1998The citizens of <strong>Wake</strong> <strong>County</strong> overwhelmingly responded to this studystating that “competent and caring” teachers were a critical componentfor a school to be successful. Citizens believed that a successful school“ensures that all the children are treated fairly.”Compensation Salary Management StudyArthur Anderson LLP January 2000The comprehensive salary study provided a number of recommendationsfor increasing the compensation of various employee groups.Quality Matters 2001A <strong>Wake</strong> Community Review of the <strong>Public</strong>’s <strong>School</strong>sJanuary/February 2001The <strong>School</strong> Finance Advisory Committee, an independent group of keycommunity leaders, sought to examine the performance of <strong>Wake</strong> <strong>County</strong><strong>Public</strong> <strong>School</strong>s. The fi ve major fi ndings are:1) <strong>Wake</strong> <strong>County</strong> is a good steward of the public’s money2) <strong>Wake</strong> <strong>County</strong> spends less than comparable systems3) Maintenance is underfunded4) <strong>Wake</strong> <strong>County</strong> schools set and met high standards5) <strong>Wake</strong> <strong>County</strong>’s rapid growth presents challenges to our schoolsIn this committee’s opinion, “<strong>Wake</strong> <strong>County</strong> students – despite lowerper pupil spending than comparable school districts – are achieving athigher rates more consistently than their peers across the state.”23 FY <strong>2007</strong>-<strong>08</strong> <strong>Plan</strong> for Student Success
Budget HighlightsSeptember2001 toCitizens Advisory Committee on <strong>School</strong> Operations February 2003A diverse group of citizens, appointed in equal number by the Boardof Education and Board of <strong>County</strong> Commissioners, was charged withexamining the operation and funding of the district and determining theappropriate funding level for the system. In the process, MGT of Americaconducted an extensive audit of the school system.Quality Matters 2002-2004Annually, the <strong>Wake</strong> Education Partnership convenes an independentgroup of key business leaders in the community to examine theperformance of the school district and report its fi ndings in a report tothe community.Summerford Accountancy, PC 2005-2006The fraud vulnerability assessment found that WCPSS’ internal structureis adequate and operating effectively, but did make recommendations toreduce the opportunity for a fraud to be committed in the future.Upcoming Audit:Comprehensive Independent Curriculum ManagementAudit 2006-<strong>2007</strong>The board has approved a comprehensive independent curriculummanagement audit be performed by International CurriculumManagement Audit Center of Phi Delta Kappa International. The auditwill be based on a business model developed by the accounting fi rmPeat, Marwick, and Mitchell and will follow generally accepted auditingprinciples.Two major questions to be addressed by the curriculum managementaudit:1) Does the <strong>Wake</strong> <strong>County</strong> <strong>Public</strong> <strong>School</strong> <strong>System</strong> have a properlymanaged instructional program or curriculum that is planned,executed, and assessed in accordance with generally acceptedprinciples and standards?2) Does the <strong>Wake</strong> <strong>County</strong> <strong>Public</strong> <strong>School</strong> <strong>System</strong> conform to thestandards of quality in instructional organization which includethe following:• adequacy, specifi city, and scope of board policies andplanning?• suffi cient quality in direction for teaching and learning?• consistency and equity in schools and programimplementation?• effectiveness of program and process monitoring andassessment?• use and allocations of budget and resources for productivityand quality improvement?24
Board of Education and Administrative Leadership TeamThe school system is governed by a nine-memberBoard of Education whose members are electedfrom nine separate districts in the county andserve staggered four-year terms. The board setspolicy, and the superintendent and administrativestaff manage the system’s day-to-day operation.The board has budget review authority, but it isnot a taxing body and must submit its annualbudget requests to the <strong>Wake</strong> <strong>County</strong> Board ofCommissioners, which controls allocation offunds to the schools. In North Carolina the basicpublic education program is funded by the stateand is augmented with local funds.The schedule for regular board meetings willbe established annually by the board. Meetingsare held in the boardroom at the system’sAdministration Building, 3600 <strong>Wake</strong> Forest Road,Raleigh. Regular meetings can and usually doinclude a consent agenda as well as action,information items, and an opportunity for publiccomments.25 FY <strong>2007</strong>-<strong>08</strong> <strong>Plan</strong> for Student Success
Board of Education and Administrative Leadership TeamRosa Gill - ChairDistrict 4 (East Raleigh)rgill@wcpss.net<strong>School</strong>s by Election DistrictBugg ElementaryCarnage MiddleConn ElementaryEnloe HighFuller ElementaryHunter ElementaryLigon MiddleLongview <strong>School</strong>Mary E Phillips HighMoore Square Museums MiddlePoe ElementaryPowell ElementarySoutheast Raleigh HighWashington ElementaryWilburn ElementaryBeverley Clark - Vice ChairDistrict 6 (Central Raleigh)bsclark@wcpss.net<strong>School</strong>s by Election DistrictBrentwood ElementaryBrooks ElementaryCarroll MiddleDaniels MiddleDouglas ElementaryGreen ElementaryJoyner ElementaryLacy ElementaryLynn Road ElementaryMartin MiddleMillbrook ElementaryMount Vernon <strong>School</strong>Reedy Creek ElementaryReedy Creek MiddleRoot ElementarySanderson High26
Board of Education and Administrative Leadership TeamLori MillbergDistrict 1 (Northeast <strong>Wake</strong>)lmillberg@wcpss.net<strong>School</strong>s by Election DistrictCarver ElementaryEast <strong>Wake</strong> High <strong>School</strong>sEast <strong>Wake</strong> MiddleForestville ElementaryHarris CreekHeritage ElementaryHeritage High SiteHeritage MiddleHodge Road ElementaryJones Dairy ElementaryKnightdale ElementaryKnightdale HighLockhart ElementaryRolesville Elementary<strong>Wake</strong> Forest Elementary<strong>Wake</strong> Forest High<strong>Wake</strong> Forest Middle<strong>Wake</strong>lon ElementaryWendell ElementaryWendell Middle SiteZebulon ElementaryZebulon MiddleHorace TartDistrict 2 (Southeast <strong>Wake</strong>)htart@wcpss.net<strong>School</strong>s by Election DistrictAversboro ElementaryBallentine ElementaryBarwell Road ElementaryCreech Road ElementaryEast Garner Elementary SiteEast Garner MiddleFuquay-Varina ElementaryFuquay-Varina HighFuquay-Varina MiddleGarner HighLincoln Heights ElementaryNorth Garner MiddleRand Road ElementarySmith ElementaryTimber Drive ElementaryVance ElementaryVandora Springs ElementaryWest Lake ElementaryWest Lake MiddleWillow Springs Elementary27 FY <strong>2007</strong>-<strong>08</strong> <strong>Plan</strong> for Student Success
Board of Education and Administrative Leadership TeamCarol ParkerDistrict 3 (North Raleigh)coparker@wcpss.net<strong>School</strong>s by Election DistrictBaileywick ElementaryBrassfi eld ElementaryDurant Road ElementaryDurant Road MiddleEast Millbrook MiddleForest Pines Elementary (@DuBois Center)Fox Road ElementaryMillbrook HighNorth Ridge ElementaryPleasant Union ElementaryRiver Bend Elementary<strong>Wake</strong>fi eld Elementary<strong>Wake</strong>fi eld High<strong>Wake</strong>fi eld MiddleWest Millbrook MiddleWildwood Forest ElementarySusan ParryDistrict 5 (South Central Raleigh)skparry@wcpss.net<strong>School</strong>s by Election DistrictAthens Drive HighBroughton HighCentennial Middle CampusCombs ElementaryDillard ElementaryDillard MiddleMiddle Creek ElementaryMiddle Creek HighOlds ElementaryPartnership PrimarySwift Creek ElementaryUnderwood ElementaryWiley ElementaryYates Mill Pond Elementary28
Board of Education and Administrative Leadership TeamPatti HeadDistrict 7 (West Raleigh/Morrisville)prhead@wcpss.net<strong>School</strong>s by Election DistrictBrier Creek Elementary SiteCarpenter Elementary SiteCedar Fork ElementaryGreen Hope ElementaryGreen Hope HighHilburn ElementaryJeffreys Grove ElementaryLead Mine ElementaryLeesville ElementaryLeesville HighLeesville MiddleMorrisville ElementaryStough ElementaryYork ElementaryRon MargiottaDistrict 8 (Southern <strong>Wake</strong>)rmargiotta@wcpss.net<strong>School</strong>s by Election DistrictApex ElementaryApex HighApex MiddleBaucom ElementaryDavis Drive ElementaryDavis Drive MiddleHighcroft Drive ElementaryHolly Grove Elementary (@ HollySpring High)Holly Ridge ElementaryHolly Ridge MiddleHolly Springs ElementaryHolly Springs Area Middle SiteHolly Springs HighLufkin Road MiddleOak Grove ElementaryOlive Chapel ElementaryPanther Creek HighPenny Road ElementarySalem ElementarySalem MiddleTurner Creek Elementary29 FY <strong>2007</strong>-<strong>08</strong> <strong>Plan</strong> for Student Success
Board of Education and Administrative Leadership TeamEleanor GoetteeDistrict 9 (Western <strong>Wake</strong>)egoettee@wcpss.net<strong>School</strong>s by Election DistrictAdams ElementaryBriarcliff ElementaryCary ElementaryCary HighEast Cary Middle SiteFarmington Woods ElementaryKingswood ElementaryNorthwoods ElementaryWeatherstone ElementaryWest Cary Middle30
Government Finance Offi cers Association AwardThe Government Finance Offi cers Association of the United States and Canada (GFOA) presented a Distinguished Budget Presentation Awardto <strong>Wake</strong> <strong>County</strong> <strong>Public</strong> <strong>School</strong> <strong>System</strong>, North Carolina for fi scal year beginning July 1, 2006. In order to receive the award a governmental unitmust publish a budget document that meets program criteria as policy document, and an operations guide, as fi nancial plan, and as a communicationdevice.This award is valid for a period of one year only. We believe our current budget continues to conform to program requirements, and we aresubmitting to GFOA to determine its eligibility for another award.31 FY <strong>2007</strong>-<strong>08</strong> <strong>Plan</strong> for Student Success
Notes32
<strong>Wake</strong> <strong>County</strong> <strong>Public</strong> <strong>School</strong> <strong>System</strong> Strategic Improvement <strong>Plan</strong> 2006-2009MissionThe <strong>Wake</strong> <strong>County</strong> <strong>Public</strong> <strong>School</strong> <strong>System</strong> will educate each student to be a responsible and productivecitizen who can effectively manage future challenges.GoalBy 20<strong>08</strong>, 95% of students in grades 3 through 12 will be at or above grade level as measured by theState of North Carolina End-of-Grade or Course tests, and all student groups will demonstrate highgrowth.State Board ofEducationSuperintendent’sMissionSuperintendent’sVisionEvery public school student will graduate from high school, globally competitive for workand postsecondary education and prepared for life in the 21st century.To create and maintain systems with suffi cient resources for establishing a collaborative,inclusive and trusting environment for all stakeholders and for providing high qualitylearning experiences for each student to ensure success in the 21st century.A community of caring stakeholders (parents, teachers, administrators, and staff) willsuccessfully work collaboratively with support from the broader community to ensure thatevery child educated in the <strong>Wake</strong> <strong>County</strong> <strong>Public</strong> <strong>School</strong> <strong>System</strong> graduates on time, preparedfor the future.Superintendent’sStrategy Team MissionSuperintendent’sLeadership Team MissionThe Mission of the Superintendent’s Strategy Team is to chart, align, communicate,and monitor strategic direction for continuous system-wide improvementthat supports teaching and learning.The Mission of the Superintendent’s Leadership Team is to lead the development,implementation and support of aligned processes to ensure understandingand continuous systemic improvement of teaching and learning.33FY <strong>2007</strong>-<strong>08</strong> <strong>Plan</strong> for Student Success
<strong>Wake</strong> <strong>County</strong> <strong>Public</strong> <strong>School</strong> <strong>System</strong> Strategic Improvement <strong>Plan</strong> 2006-2009NC State Board of EducationGlobally competitive studentsHealthy and responsible studentsWCPSS Strategic Directive OneFocus on Teaching and LearningGoal 1: Ensure that school improvement planning processes in allschools are relevant and incorporate continuous improvement practices.Goal 2: Ensure that central services departments and divisions supportteaching and learning appropriately.RESULTSEnd of Course and End of Grade test scores will improve for all subgroups.SAT scores will increase.The graduation rate as measured by the North Carolina Department of <strong>Public</strong> Instruction(NCDPI) will increase.PROCESSESEvidence of the on-going use of school improvement plans to guide the work of schoolswill be documented.Professional learning community activity will support and be evident in school improvementplanning processes.<strong>School</strong>s will identify and share lessons and practices with documented impact on studentachievement.Time for adult learning, expressed as active professional learning communities, willexist within the school day.RELATIONSHIPSA baseline for the percent of teachers with less than three years of experience whoreport impact of a professional learning community on their work environment will beestablished.Improvement will be noted on the North Carolina Teacher Working Conditions Survey(two-year outcome).NC State Board of Education21st Century professionalsWCPSS Strategic Directive TwoRetain, Recruit, and Train High QualityEmployeesGoal 3: Ensure that district leaders have the understanding and capacityto create healthy schools and a healthy environment for supportingthe retention of high quality employees.RESULTSThe employee retention rate will increase.Employee exit surveys citing working conditions as a reason for leaving will decreasefrom the previous year.All schools will have at least 70 percent of their staff completing the NC Teacher WorkingConditions Survey (two-year outcome).PROCESSESThere will be evidence that school and central services leaders throughout the yearhave routinely reviewed retention data and taken action if needed.There will be evidence that leaders have routinely reviewed the support provided toInitially Licensed Teachers by mentor teachers and taken action if needed.Training to develop and support leadership skills at all levels will be developed.Leadership training for succession planning will be developed.<strong>School</strong> Improvement <strong>Plan</strong>s will refl ect appropriate data from the NC Teacher WorkingConditions Survey.RELATIONSHIPSThe trend line for the staff completing the NC Teacher Working Conditions Survey willbe positive (two-year outcome).Data from the NC Teacher Working Conditions Survey will indicate a positive trend onindicators that most affects teachers’ willingness to keep teaching at their school (twoyearoutcome).The current 360 survey completed for principals will be expanded to include the Superintendent,the Superintendent’s Leadership Team, and selected central services staff.34
<strong>Wake</strong> <strong>County</strong> <strong>Public</strong> <strong>School</strong> <strong>System</strong> Strategic Improvement <strong>Plan</strong> 2006-2009NC State Board of Education21st century systemsLeadership for innovationWCPSS Strategic Directive ThreeDevelop and implement systems and organizationalstructures to support schools, ensure accountability,and engage the community.Goal: Design a work system that is responsive, accountable, and collaborativewith all stakeholders and that is focused on improving studentachievement.NC State Board of Education21st century systemsWCPSS Strategic Directive Four:Expand fiscal accountability.Goal: Effectively and effi ciently leverage human and fi nancial resourcesto improve student learning and build trust within the broader community.RESULTSEstablish baseline data of schools reporting support from central services and showimprovement.Increase the percent of stakeholder representatives reporting a greater understandingof issues.Implement a central services organizational structure that supports the superintendent’sstrategic directives.PROCESSES<strong>Plan</strong> and hold periodic Superintendent’s Advisory Council Summits.Develop and implement a process for schools to provide feedback to central servicesconcerning the quality and timeliness of services provided.Document evidence of long-range planning in key processes.RELATIONSHIPSStakeholder representatives will report that their perspectives on is sues are heard.On an annual survey senior management reports that they are better informed of keyissues and perspectives.On an annual survey senior management reports that they are aneffective team.On an annual survey senior management reports that their time is utilized effectively.RESULTSEstablish the role of the Chief Business Offi cer with a highly qualifi ed candidate employedin the position.Improve fi nancial reporting to the Board of Education and the Finance Committee.Internal audit reports will refl ect minimal risk to the system.External audit reports will affi rm the <strong>Wake</strong> <strong>County</strong> <strong>Public</strong> <strong>School</strong> <strong>System</strong> as a fi scallysound entity.The <strong>2007</strong>-20<strong>08</strong> Superintendent’s <strong>Plan</strong> for Student Success will address the Goal 20<strong>08</strong>and the Superintendent’s strategic directives.PROCESSESBudget manager initial certifi cation training requirements will be reviewed and increasedas necessary.Required continuing training for existing budget managers to maintain budget managercertifi cation will be designed, developed and implemented.Internal audit fi ndings will be used to determine areas for additionalbudget manager training and additional fi nance procedures.A process for reviewing fi nancial policies for applicability and effectiveness will be developedin order to make necessary recommendations to the Board of Education.Recommendations from the Summerford Accountancy fraud vulnerability audit will bereviewed, implemented and monitored.RELATIONSHIPSFinancial presentations, reports and information will be provided and made available tostakeholder and community groups.Meetings will be regularly held with key members of the Superintendent’s LeadershipTeam throughout the year to discuss fi scal implications.35FY <strong>2007</strong>-<strong>08</strong> <strong>Plan</strong> for Student Success
<strong>Wake</strong> <strong>County</strong> <strong>Public</strong> <strong>School</strong> <strong>System</strong> Strategic Improvement <strong>Plan</strong> 2006-2009ADMINISTRATIVE SERVICES DIVISIONWCPSS Mission: The <strong>Wake</strong> <strong>County</strong> <strong>Public</strong> <strong>School</strong> <strong>System</strong> will educateeach student to be responsible and productive citizens who can effectivelymanage future challenges.Superintendent’s Mission: To create and maintain systems with sufficient resources for establishing a collaborative, inclusive and trustingenvironment for all stakeholders and for providing high quality learningexperiences for each student to ensure success in the 21st century.Area Superintendent’s and Principal’sfeedback.Retain, Recruit, and Train HighQuality EmployeesQuarterly meetings with principals andarea superintendents to provide supportand key information.Strategic Directive #2Superintendent’s Vision: A community of caring stakeholders (parents,teachers, administrators, and staff) will successfully work collaborativelywith support from the broader community to ensure that every child educatedin the <strong>Wake</strong> <strong>County</strong> <strong>Public</strong> <strong>School</strong> <strong>System</strong> graduates on time, preparedfor the future.DIVISION MISSION:The Mission of the Administrative Services Division is to provideand support quality resource management systems.Goal:• Ensure that district leaders have the understanding and capacity tocreate healthy schools and a healthy environment for supporting theretention of high quality employees.Division/Department Goal(s):2.1 Use employee retention and exit data to drive improvements tooverall retentionFocus on Teaching and Learning Strategic Directive #1IndicatorsEmployee exit forms, interviews, andrates.Desired OutcomesReduction of employee turnover.Goals:• Ensure that school improvement planning processes in all schools arerelevant and incorporate continuous improvement practices.• Ensure that central services departments and divisions support teachingand learning appropriately.2.2 Apply continuous improvement concepts to recruitmentprocess.IndicatorsRecruitment costs and results.Desired OutcomesContainment of recruitment costs whilemeeting the system needs for new employees.Division/Department Goal(s):1.1 Provide information and support to principals, school staff, andarea superintendents in a timely and accurate manner.IndicatorsPrincipals and school staff feedback.Desired OutcomesMeet the information and support needs ofschool administrators.36
<strong>Wake</strong> <strong>County</strong> <strong>Public</strong> <strong>School</strong> <strong>System</strong> Strategic Improvement <strong>Plan</strong> 2006-2009ADMINISTRATIVE SERVICES DIVISION (continued)Develop and implement systems andorganizational structures to supportschools, ensure accountability, andengage the communityStrategic Directive #3Goal:• Design a work system that is responsive, accountable, and collaborativewith all stakeholders and that is focused on improving studentachievement.Division/Department Goal(s):3.1 Compare budget to actual fi nancial projections of school systemstatus throughout the fi scal year via quarterly meetings with Chiefs,Area Superintendents, and Fiscal Administrators.IndicatorsCompare budget to actual.Desired OutcomesImproved resource utilization acrosssystem.Expand Fiscal Accountability Strategic Directive #44.2 Review and enhancement of internal controls.IndicatorsFraud prevention & detection reportingutilizationEvidence of review and action uponreview.Desired OutcomesImplementation of ACL Fraud Software.Use of internal audit reports to drive improvementsto internal controls.4.3 Set tone at the top regarding integrity, honesty, accuracy, and thestandard of ethical behavior expected in the WCPSS workplace.IndicatorsDesired OutcomesEvidence of communication to staff andstakeholders.Widespread staff awareness of systemexpectations and norms.4.4 Engage WCPSS stakeholders vis-a-vis improved budget/fi nancialinformation formats for the public.IndicatorsDesired OutcomesInvolvement of stakeholders in process ofdeveloping new fi nancial/budget reportingmaterials for presentation to generalpublic.Improved public awareness of WCPSSbudget and fi nancial data.Goal:• Effectively and effi ciently leverage human and fi nancial resources toimprove student learning and build trust within the broader community.Division/Department Goal(s):4.1 Improve knowledge and application by Budget Managers of policyand procedure.IndicatorsInternal Audit report fi ndings & GeneralFeedback.Desired OutcomesEnhancements to Budget Manager training& certifi cation process including additionof an ethics component.37FY <strong>2007</strong>-<strong>08</strong> <strong>Plan</strong> for Student Success
<strong>Wake</strong> <strong>County</strong> <strong>Public</strong> <strong>School</strong> <strong>System</strong> Strategic Improvement <strong>Plan</strong> 2006-2009AUXILIARY SERVICES DIVISIONWCPSS Mission: The <strong>Wake</strong> <strong>County</strong> <strong>Public</strong> <strong>School</strong> <strong>System</strong> will educateeach student to be responsible and productive citizens who can effectivelymanage future challenges.Superintendent’s Mission: To create and maintain systems with sufficient resources for establishing a collaborative, inclusive and trustingenvironment for all stakeholders and for providing high quality learningexperiences for each student to ensure success in the 21st century.Superintendent’s Vision: A community of caring stakeholders (parents,teachers, administrators, and staff) will successfully work collaborativelywith support from the broader community to ensure that every child educatedin the <strong>Wake</strong> <strong>County</strong> <strong>Public</strong> <strong>School</strong> <strong>System</strong> graduates on time, preparedfor the future.DIVISION MISSION:The mission of the Auxiliary Services Division is to provide qualityfacilities and support services to ensure safe, healthy, inviting andoptimal learning environments.Focus on Teaching and Learning Strategic Directive #1IndicatorsProvide nutritious snacks that meetWinner’s Circle criteria in all schools.Expand the EPA Indoor Air Quality Toolsfor <strong>School</strong>s educational program forteachers and students, as well as maintenancepersonnel.Log of mold work order calls into Maximo.Number of emergency calls and IAQ callsare decreasing.Correlation of recycling education resourcesto the Standard Course of Studyfor students in all grades.<strong>Plan</strong> bus routes early and practice prior toschool opening. Investigate reasons forlate buses and make adjustments.Develop growth management recommendationsthat enable all schools to provideappropriate instructional spaces.Desired OutcomesSnack, by nutritional analysis, meet Winner’sCircle criteria. All foods served incafeterias will comply with Board WellnessPolicy, 5125. Sales volume compared tothe same month last year.Develop and establish organized IAQTools for schools educational program.Maximo to produce response times, projectcosts and completions.Increase the number of schools with anorganized recycling education programby 50%.Buses on-time greater than 95% of thetime. Increase satisfaction from schooladministrators and parents.The number of schools lacking space forart, music, and technology instruction willdecrease.Goals:• Ensure that school improvement planning processes in all schools arerelevant and incorporate continuous improvement practices.• Ensure that central services departments and divisions support teachingand learning appropriately.Division/Department Goal(s):1.1 Increase learning time for students.1.2 Improve quality of learning environment in schools.Retain, Recruit, and Train HighQuality EmployeesStrategic Directive #2Goal:• Ensure that district leaders have the understanding and capacity tocreate healthy schools and a healthy environment for supporting theretention of high quality employees.Division/Department Goal(s):2.1 Decrease the number and severity of accidents involving AuxiliaryServices’ employees.38
<strong>Wake</strong> <strong>County</strong> <strong>Public</strong> <strong>School</strong> <strong>System</strong> Strategic Improvement <strong>Plan</strong> 2006-2009AUXILIARY SERVICES DIVISION (continued)2.2 Decrease the gap between required and acquired skills for AuxiliaryServices’ employees, within current budget.IndicatorsLost work days as reported by Workers’Compensation data.Provide enhanced management trainingfor potential CNS managers.Establish a training program to promotethe “build it right” philosophy; emphasizethe use of new schools and prototypeschools as teaching tools.Develop apprenticeship program in conjunctionwith NC Department of Labor.Desired OutcomesReduce by 10% the number of work dayslost due to work place injuries.Survey staff for feedback on in-servicetraining. Have 15 trained managers inplace by July <strong>2007</strong>.Conduct a survey at the end of trainingprograms done this fi scal year to gaugeincrease in customer understanding.Certifi cation by NC Department of Laborfor maintenance multi-tasked employees.Advancement in building automation Preventative maintenance compliancesystems, implementation of system-wide rates, % of schools with designed preventativemaintenance programs, % ofprevent maintenance programs, inventorymajor equipment assets and establishmentof multi-year replacement plans. % of replacement plans established.schools where inventory is complete, andCustodial focus team, conduct custodial Implementation of focus team recommendation,establishing published standards.assessment via a 3rd party and establishstandards and quality assuranceprocesses.Collection and processing of magnet and Timeline presented to BOE in Septembercalendar options for families.2006 will be met.Expand Fiscal Accountability Strategic Directive #4Develop and implement systems andorganizational structures to supportschools, ensure accountability, andengage the communityStrategic Directive #3Goal:• Design a work system that is responsive, accountable, and collaborativewith all stakeholders and that is focused on improving studentachievement.Division/Department Goal(s):3.1 Operate school buildings effectively and effi ciently.Goal:• Effectively and effi ciently leverage human and fi nancial resources toimprove student learning and build trust within the broader community.Division/Department Goal(s):4.1 Provide high quality, high value services to schools and students.IndicatorsPercentages by dollar amount and numberof changes to construction contracts.Route buses to achieve capacity limitsand maximum budget rating.Desired OutcomesReduction by 20% from 2004 baselineon new schools and renovation/additionprojects.Budget rating of 100%.IndicatorsPercentage of contracts and purchasefrom MBE contractor/suppliers by dollarvalue and number.Desired OutcomesEstablish baseline data. Interlocal agreementwith City of Raleigh and <strong>Wake</strong><strong>County</strong>.39FY <strong>2007</strong>-<strong>08</strong> <strong>Plan</strong> for Student Success
<strong>Wake</strong> <strong>County</strong> <strong>Public</strong> <strong>School</strong> <strong>System</strong> Strategic Improvement <strong>Plan</strong> 2006-2009COMMUNICATIONS DIVISIONWCPSS Mission: The <strong>Wake</strong> <strong>County</strong> <strong>Public</strong> <strong>School</strong> <strong>System</strong> will educateeach student to be responsible and productive citizens who can effectivelymanage future challenges.Superintendent’s Mission: To create and maintain systems with sufficient resources for establishing a collaborative, inclusive and trustingenvironment for all stakeholders and for providing high quality learningexperiences for each student to ensure success in the 21st century.Superintendent’s Vision: A community of caring stakeholders (parents,teachers, administrators, and staff) will successfully work collaborativelywith support from the broader community to ensure that every child educatedin the <strong>Wake</strong> <strong>County</strong> <strong>Public</strong> <strong>School</strong> <strong>System</strong> graduates on time, preparedfor the future.IndicatorsDevelop and implement communicationstraining program for school-basedadministrators.Integrate “teaching and learning” focusinto all Communication Department mediachannels in order to raise visibility andhelp shape the perception of our corebusiness.Retain, Recruit, and Train HighQuality EmployeesDesired OutcomesProvide more than 12 separate trainingseminars in the areas of media relations,web development and customer service.Demonstrate support of this strategic pointthrough the system’s website, streamingvideos, The <strong>School</strong> Connection, internaland external newsletters, media relationsand annual report.Strategic Directive #2DIVISION MISSION:To create and execute communication strategies which advance thegoals of the system; enhance community support and understandingof public education and help achieve system goals.Focus on Teaching and Learning Strategic Directive #1Goal:• Ensure that district leaders have the understanding and capacity tocreate healthy schools and a healthy environment for supporting theretention of high quality employees.Division/Department Goal(s):2.1 To work with the Human Resources Department in enhancing thesystem’s efforts and image as we retain and recruit qualifi ed employees.Goals:• Ensure that school improvement planning processes in all schools arerelevant and incorporate continuous improvement practices.• Ensure that central services departments and divisions support teachingand learning appropriately.IndicatorsProvide support to Central Service Administratorsin promoting WCPSS as anemployer of choice.Desired OutcomesRefresh and redesign recruitment DVD,web-based employment applicationprocess, media relations and externalcommunication channels.Division/Department Goal(s):1.1 To use existing media which fosters a better understanding of the<strong>School</strong> Improvement <strong>Plan</strong> (SIP) process.40
<strong>Wake</strong> <strong>County</strong> <strong>Public</strong> <strong>School</strong> <strong>System</strong> Strategic Improvement <strong>Plan</strong> 2006-2009COMMUNICATIONS DIVISION (continued)Develop and implement systems andorganizational structures to supportschools, ensure accountability, andengage the communityStrategic Directive #3Goal:• Design a work system that is responsive, accountable, and collaborativewith all stakeholders and that is focused on improving studentachievement.Division/Department Goal(s):3.1 Create two-way communication vehicles which inform, engage andhelp shape the public’s perceptions of public education in <strong>Wake</strong><strong>County</strong>.IndicatorsDevelop and execute a strategic communicationsstrategy to better inform thepublic regarding the fi scal accountabilitymeasures in place within WCPSS and demonstrateits stewardship of taxpayer funds.Desired OutcomesSpecial “budget” publication produced;web-based budget resource centers,internal and external media materials tobetter explain the budgeting and fundingprocess.IndicatorsDevelop an integrated communication strategyto engage multiple internal and externalaudiences in order to build understandingof, and support for the <strong>Wake</strong> <strong>County</strong> <strong>Public</strong><strong>School</strong> <strong>System</strong>Desired OutcomesDemonstrate through multiple WCPSSproduced media, a systems approachto communicating key organizationalmessages to both internal and externalstakeholder groups.Expand Fiscal Accountability Strategic Directive #4Goal:• Effectively and effi ciently leverage human and fi nancial resources toimprove student learning and build trust within the broader community.Division/Department Goal(s):4.1 Work within existing resources to align and maximize the division’sproductivity and strengthen our fi nancial management processes.41FY <strong>2007</strong>-<strong>08</strong> <strong>Plan</strong> for Student Success
<strong>Wake</strong> <strong>County</strong> <strong>Public</strong> <strong>School</strong> <strong>System</strong> Strategic Improvement <strong>Plan</strong> 2006-2009INSTRUCTIONAL SERVICES DIVISIONWCPSS Mission: The <strong>Wake</strong> <strong>County</strong> <strong>Public</strong> <strong>School</strong> <strong>System</strong> will educateeach student to be responsible and productive citizens who can effectivelymanage future challenges.Superintendent’s Mission: To create and maintain systems with sufficient resources for establishing a collaborative, inclusive and trustingenvironment for all stakeholders and for providing high quality learningexperiences for each student to ensure success in the 21st century.Superintendent’s Vision: A community of caring stakeholders (parents,teachers, administrators, and staff) will successfully work collaborativelywith support from the broader community to ensure that every child educatedin the <strong>Wake</strong> <strong>County</strong> <strong>Public</strong> <strong>School</strong> <strong>System</strong> graduates on time, preparedfor the future.IndicatorsPrograms (i.e. Smaller Learning Communities,AVID, Positive Behavior Support,etc.)Program EvaluationsDesired OutcomesList of programs and evidence of supportProgram Evaluation Results (i.e. climatesurvey, student achievement, etc.)1.2 Provide data on school performance and climate in support of theHealthy <strong>School</strong>s review and the school improvement process.Provide data to support the Healthy <strong>School</strong>s review process andidentify needs of individual schools and strategies to improve thehealth of the school.IndicatorsDesired OutcomesDIVISION MISSION:The mission of the Instructional Services Division is to work collaborativelywith our customers to promote and support effectiveinstruction for all students.Performance data summariesAlignment of ISD resources with theHealthy <strong>School</strong>s ProcessTeacher and parent survey summariesImproved achievement results (i.e. End ofCourse, End of Grade, SAT, GraduationRates) Alignment of resources and resultsImproved satisfactionFocus on Teaching and Learning Strategic Directive #1<strong>School</strong> Improvement Status ReportsCorrelation between plan and results1.3 Provide leadership and support to schools to promote success forstudents with disabilities.Goals:• Ensure that school improvement planning processes in all schools arerelevant and incorporate continuous improvement practices.• Ensure that central services departments and divisions support teachingand learning appropriately.Division/Department Goal(s):1.1 Identify, promote and implement programs that support a positive,21st century learning environment in the classroom.IndicatorsDevelopment and implementation of acomprehensive training model for teachersand administrators. Implement IDEAchangesImplement special education managementsoftware (StARS)Conduct meetings of the Special EducationParent Advisory Committee, SpecialEducation Teachers Advisory Committee,and Special Education Principal/AssistantPrincipal Advisory CommitteeConduct compliance auditsDesired OutcomesAcademic progress of students with disabilities(Results)Decreased requests for outside mediation.(Results, Process)Satisfaction of users Academic progressof students with disabilities (Results)Increased participation of stakeholders.(Relationships)Reduced exceptions on audits.42
<strong>Wake</strong> <strong>County</strong> <strong>Public</strong> <strong>School</strong> <strong>System</strong> Strategic Improvement <strong>Plan</strong> 2006-20091.4 Provide training opportunities for staff that support a positive, 21stcentury learning and working environment.IndicatorsSupport of Professional Learning CommunitiesOutcome based models in counseling andpsychological servicesCommunity partners, Parent trainingmodel, Hispanic/Latino Outreach, CTE– BELC and Business AlliancesDesired OutcomesPLC Activity (Process)Evidence of learning occurring within theschool day (Process, Results)PLC Activity (Process)Evidence of learning occurring within theschool day (Process, Results)Evidence of participation (Process)Evidence of improved working conditions.(Relationships)1.5 Provide standards, curriculum, and best practices that optimize studentlearning and teacher and principal effectiveness. Provide opportunitiesto identify and share 21st century instructional practices acrossschools.INSTRUCTIONAL SERVICES DIVISION (continued)Retain, Recruit, and Train HighQuality Employees Strategic Directive #2Goal:• Ensure that district leaders have the understanding and capacity tocreate healthy schools and a healthy environment for supporting theretention of high quality employees.Division/Department Goal(s):2.1 Develop and implement induction and training systems that promoteprofessional growth, improve job satisfaction, enhance leadership capacity,and support best practices.IndicatorsTraining schedule (e<strong>School</strong>s calendars)Desired OutcomesNumber of participantsFeedback surveys/dataIndicatorsTraining models (i.e. Standards-Basedgrading, 1.5 Book studies, Walk-Throughs, <strong>School</strong> Improvement <strong>Plan</strong>ningProcess, etc.)Process for identifi cation of best practicesDesired OutcomesPositive participant survey results.Best Practices and evidence of sharing1.6 Provide information about system instructional programs and initiatives,and information regarding school and system performance,and individual student achievement.IndicatorsMagnet Program Documents preparedand disseminatedCurriculum documents provided to staff,schools, and parentsStudent reportingProgram evaluation reportsSIP (<strong>School</strong> Improvement <strong>Plan</strong>s)Desired OutcomesDocuments, increased communicationDocuments, increased communicationStudent Achievement ResultsProgram Evaluation ResultsSIP updatesTraining for teacher leaders (IRTs, DepartmentChairs, Teacher Leaders, StaffDevelopment Contacts, etc.Training for school administrators (Data/<strong>School</strong> Improvement, Standards-BasedGrading, Title I <strong>School</strong>-wide projects,Leadership Training (Facilitative Leadership,Covey, FISH, Finance, <strong>School</strong>s)Training model to support career pathwaysTeacher Education Program Collaborations(Meredith College, Peace College,NCSU)Training agendaEvaluation and survey resultsIncrease in HQ staff development asreported through e<strong>School</strong>sPrograms offeredNumber of participantsFeedback surveysNumber of participants. Survey Results.Program descriptionsTeacher/<strong>School</strong> participation rates2.2 Implement data based decision-making to ensure continuous improvementin job satisfaction, working conditions and support systems.43FY <strong>2007</strong>-<strong>08</strong> <strong>Plan</strong> for Student Success
<strong>Wake</strong> <strong>County</strong> <strong>Public</strong> <strong>School</strong> <strong>System</strong> Strategic Improvement <strong>Plan</strong> 2006-2009INSTRUCTIONAL SERVICES DIVISION (continued)Indicators<strong>System</strong> staff survey, input from staff to supervisor.Principal and teacher satisfactionwith Quick Place.Desired Outcomes360º surveys showing increased satisfaction.Evidence of issues addressed bysupervisor2.3 Develop data systems to assess needs and enhance teacher quality,measure effectiveness of induction programs, training and professionaldevelopment, and manage teacher renewal credit data.Goal:• Design a work system that is responsive, accountable, and collaborativewith all stakeholders and that is focused on improving studentachievement.3.1 Provide data of school performance and climate in support of Health<strong>School</strong>s Review and the <strong>School</strong> Improvement Process. Providedata to support the Healthy <strong>School</strong>s review process and identifyneeds of individual schools and strategies to improve the health ofthe school.IndicatorsDesired OutcomesIndicatorsDesired OutcomesStaff development follow-up surveysManagement of teacher renewal creditdataEffectiveness Index expandede<strong>School</strong>s Solutions evaluation summaries/resultsAccuracy and accessibility of renewalcredit dataUse of Effectiveness Index data2.4 Provide support and professional development opportunities thatenhance staff expertise and develop 21st Century Leadership skillsat all levels to work collaboratively with students, parents, and colleaguesto foster student success.IndicatorsStaff development opportunities<strong>School</strong> Improvement Process trainingClassroom Walk-ThroughsPLCs established at all levelsDevelop and implement systems andorganizational structures to supportschools, ensure accountability, andengage the communityDesired OutcomesPositive survey results.NCLB Staff Development Annual Reportwith increased percentage of HQ staffdevelopment<strong>School</strong> improvement plansCompleted checklists/discussion notesPLC Survey ResultsStrategic Directive #3Performance data summariesTeacher and Parent survey summariesNeeds and strategies identifi ed<strong>School</strong> Improvement Status Reports<strong>School</strong> Improvement Status Reports<strong>School</strong> Improvement Status Reports3.2 Develop and implement systems that accelerate the learning ofstudents at all achievement levels, maximize instructional time, andpromote decision-making process.Indicators<strong>School</strong> Improvement ProcessSuccessful transition of data entry forTitle IE&R updates to schools and other stakeholdersCompletion of projects and reports relativeto Goal 20<strong>08</strong>Development of grant proposalsImplementation of automated grantsystemsDesired OutcomesFeedback from principals and schoolimprovement team membersTitle I Data ReportsImproved student achievement (Results)Improved student achievement (Results)Grant Awards3.3 Promote increased student participation in program magnet schoolsthrough the development and implementation of unique programenhancements, including identifying and securing necessary supportfrom all divisions.44
<strong>Wake</strong> <strong>County</strong> <strong>Public</strong> <strong>School</strong> <strong>System</strong> Strategic Improvement <strong>Plan</strong> 2006-2009INSTRUCTIONAL SERVICES DIVISION (continued)IndicatorsStudent participation in program magnetsDesired OutcomesIncreased student participation in magnetsImproved student achievement3.4 Develop programs and assign resources to support the growth andhealth of all schools.3.5 SBOE #5 North Carolina <strong>Public</strong> <strong>School</strong>s will be governed andsupported by 21st Century <strong>System</strong>s.IndicatorsModels developed (ALP, Challenged<strong>School</strong>s, Q4 ALL, etc.)Allocation of resourcesAvailable professional developmentProcedures are in place to support andsanction schools that are not meetingState standards for student achievementModelsDesired OutcomesAllocated resourcesIncreased Professional Development opportunitiesImplementation of procedures3.6 Use systematic processes for getting feedback from staff about jobsatisfaction, work conditions, and support systems.IndicatorsDesired Outcomes<strong>System</strong> staff surveyInput from staff to supervisorPrincipal and teacher satisfaction withQuick PlaceSurvey Results360 Survey ResultsFeedback3.7 Develop, support, and promote technology tools that reduce paperwork,manage student data, and facilitate student assessment, curriculumplanning, and classroom management.IndicatorsImplementation of Instructional Management<strong>System</strong>s (eMARC, StARS, On-Line<strong>School</strong> Improvement <strong>Plan</strong>ning Documents,etc.)Student assessment item bank used byteachersCurriculum resources identifi ed, implemented(Instructional calendars, lessonplans, Focus lessons, assessments, GoalObjective Template)Desired OutcomesTeacher and Principal FeedbackNumber of web resource users (Process)Number of web resource users (Process)Reduction in e<strong>School</strong>s Solutions errors Evidence of use (Process)and increase in school-based tracking3.8 Develop and implement a systematic plan to build understandingand support for programs and services.IndicatorsTraining for administrators, teachers, andparentsImplementation of communication planDesired OutcomesParent and teacher response (positive) tostudent reporting model, trainingParent and teacher response (positive) tostudent reporting model, communications3.9 Use a system of continuous improvement to ensure that decisionmakingprocesses are data driven and student focused.IndicatorsDesired Outcomes<strong>School</strong> improvement training/planningprocessSIP updates3.10 Promote student success by supporting the development of thewhole child and collaborating with the school, family, and community.IndicatorsDesired OutcomesImplement outcome based models incounseling and psychological servicesModelsResults45FY <strong>2007</strong>-<strong>08</strong> <strong>Plan</strong> for Student Success
<strong>Wake</strong> <strong>County</strong> <strong>Public</strong> <strong>School</strong> <strong>System</strong> Strategic Improvement <strong>Plan</strong> 2006-2009INSTRUCTIONAL SERVICES DIVISION (continued)Increase in the number of communitypartnersImplement a parent training modelHispanic/Latino outreach (number familycontacts)CTE – BELC and business alliancesNumber of participantsNumber of participantsNumber of family contactsNumber of business partners3.14 Increase school and community involvement to build a consensusof support for magnet school programs.IndicatorsIncreased parent participation in MagnetFair and Open HousesDesired OutcomesIncreased number of viable magnet applications3.11 Provide information about <strong>System</strong> Instructional Programs andInitiatives, and information regarding school and system performance,and individual student achievement.IndicatorsDocuments prepared and disseminated(i.e. magnet schools, curriculum, studentperformance)Program evaluation reports preparedSIP updates on websiteDesired OutcomesDocuments, evidence of disseminationDocuments, evidence of disseminationSIP updates3.15 Establish educational space/equipment standards and developeducational commissioning process.IndicatorsCollaboration with facilities in developingfacility/program assumptions and standardsthat are instructional appropriateDesired OutcomesStaff reviews of facility plansDevelopment and utilization of material/equipment notebookEducational commissioning process3.16 Leadership will guide innovation in North Carolina <strong>Public</strong> <strong>School</strong>s(SBOE#4)3.12 Increase capacity of parents to understand, support, and participate in decisions related to their child’s education.IndicatorsIncreased parent participation in PES,Title I, ESL, Hispanic/Latino outreach,school improvement planning process,etc.Increased parent participation in MagnetFair and Open HousesIncreased enrollment/participation in workshopsand forums for parentsDesired OutcomesIncreased parent participationIncreased parent participationIncreased parent participation3.13 Monitor and disseminate information on the effectiveness of keyinitiatives and progress toward Goal 20<strong>08</strong>.IndicatorsEvaluation model and process developedDesired OutcomesProgram evaluation reports preparedPresentations to Board of EducationIndicatorsCollaboration with community colleges,public and private universities/colleges toprovide enhanced educational opportunitiesCollaboration with parents, students, businesses,education institutions, faith-basedand other community/civic organizationsin making decisions that impact studentsuccess<strong>School</strong> leaders will create a culture thatembraces change and promotes dynamiccontinuous improvement.<strong>School</strong> professionals will collaborate withnational and international partners todiscover innovative transformational strategiesthat will facilitate, change, removebarriers for 21st Century Learning, andunderstand global connections.Desired OutcomesEvidence of collaborationEvidence of collaborationSurvey resultsEvidence of collaboration46
<strong>Wake</strong> <strong>County</strong> <strong>Public</strong> <strong>School</strong> <strong>System</strong> Strategic Improvement <strong>Plan</strong> 2006-2009INSTRUCTIONAL SERVICES DIVISION (continued)3.17 Convey Instructional Services Division (ISD) structural alignmentthrough the development/dissemination of our organizational chart.IndicatorsDevelopment of ISD structureDesired OutcomesISD structureEvidence of disseminationExpand Fiscal Accountability Strategic Directive #4Goal:• Effectively and effi ciently leverage human and fi nancial resources toimprove student learning and build trust within the broader community.4.3 Assess spending and impact on learning.IndicatorsMaximize fi nancial resources to best supportteaching and learningEvaluate and monitor programs andefforts; use data to fi ne-tune efforts foroptimal benefi tDesired OutcomesFinancial reportsStudent Achievement ResultsEvaluationsReferences:Superintendent’s Performance Goals2005-20<strong>08</strong> Instructional Services Strategic Improvement <strong>Plan</strong><strong>Wake</strong> <strong>County</strong> Board of Education Work <strong>Plan</strong>State Board of Education GoalsDivision/Department Goal(s):• 4.1 Assure healthy schools and quality programs by aggressively planningfor rapid growth and changing demographics. Develop programsand assign resources to support the growth and health of all schools,e.g., allotments with ESL at each school. (ISD SD#5)IndicatorsMaximize use of facilities by conversionof targeted traditional-calendar schools toyear-round-calendar schoolsDesired OutcomesAdjust staff development scheduleAdjust procurement of materialsAdjust staffi ng allotmentsRevise timelines4.2 Adhere to more stringent fi scal controls.IndicatorsParticipate in budget trainingContinually monitor and adjust budgetsParticipate in quarterly reviewsWork with fi scal administrator to providejustifi cations for budget requests andexpendituresDesired OutcomesBudget training rosterBudget documentsQuarterly reviewsBusiness cases47FY <strong>2007</strong>-<strong>08</strong> <strong>Plan</strong> for Student Success
<strong>Wake</strong> <strong>County</strong> <strong>Public</strong> <strong>School</strong> <strong>System</strong> Strategic Improvement <strong>Plan</strong> 2006-2009TECHNOLOGY SERVICES DIVISIONWCPSS Mission: The <strong>Wake</strong> <strong>County</strong> <strong>Public</strong> <strong>School</strong> <strong>System</strong> will educateeach student to be responsible and productive citizens who caneffectively manage future challenges.Superintendent’s Mission: To create and maintain systems with sufficient resources for establishing a collaborative, inclusive and trustingenvironment for all stakeholders and for providing high quality learningexperiences for each student to ensure success in the 21st century.Superintendent’s Vision: A community of caring stakeholders (parents,teachers, administrators, and staff) will successfully work collaborativelywith support from the broader community to ensure that everychild educated in the <strong>Wake</strong> <strong>County</strong> <strong>Public</strong> <strong>School</strong> <strong>System</strong> graduates ontime, prepared for the future.IndicatorsEnsure prompt and effi cient responsesto service calls placed to the Help Deskthrough current methodologies and supportproceduresAfford opportunities for TSD staff toincrease their skill sets to more effectivelyperform their dutiesMonitor user applications to ensure thatproduction applications meet standardsCollaborate with schools to replace oldestdesktop computers with new onesDesired OutcomesStatistics gathered and evaluated toestablish baseline response times forspecifi c types of callsTraining opportunities, expected impact,and participation of TSD staff membersdocumentedStandards and review process documentedStatistics gathered on units replacedDIVISION MISSION:The Mission of the Technology Services Division is to provide thesystems and technology support to help teachers teach and learnerslearn.Focus on Teaching and Learning Strategic Directive #1Goal:• Ensure that school improvement planning processes in all schools arerelevant and incorporate continuous improvement practice.• Ensure that central services departments and divisions support teachingand learning appropriately.Division/Department Goal(s):1.1 Maintain current technology and ensure effi cient and effectivetransitions of new applications to support schools and promoteteaching and learning.Retain, Recruit, and Train HighQuality Employees Strategic Directive #2Goal:• Ensure that district leaders have the understanding and capacity tocreate healthy schools and a healthy environment for supporting theretention of high quality employees.Division/Department Goal(s):2.1 Recognize and communicate the value of the effort and commitmentof TSD staff.IndicatorsMaintain accurate and up-to-date jobdescriptions for each TSD positionDesired OutcomesAll TSD job descriptions reviewed/modified; desk procedure established for eachemployee48
<strong>Wake</strong> <strong>County</strong> <strong>Public</strong> <strong>School</strong> <strong>System</strong> Strategic Improvement <strong>Plan</strong> 2006-2009TECHNOLOGY SERVICES DIVISION (continued)Review all TSD positions and recommendadjustments as needed to ensure both thepositions and the organization of the divisionaccurately refl ect responsibilities andmarket trendsPromote TSD divisional and individualstaff accomplishments to WCPSS andexternal entities as appropriateEnsure establishment and use of internalcommunication methods to improve timelydivision-wide awareness of relevant itemsand allow bi-directional inputTSD positions mapped to industry-standarddescriptions; internally consistentrelative placement scale defi ned forcomparisons with external market trendsand researchTSD employees recommended for districtrecognition; staff work product informationcommunicated to district leadershipRegular staff meetings conducted; TSDBlackboard site maintainedEstablish and ensure alignment of allapplications with a district technical architectureplanMaintain network infrastructure to supportprojected district needsFive-year technical architecture plandevelopedInternet bandwidth increased; electronicmonitoring extended to all major applications;portal access to essential applicationsplanned and deployment begun3.2 Monitor, assess, and enhance the quality and effectiveness of communicationswith all WCPSS stakeholders with emphasis on preplanningfor all projects and initiatives.IndicatorsDesired OutcomesDevelop and implement systems andorganizational structures to supportschools, ensure accountability, andengage the communityStrategic Directive #3Goal:• Design a work system that is responsive, accountable, and collaborativewith all stakeholders and that is focused on improving studentachievement.Division/Department Goal(s):3.1 Serve as the technology services provider for WCPSS, providingreliable and secure data applications and systems through standardizedand centralized installation and support.Develop and implement a comprehensiveTSD Communications <strong>Plan</strong> utilizingexisting resources and options to moreeffectively communicate both within TSDand with TSD customersDesign and regularly review all TSDcommunications as well as any lapses incommunication to ensure adherence toCommunications <strong>Plan</strong> including timeliness,consistent focus, and understandableverbiageInstitute processes to maximize interpersonalcommunications within TSDBlackboard site used for TSD internalcommunications; alerts to user communitystandardized; communication concerningproject deliverables and support to endusers enhancedStakeholders receive understandablecommunication prior to changes beingmade in systems or processes; currentuser documentation audited to ensure it iscorrect and appropriately presentedRegular scheduled meetings held withstaff groups; processes developed for providingessential information to new TSDemployees/contractorsIndicatorsEstablish documented standards and reviewprocesses for all integrated applicationsand contracted servicesDesired OutcomesService Level Agreements (SLAs) for integratedapplications established; relatedmetrics defi ned, collected, and regularlyreviewed49FY <strong>2007</strong>-<strong>08</strong> <strong>Plan</strong> for Student Success
<strong>Wake</strong> <strong>County</strong> <strong>Public</strong> <strong>School</strong> <strong>System</strong> Strategic Improvement <strong>Plan</strong> 2006-2009TECHNOLOGY SERVICES (continued)Expand Fiscal Accountability Strategic Directive #4Goal:• Effectively and effi ciently leverage human and fi nancial resources toimprove student learning and build trust within the broader community.Division/Department Goal(s):4.1 Continue to practice, enhance, and expect standardized fi scal managementprocedures/practices centered on accountability.IndicatorsEnsure all TSD budget managers are certified and follow purchasing guidelinesDevelop and monitor fi scal processes andprocedures to ensure accountabilityMonitor dates and deliverables to ensuresuccessful project completionDesired OutcomesAll TSD budget managers certifi ed;purchasing guidelines posted on TSDBlackboard siteE-rate documents fi led timely and correctly;TSD procedures for staff on TSDBlackboard site; accurate comprehensiveinventory of school computers enabledCode moves and procedures monitored;project commitments and deliverablesregularly reviewed50
Organization Charts<strong>Wake</strong> <strong>County</strong> Board ofEducationOperating Budget: $1,003,051Instructional ServicesResourcesMonths of Employment: 6,234.97Operating Budget: $72,127,587SuperintendentInternal AuditAdministrative ServicesResourcesMonths of Employment: 2,278.56Operating Budget: $17,841,943CommunicationsResourcesMonths of Employment: 486.00Operating Budget: $5,706,747<strong>School</strong>sPrincipal - Teachers - StaffResourcesMonths of Employment: 167,673.62Operating Budget: $887,831,810StudentsArea SuperintendentsResourcesMonths of Employment: 276.00Operating Budget: $1,900,643Facilities and OperationsResourcesMonths of Employment: 7,138.49Operating Budget: $138,485,<strong>08</strong>4Technology ServicesResourcesMonths of Employment: 1,056.00Operating Budget: $23,713,326Chief of StaffResources:Months of Employment: 474.00Operating Budget: $8,233,986The <strong>Wake</strong> <strong>County</strong> <strong>Public</strong> <strong>School</strong> <strong>System</strong> is the second largest system in the state and one of the fastest growing districts in the nation. The systemis expected to serve more than 130,000 students. The superintendent functions as the chief administrative offi cer of the school system and as thechief executive offi cer of the Board of Education. The superintendent and his senior leadership team members set system direction, implementpolicy, and manage systemwide operations.51 FY <strong>2007</strong>-<strong>08</strong> <strong>Plan</strong> for Student Success
Organization ChartsChief of StaffTerri CobbChief of StaffRuss SmithSenior DirectorSecurity/InvestigationsVacantSpecial AssistantYear Round <strong>School</strong>sCharles BinghamDirectorTriangle LeadershipAcademyElizabeth ColbertSenior DirectorOCIPDPam BrightDirectorTrainingMazie SmithDirectorTrainingSecurity, Year-Round Education, and Triangle Leadership Academy support the strategic directives and the mission of <strong>Wake</strong> <strong>County</strong> <strong>Public</strong> <strong>School</strong><strong>System</strong>.52
Organization ChartsAdministrative ServicesDavid NeterChief Business OfficerMark WintersFinance OfficerTerri KimzeySenior DirectorBudgetMaurice BoswellAssistantSuperintendentHuman ResourcesRobyn PresleySenior DirectorAccountingGail ParnellSenior DirectorCompensationServicesMike ChappellSenior DirectorStaffing andOperationsDavid HowellSenior DirectorSalary and LicensureKendra HillSenior DirectorEmployee RelationsJoan KisterSenior DirectorRecruitment andRetentionScott DoolittleSenior DirectorPurchasingCurtis GroganDirectorRisk ManagementChristine FavataDirectorElementary <strong>School</strong>StaffingWilma Jenkins-FlytheDirectorMiddle <strong>School</strong> StaffingCarol JenkinsDirectorPolicy andEntitlementsTeresa Cunningham-BrownDirectorRecruitment andRetentionThe Administrative Services Division is responsible for the human and fi nancial resources of the school system. The departments within the divisioninclude accounting, budget, compensation services, employee relations, human resources, purchasing, and risk management.53 FY <strong>2007</strong>-<strong>08</strong> <strong>Plan</strong> for Student Success
Organization ChartsFacilities and OperationsDon HaydonChief Facilities andOperations OfficerChuck DulaneyAssistant SuperintendentGrowth and <strong>Plan</strong>ningEddy AdamsSenior DirectorTransportation ServicesJoe DesormeauxSenior DirectorMaintenance & OperationsMarilyn MoodySenior DirectorChild Nutrition ServicesMike BurrissAssistant SuperintendentFacilitiesChristina LighthallSenior DirectorLong Range <strong>Plan</strong>ningAlvin McNeillDirectorTransportation ServicesBob BittnerDirectorEnergy & Physical <strong>Plan</strong>tLaurie MonticelloDirector of OperationsChild Nutrition ServicesJyoti SharmaSenior DirectorFacility <strong>Plan</strong>ningSandy EllisDirectorGIS ServicesGreg ClarkDirectorGeneral ServicesKen FullerSenior DirectorConstruction ManagementLaura EvansDirectorGrowth ManagementGary HaithcockDirectorBuildings & GroundsBetty ParkerDirectorReal Estate ServicesGeorge RisingerDirectorGrowth ManagementSneha AminDirectorEnvironmental Health &SafetyMaya VoukDirectorDemographicsThe Auxiliary Services Division provides and maintains facilities that are safe, healthy, and supportive of teaching and learning. Child Nutrition Servicesis responsible for the administration of all <strong>Wake</strong> <strong>County</strong> <strong>Public</strong> <strong>School</strong> <strong>System</strong> programs involving food and nutrition.54
Organization ChartsInstructional ServicesDr. Donna HargensChief Academic OfficerDavid HoldzkomAssistant SuperintendentEvaluation & ResearchNancy BaenenSenior DirectorProgram AccountabilityDr. Bill CarruthersSenior DirectorGrantsBradley McMillenSenior Director<strong>School</strong> AccountabilityDr. Edie PierceSenior DirectorTestingPhyllis SpencerDirectorLocal TestingRichard MurphySenior DirectorSecondary EducationDavid RockefellerDirectorCareer & TechnicalEducationJackie EllisDirectorMiddle <strong>School</strong> ProgramsTeresa PierreDirectorSmaller LearningCommunities GrantDr. Christy FalbaSenior DirectorElementary EducationRuth SteidingerDirectorLiteracy ProgramsJoyce GardnerDirectorAcademically GiftedServicesMargaret HendersonDirectorMagnet Themes &CurriculumTamani AndersonDirectorMagnet Marketing &ResearchDr. Ken BranchSenior DirectorMagnet ProgramsDawn DawsonSenior DirectorFederal/State ProgramsWilli WebbDirectorTitle IDr. Tim HartDirectorESLCynthia KennedySenior Director21 st Century LearningJane ParkerDirectorLibrary MediaMarvin ConnellyAssistant SuperintendentStudent Support ServicesDarryl FisherSenior DirectorPrevention ServicesDr. Carol RahmaniSenior DirectorCounseling & StudentServicesBob StureySenior DirectorSpecial EducationServicesDr. Joanne MedlinDirectorElementary <strong>School</strong>Support ServicesDr. Jeff LarsonDirectorSecondary <strong>School</strong>Support ServicesJudy WilliamsDirectorExtended Learning &Outreach ServicesEric SparksDirector<strong>School</strong> CounselingDr. CynthiaChambleeDirectorProject EnlightenmentCora Mitchell-HayesDirectorAdministrative ServicesNancy SpencerDirectorLegal, Compliance &Related ServicesJanet GodboldDirectorPreschool ServicesThe Instructional Services Division develops, implements, and promotes programs and initiatives which support schools to ensure that studentsmeet or exceed established standard course of study objectives.55 FY <strong>2007</strong>-<strong>08</strong> <strong>Plan</strong> for Student Success
Organization ChartsTechnology ServicesBev WhiteChief Technology OfficerErnie ReddishSenior DirectorDevelopment and<strong>Plan</strong>ningVass JohnsonSenior DirectorNetwork ServicesVacantSenior DirectorInformation <strong>System</strong>sLuAnn HintonSenior DirectorSupport ServicesKathy MaultsbyDirectorBusiness ApplicationsDon OglesbyDirectorVoice ServicesJames AbrahamDirectorOperations andBusiness ContinuityAdam AndruchowitzDirectorStudent Information<strong>System</strong>sLisa BelshaDirectorWeb ServicesLisa LoftonDirectorCustomer SupportThe Technology Services Division provides technology leadership, support, and services for WCPSS while effectively and effi ciently managing district-wideinformation resources and ensuring information security and integrity.56
Organization ChartsCommunicationsThe <strong>Wake</strong> <strong>County</strong> <strong>Public</strong> <strong>School</strong> <strong>System</strong> Communications Department serves as a communications resource for all departments andschools within the system. The department utilizes a variety of strategies and tools to effectively communicate with individuals and groupswho have an interest in our system including the news media, employees, students, parents, newcomers, members of the community andgovernment entities.57 FY <strong>2007</strong>-<strong>08</strong> <strong>Plan</strong> for Student Success
Assignments for Area SuperintendentsEastern - Danny BarnesCentral - Jonibel WillisNorthern - Ann HookerSouth Central - Julye MizelleSouthern - Lloyd GardnerWestern - Kathryn ChontosMagnet <strong>School</strong> Keyϑ Gifted and Talented− Center for Spanish Languageλ Creative Arts and Science‘ Active Learning & Technology♓ Museumsβ International Studiesϖ Year Round <strong>School</strong>σ Leadership Integrated Arts⌧ International Baccalaureate Montessori Community Model University Connection Centennial Campus♣ Center for Leadership & Technology58
Assignments for Area SuperintendentsElementary <strong>School</strong>s:Carver ........................................................................... (919) 365-2680291 Liles-Dean Road, Wendell, NC 27591Forestville Road ........................................................... (919) 266-8487100 Lawson Ridge Rd., Knightdale, NC 27545Harris Creek ϖ .............................................................. (919) 217-51003851 Spring Forest Road, Raleigh, NC 27616Heritage ϖ ...................................................................... (919) 562-60003500 Rogers Lane, <strong>Wake</strong> Forest, NC 27587Hodge Road ϖ ............................................................... (919) 266-85992128 Mingo Bluff Blvd., Knightdale, NC 27545Jones Dairy ϖ ................................................................ (919) 562-61811100 Jones Dairy Road, <strong>Wake</strong> Forest, NC 27587Knightdale ϖ ................................................................. (919) 266-8540109 Ridge Street - Box 309, Knightdale, NC 27545Lockhart ϖ ..................................................................... (919) 266-85251320 N. Smithfi eld Road, Knightdale, NC 27545Rolesville ....................................................................... (919) 554-8686307 S. Main Street, Rolesville, NC 27571Sanford Creek ϖ ............................................................Opens <strong>2007</strong>-<strong>08</strong>701Granite Falls Blvd., Rolesville 27571<strong>Wake</strong> Forest ϑ ............................................................... (919) 554-8655136 W. Sycamore Avenue, <strong>Wake</strong> Forest, NC 27587<strong>Wake</strong>lon ......................................................................... (919) 365-15673409 NC 97 Highway, Wendell, NC 27591Wendell ϑ ....................................................................... (919) 365-26603355 Wendell Blvd., Wendell, NC 27591Zebulon ϑ ...................................................................... (919) 404-3680700 Proctor Street, Zebulon, NC 27597Middle <strong>School</strong>s:East <strong>Wake</strong> ...................................................................... (919) 266-85002700 Old Milburnie Road, Raleigh, NC 27604Heritage ϖ ...................................................................... (919) 562-62043400 Rogers Road, <strong>Wake</strong> Forest, NC 27587River Oaks ..................................................................... (919) 231-56004700 New Bern Avenue, Raleigh, NC 27610EasternDanny Barnes, Area Superintendent<strong>Wake</strong> Forest - Rolesville .............................................. (919) 554-84401800 South Main Street, <strong>Wake</strong> Forest, NC 27587Wendell ......................................................................... Opens <strong>2007</strong>-<strong>08</strong>3409 NC HWY 97, Wendell, 27591Zebulon ϑ ...................................................................... (919) 404-36301000 Shephard <strong>School</strong> Road, Zebulon, NC 27597High <strong>School</strong>s:East <strong>Wake</strong> ...................................................................... (919) 365-26255101 Rolesville Road, Wendell, NC 27591East <strong>Wake</strong> - Arts Education and Global Studies ....... Opens <strong>2007</strong>-<strong>08</strong>East <strong>Wake</strong> - Engineering <strong>System</strong>s .............................. Opens <strong>2007</strong>-<strong>08</strong>East <strong>Wake</strong> - Health Science ......................................... (919) 365-2652East <strong>Wake</strong> - Integrated Technology ............................ (919) 365-2657Knightdale ..................................................................... (919) 217-5350100 Bryan Chalk Lane, Knightdale, NC 27545<strong>Wake</strong> Forest - Rolesville .............................................. (919) 554-8611420 West Stadium Drive, <strong>Wake</strong> Forest, NC 2758759 FY <strong>2007</strong>-<strong>08</strong> <strong>Plan</strong> for Student Success
Assignments for Area SuperintendentsElementary <strong>School</strong>s:Brentwood ..................................................................... (919) 850-87203426 Ingram Drive, Raleigh, NC 27604Brooks ♓ ...................................................................... (919) 881-1350700 Northbrook Drive, Raleigh, NC 27609Conn ‘ ............................................................................ (919) 856-76371220 Brookside Drive, Raleigh, NC 27604Douglas λ ...................................................................... (919) 881-4894600 Ortega road, Raleigh, NC 27609Hunter ϑ ......................................................................... (919) 856-76761018 E. Davie Street, Raleigh, NC 27601Joyner ⌧ − ................................................................. (919) 856-76502300 Noble Road, Raleigh, NC 276<strong>08</strong>Lacy ............................................................................... (919) 881-49201820 Ridge Road, Raleigh, NC 27607Olds ............................................................................ (919) 856-7699204 Dixie Trail, Raleigh, NC 27607Partnership ................................................................... (919) 856-8200601 Devereux Street, Raleigh, NC 27605Powell ϑ ......................................................................... (919) 856-77371130 Marlborough Road, Raleigh, NC 27610River Bend ϖ ................................................................. (919) 431-80103851 Spring Forest Road, Raleigh, NC 27616Root σ ............................................................................ (919) 881-49403202 Northampton Road, Raleigh, NC 27609Stough ........................................................................... (919) 881-49504210 Edwards Mill Road, Raleigh, NC 27612Underwood ϑ ................................................................. (919) 856-76631614 Glenwood Avenue, Raleigh, NC 276<strong>08</strong>Wilburn ϖ ....................................................................... (919) 850-87383707 Marsh Creek Road, Raleigh 27604Wiley β ........................................................................... (919) 856-7723301 St. Mary’s Street, Raleigh, NC 27605Middle <strong>School</strong>s:Daniels ⌧ ...................................................................... (919) 881-48602816 Oberlin Road, Raleigh, NC 276<strong>08</strong>CentralJonibel Willis, Area SuperintendentEast Millbrook ϑ ............................................................ (919) 850-87553801 Spring Forest Road, Raleigh 27616Ligon ϑ ........................................................................... (919) 856-7929706 E. Lenior Street, Raleigh, NC 27601Martin ϑ ......................................................................... (919) 881-49701701 Ridge Road, Raleigh, NC 27613Moore Square Museums Magnet ♓ .......................... (919) 664-5737301 South Person Street, Raleigh, NC 27601High <strong>School</strong>s:Broughton ⌧ ................................................................ (919) 856-7810723 St. Mary’s Street, Raleigh, NC 27605Enloe ⌧ ϑ ................................................................... (919) 856-7918128 Clarendon Crescent, Raleigh, NC 27610Longview (optional) ..................................................... (919) 856-7691318 N. King Charles Road, Raleigh, NC 27610Phillips (optional) ......................................................... (919) 856-77101923 Milburnie Road, Raleigh, NC 2761060
Assignments for Area SuperintendentsElementary <strong>School</strong>s:Apex .................................................................................. (919) 387-2150700 Tingen Road, Apex, NC 27502Baucom ϖ ......................................................................... (919) 387-2168400 Hunter Street, Apex, NC 27502Bugg λ ............................................................................... (919) 250-475<strong>08</strong>25 Cooper Road, Raleigh, NC 27610Combs σ ........................................................................... (919) 233-43002001 Lorimer Road, Raleigh, NC 27606Dillard Drive ...................................................................... (919) 233-42005018 Dillard Drive, Raleigh, NC 27606Fuller ϑ .............................................................................. (919) 856-7625806 Calloway Drive, Raleigh, NC 27610Oak Grove ϖ ..................................................................... (919) 387-449010401 Penny Road, Raleigh, NC 27606Olive Chapel ϖ ................................................................. (919) 387-44401751 Olive Chapel Road, Apex, NC 27502Penny Road ..................................................................... (919) 387-213610900 Penny Road, Cary, NC 27518Poe ................................................................................ (919) 250-4777400 Peyton Street, Raleigh, NC 27610Salem ϖ ............................................................................. (919) 363-28656116 Old Jenks Road, Apex 27523Swift Creek ....................................................................... (919) 233-43205601 Tryon Road, Raleigh, NC 27606Washington ϑ ................................................................... (919) 856-79601000 Fayetteville Street, Raleigh, NC 27601Yates Mill .......................................................................... (919) 233-42445993 Yates Mill Pond Rd., Raleigh, NC 27606Middle <strong>School</strong>s:Apex .................................................................................. (919) 387-2181400 E. Moore Street, Apex, NC 27502Carnage ϑ ......................................................................... (919) 856-76001425 Carnage Drive, Raleigh, NC 27610Centennial .................................................................... (919) 233-42171900 Main Campus Drive, Raleigh, NC 27606South CentralJulye Mizelle, Area SuperintendentDillard Drive ...................................................................... (919) 233-42285200 Dillard Drive, Raleigh, NC 27606Lufkin Road ϖ .................................................................. (919) 387-44651002 Lufkin Road, Apex, NC 27539Mt. Vernon ........................................................................ (919) 233-43135418 Chapel Hill Rd., Raleigh, NC 27607Salem ϖ ............................................................................. (919) 363-18706150 Old Jenks Rd, Apex 27523High <strong>School</strong>s:Apex .................................................................................. (919) 387-22<strong>08</strong>1501 Laura Duncan Road, Apex, NC 27502Athens Drive ..................................................................... (919) 233-40501420 Athens Drive, Raleigh, NC 27606Southeast Raleigh ♣ ........................................................ (919) 856-28002600 Rock Quarry Road, Raleigh, NC 27610<strong>Wake</strong> Eary College of Health and Sciences ............. (919) 212-58002901 Holston Lane, Raleigh, NC 2761062
Assignments for Area SuperintendentsElementary <strong>School</strong>s:Aversboro ...................................................................... (919) 662-23251605 Aversboro Road, Garner, NC 27529Ballentine ϖ ................................................................... (919) 557-11201651 North McLaurin Lane, Fuquay-Varina, NC 27526Barwell Road ϖ ............................................................. (919) 661-54053925 Barwell Road, Raleigh, NC 27610Creech Road ................................................................. (919) 662-2359450 Creech Road, Garner, NC 27529Fuquay-Varina ............................................................... (919) 557-25666600 Johnson Pond Road, Fuquay-Varina, NC 27526Holly Grove ϖ ................................................................ (919) 577-17005329 Cass Holt Road, Holly Springs, NC 27540Holly Ridge .................................................................... (919) 577-1300900 Holly Springs Road, Holly Springs, NC 27540Holly Springs ϖ ............................................................. (919) 557-2660401 Holly Springs Road, Holly Springs, NC 27540Lincoln Heights ........................................................ (919) 557-2587307 Bridge Street, Fuquay-Varina, NC 27526Middle Creek ϖ .............................................................. (919) 773-9555110 Middle Creek Park Ave., Apex, NC 27539Rand Road ϖ ................................................................. (919) 662-2275300 Arbor Greene Drive, Garner, NC 27529Smith ............................................................................. (919) 662-24581101 Maxwell Drive, Raleigh, NC 27603Timber Drive ϖ .............................................................. (919) 773-95001601 Timber Drive, Garner, NC 27529Vance ϖ .......................................................................... (919) 662-247288<strong>08</strong> Old Stage Road, Raleigh, NC 27603Vandora Springs ........................................................... (919) 662-24861300 Vandora Springs Road, Garner, NC 27529West Lake ϖ .................................................................. (919) 662-23004500 West Lake Road, Apex, NC 27539Willow Springs ϖ .......................................................... (919) 557-27706800 Dwight Rowland Road, Willow Springs, NC 27592SouthernLloyd Gardner, Area SuperintendentMiddle <strong>School</strong>s:East Garner ⌧ .............................................................. (919) 662-23396301 Jones Sausage Road, Garner, NC 27529Fuquay-Varina ............................................................... (919) 557-2727109 North Ennis Street, Fuquay-Varina, NC 27526Holly Ridge .................................................................... (919) 577-1335950 Holly Springs Road, Holly Springs, NC 27540North Garner ⌧ ............................................................ (919) 662-2434720 Powell Drive, Garner, NC 27529West Lake ϖ .................................................................. (919) 662-29004600 West Lake Road, Cary, NC 27539High <strong>School</strong>s:Fuquay-Varina ............................................................... (919) 557-2511201 Bengal Blvd., Fuquay-Varina, NC 27526Garner ⌧ ....................................................................... (919) 662-23792101 Spring Drive, Garner, NC 27529Holly Springs ................................................................ (919) 577-14445329 Cass Holt Road, Holly Springs, NC 27540Middle Creek ................................................................. (919) 773-3838123 Middle Creek Park Avenue, Apex, NC 2753963 FY <strong>2007</strong>-<strong>08</strong> <strong>Plan</strong> for Student Success
Assignments for Area SuperintendentsElementary <strong>School</strong>s:Adams ϖ ........................................................................ (919) 460-3431805 Cary Towne Blvd., Cary, NC 27511Briarcliff ......................................................................... (919) 460-34431220 Pond Street, Cary, NC 27511Brier Creek ϖ ................................................................. (919) 484-47479801 Brier Creek Parkway, Raleigh, NC 27617Carpenter ϖ ................................................................... (919) 462-67802100 Morrisville Parkway, Cary, NC 27519Cary ............................................................................... (919) 460-3455400 Kildaire Farm Road, Cary, NC 27511Cedar Fork .................................................................... (919) 388-52401050 Town Hall Drive, Morrisville, NC 27560Davis Drive ................................................................... (919) 387-21302151 Davis Drive, Cary 27519Farmington Woods ⌧ .................................................. (919) 460-34691413 Hampton Valley Road, Cary, NC 27511Green Hope ϖ ................................................................ (919) 388-52702700 Louis Stephens Drive, Cary, NC 27519Highcroft ϖ .................................................................... (919) 460-35275415 Highcroft Drive, Cary, NC 27519Kingswood .................................................................... (919) 460-3481200 E. Johnson St., Cary, NC 27513Leesville Road ϖ ........................................................... (919) 870-420<strong>08</strong>401 Leesville Road, Raleigh, NC 27613Morrisville ϖ .................................................................. (919) 460-34001519 Morrisville Pkwy., Morrisville, NC 27560Northwoods .................................................................. (919) 460-34918850 Chapel Hill Road, Cary, NC 27513Reedy Creek ................................................................. (919) 380-3660940 Reedy Creek Road, Cary, NC 27513Turner Creek ϖ .............................................................. (919) 363-13916801 Turner Creek Road, Cary, NC 27519Weatherstone ................................................................ (919) 380-69881000 Olde Weatherstone Way, Cary, NC 27513WesternKathryn Chontos, Area SuperintendentMiddle <strong>School</strong>s:Davis Drive .................................................................... (919) 387-30332101 Davis Drive, Cary, NC 27519East Cary ϖ ................................................................... (919) 466-43771111 Maynard Road SE, Cary 27511Leesville Road .............................................................. (919) 870-41418405 Leesville Road, Raleigh, NC 27613Reedy Creek .................................................................. (919) 460-3504930 Reedy Creek Road, Cary, NC 27513West Cary ...................................................................... (919) 460-35281000 Evans Road, Cary, NC 27513High <strong>School</strong>s:Cary ............................................................................... (919) 460-3549638 Walnut Street, Cary, NC 27511Green Hope ................................................................... (919) 380-37002500 Carpenter Upchurch Road, Cary, NC 27519Leesville Road .............................................................. (919) 870-425<strong>08</strong>409 Leesville Road, Raleigh, NC 27613Panther Creek ............................................................... (919) 463-86566770 McCrimmon Parkway, Cary, NC 2751964
The Reporting Entity and Its ServicesThe <strong>School</strong> <strong>System</strong>The <strong>Wake</strong> <strong>County</strong> <strong>Public</strong> <strong>School</strong> <strong>System</strong> (WCPSS) is one comprehensiveschool district serving the entire county; including Raleigh, Cary, Apex,Wendell, Fuquay-Varina, Garner, Knightdale, Rolesville, <strong>Wake</strong> Forest,Holly Springs, Morrisville, and Zebulon. The system was created througha merger of the former <strong>Wake</strong> <strong>County</strong> and Raleigh City <strong>Public</strong> <strong>School</strong>systems in July 1976. The school system is the 23rd largest system inthe nation and the second largest in North Carolina. For 2006-07 it isserving over 128,072 students from kindergarten through 12th grade in93 elementary schools, 28 middle schools, 22 high schools, and fourspecial/optional schools. The system and its school board are committedto providing the highest possible quality of education to <strong>Wake</strong> <strong>County</strong>students, while maintaining fi scal responsibility and accountability.WCPSS is a large, complex system that requires effective leadershipat both the central and school levels to drive continuous improvements.Del Burns, superintendent, is the chief executive offi cer of WCPSS. Heand his senior leadership team set system direction, implement policy,and manage systemwide operations. In addition to the superintendentand his leadership team, principals, assistant principals, and centralleveladministrative staff comprise the districtwide administrative team.<strong>School</strong> leadership teams, of which principals are members, overseeschool improvement planning and other site-based managementresponsibilities.One of the superintendent’s responsibilities is to serve the board ofeducation. The Board consists of nine members, elected in districts bythe public, who serve four-year terms. The board of education meets atleast two times per month to consider policy issues and review systemperformance. Senior leadership is aligned to support the board ofeducation’s decision-making structure. The board has budget reviewauthority, but it is not a taxing body and must submit its annual budgetrequests to the <strong>Wake</strong> <strong>County</strong> Board of Commissioners, which controlsallocation of funds to the schools. In North Carolina the basic publiceducation program is funded by the state and is augmented with localfunds.Opportunities for public comment are provided through a public hearingat the beginning of each regular board meeting for items on the agendaand at the end of each regular board meeting for items not on the agenda.Each participant may address the board for three minutes.Principals are legally responsible for the operation of the schools inthe district. Principals work collaboratively with leadership teams attheir schools to develop, implement, and monitor school improvementplans (SIPs). All school staffs are involved in the school improvementprocess.The school system has over 16,703 full-time and part-time employeesand is the third largest employer in the Raleigh-Durham area. Thesystem has 8,732 regular classroom teachers, not including mediaspecialists, counselors, psychologists, etc. Most students are assignedto and attend their “base school”—the school assigned based on theparent’s or guardian’s home address. In some instances, the baseschool may be a magnet or year-round school since these schools havebase populations in addition to accepting applications. Transportationis provided for students living at least 1½ miles from the base school oroutside a safe walk-zone. For the magnet program, the same guidelinesapply if the child is accepted into the program.A total of 82 of the system’s 147 schools are magnet schools or are yearroundschools. Thirty-six offer a magnet program and 46 will operateon a year-round calendar. Magnet programs offer enhancementsto the North Carolina Standard Course of Study based on a themeor approach to teaching and learning. Year-round schools offer thestandard curriculum but operate on a multi-track calendar that enablesthe school to accommodate 25-33 percent more students than a schooloperating on a traditional calendar. All students registered in the <strong>Wake</strong><strong>County</strong> <strong>Public</strong> <strong>School</strong> <strong>System</strong> are eligible to apply to magnet school ora calendar option school. The magnet network features the followinginnovative programs: Gifted and Talented (GT), Gifted and Talented withAG Basics, University Connections, Leadership, Center for Leadershipand Technology, Creative Arts and Science, Community Model, ActiveLearning and Technology, International Baccalaureate, Montessori,Museums, Early College, International Studies, and GT/IB Center forHumanities, Sciences and the Arts. Magnet programs were establishedin 1982 as “<strong>School</strong>s of Choice” to attract families to downtown schools tofi ll under-utilized facilities and to promote diverse student populations.The program has proven to be highly successful and contributes to <strong>Wake</strong><strong>County</strong>’s stature as a leader in education.65 FY <strong>2007</strong>-<strong>08</strong> <strong>Plan</strong> for Student Success
The Reporting Entity and Its ServicesReporting EntityThe board is the basic level of government exercising oversightresponsibility and control over all activities related to public schooleducation in <strong>Wake</strong> <strong>County</strong>. Because its members are elected by thepublic and have decision-making authority, the power to designatemanagement, the ability to signifi cantly infl uence operations, and primaryaccountability for fi scal matters, the board is recognized as a separategovernment reporting entity, as defined by the Governmental AccountingStandards Board (GASB). The board receives funding from county, state,and federal government sources and must comply with the concomitantrequirements of those funding entities. While the board receives countyfunding, the county is not entitled to share in any surpluses nor is itrequired to fi nance any defi cits.Economic Condition and OutlookThe recurring publicity of <strong>Wake</strong> <strong>County</strong> as one of the most desired placesto live and work in the United States, as evidenced by past surveys inmagazines such as Forbes, Money, Fortune and Entrepreneur, hascontinued to turn the spotlight on quality of life enjoyed by <strong>Wake</strong> <strong>County</strong>citizens. While quality of life is an intangible asset, there are many tangibleattributes that we can point to in explaining the county’s attractiveness.Chartered in 1771, <strong>Wake</strong> <strong>County</strong> covers an area of 864 square miles andis the second most populous county in the state. Twelve municipalitiesreside in <strong>Wake</strong> <strong>County</strong> including Raleigh, the county seat and statecapital. A unique mix of urban county with rural areas and small townsdistinguishes <strong>Wake</strong> <strong>County</strong> from other counties in the state and providessomething for everyone in choosing a lifestyle. Located in the northcentral section of the state on the piedmont plateau, <strong>Wake</strong> <strong>County</strong> isapproximately half way between Washington, D.C. and Atlanta. As wellas being a part of that major industrial corridor, <strong>Wake</strong> <strong>County</strong> is alsoconvenient to the recreation of the beautiful North Carolina mountainsand serene North Carolina beaches. The county’s topography ischaracterized by low rolling hills in the northwest changing graduallyto level land in the southeast. The central North Carolina climate isrelatively mild with moderate winters and warm summers. The location,geography, and climate make <strong>Wake</strong> <strong>County</strong> an enjoyable place to liveand work while also contributing signifi cantly to the economic viability ofthe region.The economy of the area is stabilized by the presence of state and localgovernment employment markets, the college and university employmentmarkets, and the Research Triangle research facilities, all of which offersubstantial employment opportunities to the county’s population. Nomajor specialized industry dominates the economy of the county. Theboard continues to anticipate an increased enrollment over the nextseveral years and will need continued increases in classroom space,teachers, and equipment. <strong>County</strong> funding is a major source of incomefor the board; therefore, the county’s economic outlook directly affectsthat of the school district.The Research Triangle, straddled on the <strong>Wake</strong> and Durham <strong>County</strong> line,was organized in 1959. It encompasses 6,800 acres of land set aside forresearch and research-oriented manufacturing. With the attractivenessof the Research Triangle and its proximity to three major researchuniversities, it is no accident that medical and electronic industriesfl ourish in the region.WCPSS works with a variety of agencies, suppliers, and partners to deliverthe necessary programs, activities, and services of the school system. Inmany instances state law and regulations defi ne the relationship betweenWCPSS and their suppliers. For example, the North Carolina Departmentof <strong>Public</strong> Instruction (NCDPI) establishes the required curriculum to betaught in all North Carolina schools.Student performance is assessed by the state in grades 3-8 in the areasof reading and mathematics. Writing is assessed in grades 4, 7, and10. In grades 9-12, the state assesses student performance in selectedcourses in the areas of English, social studies, mathematics, and science.Students must meet minimum competency standards in mathematics,reading, and computer literacy to receive a high school diploma.WCPSS maintains relationships with local colleges and universities,community agencies, businesses, parent organizations, and the <strong>Wake</strong>Education Partnership. The <strong>Wake</strong> Education Partnership is a community-basedpublic school advocacy organization that links business andcommunity resources to strengthen schools. The Partnership’s efforts includesponsoring annual education summits and community-based technologyforums, conducting the Gallup Poll on education, and awardinggrants to teachers. The Triangle United Way and the United Arts Council66
The Reporting Entity and Its Servicesare also community partners that support students, families, and schoolprograms. The WCPSS values these collaborative relationships.WCPSS nurtures positive relationships with many local businesses.WCPSS, the <strong>Wake</strong> Education Partnership, and the Business EducationLeadership Council created the JobReady Council now known as the<strong>School</strong>-to-Career Council. From this beginning seed, numerous businessalliances evolved at the school sites. There are now over 400 businessesinvolved with our secondary schools.The <strong>Wake</strong> <strong>County</strong> Parent-Teacher-Student Association (PTSA) coordinatesactivities through membership in the state and national organizationand provides leadership to the individual school PTSA. Through thevaluable work of the many active members, schools receive volunteersand enrichment programs. There is signifi cant parent and volunteer involvementin schools on a daily basis.Special relationships exist between <strong>Wake</strong> <strong>County</strong> schools and the postsecondaryinstitutions. Universities provide the system with licensedteachers and administrators, and WCPSS provides opportunities forstudent teachers, graduate internships, and employment for their graduates.Other collaborations include programs such as the Math-ScienceNetwork, a pre-college program for minority students, summer enrichmentprograms, Governor’s school, and partnerships with community andtechnical colleges to meet both student and staff educational needs.67 FY <strong>2007</strong>-<strong>08</strong> <strong>Plan</strong> for Student Success
Budget and Financial PoliciesReporting EntityThe cost of public education in North Carolina is fi nanced primarily bythe state, which establishes minimum programs. Local funds, in varyingamounts by district, supplement the basic program and are appropriatedby local boards of county commissioners. Local boards of educationin North Carolina have no tax levying or borrowing authority and arerequired to maintain accounting records in a uniform format.The budget is prepared on the modifi ed accrual basis of accountingprescribed by legal requirements.The board is a local education agency empowered by the North Carolinageneral statutes with the responsibility to oversee and control all activitiesrelated to public school education in <strong>Wake</strong> <strong>County</strong>, North Carolina. Theboard receives county, state, and federal government funding and mustadhere to the legal requirements of each funding entity.<strong>Public</strong> <strong>School</strong> FinancingFUND ACCOUNTINGPrivate: Private sector presents a single, unitary entity for fi nancialreporting purposes. Private sector fi nancial statements are taken as awhole.<strong>Public</strong>: Governmental fi nancial reporting focuses on grouping of variousfunds rather than as whole. Fund accounting developed from legalcompliance and resource limitation issues.SPENDING FOCUSPrivate: Private sector focuses on earnings and changes in business’stotal net resources.<strong>Public</strong>: Governments focus on changes in current spendable resourcesrather than total resources. Government limitation has short-term focustypically on operating budget.BUDGETARY REPORTINGPrivate: Private sector budget is simply a fi nancial plan allowing forchange and fl exibility during fi scal year.<strong>Public</strong>: Governmental budget is a system of checks and balances withlimited fl exibility. Governments demonstrate compliance with legallyadopted budgets through mandated budget-to-actual comparisonstatements.Budget BasisThe North Carolina <strong>School</strong> Budget and Fiscal Control Act mandates auniform budget format and the adoption of an annual balanced budgetresolution by July 1 each year. Budgets are adopted on a basis consistentwith Generally Accepted Accounting Principles (GAAP), except forrevenues and expenditures of the debt service fund, which is included inthe budget of the capital projects fund and the enterprise fund, which isbudgeted on the modifi ed accrual basis.Legal provisions confl ict with GAAP in that there is no authorization forthe board to maintain a debt service fund even though the statutes allowcontinuing contracts for capital outlay purchases.As required by the statutes, the board maintains encumbrance accountsunder which purchase orders, contracts, and other commitments for theexpenditure of funds are recorded in the governmental funds in orderto reserve that portion of the applicable appropriation. Outstandingencumbrances at the end of the year do not constitute expendituresand are either charged to an appropriation in the following year or thecontractual commitment is cancelled. The encumbrances are reportedas reservations of fund balance since the commitments will be fulfi lledthrough subsequent years’ budget appropriations.The primary revenue sources for the school system are budgetedallocations and appropriations from the State of North Carolina, <strong>Wake</strong><strong>County</strong>, and the federal government. State budgets are recorded asallotments and are issued or revised by the North Carolina Department of<strong>Public</strong> Instruction (NCDPI). Grants are recorded in accordance with thegrant award notifi cations. These may span multiple fi scal years. Buildingprogram budgets are recorded when resolutions have been approved68
Budget and Financial Policiesthrough the <strong>Wake</strong> <strong>County</strong> Board of Education and the <strong>Wake</strong> <strong>County</strong>Board of Commissioners. <strong>County</strong> appropriation revenue is recorded inaccordance with the amount approved in the <strong>Wake</strong> <strong>County</strong> budget. Otherlocal revenues such as fi nes and forfeitures, interest earned, indirectcost, and fees are budgeted according to projections. These levels aremonitored monthly. Any variances are reported to the board of educationon a quarterly basis.State funds are spent on a cash basis. There can be no outstandingpurchases at yearend. Unexpended funds revert to the state with fewexceptions. Local funds are on a modifi ed accrual basis. A limitednumber of open purchase orders may remain outstanding at yearend.Local revenues less expenditures roll to fund balance annually. Buildingprogram projects are on an accrual basis. Purchase orders are allowedto cross fiscal years. Unspent and unencumbered balances roll forwardfor each project. Outstanding purchase orders are liquidated at yearendin the enterprise fund. However, any balances of revenues overexpenditures will carry forward to the next fi scal year for these programsor roll to retained earnings. Unexpended federal program allocationslapse on the program termination date.The appropriations in the various funds are formally budgeted andcontrolled at the functional level. Expenditures may not legally exceedappropriations at the functional level for all of the board’s funds. Subject tothe provisions of the statutes, the board may amend the budget resolutionat any time after its adoption. State law also requires that the board andthe board of county commissioners approve the transfers to or from thecapital outlay fund. By resolution of the board, the superintendent maytransfer monies from one appropriation to another within the same fund,subject to certain limitations described below. If such transfers requirethe board’s approval, they must be reported at the next meeting.The board of education may amend the budget resolution at any timeafter its adoption. The board of education authorizes the superintendentto:A. Transfer appropriations under the following conditions:1. The superintendent may not transfer any amounts betweenfunds or from any contingency appropriation within a fund withoutboard of education approval.2. The superintendent may transfer amounts between purposesand between functions within a purpose. A summary of all suchtransfers must be reported to the board of education quarterly.3. The superintendent may transfer any amounts in state orfederal projects upon prior approval of the appropriate fundingagency. If such transfers require board of education approvalunder other provisions of this resolution, they must be reportedquarterly.B. Accept appropriations into the budget under the following conditions:1. The superintendent may accept all state appropriations. Asummary of such appropriations must be reported to the boardof education quarterly.2. The superintendent may accept federal appropriations if theapplication for funding has been approved by the board of education.A summary of such appropriations must be reported tothe board of education quarterly.3. The superintendent may accept categorical program appropriationsif the program has been approved by the board of education.A summary of such appropriations must be reported tothe board of education quarterly.4. The superintendent may accept other appropriations uponprior approval of the board of education.69 FY <strong>2007</strong>-<strong>08</strong> <strong>Plan</strong> for Student Success
Budget and Financial PoliciesBudget PoliciesThe <strong>Wake</strong> <strong>County</strong> Board of Education has adopted the following policiesas a part of the offi cial board policy as it relates to the budget process:ANNUAL BUDGET: BOARD POLICY 8100The superintendent shall prepare an annual budget and submit it with abudget message to the board not later than April 15.8100.1 The budget shall comply in all respects with the limitations imposedby law.8100.2 The budget is a detailed annual operating plan expressed interms of estimated revenues and expenses, stated in fi nancial terms, forconducting programs and related services in the school system.8100.3 The budget is a forecast of the projected cost of implementingthe goals, objectives, and policies of the board, as well as any neededimprovements in programs and support services planned by the board.8100.4 The annual budget process and the resulting budget should serveas a means to improve communication within the school organization andbetween the school system and the citizens of the school community.PROGRAM BUDGETING SYSTEM: BOARD POLICY 8110The continuing central focus of the board is to improve the learning performanceof individual students. Current levels of achievement will beassessed in comparison to goals and objectives to identify needs or problemareas requiring adjusted allocation of resources. Resources will beallocated to areas of greatest need. The performance of programs willbe evaluated during the budget year to provide a base for subsequentbudget development.BUDGET PREPARATION PROCEDURES: BOARD POLICY 8120Budget planning shall be an integral part of program planning so that thebudget may effectively express and implement all programs and activitiesof the school system. Budget planning shall be a year-round processinvolving broad participation by administrators, teachers, other personnelthroughout the school system, and citizens.BUDGET DISPLAY: BOARD POLICY 8130On the same day that the budget is submitted to the board, a copy of thebudget shall be fi led in the superintendent’s offi ce where it shall remainavailable for public inspection until the budget resolution is adopted.BUDGET HEARINGS: BOARD POLICY 8140The board shall hold at least one public hearing on the proposed budgetprior to fi nal action.BUDGET SUBMISSION TO COUNTY COMMISSIONERS:BOARD POLICY 8150Upon receiving the budget from the superintendent and following thepublic hearing authorized by law, the board shall consider the budget,make such changes therein as it deems advisable, and submit the entirebudget as approved by the board of education to the board of countycommissioners not later than May 15, or such later date as may be fi xedby the board of county commissioners.COMMISSIONERS’ BUDGET ACTION: BOARD POLICY 8160The commissioners shall complete action on the school budget on or beforeJuly 1, or such later date as may be agreeable to the board of education.The commissioners shall determine the amount of county revenuesto be appropriated in the county budget ordinance to the school systemfor the budget year. The board of county commissioners may, in its discretion,allocate part or all of its appropriation by purpose, function, orproject as defi ned in the uniform budget format.RESOLUTION OF BUDGET DISPUTE: BOARD POLICY 8161Resolution of disputes between the board and the commissioners shallbe accomplished in accordance with law.ADOPTION OF BUDGET RESOLUTION: BOARD POLICY 8170Adoption of the budget resolution shall be in accordance with the provisionof state law.8170.1 After the board of county commissioners has made its appropriationsto the school system, the board of education shall adopt a budgetresolution making appropriations for the budget year in such sums as theboard deems suffi cient and proper.70
Budget and Financial Policies8170.2 The budget resolution shall conform to the uniform budget formatestablished by the State Board of Education.BUDGET TRANSFERS AND AMENDMENTS: BOARD POLICY 8180Budget transfers or amendments to the budget resolution, when deemednecessary by administration or the board, shall be carried out in accordancewith the provisions of state law and provisions of the adopted budgetresolution.INTERIM BUDGET: BOARD POLICY 8190In case the adoption of the budget resolution is delayed until after July1, the board shall make interim appropriations for the purpose of payingsalaries and the usual ordinary expenses of the school system for theinterval between the beginning of the fi scal year and the adoption of thebudget resolution. Interim appropriations so made and expended shallbe charged to the proper appropriations on the budget resolution.Cash Management Policies and PracticesCash temporarily idle during the year was invested in the North CarolinaVoluntary Short-term Investment Fund (STIF), the North Carolina CapitalManagement Trust (NCCMT), and a Jumbo Money Market account. Inaddition, other bank accounts that the school maintains earn interest. Thestatutes authorize the board to invest in obligations of the United States,obligations of any agency of the United States if payment of interest andprincipal of such obligations is fully guaranteed by the United States;obligations of North Carolina; bonds and notes of any North Carolinalocal government public authority, subject to certain restrictions; sharesof any savings and loan association organized under the laws of this stateand shares in any federal savings and loan association organized underthe laws of this state, to the extent that the investment is fully insured bythe United States or an agency thereof or by any mutual deposit guarantyassociation authorized by the state; certain other federal agencies; andany form of investment allowed by law to the state treasurer.Fund BalanceThe North Carolina <strong>School</strong> Budget and Fiscal Control Act restrictsappropriation of fund balance or fund equity to an amount not to exceed thesum of cash and investments minus the sum of liabilities, encumbrances,and deferred revenues as these amounts stand at the close of the fi scalyear preceding the budget year.Interfund TransactionsQuasi-external transactions are accounted for as revenues andexpenditures or expenses. Transactions that constitute reimbursementsto a fund for expenditures/expenses, initially made from that fund thatare properly applicable to another fund, are recorded as expenditures/expenses in the reimbursing fund and as reductions of expenditures/expenses in the fund that is reimbursed.All other interfund transactions, except quasi-external transactions andreimbursements, are reported as transfers.71 FY <strong>2007</strong>-<strong>08</strong> <strong>Plan</strong> for Student Success
Budget ProcessOperating BudgetThe <strong>Plan</strong> for Student Success represents the <strong>2007</strong>-20<strong>08</strong> fi nancial plan for the <strong>Wake</strong><strong>County</strong> <strong>Public</strong> <strong>School</strong> <strong>System</strong> (WCPSS). This document culminates a dynamic processinvolving input from many groups. Budget development is a year-round process,which begins in the fall and continues until the offi cial plan for student successis adopted by the <strong>Wake</strong> <strong>County</strong> Board of Education in June. Participation at all levelsis evident in this ongoing process.The Budget Cycle<strong>School</strong>s and central services departments develop strategic plans and request budgetneeds to support the plans. The superintendent’s strategy team develops theSuperintendent’s <strong>Plan</strong> for Student Success, and prioritizes all requests based on thesystem’s goals, mission, and the delicate balance between instructional and supportingservice needs. The board holds a public hearing as it considers the plan, andfi nally the board of education submits its <strong>Plan</strong> for Student Success to the county commissionersby May 15 of each year.<strong>Plan</strong> forthe futureAssesssystemneedsDetermineeducational/support servicesgoals andobjectives Distinguisheducation programsand support svcs.The county commissioners must adopt a budget resolution, which includes the countyappropriation for the school system, by June 30. If full funding of the board ofeducation’s plan for student success is not approved, the budget must be adjustedaccordingly. The board of education adopts a fi nal plan for implementation by July 1.Copies of the budget resolution shall be furnished immediately to the superintendentand the school fi nance offi cer for direction in carrying out their duties. Copies of thebudget resolution shall also be fi led with the county fi nance offi cer and the controllerof the State Board of Education.Monitor andevaluate programsImplementprogramsAllocateresourcesIdentifyconstraintsDevelopalternativesDecideonrecommendedprogramsWe continuously seek ways for the citizens of <strong>Wake</strong> <strong>County</strong> to receive more for theirdollars. Many adjustments were made by the superintendent and strategy team duringthe development of this plan. Efforts were made to maximize both the revenueand expenditure sides of the budget.72
Budget ProcessGoal 20<strong>08</strong>WCPSS is committed to academic excellence. By 20<strong>08</strong>, 95 percent of students in grades 3 through 12 will be at or above grade level as measuredby the State of North Carolina End-of-Grade or Course tests, and all student groups will demonstrate high growth.Board StrategiesSuperintendent’s Performance GoalsMission: To create and maintain systems with suffi cient resources for establishing a collaborative, inclusive and trusting environment for all stakeholdersand for providing high quality learning experiences for each student to ensure success in the 21st century.Vision: A community of caring stakeholders (parents, teachers, administrators and staff) will successfully work collaboratively with support fromthe broader community to ensure that every child educated in the <strong>Wake</strong> <strong>County</strong> <strong>Public</strong> <strong>School</strong> <strong>System</strong> graduates on time, prepared for the future.Strategic Directives:(1) Focus on teaching and learning.(2) Retain, recruit, and train high quality employees.(3) Develop and implement systems and structures to support schools, ensure accountability and engage the community.(4) Expand fi scal accountability.<strong>School</strong>-Based/Departmental Strategic <strong>Plan</strong>sAnnual Performance <strong>Plan</strong>Budget Development/CostingFinancial ManagementAnnual Performance Against Community GoalPrepare for Next Cycle73 FY <strong>2007</strong>-<strong>08</strong> <strong>Plan</strong> for Student Success
Budget ProcessBudget GuidelinesEach division has developed a strategic plan for the next three years.Annual performance plans follow the strategic plans. In order to preparethe budget request for <strong>2007</strong>-<strong>08</strong>, 20<strong>08</strong>-09, and 2009-10, each division willcost out the items necessary to support the strategic plan. Savings andcosts will be identifi ed.<strong>School</strong>-based budgets are formula-driven. <strong>2007</strong>-<strong>08</strong> school-based budgetswill be estimated based on projected student membership, staffi nglevels, and square footage. Principals should communicate with theirarea superintendent if they have suggestions for formula adjustments.Area superintendents will incorporate budget items from the school levelin their budget requests.To determine what did and did not go into the budget, we applied the followingcriteria during the budget development period:Legislative IssuesWe assume state funding formulas remain the same until decisions aremade by the General Assembly. We apply the formulas to our projectedgrowth fi gures for student membership, staff levels, and number ofschools. We assume the discretionary reductions in the state budget for2006-07 will remain.Commitments by Board of Education (BOE) to Programs for FutureFundingWe included increases for programs previously committed to by theBoard of Education. Commitments by BOE cases are provided for eachof these items.New Programs or Increased Funding for Existing ProgramsWe created budgets for new programs or expansions to existing programs.These increases were aligned to the system goal. Businesscase methodologies were provided for each of these items.Savings and Reduction of One-Time Costs from the Previous YearOne-time costs from 2006-07 were eliminated. Savings from the previousyear were identifi ed.As a result of all these efforts, we were able to build a balanced budgetfor <strong>2007</strong>-<strong>08</strong> that accommodates the growth in our district and maintainsthe programs currently in place that are helping us achieve progress towardsGoal 20<strong>08</strong>.Growth IssuesDollars were budgeted to maintain our current supplementary pay schedulesand to maintain our current staffi ng formulas. These budget increasesare tied directly to growth in student membership, staffi ng levels,number of schools, square footage, and acreage. Startup dollars werebudgeted for early hires, purchased services, and staff development forschools that will be opening or expanding grade levels in the summer of20<strong>08</strong>. Growth cases are provided for each of these items.<strong>System</strong>wide IncreasesIncreases were included to maintain fi scal accountability, facility leases,safety and security, fixed asset replacement, capital budget and rate increases.<strong>System</strong>wide increase cases are provided for each of theseitems.74
Budget ProcessBudget ProcessSep Oct Nov Dec Jan Feb March Apr May Jun Jul AugDepartments prepare, review, and revisebudget requests for the subsequent year.<strong>School</strong>-based tuition budgets for the currentyear are adjusted based on actualparticipation.Superintendent and Strategy Team members preparebalanced budget request and deliver theSuperintendent’s <strong>Plan</strong> for Student Success to theBoard of Education. NCDPI releases planningallotments.<strong>Public</strong> hearing on the budgetand Board of Education worksessions.Board ofEducationsubmitsbudget tocountycommissioners.<strong>Plan</strong>ningallotments forpersonnel arereleased tothe schools.Board of Educationadopts budgetresolution.Record carryforwardbalances and adjust stateand federal programs toinitial allotments and awardnotifications.The Budget Process: Who Should Be Involved?Community <strong>School</strong> Board AdministratorsOther <strong>School</strong>StaffStudentsAssess school system needs x x x x xEstablish policiesxDetermine educational goals x xDetermine program objectives x xDetermine support services goals x xDetermine support services objectives x xDistinguish between instructional programs and non-instructional programs x xIdentify program constraints x xIdentify support services constraints x xDevelop program alternatives x xDevelop support services alternatives x xDecide on recommended programsxAllocate resources to program and support services x xMonitor and evaluate program and support services x x x x x<strong>Plan</strong>ning for the future x x x x x75 FY <strong>2007</strong>-<strong>08</strong> <strong>Plan</strong> for Student Success
Budget ProcessCapital BudgetThe Capital Improvement Program (CIP) 2006 was the culmination of along planning process in which important planning goals were identifi edand a series of scenarios were used to explore the implications of variousstrategies for accommodating projected enrollment growth. The followingparagraphs describe the most important points in the process.Enrollment in <strong>Wake</strong> <strong>County</strong> <strong>Public</strong> <strong>School</strong> <strong>System</strong> (WCPSS) is expectedto grow by 42,000 students by the 2010-11 school year, an increase of35 percent over the 2005-06 school year. This means that more schoolsand more support facilities for schools will be needed prior to the arrivalof these students. Capital funding provided by PLAN 2004 allowed theopening of four elementary schools and two high schools in 2006-07 andwill provide six additional elementary schools in <strong>2007</strong>-<strong>08</strong>. A new CIP isneeded to address enrollment growth from <strong>2007</strong> through 2010.September 2005: the Adoption of <strong>Plan</strong>ning Assumptions and Goals:The Board of Education and the Board of <strong>County</strong> Commissioners jointlyadopted a set of planning assumptions. Assumptions addressed 21 keyissues, which included:• Elimination of the backlog of deferred major renovation projectsand deferred life-cycle replacement projects by 2015;• Reduction of the percentage of students in mobile/modular units,including modular schools (but not including swing space for renovations)to no more than eight percent by 2012;• Reduction in crowding, as measured by the utilization of permanentseats, to 95 percent in elementary and middle schools and97.5 percent in high schools by 2015;• A fi ve-year replacement cycle for school technology;• Consideration of multi-track year-round calendars for all futureelementary and middle schools as part of a comprehensive facilitiesplan;• Utilization of high-end projections for calculating long-range studentenrollment (+one percent for the fi rst fi ve years, +1.5 percentfor the next five years, and + two percent for succeedingyears) and an annual review of projections versus actual enrollment.December 2005: fi ve scenarios were presented with costs through 2010ranging from $1.559 billion to $2.291 billion and costs through 2015 rangingfrom $4.247 billion to $5.593 billion. Some attributes of these scenarioswere:• Base costs per school were estimated using a 12 percent infl a-tion “Katrina effect” recommended by a consultant;• Costs beyond 2010 were not included in the <strong>2007</strong>-10 subtotals;• Mobile unit and utilization targets as specifi ed in the planningassumptions were achieved;• The estimated cost for existing facilities’ renovations was $428.5million, based upon generic models that utilized building age andsquare footage;• Costs were estimated at intervals (<strong>2007</strong>, 2010, 2012, 2015) ratherthan annually;• Standard (655 capacity) single-track elementary schools wereutilized in the two most expensive scenarios.February 2006: Three new scenarios were presented to narrow downthe options and focus discussion on a few key issues. Costs were estimatedfor a three year CIP (all expenditures that would be needed forfi scal years <strong>2007</strong>-09) and ranged from $1.375 billion to $1.975 billion.These costs included construction of schools that would open after 2010but needed to be bid in 2009. Some attributes of these scenarios were:• Lower base costs for schools resulted from elimination of the“Katrina effect” infl ation in favor of the fi ve percent infl ation identified in the September 2005 planning assumptions and revisionsto facilities’ designs;• Only large (800 student single-track capacity) elementary schoolswere utilized;• Revisions were made to cost estimates for existing school renovation/replacementprojects based upon more detailed data fromsite visits and project evaluations, and inclusion of all systemwidelife-cycle projects, increasing the total estimate for existingschool projects from $428 million to $528 million;• Start-up funding for land and design of future CIP projects wasincluded;• Only mimimal progress was made toward the mobile unit andutilization targets adopted in September 2005.76
Budget ProcessApril 2006: Staff prepared a recommendation for a capital improvementprogram for fi scal years <strong>2007</strong>-09. The recommendation was based upona more detailed study of the instructional impact of the potential conversionof elementary and middle schools from single-track to multi-trackcalendars and consideration of student assignment implications andpotential family disruption generated by conversion. The staff recommendationincluded limited conversion of most elementary schools, withthe goal of adding 7,000 seats to elementary capacity. All future elementaryand middle schools were anticipated to be multi-track year-roundschools.Recommended funding of projects at existing schools and support facilitieswas reduced to keep the total CIP cost as low as possible. Thisrequired that some projects be deferred to a subsequent CIP.budgets must be increased in proportion to the increased square footageof building space. The operating budget is impacted in the areas of: utilities,custodial services, grounds maintenance, pest management, buildingmaintenance and repair, solid waste disposal, supplies, and communityuse.Operation of elementary and middle schools on a multi-track, year-roundcalendar increases the operating and maintenance cost, because thebuildings are used for twelve months instead of 10 months each year.Business cases have been developed to detail the increased operationand maintenance costs of new and enlarged buildings – operating onboth traditional and year-round calendars – and of existing buildings convertedfrom traditional to year-round calendar.May 2006: After extensive review and discussion of staff proposals, theBoard of Education adopted a Capital Improvement Program with a totalcost of $1,055,874,837. Key considerations in the fi nal CIP were: thelimitation of year-round conversion in elementary schools to that level requiredto generate 3,000 seats to address crowding in <strong>2007</strong>-<strong>08</strong>; conversionof some middle schools to year-round calendars in order to generateat least some of the 2,000 additional seats needed in middle schools by20<strong>08</strong>-09; and to provide families in elementary and middle school the opportunityto have siblings on the same track.The CIP provides adequate classroom space for teaching and learningto serve a 35 percent increase in enrollment over fi ve years (from120,504 students in September 2005 to 162,371 students in September2010); and makes some progress on deferred major renovation and lifecycle projects at existing schools to protect student health and safety andmaintain adequate instructional environments.Impact of Capital Improvement on theOperating BudgetThe capital improvement programs over the past two decades have providedthe new and renovated school buildings to accommodate the everincreasingenrollment of <strong>Wake</strong> <strong>County</strong> <strong>Public</strong> <strong>School</strong> <strong>System</strong>. Thesenew buildings must be operated and maintained, so the annual operating77 FY <strong>2007</strong>-<strong>08</strong> <strong>Plan</strong> for Student Success
Citizen InvolvementWhat You Can DoSpeak at school board public hearings. There are two public hearingportions of each board meeting:1. <strong>Public</strong> hearing about items on that night’s agenda (occurs onehourafter the beginning of the meeting), and2. <strong>Public</strong> hearing about items not on that night’s agenda (occursfollowing public hearing for items on the agenda, then continuedat the end of the meeting if necessary).Individuals wishing to speak at a board meeting must sign in prior to thebeginning of the public hearing.Speak at <strong>Wake</strong> <strong>County</strong> Board of Commissioner’s Meetings. The Boardmeets on the first and third Mondays of each month (unless changed forholidays or other reasons). The meetings begin at 2:00 p.m., with publiccomments at 3:00 p.m. A 30-minute signup period precedes each publiccomment period.Contact your legislators regarding additional state funding by visiting thefollowing web address and contacting your representatives.http://www.ncga.state.nc.us/GIS/Representation/Who_Represents_Me/Who_Represents_Me.html78
Budget Activities During FY 2006-07 to Prepare FY <strong>2007</strong>-<strong>08</strong> BudgetJulySeptemberJuly 1DuringJuly2006-07 Budget is available on Oracle.During Sept.Test the <strong>Public</strong> Sector Budgeting fi les.July 1 – 31§ 115C 105.30. Distribution of staff development funds.Any funds the local board of education makes available to an individualschool building to implement the school improvement planat that school shall be used in accordance with that plan.Each local board shall distribute seventy fi ve percent (75%) ofthe funds in the staff development funding allotment to the schoolsto be used in accordance with that school’s school improvementplan. By October 1 of each year, the principal shall disclose to allaffected personnel the total allocation of all funds available to theschool for staff development and the superintendent shall discloseto all affected personnel the total allocation of all funds availableat the system level for staff development. At the end of the fiscalyear, the principal shall make available to all affected personnela report of all disbursements from the building level staffdevelopment funds, and the superintendent shall make availableto all affected personnel a report of all disbursements atthe system level of staff development funds. (1993, c. 321, s.144.2(c); 1995 (Reg. Sess., 1996), c. 716, ss. 2, 3.)Record carryover balances for programs that span multiple fi scalyears.Remove estimated budgets for categorical programs.Record actual budgets for categorical programs as funding resolutionsare received throughout the year (grant awards, contracts,state allotments).September 8September 15September 21September 30Adjust salaries/benefi ts to actual after retroactive raises are appliedin Oracle.Realign positions between funds to maximize state dollars.Request allotment adjustments from NCDPI based on 1st monthADM fi gures.Make tenth day dollar and month of employment adjustments forall schools.Day 10 Student Membership reporting for Traditional Calendar<strong>School</strong>s.Submit the 2006-07 <strong>Adopted</strong> <strong>Plan</strong> for Student Success to GFOA.Meet with Strategy Team regarding the budget process.Carryover of startup funds for new schools expires (except for thestaff development portion that ends in the third year of the allotment).Tuition budgets for Before and After <strong>School</strong> and Preschool Programsare due to the budget department.OctoberAugust 8AugustDay 10 Student Membership reporting for Modifi ed Calendar<strong>School</strong>s.During Oct.Load personnel data into PSB.Quarterly fi nancial and human resource reviews with each Chiefand Area Superintendent.Deliver fourth quarter budget transactions from 2005-06 to theBoard of Education.August 11Day 10 Student Membership reporting for all tracks for Year-Round<strong>School</strong>s.August 31Meet with Strategy Team regarding the budget calendar.79 FY <strong>2007</strong>-<strong>08</strong> <strong>Plan</strong> for Student Success
Budget Activities During FY 2006-07 to Prepare FY <strong>2007</strong>-<strong>08</strong> BudgetBy October 1October 17§ 115C 105.30. Distribution of staff development funds.Any funds the local board of education makes available to an individualschool building to implement the school improvement plan at thatschool shall be used in accordance with that plan.Each local board shall distribute seventy fi ve percent (75%) of thefunds in the staff development funding allotment to the schools to beused in accordance with that school’s school improvement plan. ByOctober 1 of each year, the principal shall disclose to all affectedpersonnel the total allocation of all funds available to the schoolfor staff development and the superintendent shall disclose to allaffected personnel the total allocation of all funds available at thesystem level for staff development. At the end of the fi scal year, theprincipal shall make available to all affected personnel a report of alldisbursements from the building level staff development funds, and thesuperintendent shall make available to all affected personnel a report ofall disbursements at the system level of staff development funds. (1993,c. 321, s. 144.2(c); 1995 (Reg. Sess., 1996), c. 716, ss. 2, 3.)Deliver fi rst quarter budget transactions and status of “over/under”to the Board of Education.October 31 Last day for position conversion requests to be submitted for 2006-07.Last day to declare extended employment months for 2006-07.January 23January 11,18, 25During Feb.February1, 8March 1March 6March 20Deliver second quarter budget transactions and status of “over/under”to the Board of Education.Budget worksessions with the Strategy Team.FebruaryBudget staff prepare the Superintendent’s <strong>Plan</strong> for Student Success.NCDPI releases <strong>Plan</strong>ning Allotments.Budget worksessions with the Strategy Team.MarchBudget worksession with the Leadership Team.Deliver Superintendent’s <strong>Plan</strong> for Student Success to the BOE.<strong>Public</strong> Hearing on the Superintendent’s <strong>Plan</strong> for Student Success.November 8November 17NovemberLoad fi nancial data into PSB.Budget requests are due to the budget department.April 24AprilDeliver third quarter budget transactions and status of “over/under” tothe Board of Education.Board of Education approves the <strong>Plan</strong> for Student Success.Strategic plans from each division are due to the budget department.MayDuring Dec.DecemberBudget staff processes all budget requests. Interaction with budgetmanagers to review, clarify, and proof budget requests.May 15May 18Deliver the Board of Education’s <strong>Plan</strong> for Student Success to thecounty commissioners.Final textbook transfer requests due to budget department.JuneJanuaryJune 19Adopt an interim budget resolution.During Jan.January 4Quarterly fi nancial and human resource reviews with each Chief andArea Superintendent.Present unbalanced budget to the Strategy Team.July 17JulyAdopt a budget resolution.80
Budget Administration and Management ProcessBudget administration and management is the process of regulating expendituresduring the fi scal year to ensure that they do not exceed authorizedamounts and that they are used for intended, proper, and legalpurposes. The management of the budget is accomplished in a varietyof ways: reconciling budget transactions on an ongoing basis, reviewingexpenditure patterns, tracking revenue receipts, monitoring projected fi -nancial status at yearend, reconciling exception reports, and reporting tothe board and public on fi scal operations.During the preparation of the budget, the document itself serves as thevehicle for planning and resource allocation decisions. After the boardadopts the budget, it then becomes the major fi scal management tool foradministering and controlling expenditures.OrganizationThe decision-making authority is based on an organizational structureof primary and secondary budget managers and school improvementteams. All principals and Leadership Team members are primary budgetmanagers. Principals may choose to establish assistant principals assecondary budget managers. Leadership Team members may establishsenior directors and directors as primary budget managers. LeadershipTeam members may choose to establish central services senior administratorsor administrators as secondary budget managers.All budget managers are responsible for assuring and maintaining theaccuracy of account coding, spending funds appropriately, and adheringto timelines for recording and expending funds.Budget managers must complete 1.5 days of Finance Certifi cation Trainingbefore signature authority is established. Additional classes are offeredto provide instructions for entering data directly into the computersystem, as well as how to navigate the fi nancial system to inquire onaccounts.The overall spending and revenue plans are coordinated by central servicesto maintain total expenditures within available revenues. Districtlevel coordination is also exercised over position control of months ofemployment in areas such as classroom teachers, instructional support,and non-instructional support. However, budgetary allocations to costcenters are provided in line item amounts and decisions on how to allocatethese monies are made at the school site or departmental level.Expenditure Control and ApprovalsFor management control purposes, the budget is arranged into cost centers.There is one cost center for every school and for each cabinetmember. Budget managers are responsible for the management of fi scalresources approved by the board for each of the cost centers. In areas ofcentral monitoring of positions, the fi nance offi cer is the budget manager.Thus, every expenditure appropriation in the budget is assigned to a budgetmanager who is accountable for the proper expenditure of funds.Each budget manager is authorized to approve the expenditure of fundswithin their respective cost centers provided that funds are expended inaccordance with purchasing procedures and legal requirements. Primarybudget managers must sign budget transfer requests and budgetamendments. The fi nance department monitors comparisons betweenbudget and actual expenditures to prevent overspending.Encumbrance ControlEncumbrances are obligations in the form of purchase orders, contracts,or salary commitments chargeable to an appropriation and for which partof the appropriation is reserved. The purpose for the encumbrance offunds is to insure that obligations are recognized as soon as commitmentsare made. The fi nancial system, therefore, recognizes actualexpenditures as well as those that are planned or anticipated. This preventsthe inadvertent overspending of the budget.Encumbrances in the State <strong>Public</strong> <strong>School</strong> Fund and Federal GrantsFund lapse at fi scal yearend, and the transactions are cancelled. Encumbrancesin the Local Current Expense Fund and Capital Outlay Fundare carried over to the next fi scal year. These amounts are reserved inthe fund balance and are appropriated at the beginning of the next fiscalyear.81 FY <strong>2007</strong>-<strong>08</strong> <strong>Plan</strong> for Student Success
Budget Administration and Management ProcessTransfersThe budget is a spending plan based upon a series of assumptions.Rarely will all of the actual expenditures equal the detailed budget estimatesas adopted. Adjustments to individual items may become necessary.Funds can be transferred from one account to another within theguidelines of the particular funding source. If circumstances or variableschange from those defi ned in the <strong>Plan</strong> for Student Success, budget transfersare submitted to realign fi nancial resources, including documentationto explain why the realignment is necessary.Budget transfers can be submitted by fax or e-mail by the primary budgetmanager to the budget department. A copy of the budget transfer formis available to download on our internal website (http://www2.wcpss.net/forms/).AmendmentsPrimary budget managers submit budget amendments when new fundsneed to be added to the budget or if funds need to be removed from thebudget. Revenues not included in the adopted budget must be approvedfor acceptance by the board of education.Funds CheckingThe Oracle fi nancial system is currently confi gured to monitor availablefunds at the program level, with separate subtotals monitored for salary/benefi t accounts and purchased services/supply/equipment accounts.Budget managers are notifi ed if spending patterns exceed 10 percentof a roll-up balance. At that trigger, transactions must be analyzed andaction taken by the budget manager. If there has been an error, it mustbe corrected through the appropriate department (payroll, purchasing,accounting). If data is correct, then a budget transfer should be submittedwith supporting documentation to realign dollars or transactions mustbe recoded to another funding source.Management Information and ReportingThe school system maintains an interactive, on-line budgetary controlsystem that provides real-time data on individual accounts. The systemalso maintains a general ledger, payroll, and voucher system thatprovides detailed historical transactions. Monthly summary and detailreports can be submitted by budget manager for their area of responsibility.Monthly reports are also provided to <strong>Wake</strong> <strong>County</strong>.The information is important and relevant in evaluating the fi nancial conditionof the district. The reports produced from the computer system aredesigned to meet internal and external needs of the district. Reports aregenerated for revenue as well as expenditure accounts.The district also prepares a Comprehensive Annual Financial Report(CAFR) to report the results of operations. The CAFR includes suchreports as a combined balance sheet for all fund types and a combinedstatement of revenue, expenditures, and changes in fund balances for allgovernmental funds.According to G.S. 115C-288: The principal shall maintain a copy ofthe school’s current budget and school improvement plan, includingany amendments to the plan, and shall allow parents of childrenin the school and other interested persons to review and obtainsuch documents.Quarterly Financial ReviewsThe chief business offi cer, finance offi cer, and senior director of budgetmeet with each chief and with the area assistant superintendentsand their principals on a quarterly basis to review human and fi nancialdata such as vacancy rates, lapsed salaries, revenue collections, andexpenditure patterns. Internal controls and risks are also discussed eachquarter.Fraud HotlineThe Internal Audit Department provides a fraud hotline for anonymouscomplaints. That number is 1-866-674-4872.82
District Financial StructureDistrict Legal AuthorityThe <strong>Wake</strong> <strong>County</strong> <strong>Public</strong> <strong>School</strong> <strong>System</strong> (WCPSS) is one comprehensiveschool district serving the entire county. At the helm of the school systemis the board of education and its superintendent. They are committedto providing the highest possible quality of education to <strong>Wake</strong> <strong>County</strong>students, while maintaining fi scal responsibility and accountability. Theboard consists of nine members, elected in districts by the public, whoserve staggered four-year terms. The superintendent is selected by theboard and serves as chief executive offi cer of the school system. Theboard is responsible for setting policy and the superintendent and administrativestaff manage the system’s day-to-day operations. In NorthCarolina, the basic public education program is funded by the state andis augmented with local funds. The board has budget review authority,but it is not a taxing body and must submit its annual budget requests tothe <strong>Wake</strong> <strong>County</strong> Board of Commissioners, which controls allocation offunds to the schools.Finance StructureIn 1975, the General Assembly enacted a law requiring a uniform accountingsystem for all local school administrative units effective July 1,1976. The minimum requirements for the account code structure consistof four dimensions. The dimensions are: fund, purpose, program, andobject.The <strong>Wake</strong> <strong>County</strong> <strong>Public</strong> <strong>School</strong> <strong>System</strong> has adopted a budget-codingsystem, which incorporates the uniform chart of accounts of the StateBoard of Education with three additional dimensions. These dimensionsare: level, cost center, and future use.The purpose of such detail is to enable management at the school andsystem levels to make informed decisions regarding the utilization of limitedresources to provide the most effective educational programs for studentsand to do so as effi ciently as possible. The 23-digit code structureis described thoroughly in the next paragraph.There are seven dimensions in the 23-digit coding scheme used in thebudget: fund, purpose, program, object, level, cost center, and futureuse. The seven dimensions occur in a fi xed sequence. This dimensionclassifi es expenditures and revenues into groups so that meaningfulanalyses can be made. No single dimension used alone would provideenough information for accountability and responsive management. Byrelating a specifi c expenditure to all dimensions, complete accountabilityis realized and more information is available to management.Basis of Presentation - Fund AccountingThe accounts of the board are organized on the basis of funds, eachof which is considered a separate accounting entity. The operations ofeach fund are accounted for with a separate set of self-balancing accountscomprised of assets, liabilities, fund equity, revenues, and expendituresor expenses. Fund accounting segregates funds according totheir intended purpose and is used to aid management in demonstratingcompliance with fi nance-related legal and contractual provisions.The Board’s budgets are adopted as required by the North Carolina GeneralStatutes. Annual budgets are adopted for all funds except for theindividual schools’ special revenue funds, as required by the North CarolinaGeneral Statutes. No budget is required by state law for individualschool funds.The Budget Includes the Following Funds:State <strong>Public</strong> <strong>School</strong> Fund:Appropriations for the current operating expenses of the public schoolsystem from monies made available to the local school administrativeunit by the State Board of Education. These funds are expended accordingto the provisions of the statutes. This is a special revenue fund.Local Current Expense FundThe board’s primary operating fund used to account for all fi nancial resourcesof the board except those required to be accounted for in anotherfund. These appropriations shall be funded by monies made available bythe board of county commissioners, supplemental taxes levied by or onbehalf of the school system, state money disbursed directly to the schoolsystem, and other monies made available or accruing to the school systemfor current operating expenses. This is a general fund.83 FY <strong>2007</strong>-<strong>08</strong> <strong>Plan</strong> for Student Success
District Financial StructureFederal Grant Fund:Appropriations for the expenditure of federal categorical grants made bythe Department of <strong>Public</strong> Instruction and other federal grants allocateddirectly to the school system. These appropriations are categorical innature; i.e., programs and services for children of low-income families;program and services designed to eliminate the effects of previous discriminatorypractices, etc. This is a special revenue fund.Multiple Enterprise Fund:This is an enterprise fund that accounts for the operations of the board’schild nutrition services program. The board’s intent is that the costs, includingdepreciation, of providing food services to the individual schoolsbe partially recovered by user charges. Other enterprise accounts maybe included, such as before and after school care.Capital Outlay Fund:The capital outlay fund accounts for the acquisition of fi xed assets orconstruction of major capital projects not being fi nanced by the enterprisefund. Capital projects are funded by <strong>Wake</strong> <strong>County</strong> appropriations,by the proceeds of <strong>Wake</strong> <strong>County</strong> bonds issued for the construction ofpublic schools, and by certain state assistance. This is a capital projectsfund.The Budget Does Not Include the Following Fund:Expendable Trust Fund:The expendable trust fund is used to account for the revenues and expendituresof the activity funds of the individual schools. The primaryrevenue sources include funds of the various clubs and organizations,receipts from athletic events, proceeds from various fund-raising activities,and private donations. The primary expenditures are for instructionalprograms, athletics, and club activities. <strong>School</strong> activity funds areadministered by the individual schools but are under the supervision andcontrol of the board.Purpose CodesPurpose means the reason for which something exists or is used. Purposeincludes the activities or actions that are performed to accomplishthe objectives of a local school administrative unit. For budgeting andaccounting purposes, expenditures are classifi ed into fi ve categories:5000 Instructional Programs6000 <strong>System</strong>wide Support Services7000 Ancillary Services8000 Non-Programmed Charges9000 Capital OutlayThe “purpose dimension” has four digits and is broken down into a functionlevel at the second digit and, where appropriate, into a sub-functionlevel at the third digit. The fourth digit of this dimension is not in use atthis time except in rare cases and will be indicated in the chart of accounts.Program CodesA program code is a plan of activities or funding designed to accomplisha predetermined objective. This dimension of program report codes allowsthe unit a framework for classifying expenditures by program to determinecost.Object CodesThe object code indicates the service or commodity obtained as a resultof a specifi c expenditure. Seven major object categories are used in theChart of Accounts:100 Salaries200 Employer Provided Benefi ts300 Purchased Services400 Supplies and Materials500 Capital Outlay600 Reserved for Future Use700 TransfersThese broad categories are subdivided to obtain more detailed informationabout objects of expenditures. A three-digit serial number is used toprovide detailed information.84
District Financial StructureLevel CodesFor schools and instructional programs, the level code specifi es the gradeor subject area in the school for which expenditure is proposed. Centraloffi ce budget managers shall prepare the budget for their particular areaof responsibility. This area is generally in the form of a department orsome other sub-group of a department, division or branch. Central offi cebudget managers should use the level code to indicate this sub-groupnumber against which the expenditure is to be charged.Cost Center CodesThe cost center code specifi es the school, central offi ce department, orcentral offi ce division of the school system at which the expenditure is tobe incurred. Each school and central offi ce department has a specifi ccost center for expenditures at each site. Central offi ce departments alsohave cost centers in an “<strong>08</strong>00 series” that indicates expenditures madecentrally on behalf of schools. Examples: substitutes for a workshopsponsored by curriculum and instruction, custodial supplies purchasedcentrally, etc.Debt ObligationIn North Carolina, school systems do not tax directly. <strong>School</strong> systemsrequest local funding from the <strong>County</strong> Commissioners. <strong>County</strong> Commissionersassess property taxes and assume any debt.Legal provisions confl ict with GAAP in that there is no authorization forthe Board to maintain a debt service fund even though the statutes allowcontinuing contracts for capital outlay purchases. In accordance withgovernmental accounting and fi nancial reporting standards, the Boardmaintains its accounts and prepares its budgetary reports on the legallyprescribed (non-GAAP) basis and maintains suffi cient supplemental recordsto permit presentation of the fi nancial statements in conformity withGAAP. Under the legally prescribed budgetary (non-GAAP) basis, allamounts otherwise shown in the debt service fund are included in thecapital projects’ fund; therefore an annual budget is not adopted for thedebt service fund.85 FY <strong>2007</strong>-<strong>08</strong> <strong>Plan</strong> for Student Success
<strong>County</strong> Appropriation and Fund Balance HistoryTOTAL2003-04 2004-05 2005-06 2006-07 <strong>2007</strong>-<strong>08</strong>COUNTY APPROPRIATION<strong>County</strong> Appropriation $223,700,000 $236,405,000 $254,376,000 $275,827,000 $300,744,100% Increase 10% 6% 8% 8% 9%FUND BALANCECURRENT EXPENSEAppropriated July 1 $8,127,366 $15,214,<strong>08</strong>1 $7,000,000 $8,000,000 $12,928,333Additional Appropriations $4,697,444 $1,235,679 $2,565,417 $4,137,342 $0Undesignated $9,980,752 $15,893,117 $22,2<strong>08</strong>,771 $18,000,000 1 $0CAPITAL OUTLAYAppropriated July 1 $0 $0 $2,000,000 $587,412 $0Additional Appropriations $1,358,393 $5,977,414 $4,386,174 $9,582,452 $0Undesignated $2,229,032 $587,412 $673,596 $0 $0TOTALAppropriated July 1 $8,127,366 $15,214,<strong>08</strong>1 $9,000,000 $8,587,412 $12,928,333Additional Appropriations $6,055,837 $7,213,093 $6,951,591 $13,719,794 $0Undesignated $12,209,784 $16,480,529 $22,882,367 $18,000,000 1 $0Undesignated fund balance as apercent of subsequent year countyappropriation5.2% 6.5% 8.3% 6.0%Fund BalanceYear-end fund balance of school districts are the results of the recognitionof revenues in excess of amounts estimated and expenditures thatare less than the total amount of appropriations. The total fund balanceof a school district’s general fund is made up of two parts: ReservedFund Balance and Unreserved Fund Balance. The reserved portion ofthe fund balance is made up of monies that may be used only for veryspecifi c purposes and is, therefore, not available to be used to supplementthe budget in the subsequent fi scal year. The unreserved portion ofthe fund balance is the amount, which is uncommitted and is, therefore,available to be used to supplement the budget in the next fi scal year. Itshould be noted, however, that a part of this unreserved fund balancemay be retained by the district and not used to supplement the budget inthe next upcoming year. This retained portion is called the unappropriatedfund balance. The remaining portion of the unreserved fund balancethat is used to supplement the budget is the appropriated fund balance.1Our goal is to maintain undesignated fund balance at 6% of the subsequent year’s county appropriation. We are projectingan undesignated fund balance of $18,000,000 for June 30, <strong>2007</strong> based on a county appropriation of $300,744,100for 2006-07.86
Fund BalanceQuestions and Answers about Fund BalanceWhat is a fund balance? What are the different categories of afund balance? Why does the <strong>Wake</strong> <strong>County</strong> <strong>Public</strong> <strong>School</strong> <strong>System</strong>(WCPSS) need a fund balance?Fund balance is created from excess revenues over expenditures. Thiscan be a combination of collections/revenues being higher than budgetand actual expenditures being lower than budget.Fund balance is comprised of several different categories:Reserved Fund Balance – The portion of fund balance that refl ects fi nancialassets that are not available for spending. Reserved Fund Balancecategories include:o Reserves required for special projectso Reserves required for self insuranceo Reserves required for encumbranceso Reserves required by state statuteo Reserves required for inventoriesUnreserved Fund Balance – That portion of fund balance that refl ectsexpendable, available fi nancial resources. Unreserved Fund Balancecategories include:o Designated for fl exible benefi ts plano Designated amounts used to balance the annual budgeto Undesignated Fund Balance – operating and capital componentsIt is the Undesignated Fund Balance contained within the UnreservedFund Balance that can be utilized by the Board of Education during theyear. Categories of Board of Education usage of the Undesignated FundBalance typically include:o Emergency situations requiring cash fl owo Funding of one time costs not included in the annual budget(e.g. curriculum audit).The Board of Education is required to discuss and vote on any use ofUndesignated Fund Balance during the public portion of its meetings.How much of an Unreserved Undesignated Fund Balance is necessary?Opinions vary. Two years ago, then Superintendent McNeal establisheda Finance Advisory Committee that included business professionals from<strong>Wake</strong> <strong>County</strong> and <strong>Wake</strong> <strong>County</strong> Government management staff. Thecommittee discussed WCPSS maintaining a six percent UndesignatedFund balance of the following year’s county appropriation.The University of North Carolina at Chapel Hill Institute of Governmentproduced a document in the late 1980’s with information on fund balancefor local governments and school systems. The article states thatschool systems do not need Unreserved Undesignated Fund balancesas large as local governments because the school systems are not taxingauthorities. The article states smaller school systems should havean Undesignated Fund balance of eight percent of general expenditures.The article further states that larger school systems such as WCPSSshould maintain Undesignated Fund balances in the range of six percentof total general expenditures.Currently, WCPSS targets maintenance of an Undesignated Fund Balanceof six percent of the following year’s county appropriation. This isin line with the Finance Advisory Committee consensus from two yearsago, and materially less than the Institute of Government recommendationof six percent of total general expenditures.Do other school systems have Unreserved Undesignated Fund Balance?Yes, other school systems have Unreserved Undesignated Fund balances.Outside of North Carolina, the Unreserved Undesignated Fund balancesmay be maintained at a higher rate as a result of most non-NorthCarolina school systems having taxing authority.In North Carolina, the Unreserved Undesignated Fund balances vary dependingon the school system. A comparison of four systems within thestate showed Unreserved Undesignated Fund balance ranging from onepercent of total local funding to 27 percent of total local funding.87 FY <strong>2007</strong>-<strong>08</strong> <strong>Plan</strong> for Student Success
Fund BalanceWhat have Unreserved Undesignated Funds been used forin the past five years?25,000,000History of Appropriated Fund Balance$22,427,174$22,307,206In fiscal year <strong>2007</strong>, Unreserved Undesignated Fund Balancewas appropriated by the Board of Education for Band and StringsExtra Duty Pay, the Curriculum Audit, and costs associated withthe Conversion of <strong>School</strong>s to the year round calendar.20,000,000$14,183,203$15,951,591In fiscal year 2006, Unreserved Undesignated Fund Balancewas appropriated by the Board of Education for the SummerfordFraud Vulnerability Audit.15,000,00010,000,000$12,928,333In fiscal year 2005, Unreserved Undesignated Fund Balancewas appropriated by the Board of Education for activity andschool buses.5,000,000In fiscal year 2004, Unreserved Undesignated Fund Balancewas appropriated by the Board of Education for activity buses.In fiscal year 2002, Unreserved Undesignated Fund Balancewas appropriated by the Board of Education for activity buses.02004 2005 2006 <strong>2007</strong> 20<strong>08</strong>History of Undesignated (not appropriated) Fund BalanceWhat discussions have taken place to reach consensuson the targeted amount of Unreserved Undesignated FundBalance the WCPSS should maintain?25,000,000$22,882,367Two years ago, WCPSS staff and <strong>Wake</strong> <strong>County</strong> staff discussedusing six percent of the following year’s county appropriationto target as the Unreserved Undesignated Fund Balance to bemaintained. No formal action was taken by the Board of Educationbased upon this discussion.20,000,00015,000,000$12,209,784$16,480,529$18,000,00010,000,0005,000,000Unavailable02004 2005 2006 <strong>2007</strong> 20<strong>08</strong>88
Budget ResolutionWAKE COUNTY PUBLIC SCHOOL SYSTEMBUDGET RESOLUTIONWAKE COUNTY )NORTH CAROLINA )I, Del Burns, Secretary to the <strong>Wake</strong> <strong>County</strong> Board of Education, DO HEREBY CERTIFY thatthe attached is a true and correct copy from the minutes of the meeting of the Board as of July 17, <strong>2007</strong>.IN WITNESS WHEREOF, I have hereunto set my hand and have hereunto affixed the seal ofthe <strong>Wake</strong> <strong>County</strong> Board of Education this 17 th day of July <strong>2007</strong>._________________________Secretary, Board of EducationBE IT RESOLVED by the Board of Education of the <strong>Wake</strong> <strong>County</strong> <strong>School</strong> Administrative Unit:Section I - The following amounts are hereby appropriated for the operation of the schooladministrative unit in the Local Current Expense Fund for the fiscal year beginning July 1, <strong>2007</strong>, andending June 30, 20<strong>08</strong>:Instructional ProgramsRegular Instructional ProgramsRegular Curricular Services $ 98,838,928.32CTE Curricular Services 3,660,809.00Special Populations ServicesChildren with Disabilities Curricular Services 17,868,970.34Children with Disabilities CTE Curricular Services 127,229.00Pre-K Children with Disabilities Curricular Services 17,865.00Speech and Language Pathology Services 2,829,023.50Audiology Services 248,992.00Academically/Intellectually Gifted Curricular Services 974,052.00Limited English Proficiency Services 1,807,915.00Alternative Programs and ServicesAlternative Instructional Services K-12 762,212.00Attendance and Social Work Services 638,525.00Remedial and Supplemental K-12 Services 7,<strong>08</strong>1,312.63Pre-K Readiness/Remedial and Supplemental Services 2,797,570.75Extended Day/Year Instructional Services 969,018.59<strong>School</strong> Leadership Services 27,976,003.49Co-Curricular Services 7,076,199.00<strong>School</strong>-Based Support ServicesEducational Media Services 2,582,827.51Student Accounting 12,057.00Guidance Services 4,319,897.32Health Support Services 1,071,463.75Instructional Technology Services 159,167.00Staff Development Unallocated 2,024,171.92Parent Involvement Services 161,171.00<strong>System</strong>wide Support ServicesSupport and Developmental ServicesRegular Curricular Support and Development Services 6,205,839.91CTE Curricular Support and Developmental Services 240,130.00Special Population Support and Development Services 1,998,604.01Alternative Programs and Services Support and Development Services 1,115,259.0<strong>08</strong>9 FY <strong>2007</strong>-<strong>08</strong> <strong>Plan</strong> for Student Success
Budget ResolutionTechnology Support Services 13,070,255.13Operational Support ServicesCommunication Services 7,5<strong>08</strong>,647.67Printing and Copying Services 142,167.00<strong>Public</strong> Utility and Energy Services 28,307,160.00Custodial/Housekeeping Services 13,263,740.51Transportation Services 13,400,582.89Warehouse and Delivery Services 312,952.37Facilities <strong>Plan</strong>ning, Acquisition and Construction Services 7,534,355.87Maintenance Services 28,893,132.22Financial and Human Resource ServicesFinancial Services 9,988,357.47Human Resource Services 8,469,560.03Accountability ServicesStudent Testing Services 758,942.00<strong>Plan</strong>ning, Research Development and Program Evaluation 1,519,686.63<strong>System</strong>wide Pupil Support ServicesEducational Media Support Services 131,785.00Student Accounting Support Services 1,821,407.72Guidance Support Services 424,418.00Safety and Security Support Services 2,299,645.89Instructional Technology Support Services 210,438.62Policy, Leadership and <strong>Public</strong> Relations ServicesBoard of Education 1,003,051.77Audit Services 524,158.06Leadership Services 4,307,782.67<strong>Public</strong> Relations and Marketing Services 1,572,464.41Ancillary ServicesCommunity Services 250,682.00Non-Programmed ChargesPayments to Other Governmental Units 10,<strong>08</strong>3,465.00Unbudgeted Funds 123,183.00Total Local Current Expense Fund Appropriation $ 349,487,235.97Section 2 - The following revenues are estimated to be available to the Local Current ExpenseFund for the fiscal year beginning July 1, <strong>2007</strong>, and ending June 30, 20<strong>08</strong>:Federal Allocations $ 1,495,000.00State Allocations 10,638,337.94<strong>County</strong> Appropriation 296,964,799.00Fund Balance Appropriated 17,730,667.56Local Revenues 22,658,431.47Total Local Current Expense Fund Revenue $ 349,487,235.97Section 3 - The following amounts are hereby appropriated for the operation of the schooladministrative unit in the State <strong>Public</strong> <strong>School</strong> Fund for the fiscal year beginning July 1, <strong>2007</strong>, andending June 30, 20<strong>08</strong>:Instructional ProgramsRegular Instructional ServicesRegular Curricular Services $ 388,517,521.30CTE Curricular Services 21,842,522.00Special Populations ServicesChildren with Disabilities Curricular Services 78,037,148.00Children with Disabilities CTE Curricular Services 921,151.00Audiology Services 321,699.00Academically/Intellectually Gifted Curricular Services 6,068,458.00Limited English Proficiency Services 7,859,779.00Alternative Programs and ServicesAlternative Instructional Services K-12 4,<strong>08</strong>4,754.00Attendance and Social Work Services 3,907,697.00Remedial and Supplemental K-12 Services 12,722,428.98Extended Day/Year Instructional Services 1,693,341.00<strong>School</strong> Leadership Services 38,851,116.00Co-Curricular Services 48,717.00<strong>School</strong>-Based Support ServicesEducational Media Services 16,970,656.67Student Accounting 5,922,5<strong>08</strong>.00Guidance Services 28,715,760.00Health Support Services 2,103,347.00Safety and Security Support Services 854,728.00Instructional Technology Services 28,430.00Staff Development Unallocated 1,353,194.64Parent Involvement Services 800,768.00<strong>System</strong>wide Support ServicesSupport and Developmental ServicesRegular Curricular Support and Development Services 1,807,000.00CTE Curricular Support and Developmental Services 1,181,489.00Special Population Support and Development Services 3,<strong>08</strong>6,760.00Alternative Programs and Services Support and Development Services 450,584.00Technology Support Services 1,717,567.00Operational Support ServicesCustodial/Housekeeping Services 16,205,744.00Transportation Services 40,803,912.00Financial and Human Resource ServicesFinancial Services 114,727.00Human Resource Services 96,682.00Accountability Services<strong>Plan</strong>ning, Research Development and Program Evaluation 59,048.00<strong>System</strong>wide Pupil Support Services90
Budget ResolutionEducational Media Support Services 99,777.00Student Accounting Support Services 44,363Health Support Services 114,727.00Instructional Technology Support Services 197,847.00Policy, Leadership and <strong>Public</strong> Relations ServicesLeadership Services 971,374.00Ancillary ServicesCommunity Services 1,722.00Total State <strong>Public</strong> <strong>School</strong> Fund Appropriation $ 688,579,047.59Section 4 - The following revenues are estimated to be available to the State <strong>Public</strong> <strong>School</strong> Fundfor the fiscal year beginning July 1, <strong>2007</strong>, and ending June 30, 20<strong>08</strong>:State <strong>Public</strong> <strong>School</strong> Fund Allocation $ 688,579,047.59Total State <strong>Public</strong> <strong>School</strong> Fund Revenue $ 688,579,047.59Section 5 - The following amounts are hereby appropriated for the operation of the schooladministrative unit in the Federal Grant Fund for the fiscal year beginning July 1, <strong>2007</strong>, and ending June30, 20<strong>08</strong>:Instructional ProgramsRegular Instructional ServicesRegular Curricular Services $ 1,190,242.65CTE Curricular Services 1,199,450.38Special Populations ServicesChildren with Disabilities Curricular Services 15,703,826.32Pre-K Children with Disabilities Curricular Services 298,475.37Speech and Language Pathology Services 5,116,490.<strong>08</strong>Limited English Proficiency Services 1,052,461.76Alternative Programs and ServicesAttendance and Social Work Services 276,305.63Remedial and Supplemental K-12 Services 13,380,907.39Pre-K Readiness/Remedial and Supplemental Services 815,562.32Extended Day/Year Instructional Services 1,191,995.53<strong>School</strong>-Based Support ServicesGuidance Services 247,075.11Safety and Security Support Services 48,578.00Staff Development Unallocated 3,988,978.53Parent Involvement Services 428,653.<strong>08</strong><strong>System</strong>wide Support ServicesSupport and Developmental ServicesRegular Curricular Support and Development Services 7,066,924.98Special Population Support and Development Services 343,723.53Alternative Programs and Services Support and Development Services 535,146.30Technology Support Services 149,920.52Operational Support ServicesTransportation Services 244,062.50Financial and Human Resource ServicesHuman Resource Services 14,613.00Accountability Services<strong>Plan</strong>ning, Research Development and Program Development 10,000.00<strong>System</strong>wide Pupil Support ServicesSafety and Security Support Services 68,096.00Ancillary ServicesNutrition Services 900.00Non-Programmed ChargesPayments to Other Governmental Units 2,385,644.84Unbudgeted Funds 1,198,030.99Total Federal Grant Fund Appropriation $ 56,956,064.81Section 6 - The following revenues are estimated to be available to the Federal Grant Fund for thefiscal year beginning July 1, <strong>2007</strong>, and ending June 30, 20<strong>08</strong>:Total Federal Grant Fund Allocation $ 56,956,064.81Section 7 - The following amounts are hereby appropriated for the operation of the schooladministrative unit in the Multiple Enterprise Fund for the fiscal year beginning July 1, <strong>2007</strong>, andending June 30, 20<strong>08</strong>:Instructional ProgramsAlternative Programs and ServicesPre-K Readiness/Remedial and Supplemental Services $ 264,501.00Extended Day/Year Instructional Services 17,685.00Ancillary ServicesCommunity Services 10,501,306.84Nutrition Services 39,874,933.00Adult Services 850,193.33Non-Programmed ChargesPayments to Other Governmental Units 4,7<strong>08</strong>,538.24Capital Outlay 389,560.00Total Multiple Enterprise Fund Appropriation $ 56,606,717.4191 FY <strong>2007</strong>-<strong>08</strong> <strong>Plan</strong> for Student Success
Budget ResolutionSection 8 - The following revenues are estimated to be available to the Multiple Enterprise Fundfor the fiscal year beginning July 1, <strong>2007</strong>, and ending June 30, 20<strong>08</strong>:Federal Allocations $ 17,363,119.00Local Revenues 39,243,598.41Total Multiple Enterprise Fund Revenue $ 56,606,717.41Section 9 - The following amounts are hereby appropriated for the operation of the schooladministrative unit in the Capital Outlay Fund for the fiscal year beginning July 1, <strong>2007</strong>, and endingJune 30, 20<strong>08</strong>:Capital OutlayInstructional Programs<strong>School</strong>-Based Support ServicesEducational Media Services $ 2,697,509.29<strong>System</strong>wide Support ServicesTechnology Support Services 12,289,821.43Operational Support ServicesTransportation Services 668,672.00Facilities <strong>Plan</strong>ning, Acquisition and Construction Services 556,549,537.28Maintenance Services 324,750.00Financial and Human Resource ServicesFinancial Services 45,330.00Non-Programmed ChargesPayments to Other Governmental Units 454,259.15Interfund Transfers 5,939,242.85Capital Outlay 59,149,506.56Total Capital Outlay Fund Appropriation $ 638,118,628.56Section 10 - The following revenues are estimated to be available to the Capital Outlay Fund forthe fiscal year beginning July 1, <strong>2007</strong>, and ending June 30, 20<strong>08</strong>:<strong>County</strong> Appropriation $ 3,779,301.00Interest Earned on Investments 150,000.00Fund Balance Appropriated 1,285,810.27Bond and Note Proceeds 632,903,517.29Section 11 - All appropriations shall be paid first from revenues restricted as to use and then fromgeneral unrestricted revenues.Section 12 - The superintendent is hereby authorized to:A. Transfer appropriations under the following conditions:1. The superintendent may not transfer any amounts between funds nor from anycontingency appropriation within a fund without Board of Education approval.2. The superintendent may transfer amounts between purposes and between functionswithin a purpose. A summary of all such transfers must be reported to the Board ofEducation quarterly.3. The superintendent may transfer any amounts in State or Federal projects upon priorapproval of the appropriate funding agency. If such transfers require Board of Educationapproval under other provisions of this resolution, they must be reported quarterly.B. Accept appropriations into the budget under the following conditions:1. The superintendent may accept all State appropriations. A summary of suchappropriations must be reported to the Board of Education quarterly.2. The superintendent may accept Federal appropriations if the application for funding hasbeen approved by the Board of Education. A summary of such appropriations must bereported to the Board of Education quarterly.3. The superintendent may accept categorical program appropriations if the program hasbeen approved by the Board of Education. A summary of such appropriations must bereported to the Board of Education quarterly.4. The superintendent may accept other appropriations upon prior approval of the Board ofEducation.Section 13 - Copies of the Budget Resolution shall be furnished immediately to the superintendentand the school finance officer for direction in carrying out their duties. Copies of the Budget Resolutionshall also be filed with the county finance officer.<strong>Adopted</strong> this 17th day of July <strong>2007</strong>.Total Capital Outlay Fund Revenue $ 638,118,628.5692
Budgetary Assumptions for Anticipated RevenueThe assumptions identifi ed below describe how the proposed revenuebudget fi gures for <strong>2007</strong>-<strong>08</strong> were calculated. In addition, the <strong>Plan</strong> forStudent Success includes revenue forecasts for 20<strong>08</strong>-09 and 2009-10.StateState revenues are projected by applying the current allotment formulasto projected growth fi gures for student membership, staff levels, andnumber of sites, plus adjustments for salary increases and employermatching benefi t rate fl uctuations.FederalFederal grants operate on various cycles. If we are certain of the fundinglevel for a particular grant for the next several years, we include thatfi gure in the budget. If a grant is formula-driven, we project fl uctuationsin revenue for the next three years based on the populations served andthe requirements of the grant. If a grant is competitive in nature, weinclude an estimate of the revenues if we are fairly certain the grant willbe awarded. For grants that span multiple fi scal years, we estimate theamount of carryover and include this in the budget. Typically carryforwardrevenues support the costs of the grant from one grant cycle to thenext.historical collections, projected interest rates, and cash fl ow. Studentsupport staff estimate Medicaid reimbursement based on amounts submittedand estimated timelines for reimbursement. Print Shop fees areestimated by Communications staff based on billings to external clients.The Print Shop is an internal service fund. Accounting staff estimateindirect cost revenues based on the expenditures in grants and self-supportingprograms.<strong>County</strong> appropriation and fund balance revenue fi gures are determinedlast. After our strategic plan is costed out, we determine the amount ofrevenues from state, federal, enterprise, and categorical local programsthat can be applied fi rst towards these costs. In the end there will be aresidual cost that the Superintendent and Board of Education must determinehow to fund. This is typically the most controversial issue in theprocess. There are several options:a. Request an increase from the count commissioners.b. Adjust the amount of fund balance appropriation. We try tomaintain undesignated fund balance at a level equal to 6 percent ofthe subsequent year’s county appropriation.c. Determine a new revenue stream.d. Reduce costs by changing funding formulas, removing programs,or reducing services.EnterpriseWe assume revenues for tuition-driven programs will be at approximatelythe same level as in the current year. Child nutrition staff project revenuesbased on historical participation rates, anticipated costs for theyear, and the estimated fl ow of federal commodities. Community schoolsstaff project revenues for fee-driven programs based on experience levelsand the number of sites that will be operating.LocalCategorical grants and contracts in the local budget are estimated usingthe same assumptions as the federal grants. Accounting staff estimaterevenue levels for fi nes and forfeitures and interest earned based on93 FY <strong>2007</strong>-<strong>08</strong> <strong>Plan</strong> for Student Success
Anticipated RevenuesThe Anticipated Revenue schedules are a comparison of three years of budget by funding source, plus two years of forecasted revenues. Governmentalfi nancial reporting focuses on grouping of various funds rather than as a whole. Fund accounting is developed from legal compliance andresource limitation issues. Data is presented for each fund to show all sources of revenue. In public sector accounting, budgeted revenues representan authorization to spend funds.Source of Income Budget 2005-06 Budget 2006-07 Budget <strong>2007</strong>-<strong>08</strong>Increase/DecreaseState <strong>Public</strong> <strong>School</strong> Fund%ChangeForecasted 20<strong>08</strong>-09%ChangeForecasted 2009-10%ChangeClassroom Teachers $ 265,893,826 $ 297,781,999 $ 332,519,416 $ 34,737,417 12% $ 364,997,282 10% $ 397,188,004 9%Foreign Exchange 2,200,180 1,683,314 2,161,733 478,419 28% 2,252,716 4% 2,339,976 4%Conversions (32,826) (32,907) 0 32,907 100% 0 0% 0 0%268,061,180 299,432,406 334,681,149 35,248,743 12% 367,249,998 10% 399,527,980 9%Children with Special Needs 47,370,601 53,729,766 59,397,385 5,667,619 11% 65,533,356 10% 71,793,146 10%Teacher Assistants 37,234,044 42,223,696 48,045,653 5,821,957 14% 52,363,697 9% 56,044,821 7%Conversions (6,875,683) (8,027,141) (4,817,824) 3,209,317 40% (4,669,405) (3%) (4,902,834) 5%30,358,361 34,196,555 43,227,829 9,031,274 26% 47,694,292 10% 51,141,987 7%Transportation 36,<strong>08</strong>6,286 38,803,697 40,7<strong>08</strong>,373 1,904,676 5% 43,229,132 6% 46,195,600 7%Instructional Support 32,122,255 36,181,845 40,587,490 4,405,645 12% 44,044,303 9% 47,491,955 8%Conversions (64,621) (57,044) (57,044) 0 0% 0 0% 0 0%32,057,634 36,124,801 40,530,446 4,405,645 12% 44,044,303 9% 47,491,955 8%Noninstructional SupportPersonnel 28,503,535 32,069,027 35,205,384 3,136,357 10% 38,068,330 8% 40,948,017 8%Substitute Pay andHolocaust WorkshopReimbursement 293,440 317,351 0 (317,351) (100%) 0 0% 0 0%Textbook Comm. Cler. Asst. 6,000 9,000 0 (9,000) (100%) 12,000 0% 12,000 0%Conversions (26,<strong>08</strong>0) 14,860 0 (14,860) (100%) 0 0% 0 0%28,776,895 32,410,238 35,205,384 2,795,146 9% 38,<strong>08</strong>0,330 8% 40,960,017 8%Career and TechnicalEducation Months of Empl. 24,385,294 27,547,151 30,447,820 2,900,669 11% 33,530,568 10% 36,674,963 9%Conversions (883,272) (468,786) 0 468,786 100% 0 0% 0 0%23,502,022 27,078,365 30,447,820 3,369,455 12% 33,530,568 10% 36,674,963 9%<strong>School</strong> Building Admin. 20,629,248 22,905,826 24,834,537 1,928,711 8% 27,265,211 10% 29,935,834 10%Conversions 0 (6,995) 0 6,995 100% 0 0% 0 0%20,629,248 22,898,831 24,834,537 1,935,706 8% 27,265,211 10% 29,935,834 10%At-Risk Student Services/Alternative <strong>School</strong>s 12,144,305 14,036,168 15,702,990 1,666,822 12% 16,353,558 4% 17,073,301 4%Carryforward 380,660 770,058 0 (770,058) (100%) 0 0% 0 0%Discretionary Reduction (1,230,932) 0 0 0 0 0% 0 0%11,294,033 14,806,226 15,702,990 896,764 6% 16,353,558 4% 17,073,301 4%94
Anticipated RevenuesSource of Income Budget 2005-06 Budget 2006-07 Budget <strong>2007</strong>-<strong>08</strong>Increase/Decrease%ChangeForecasted 20<strong>08</strong>-09%ChangeForecasted 2009-10%ChangeNoncontributoryEmployee Benefits 9,731,361 12,223,119 10,428,651 (1,794,468) (15%) 10,969,179 5% 11,484,396 5%Incentive Award 10,602,849 8,749,486 8,749,485 (1) 0% 8,749,485 0% 8,749,485 0%Classroom Material, InstructionalSupplies, Equipment 6,058,363 6,701,828 7,458,405 756,577 11% 7,593,519 2% 8,020,944 6%Conversions 1,472,980 2,988,926 0 (2,988,926) (100%) 0 0% 0 0%Discretionary Reduction (1,700,706) 0 0 0 0 0% 0 0%5,830,637 9,690,754 7,458,405 (2,232,349) (23%) 7,593,519 2% 8,020,944 6%Academically/Intell. Gifted 4,571,503 5,146,907 5,882,187 735,280 14% 6,520,645 11% 7,160,817 10%Discretionary Reduction (230) 0 0 0 0% 0 0% 0 0%4,571,273 5,146,907 5,882,187 735,280 14% 6,520,645 11% 7,160,817 10%Limited English 3,412,615 4,237,193 4,875,168 637,975 15% 5,303,597 9% 5,828,143 10%Dollars for K-3 TeachersConversions 6,902,386 8,055,663 4,817,824 (3,237,839) (40%) 4,669,405 (3%) 4,902,834 5%Central Office Administration 3,952,588 4,231,738 4,784,105 552,367 13% 4,911,922 3% 5,019,838 2%<strong>School</strong> Technology Fund 854,189 885,143 1,045,946 160,803 18% 1,003,924 (4%) 1,060,876 6%Interest, fines, forfeitures 1,862,951 1,702,358 2,635,415 933,057 55% 1,789,280 (32%) 1,896,636 6%Carryforward 644,661 811,714 0 (811,714) (100%) 0 0% 0 0%Discretionary Reduction (853,823) 0 0 0 0% 0 0% 0 0%2,507,978 3,399,215 3,681,361 282,146 8% 2,793,204 (24%) 2,957,512 6%Improving Student AccountabilityCurrent Year 2,218,513 3,173,851 3,405,370 231,519 7% 3,603,098 6% 3,781,741 5%Carryforward 1,259 4,187 0 (4,187) (100%) 0 0% 0 0%2,219,772 3,178,038 3,405,370 227,332 7% 3,603,098 6% 3,781,741 5%Driver Training 2,812,894 2,951,112 3,144,090 192,978 7% 2,951,112 (6%) 2,951,112 0%Career and Technical EducationProgram Support 1,415,536 1,5<strong>08</strong>,019 1,612,018 103,999 7% 1,689,458 5% 1,766,735 5%Conversions 883,272 468,786 0 (468,786) (100%) 0 0% 0 0%Discretionary Reduction (1,000) 0 0 0 0% 0 0% 0 0%2,297,8<strong>08</strong> 1,976,805 1,612,018 (364,787) (18%) 1,689,458 5% 1,766,735 5%Special Program Funds - EC 1,637,249 1,763,837 1,607,256 (156,581) (9%) 1,607,256 0% 1,607,256 0%Disadvantaged StudentSupplemental Funding 0 1,199,955 1,350,162 150,207 13% 1,249,679 (7%) 1,265,393 1%95 FY <strong>2007</strong>-<strong>08</strong> <strong>Plan</strong> for Student Success
Anticipated RevenuesSource of Income Budget 2005-06 Budget 2006-07 Budget <strong>2007</strong>-<strong>08</strong>Increase/Decrease%ChangeForecasted 20<strong>08</strong>-09%ChangeForecasted 2009-10%ChangeStaff Development 717,133 754,002 1,001,967 247,965 33% 823,713 (18%) 859,829 4%Carryforward 173,275 192,156 0 (192,156) (100%) 0 0% 0 0%890,4<strong>08</strong> 946,158 1,001,967 55,809 6% 823,713 (18%) 859,829 4%Assistant Principal Interns 477,856 313,222 347,560 34,338 11% 366,676 6% 385,009 5%High <strong>School</strong> Learn and Earn 40,000 297,073 303,379 6,306 2% 3<strong>08</strong>,764 2% 313,962 2%Behavioral Support 209,071 2<strong>08</strong>,633 214,946 6,313 3% 226,263 5% 237,175 5%Instructional Support -Noncertified 37,918 99,435 101,164 1,729 2% 102,685 2% 103,979 1%Literacy Coaches 0 47,674 50,934 3,260 7% 53,715 5% 56,400 5%NBPTS Certification 35,844 43,945 14,341 (29,604) (67%) 14,341 0% 14,341 0%Waivers for AllotmentsConverted to Dollars 39,772 13,662 12,762 (900) (7%) 0 0% 0 0%Intervention/Assistance TeamFunding 600,566 651,532 0 (651,532) (100%) 779,460 0% 818,328 5%Special Position Allotment 79,669 87,896 0 (87,896) (100%) 100,070 0% 105,073 5%Compensation Bonus 429,420 33,778 0 (33,778) (100%) 0 0% 0 0%Closing the Gap 286 0 0 0 0% 0 0% 0 0%TOTAL - STATE $ 557,456,480 $ 629,027,715 $ 688,579,048 $ 59,551,333 9% $ 748,367,994 9% $ 809,185,<strong>08</strong>5 8%Local Current Expense FundOther State AllocationsTextbooks 1Current Year Allotment $ 7,438,639 $ 8,313,535 $ 7,625,870 $ (687,665) (8%) $ 9,422,332 24% $ 9,956,961 6%Less: Adv Spending 2006 (2,896,676) (4,455,282) 0 4,455,282 100% 0 0% 0 0%Textbooks - Advance 7,529,809 8,794,726 0 (8,794,726) (100%) 0 0% 0 0%Carryforward 3,515,416 4,257,545 2,901,967 (1,355,578) (32%) 0 0% 0 0%Conversions (1,472,980) (2,949,024) 0 2,949,024 100% 0 0% 0 0%14,114,2<strong>08</strong> 13,961,500 10,527,837 (3,433,663) (25%) 9,422,332 (11%) 9,956,961 6%96
Anticipated RevenuesSource of Income Budget 2005-06 Budget 2006-07 Budget <strong>2007</strong>-<strong>08</strong>Increase/Decrease%ChangeForecasted 20<strong>08</strong>-09%ChangeForecasted 2009-10%ChangeState Improvement Project 40,000 60,000 60,000 0 0% 60,000 0% 60,000 0%Carryforward 7,<strong>08</strong>6 32,680 0 (32,680) (100%) 0 0% 0 0%47,<strong>08</strong>6 92,680 60,000 (32,680) (35%) 60,000 0% 60,000 0%Governor's Crime Comm. 34,141 26,254 25,500 (754) (3%) 0 100% 0 0%Emergent Literacy 43,000 0 20,000 20,000 0% 20,000 0% 20,000 0%Carryforward 48,220 23,5<strong>08</strong> 5,000 (18,5<strong>08</strong>) (79%) 4,500 0% 3,000 0%91,220 23,5<strong>08</strong> 25,000 1,492 6% 24,500 0% 23,000 0%Mobile Source EmissionReductionCarryforward 100,000 100,000 0 (100,000) (100%) 0 0% 0 0%NC State-Project QuestSub Award 0 86,820 0 (86,820) (100%) 0 0% 0 0%Project EnlightenmentLegislative Appropriation 100,000 50,000 0 (50,000) (100%) 0 0% 0 0%Carryforward 0 1,597 0 (1,597) (100%) 0 0% 0 0%100,000 51,597 0 (51,597) (100%) 0 0% 0 0%LSTA <strong>School</strong> Library Grant 0 42,966 0 (42,966) (100%) 0 0% 0 0%Teacher on Loan 9,000 21,228 0 (21,228) (100%) 0 0% 0 0%Carryforward 3,793 0 0 0 0% 0 0% 0 0%12,793 21,228 0 (21,228) (100%) 0 0% 0 0%Professional Leave Paid byOutside Agencies 0 9,974 0 (9,974) (100%) 0 0% 0 0%Regional Teacher of the Year 0 8,739 0 (8,739) (100%) 0 0% 0 0%State Funds for Local Portion ofTeacher Pay Rate Approved byGovernor 485,019 0 0 0 0% 0 0% 0 0%Community Services GrantCarryforward 22,902 0 0 0 0% 0 0% 0 0%USDLC Star-Online ProjectCarryforward 21,049 0 0 0 0% 0 0% 0 0%Math Best Practice Center 20,000 0 0 0 0% 0 0% 0 0%97 FY <strong>2007</strong>-<strong>08</strong> <strong>Plan</strong> for Student Success
Anticipated RevenuesSource of Income Budget 2005-06 Budget 2006-07 Budget <strong>2007</strong>-<strong>08</strong>Increase/Decrease%ChangeForecasted 20<strong>08</strong>-09%ChangeForecasted 2009-10%ChangeScholarship Award 1,700 0 0 0 0% 0 0% 0 0%Refugee Impact AidCarryforward 117 0 0 0 0% 0 0% 0 0%Subtotal State Sources $ 15,050,235 $ 14,425,266 $ 10,638,337 $ (3,786,929) (26%) $ 9,506,832 (11%) $ 10,039,961 6%Federal Sources - UnrestrictedImpact Area Grants $ 10,000 $ 10,000 $ 10,000 $ 0 0% $ 10,000 0% $ 10,000 0%Federal Sources - RestrictedN.C. Medicaid AdministrativeOutreach $ 812,565 $ 747,197 $ 1,000,000 $ 252,803 34% $ 1,000,000 0% $ 1,000,000 0%Carryforward 3,281 8,748 10,000 1,252 14% 10,000 0% 10,000 0%815,846 755,945 1,010,000 254,055 34% 1,010,000 0% 1,010,000 0%Medicaid DirectReimbursement 190,551 300,000 300,000 0 0% 300,000 0% 300,000 0%Carryforward 131,955 99,560 0 (99,560) (100%) 0 0% 0 0%322,506 399,560 300,000 (99,560) (25%) 300,000 0% 300,000 0%ROTC 175,000 175,000 175,000 0 0% 175,000 0% 175,000 0%Subtotal Federal Sources $ 1,323,352 $ 1,340,505 $ 1,495,000 $ 154,495 12% $ 1,495,000 0% $ 1,495,000 0%Local Sources - General<strong>County</strong> AppropriationWCPSS $ 242,487,847 $ 264,738,496 $ 287,063,160 $ 22,324,664 8% $ 314,282,460 9% $ 337,830,125 7%Charter <strong>School</strong>s 8,759,897 9,490,516 9,901,639 411,123 4% 10,645,913 8% 11,219,868 5%Subtotal <strong>County</strong> $ 251,247,744 $ 274,229,012 $ 296,964,799 $ 22,735,787 8% $ 324,928,373 9% $ 349,049,993 7%Local Sources - Tuition and FeesParking Fees $ 700,000 $ 704,160 $ 704,160 $ 0 0% $ 729,160 4% $ 754,160 3%Preschool Programs 95,040 106,560 112,320 5,760 5% 118,<strong>08</strong>0 5% 123,840 5%Carryforward 39,982 38,769 12,000 (26,769) (69%) 12,000 0% 12,000 0%135,022 145,329 124,320 (21,009) (14%) 130,<strong>08</strong>0 5% 135,840 4%Regular Tuition 90,000 95,000 50,000 (45,000) (47%) 50,000 0% 50,000 0%Print Shop 50,282 44,926 47,300 2,374 5% 47,300 0% 47,300 0%Subtotal Local Sources -Tuition and Fees $ 975,304 $ 989,415 $ 925,780 $ (63,635) (6%) $ 956,540 3% $ 987,300 3%98
Anticipated RevenuesSource of Income Budget 2005-06 Budget 2006-07 Budget <strong>2007</strong>-<strong>08</strong>Increase/Decrease%ChangeForecasted 20<strong>08</strong>-09%ChangeForecasted 2009-10%ChangeLocal Sources - UnrestrictedFines and ForfeituresWCPSS $ 3,280,061 $ 3,378,872 $ 3,576,632 $ 197,760 6% $ 3,675,497 3% $ 3,774,638 3%Charter <strong>School</strong>s 119,939 121,128 123,368 2,240 2% 124,503 1% 125,362 1%3,400,000 3,500,000 3,700,000 200,000 6% 3,800,000 3% 3,900,000 3%Interest Earned on Investments 2,050,000 1,800,000 2,500,000 700,000 39% 2,700,000 8% 2,800,000 4%E rate 1,500,000 1,500,000 1,500,000 0 0% 1,500,000 0% 1,500,000 0%Red Light Camera Fines 0 0 75,000 75,000 100% 75,000 0% 75,000 0%Donations 81,215 96,292 0 (96,292) (100%) 0 0% 0%Carryforward 34,669 21,395 20,060 (1,335) (6%) 0 0% 0 0%115,884 117,687 20,060 (97,627) (83%) 0 0% 0 0%Special funds from Individual<strong>School</strong>s 72,331 119,401 0 (119,401) (100%) 0 0% 0 0%Worker's CompensationExcess Insurance Premium 0 15,239 0 (15,239) (100%) 0 0% 0 0%Subtotal Local Sources -Unrestricted $ 7,138,215 $ 7,052,327 $ 7,795,060 $ 742,733 11% $ 8,075,000 4% $ 8,275,000 2%Local Sources - RestrictedIndirect Cost - Food Service $ 2,700,000 $ 3,100,000 $ 3,250,000 $ 150,000 5% $ 3,350,000 3% $ 3,400,000 1%Indirect Cost 1,800,000 2,000,000 2,200,000 200,000 10% 2,200,000 0% 2,300,000 5%Smart Start Parents as Teachers 330,403 356,430 401,104 44,674 13% 413,716 3% 424,769 3%Project Enlightenment Self-SupportCurrent Year 155,000 155,000 155,000 0 0% 155,000 0% 155,000 0%Carryforward 32,000 83,436 149,661 66,225 79% 0 100% 0 0%187,000 238,436 304,661 66,225 28% 155,000 (49%) 155,000 0%Smart Start Prevention/Intervention/ 231,780 239,309 244,724 5,415 2% 255,702 4% 271,090 6%ReferralNCAE and Peace College FundedPositions 197,222 139,781 225,323 85,542 61% 197,515 (12%) 207,368 5%99 FY <strong>2007</strong>-<strong>08</strong> <strong>Plan</strong> for Student Success
Anticipated RevenuesSource of Income Budget 2005-06 Budget 2006-07 Budget <strong>2007</strong>-<strong>08</strong>Increase/Decrease%ChangeForecasted 20<strong>08</strong>-09%ChangeForecasted 2009-10%ChangeAthens Library 155,435 177,731 171,530 (6,201) (3%) 178,991 4% 185,994 4%More at Four 69,286 75,460 87,8<strong>08</strong> 12,348 16% 92,000 5% 94,000 2%Carryforward 47,034 44,924 36,128 (8,796) (20%) 35,067 (3%) 36,094 3%116,320 120,384 123,936 3,552 3% 127,067 3% 130,094 2%Smart Start - Outreach for <strong>School</strong> 110,364 117,524 113,058 (4,466) (4%) 117,556 4% 122,184 4%SuccessCellular Lease 105,000 105,000 105,000 0 0% 105,000 0% 105,000 0%New <strong>School</strong> ProjectCurrent Year 0 103,412 103,414 2 0% 103,412 0% 103,412 0%Carryforward 161,944 56,981 0 (56,981) (100%) 0 0% 0 0%161,944 160,393 103,414 (56,979) (36%) 103,412 0% 103,412 0%Smart Start Transition 98,214 119,742 102,364 (17,378) (15%) 105,497 3% 109,320 4%Skills for LifeCurrent Year 99,500 0 99,500 99,500 100% 99,500 0% 0 (100%)Carryforward 0 86,720 0 (86,720) (100%) 0 0% 0 0%99,500 86,720 99,500 12,780 15% 99,500 0% 0 0%Exc. Child. Asst. Ctr. (ECAC)Current Year 60,842 73,600 73,600 0 0% 75,8<strong>08</strong> 3% 78,<strong>08</strong>2 3%Carryforward 12,036 11,295 9,062 (2,233) (20%) 9,832 8% 10,286 5%72,878 84,895 82,662 (2,233) (3%) 85,640 4% 88,368 3%Human Services Community Grant 0 15,000 15,002 2 0% 15,397 3% 15,734 2%CEFPI Where Children LearnCarryforward 7,159 1,812 1,812 0 0% 0 100% 0 0%SAS In-<strong>School</strong> Software 142,893 397,150 0 (397,150) (100%) 0 0% 0 0%Support Our Students 103,999 104,000 0 (104,000) (100%) 0 0% 0 0%Tennessee State University 0 55,000 0 (55,000) (100%) 0 0% 0 0%<strong>Wake</strong> Co. Health Services Health 51,584 38,000 0 (38,000) (100%) 0 0% 0 0%Raleigh Police DepartmentLobby Guard Grant 0 33,131 0 (33,131) (100%) 0 0% 0 0%Project Enlightenment General 70,000 20,000 0 (20,000) (100%) 0 0% 0 0%100
Anticipated RevenuesSource of Income Budget 2005-06 Budget 2006-07 Budget <strong>2007</strong>-<strong>08</strong>Increase/Decrease%ChangeForecasted 20<strong>08</strong>-09%ChangeForecasted 2009-10%ChangeCIS - Garner Magnet High <strong>School</strong>Grant 0 13,523 0 (13,523) (100%) 0 0% 0 0%Professional Leave Paid byOutside Agencies 0 33,197 0 (33,197) (100%) 0 0% 0 0%21st Century Transportation Grant 0 3,168 0 (3,168) (100%) 0 0% 0 0%Contract for TransportationOutside Agencies 0 1,404 0 (1,404) (100%) 0 0% 0 0%Life Skills TrainingCarryforward 33,820 0 0 0 0% 0 0% 0 0%Newcomer DVD Project 1,600 0 0 0 0% 0 0% 0 0%Teach II GrantCarryforward 18 0 0 0 0% 0 0% 0 0%Subtotal - Local SourcesRestricted $ 6,777,133 $ 7,761,730 $ 7,544,090 $ (217,640) (3%) $ 7,509,993 0% $ 7,618,333 1%Special Revenue ServicesFund Balance AppropriatedBeginning Appr. Fund Bal. $ 7,000,000 $ 8,000,000 $ 12,928,333 $ 4,928,333 62% $ 10,000,000 (23%) $ 10,000,000 0%Purchase Orders Carryforward 738,840 598,154 4,181,282 3,583,128 599% 0 0% 0 0%Startup Dollars New <strong>School</strong>s 567,452 792,563 621,053 (171,510) (22%) 0 0% 0 0%Conversion of <strong>School</strong>sTraditional to YR 0 1,523,660 0 (1,523,660) (100%) 0 0% 0 0%Salary Audits 0 537,680 0 (537,680) (100%) 0 0% 0 0%Workers' Compensation Ins. 91,724 242,709 0 (242,709) (100%) 0 0% 0 0%Curriculum Audit 0 215,000 0 (215,000) (100%) 0 0% 0 0%Band & Strings Extra Duty 0 214,019 0 (214,019) (100%) 0 0% 0 0%Computer Insurance Funds 10,000 10,000 0 (10,000) (100%) 0 0% 0 0%Insurance Proceeds 0 3,557 0 (3,557) (100%) 0 0% 0 0%Parking Fee Adjustment 687,401 0 0 0 0% 0 0% 0 0%Fraud Audit 470,000 0 0 0 0% 0 0% 0 0%Subtotal -Special Revenue Services $ 9,565,417 $ 12,137,342 $ 17,730,668 $ 5,593,326 46% $ 10,000,000 (44%) $ 10,000,000 0%Funds TransferOperating Transfers InProgram Management $ 4,612,446 $ 4,887,827 $ 6,393,502 $ 1,505,675 31% $ 5,044,912 (21%) $ 5,147,018 2%Subtotal -Funds Transfer $ 4,612,446 $ 4,887,827 $ 6,393,502 $ 1,505,675 31% $ 5,044,912 (21%) $ 5,147,018 2%TOTAL - LOCAL $ 296,689,846 $ 322,823,424 $ 349,487,236 $ 26,663,812 8% $ 367,516,650 5% $ 392,612,605 7%101 FY <strong>2007</strong>-<strong>08</strong> <strong>Plan</strong> for Student Success
Anticipated RevenuesSource of Income Budget 2005-06 Budget 2006-07 Budget <strong>2007</strong>-<strong>08</strong>Increase/Decrease%ChangeForecasted 20<strong>08</strong>-09%ChangeForecasted 2009-10%ChangeFederal Grant FundFederal Grant Fund - StateIDEA Title VI-B $ 22,130,980 $ 22,970,550 $ 21,877,819 $ (1,092,731) (5%) $ 26,068,550 19% $ 26,502,000 2%Carryforward 3,138,411 1,292,582 0 (1,292,582) (100%) 0 0% 0 0%25,269,391 24,263,132 21,877,819 (2,385,313) (10%) 26,068,550 19% 26,502,000 2%ESEA Title 1 Basic Program 13,518,893 14,862,5<strong>08</strong> 16,422,834 1,560,326 10% 15,500,004 (6%) 16,000,003 3%Carryforward 4,738,439 3,929,239 4,969,069 1,039,830 26% 3,000,000 (40%) 2,500,000 (17%)18,257,332 18,791,747 21,391,903 2,600,156 14% 18,500,004 (14%) 18,500,003 0%Title II - Improving TeacherQuality 3,197,583 3,247,718 6,613,668 3,365,950 104% 3,490,161 (47%) 3,709,986 6%Carryforward 942,643 956,214 1,841,614 885,400 93% 800,000 (57%) 800,000 0%4,140,226 4,203,932 8,455,282 4,251,350 101% 4,290,161 (49%) 4,509,986 5%Vocational Education ProgramImprovement 1,126,840 1,220,615 1,252,646 32,031 3% 1,247,454 0% 1,287,454 3%Title III - LanguageAcquisition 774,033 1,016,579 1,073,511 56,932 6% 1,457,770 36% 1,603,548 10%Carryforward 267,769 207,142 0 (207,142) (100%) 100,000 0% 95,000 (5%)1,041,802 1,223,721 1,073,511 (150,210) (12%) 1,557,770 45% 1,698,548 9%IDEA VI-B Pre-<strong>School</strong>Handicapped 577,980 536,929 452,380 (84,549) (16%) 591,964 31% 663,562 12%Carryforward 159,011 142,983 0 (142,983) (100%) 40,000 0% 0 (100%)736,991 679,912 452,380 (227,532) (33%) 631,964 40% 663,562 5%Safe and Drug-Free <strong>School</strong>s 470,807 386,458 414,596 28,138 7% 386,458 (7%) 386,458 0%Carryforward 72,233 89,030 0 (89,030) (100%) 89,922 0% 113,657 26%543,040 475,488 414,596 (60,892) (13%) 476,380 15% 500,115 5%IDEA VI-B Capacity Buildingand Improvements 344,794 239,164 278,733 39,569 17% 377,871 36% 387,696 3%Carryforward 188,3<strong>08</strong> 17,880 0 (17,880) (100%) 40,000 0% 60,000 50%533,102 257,044 278,733 21,689 8% 417,871 50% 447,696 7%Title V - Innovative Ed. ProgramStrategies 324,599 167,092 176,138 9,046 5% 0 0% 0 0%Carryforward 24,848 4,550 1,803 (2,747) (60%) 0 0% 0 0%349,447 171,642 177,941 6,299 4% 0 0% 0 0%102
Anticipated RevenuesSource of Income Budget 2005-06 Budget 2006-07 Budget <strong>2007</strong>-<strong>08</strong>Increase/Decrease%ChangeForecasted 20<strong>08</strong>-09%ChangeForecasted 2009-10%ChangeEducation TechnologyFormula 256,273 152,784 167,013 14,229 9% 0 0% 0 0%Carryforward 190,714 159,566 0 (159,566) (100%) 0 0% 0 0%446,987 312,350 167,013 (145,337) (47%) 0 0% 0 0%Abstinence Education 86,<strong>08</strong>1 104,123 56,395 (47,728) (46%) 56,395 0% 56,395 0%Carryforward 62,841 98,794 0 (98,794) (100%) 0 0% 0 0%148,922 202,917 56,395 (146,522) (72%) 56,395 0% 56,395 0%McKinney - Vento - HomelessAssistance Act 42,501 40,000 50,000 10,000 25% 40,000 (20%) 40,000 0%Carryforward 3,673 531 0 (531) (100%) 18,929 0% 18,929 0%46,174 40,531 50,000 9,469 23% 58,929 18% 58,929 0%Learn and Serve America 20,000 17,289 20,000 2,711 16% 0 100% 0 0%Title III - Language Acquisiton -Significant Increase 439,674 406,735 0 (406,735) (100%) 341,125 0% 321,125 (6%)Carryforward 82,637 197,647 0 (197,647) (100%) 93,603 0% 81,864 (13%)522,311 604,382 0 (604,382) (100%) 434,728 0% 402,989 (7%)Emergency Impact Aid 127,483 207,077 0 (207,077) (100%) 0 0% 0 0%Carryforward 0 66,260 0 (66,260) (100%) 0 0% 0 0%127,483 273,337 0 (273,337) (100%) 0 0% 0 0%Children with Disabilities Risk Pool 520,700 311,159 0 (311,159) (100%) 0 0% 0 0%ESEA Title I <strong>School</strong> Improvement 139,007 89,077 0 (89,077) (100%) 0 0% 0 0%Carryforward 196,399 162,294 0 (162,294) (100%) 0 0% 0 0%335,406 251,371 0 (251,371) (100%) 0 0% 0 0%Emergency Impact Aid - IDEA 29,105 12,690 0 (12,690) (100%) 0 0% 0 0%Carryforward 0 8,495 0 (8,495) (100%) 0 0% 0 0%29,105 21,185 0 (21,185) (100%) 0 0% 0 0%ESEA Title 1 - MigrantEducation 63,031 0 0 0 0% 0 0% 0 0%Carryforward 56,241 0 0 0 0% 0 0% 0 0%119,272 0 0 0 0% 0 0% 0 0%Title IV - 21st Century Community LearningCenters 107,107 0 0 0 0% 0 0% 0 0%FIE Comprehensive <strong>School</strong> ReformCarryforward 2,598 0 0 0 0% 0 0% 0 0%2,598 0 0 0 0% 0 0% 0 0%Title I - Comprehensive <strong>School</strong> ReformCarryforward 811 0 0 0 0% 0 0% 0 0%Subtotal Federal - State $ 54,425,047 $ 53,321,754 $ 55,668,219 $ 2,346,465 4% $ 53,740,206 (3%) $ 54,627,677 2%103 FY <strong>2007</strong>-<strong>08</strong> <strong>Plan</strong> for Student Success
Anticipated RevenuesSource of Income Budget 2005-06 Budget 2006-07 Budget <strong>2007</strong>-<strong>08</strong>Increase/Decrease%ChangeForecasted 20<strong>08</strong>-09%ChangeForecasted 2009-10%ChangeFederal Grant Fund -DirectProject Quest $ 0 $ 747,961 $ 427,795 $ (320,166) (43%) $ 0 100% $ 0 0%Carryforward 495,414 121,625 77,430 (44,195) (36%) 0 100% 0 0%495,414 869,586 505,225 (364,361) (42%) 0 100% 0 0%Carol M. White PhysicalEducation Program 481,417 483,857 0 (483,857) (100%) 0 0% 0 0%Carryforward 77,270 233,782 287,055 53,273 23% 33,114 (88%) 0 (100%)558,687 717,639 287,055 (430,584) (60%) 33,114 (88%) 0 (100%)Transition to Teaching 404,000 306,322 0 (306,322) (100%) 0 0% 0 0%Carryforward 181,155 180,820 190,471 9,651 5% 0 100% 0 0%585,155 487,142 190,471 (296,671) (61%) 0 100% 0 0%Emergency Response <strong>Plan</strong>s for<strong>School</strong> Safety Initiative 475,552 0 0 0 0% 0 0% 0 0%Carryforward 77,397 386,138 123,674 (262,464) (68%) 0 100% 0 0%552,949 386,138 123,674 (262,464) (68%) 0 100% 0 0%Early Reading First ProgramCarryforward 2,053,550 1,141,394 75,473 (1,065,921) (93%) 0 100% 0 0%Mentoring Program Grant 195,646 191,745 0 (191,745) (100%) 0 0% 0 0%Carryforward 121,289 140,600 68,894 (71,706) (51%) 0 100% 0 0%316,935 332,345 68,894 (263,451) (79%) 0 100% 0 0%Indian Education Act 36,629 37,053 37,054 1 0% 37,054 0% 37,054 0%Carryforward 12,143 0 0 0 0% 0 0% 0 0%48,772 37,053 37,054 1 0% 37,054 0% 37,054 0%Smaller Learning CommunitiesCarryforward 1,718,820 917,064 0 (917,064) (100%) 0 0% 0 0%Elementary Counseling Demon- 0 375,858 0 (375,858) (100%) 0 0% 0 0%stration Program GrantMagnet <strong>School</strong>Carryforward 129,423 0 0 0 0% 0 0% 0 0%Subtotal Federal - Direct $ 6,459,705 $ 5,264,219 $ 1,287,846 $ (3,976,373) (76%) $ 70,168 (95%) $ 37,054 (47%)TOTAL - FEDERAL $ 60,884,752 $ 58,585,973 $ 56,956,065 $ (1,629,9<strong>08</strong>) (3%) $ 53,810,374 (6%) $ 54,664,731 2%104
Anticipated RevenuesSource of Income Budget 2005-06 Budget 2006-07 Budget <strong>2007</strong>-<strong>08</strong>Increase/Decrease%ChangeForecasted 20<strong>08</strong>-09%ChangeForecasted 2009-10%ChangeCapital Outlay FundState<strong>School</strong> Buses $ 1,446,453 $ 305,295 $ 0 $ (305,295) (100%) $ 0 0% $ 0 0%Subtotal State Sources $ 1,446,453 $ 305,295 $ 0 $ (305,295) (100%) $ 0 0% $ 0 0%<strong>County</strong><strong>County</strong> Appropriation $ 3,128,256 $ 1,597,988 $ 3,779,301 $ 2,181,313 137% $ 7,233,359 91% $ 9,904,862 37%Subtotal -<strong>County</strong> Appropriation $ 3,128,256 $ 1,597,988 $ 3,779,301 $ 2,181,313 137% $ 7,233,359 91% $ 9,904,862 37%Capital Improvements -Building Program $ 148,122,076 $ 520,329,122 $ 0 $ (520,329,122) (100%) $ 193,742,733 0% $ 0 (100%)Carryforward 406,421,092 347,462,422 632,903,517 285,441,095 82% 504,469,632 (20%) 304,164,718 (40%)Subtotal Capital Imp. $ 554,543,168 $ 867,791,544 $ 632,903,517 $ (234,888,027) (27%) $ 698,212,365 10% $ 304,164,718 (56%)LocalInterest Earned $ 100,000 $ 150,000 $ 150,000 $ 0 0% $ 125,000 (17%) $ 125,000 0%Municipal CollaborationBrier Creek Elementary 2,909,929 195,522 0 (195,522) (100%) 0 0% 0 0%Heritage High 88,386 157,130 0 (157,130) (100%) 0 0% 0 0%E11 Elementary 0 130,000 0 (130,000) (100%) 0 0% 0 0%Barwell Road Elementary 5,868,720 123,934 0 (123,934) (100%) 0 0% 0 0%E15 Elementary 0 73,953 0 (73,953) (100%) 0 0% 0 0%Disposition of <strong>School</strong> FixedAssets 42,130 (42,130) (100%)Banks Road Elementary 0 19,500 0 (19,500) (100%) 0 0% 0 0%River Bend Elementary 0 18,000 0 (18,000) (100%) 0 0% 0 0%Holly Springs High 222,720 0 0 0 0% 0 0% 0 0%Holly Springs Elementary 10,000 0 0 0 0% 0 0% 0 0%Subtotal Local $ 9,199,755 $ 910,169 $ 150,000 $ (760,169) (84%) $ 125,000 (17%) $ 125,000 0%Operating Transfers In $ 6,837,615 $ 375,699 $ 0 $ (375,699) (100%) $ 0 0% $ 0 0%105 FY <strong>2007</strong>-<strong>08</strong> <strong>Plan</strong> for Student Success
Anticipated RevenuesSource of Income Budget 2005-06 Budget 2006-07 Budget <strong>2007</strong>-<strong>08</strong>Increase/Decrease%ChangeForecasted 20<strong>08</strong>-09%ChangeForecasted 2009-10%ChangeFund Balance AppropriatedBeginning Appr. Fund Bal. $ 2,000,000 $ 587,412 $ 0 $ (587,412) (100%) $ 0 0% $ 0 0%Carryforward Purchase Orders 2,009,950 5,468,597 1,285,810 (4,182,787) (76%) 0 0% 0 0%Municipal Collaboration 2,376,224 3,191,496 0 (3,191,496) (100%) 0 0% 0 0%Conversion of <strong>School</strong>s, Traditional to YR 670,000 0 (670,000) (100%)Underground Storage Tanks 0 230,000 0 (230,000) (100%) 0 0% 0 0%Startup Dollars for New <strong>School</strong>s 0 18,436 0 (18,436) (100%) 0 0% 0 0%Insurance Proceeds 0 3,923 0 (3,923) (100%) 0 0% 0 0%Subtotal Fund Balance $ 6,386,174 $ 10,169,864 $ 1,285,810 $ (8,884,054) (87%) $ 0 0% $ 0 0%TOTAL - CAPITAL OUTLAY $ 581,541,421 $ 881,150,559 $ 638,118,628 $ (243,031,931) (28%) $ 705,570,724 11% $ 314,194,580 (55%)Multiple Enterprise FundChild NutritionBreakfast Reimbursement $ 58,013 $ 42,606 $ 46,342 $ 3,736 9% $ 48,201 4% $ 50,207 4%State Sources $ 58,013 $ 42,606 $ 46,342 $ 3,736 9% $ 48,201 4% $ 50,207 4%USDA Grants - Regular $ 13,416,919 $ 15,886,696 $ 17,279,952 $ 1,393,256 9% $ 17,973,111 4% $ 18,721,064 4%USDA Grants - Summer Feeding 53,000 76,491 83,167 6,676 9% 86,503 4% 90,103 4%Federal Sources $ 13,469,919 $ 15,963,187 $ 17,363,119 $ 1,399,932 9% $ 18,059,614 4% $ 18,811,167 4%Supplemental Sales $ 12,1<strong>08</strong>,132 $ 12,557,529 $ 13,658,792 $ 1,101,263 9% $ 14,206,693 4% $ 14,797,907 4%Lunch Full Pay 8,593,931 9,468,930 10,299,332 830,402 9% 10,712,474 4% 11,158,275 4%Breakfast Full Pay 387,209 539,964 587,317 47,353 9% 610,877 4% 636,299 4%Interest Earned 263,616 510,532 555,305 44,773 9% 577,580 4% 601,616 4%Lunch Reduced 276,726 331,346 360,405 29,059 9% 374,862 4% 390,462 4%Catered Supplements 144,471 183,260 199,331 16,071 9% 207,327 4% 215,955 4%Suppers and Banquets 114,004 134,464 146,256 11,792 9% 152,123 4% 158,454 4%Catered Lunches 148,103 133,439 145,141 11,702 9% 150,963 4% 157,245 4%Breakfast Reduced 56,521 73,120 79,532 6,412 9% 82,722 4% 86,165 4%Catered Breakfast 3,289 3,119 3,393 274 9% 3,529 4% 3,675 4%Sales Revenues $ 22,096,002 $ 23,935,703 $ 26,034,804 $ 2,099,101 9% $ 27,079,150 4% $ 28,206,053 4%Subtotal Child Nutrition $ 35,623,934 $ 39,941,496 $ 43,444,265 $ 3,502,769 9% $ 45,186,965 4% $ 47,067,427 4%106
Anticipated RevenuesSource of Income Budget 2005-06 Budget 2006-07 Budget <strong>2007</strong>-<strong>08</strong>Increase/Decrease%ChangeForecasted 20<strong>08</strong>-09%ChangeForecasted 2009-10%ChangeBefore and After <strong>School</strong>Care $ 4,321,553 $ 4,586,343 $ 4,679,880 $ 93,537 2% $ 4,679,880 0% $ 4,679,880 0%Carryforward 2,312,7<strong>08</strong> 1,8<strong>08</strong>,765 1,8<strong>08</strong>,765 0 0% 1,8<strong>08</strong>,765 0% 1,8<strong>08</strong>,765 0%6,634,261 6,395,1<strong>08</strong> 6,488,645 93,537 1% 6,488,645 0% 6,488,645 0%Community <strong>School</strong>s 2,163,315 2,198,310 2,520,000 321,690 15% 2,363,987 (6%) 2,429,171 3%Carryforward 2,587,936 2,457,858 2,766,007 3<strong>08</strong>,149 13% 652,000 (76%) 612,000 (6%)4,751,251 4,656,168 5,286,007 629,839 14% 3,015,987 (43%) 3,041,171 1%Community <strong>School</strong>s -<strong>County</strong> Commissioners 410,000 410,000 820,000 410,000 100% 410,000 (50%) 410,000 0%Carryforward 184,661 25,060 30,193 5,133 20% 7,000 (77%) 5,500 (21%)594,661 435,060 850,193 415,133 95% 417,000 (51%) 415,500 0%Preschool Programs 267,550 298,430 298,430 0 0% 298,430 0% 298,430 0%Carryforward 74,218 3,<strong>08</strong>8 3,<strong>08</strong>8 0 0% 3,<strong>08</strong>8 0% 3,<strong>08</strong>8 0%341,768 301,518 301,518 0 0% 301,518 0% 301,518 0%Summer Camp 205,854 176,161 105,062 (71,099) (40%) 105,062 0% 105,062 0%Carryforward 198,580 131,028 131,027 (1) 0% 131,027 0% 131,027 0%404,434 307,189 236,<strong>08</strong>9 (71,100) (23%) 236,<strong>08</strong>9 0% 236,<strong>08</strong>9 0%NovaNet 321,234 73,137 0 (73,137) (100%) 144,159 0% 144,159 0%Carryforward 243,072 209,258 0 (209,258) (100%) 78,461 0% 78,461 0%564,306 282,395 0 (282,395) (100%) 222,620 0% 222,620 0%Extended High <strong>School</strong>Carryforward 12,954 0 0 0 0% 0 0% 0 0%Dual Enrollment 0 1,050 0 (1,050) (100%) 0 0 0%Subtotal Tuition Programs $ 13,303,635 $ 12,378,488 $ 13,162,452 $ 783,964 6% $ 10,681,859 (19%) $ 10,705,543 0%TOTAL REVENUE -MULTIPLE ENTERPRISE $ 48,927,569 $ 52,319,984 $ 56,606,717 $ 4,286,733 8% $ 55,868,824 (1%) $ 57,772,970 3%107 FY <strong>2007</strong>-<strong>08</strong> <strong>Plan</strong> for Student Success
Anticipated RevenuesSource of Income Budget 2005-06 Budget 2006-07 Budget <strong>2007</strong>-<strong>08</strong>Increase/Decrease%ChangeForecasted 20<strong>08</strong>-09%ChangeForecasted 2009-10%ChangeAll FundsGRAND TOTAL - ALL FUNDS $ 1,545,500,068 $ 1,943,907,655 $ 1,789,747,694 $ (154,159,961) (8%) $ 1,931,134,566 8% $ 1,628,429,971 (16%)Operating Budget $ 990,956,900 $ 1,076,116,111 $ 1,156,844,177 $ 80,728,066 8% $ 1,232,922,201 7% $ 1,324,265,253 7%Building Program 554,543,168 867,791,544 632,903,517 (234,888,027) (27%) 698,212,365 10% 304,164,718 (56%)$ 1,545,500,068 $ 1,943,907,655 $ 1,789,747,694 $ (154,159,961) (8%) $ 1,931,134,566 8% $ 1,628,429,971 (16%)State Sources $ 574,011,181 $ 643,800,882 $ 699,263,727 $ 55,462,845 9% $ 757,923,027 8% $ 819,275,253 8%Federal Sources 75,678,023 75,889,665 75,814,184 (75,481) 0% 73,364,988 (3%) 74,970,898 2%Local Sources 341,267,696 356,425,564 381,766,266 25,340,702 7% 401,634,186 5% 430,019,102 7%Operating Budget 990,956,900 1,076,116,111 1,156,844,177 80,728,066 8% 1,232,922,201 7% 1,324,265,253 7%Building Program 554,543,168 867,791,544 632,903,517 (234,888,027) (27%) 698,212,365 10% 304,164,718 (56%)Total $ 1,545,500,068 $ 1,943,907,655 $ 1,789,747,694 $ (154,159,961) (8%) $ 1,931,134,566 8% $ 1,628,429,971 (16%)1<strong>08</strong>
Budget by Object Code - Operating BudgetChanges enacted to the Chart of AccountsThe North Carolina Association of <strong>School</strong> Business Offi cers (NCASBO) and the North Carolina Department of <strong>Public</strong> Instruction (NCDPI) approveda chart of accounts conversion that was effective July 1, <strong>2007</strong>. There is not a one-to-one correlation with these chart changes. In many cases, thereis an explosion of the chart from one old account to many new accounts. Due to this, we have lost comparability of historical data. A comparisonbetween accounts from 2006-07 and <strong>2007</strong>-<strong>08</strong> can only be made between the seven major object categories as shown in the chart below.Object means the service or commodity obtained as a result of a specifi c expenditure. Budget by Object Code fi gures on pages 109 to 115 areshown using new chart of accounts for <strong>2007</strong>-<strong>08</strong>. Seven major object categories are used in our Chart of Accounts: (1) Salaries, (2) Employee Benefits, (3) Purchased Services, (4) Supplies and Materials, (5) Capital Outlay, (6) Other Objects, and (7) Transfers. Budget by Object Code historicaldata using the old chart of accounts, can be found on pages 366 to 370 in the Information section of this book.2006-07 <strong>2007</strong>-<strong>08</strong>Increase/DecreasePercentChangeSalaries $ 691,468,735 $ 762,021,821 $ 70,553,<strong>08</strong>6 10%Employer Provided Benefi ts 163,265,964 184,254,461 20,988,497 13%Purchased Services 116,437,351 124,804,372 8,367,021 7%Supplies and Materials 79,751,707 69,510,870 (10,240,837) (13%)Capital Outlay 15,096,809 6,227,646 (8,869,163) (59%)Transfers 10,095,545 10,025,007 (70,538) 0%GRAND TOTAL $ 1,076,116,111 $ 1,156,844,177 $ 80,728,066 (8%)109 FY <strong>2007</strong>-<strong>08</strong> <strong>Plan</strong> for Student Success
Budget by Object Code - Operating BudgetFY <strong>2007</strong>-<strong>08</strong>Object Code State Local Federal TotalSALARIESSuperintendent $132,623 $0 $0 $132,623Chief Officers $192,840 $380,650 $0 $573,490Director and/or Supervisor $2,995,914 $16,473,803 $396,647 $19,866,364Principal/Headmaster $11,470,432 $18,130 $0 $11,488,562Finance Officer $96,420 $0 $0 $96,420Assistant Principal (Non-Teaching) $8,929,605 $6,681,591 $0 $15,611,196Other Assistant Principal Assignment $556,157 $117,396 $0 $673,553Assistant Superintendent $578,520 $482,100 $0 $1,060,620Administrative Personnel $24,952,511 $24,153,670 $396,647 $49,502,8284% 6% 1% 4%Teacher $337,559,391 $24,731,812 $15,247,684 $377,538,887Interim Teacher - (Non-Certified) $219,184 $17,045 $0 $236,229JROTC Teacher $0 $247,769 $0 $247,769Foreign Exchange (VIF) $1,536,667 $0 $0 $1,536,667New Teacher Orientation $199,133 $0 $0 $199,133Extended Contracts $0 $207,405 $0 $207,405Re-employed Retired Teacher $4,330,145 $360,327 $92,452 $4,782,924Instructional Personnel-Certified $343,844,520 $25,564,358 $15,340,136 $384,749,01450% 6% 27% 33%Instructional Support I(Regular Teacher Pay Scale) $34,978,109 $5,777,183 $8,645,947 $49,401,239Instructional Support II-Advanced Pay Scale $839,139 $1,993,517 $0 $2,832,656Psychologist $4,788,523 $135,337 $0 $4,923,860Teacher Mentor $0 $3,500 $0 $3,500Lead Teacher $0 $9,885 $650,514 $660,399Instructional Support Personnel-Certified $40,605,771 $7,919,422 $9,296,461 $57,821,6546% 2% 16% 5%Teacher Assistant-Other $0 $110,745 $0 $110,745Teacher Assistant-NCLB $42,573,974 $3,864,957 $3,448,161 $49,887,092Tutor (Within the Instructional Day) $133,956 $38,054 $0 $172,010Braillist, Translator, Education Interpreter$825,879 $288,419 $30,292 $1,144,590Therapist $1,744,214 $939,096 $0 $2,683,310Specialist (<strong>School</strong>-Based) $707,040 $753,658 $55,095 $1,515,793Monitor $11,062 $1,440,329 $0 $1,451,391Non-Certified Instructor $8,076 $115,278 $8,250 $131,604Instructional Support Personnel-Non-Certified $46,004,201 $7,550,536 $3,541,798 $57,096,5357% 2% 6% 5%110
Budget by Object Code - Operating BudgetFY <strong>2007</strong>-<strong>08</strong>Object Code State Local Federal TotalOffice Support $15,517,160 $15,186,485 $259,740 $30,963,385Technician $29,414 $1,973,401 $42,428 $2,045,243Administrative Specialist (Central Support) $0 $2,952,295 $0 $2,952,295Technical & Administrative Support Personnel $15,546,574 $20,112,181 $302,168 $35,960,9232% 5% 1% 3%Substitute Teacher-Regular Teacher Absence $529,1<strong>08</strong> $5,170,977 $298,207 $5,998,292Substitute Teacher-Staff Development Absence $346,665 $460,620 $913,387 $1,720,672Substitute-Non-Teaching $609,566 $1,012,747 $1,000 $1,623,313Teacher Assistant Salary when Substituting(Staff Development Absence) $45,1<strong>08</strong> $39,558 $140,000 $224,666Teacher Assistant Salary when Substituting(Regular Teacher Absence) $745,130 $27,017 $91,674 $863,821Substitute Personnel $2,275,577 $6,710,919 $1,444,268 $10,430,7640% 2% 3% 1%Driver $15,666,243 $2,441,005 $1<strong>08</strong>,886 $18,216,134Driver Overtime $321,360 $147,180 $25,000 $493,540Custodian $11,967,402 $866,650 $0 $12,834,052Cafeteria Worker $0 $7,771,775 $0 $7,771,775Skilled Trades $2,790,740 $9,902,701 $0 $12,693,441Manager $0 $6,130,338 $0 $6,130,338Work Study Student $0 $25,<strong>08</strong>7 $0 $25,<strong>08</strong>7Day Care/Before/After <strong>School</strong> Care Staff $0 $1,044,414 $0 $1,044,414Operational Support Personnel $30,745,745 $28,329,150 $133,886 $59,2<strong>08</strong>,7814% 7% 0% 5%Supplement/Supplementary Pay $0 $70,039,653 $4,268,011 $74,307,664Bonus Pay $7,669,918 $521,293 $401,300 $8,592,511Longevity Pay $6,060,926 $2,056,538 $579,923 $8,697,387Bonus Leave Payoff $326,323 $224,764 $0 $551,<strong>08</strong>7Short Term Disability Payment-Beyond Six Months $217,166 $0 $0 $217,166Salary Differential $0 $1,271,518 $0 $1,271,518Annual Leave Payoff $1,791,326 $746,039 $0 $2,537,365Short Term Disability Payment-First Six Months $207,143 $91,013 $0 $298,156Supplementary & Benefits-Related Pay $16,272,802 $74,950,818 $5,249,234 $96,472,8542% 18% 9% 8%Curriculum Development Pay $0 $206,227 $61,100 $267,327Additional Responsibility Stipend $11,000 $6,139,740 $65,724 $6,216,464Mentor Pay Stipend $934,564 $29,350 $13,000 $976,914111 FY <strong>2007</strong>-<strong>08</strong> <strong>Plan</strong> for Student Success
Budget by Object Code - Operating BudgetFY <strong>2007</strong>-<strong>08</strong>Object Code State Local Federal TotalState-Designated Stipend $0 $124,155 $0 $124,155Staff Development Participant Pay $279,435 $122,986 $3,760 $406,181Staff Development Instructor $39,929 $246,493 $396,444 $682,866Tutorial Pay $59,426 $38,350 $65,014 $162,790Overtime Pay $117,906 $1,823,865 $0 $1,941,771Extra Duty Pay $1,442,260 $8,731,166 $605,042 $10,778,4680% 2% 1% 1%SALARIES TOTAL $521,689,961 $204,022,220 $36,309,640 $762,021,82176% 50% 64% 66%EMPLOYER PROVIDED BENEFITSEmployer's Social Security Cost $39,976,877 $15,592,635 $2,774,091 $58,343,603Employer's Retirement Cost $37,073,306 $14,137,332 $2,494,065 $53,704,703Federal Insurance Compensation Act $77,050,183 $29,729,967 $5,268,156 $112,048,3067% 3% 0% 10%Employer's Retirement Cost-Re-employed RetiredTeachers not Subject to the Cap $0 $0 $6,601 $6,601Retirement Benefits $0 $0 $6,601 $6,6010% 0% 0% 0%Employer's Hospitalization Insurance Cost $50,438,187 $13,174,892 $3,039,753 $66,652,832Insurance Cost $0 $1,560,255 $1<strong>08</strong>,831 $1,669,<strong>08</strong>6Employer's Unemployment Insurance Cost $0 $176,<strong>08</strong>9 $0 $176,<strong>08</strong>9Employer's Dental Insurance Cost $0 $3,514,285 $187,262 $3,701,547Insurance Benefits $50,438,187 $18,425,521 $3,335,846 $72,199,5544% 2% 0% 6%EMPLOYER PROVIDED BENEFITS TOTAL $127,488,370 $48,155,488 $8,610,603 $184,254,46119% 12% 15% 16%SALARIES AND EMPLOYER PROVIDED BENEFITSSALARIES AND EMPLOYER PROVIDED BENEFITSTOTAL $649,178,331 $252,177,7<strong>08</strong> $44,920,243 $946,276,28294% 61% 79% 82%PURCHASED SERVICESContracted Services $9,576,229 $28,025,577 $1,536,153 $39,137,959Workshop Expenses/Allowable Travel $1,343,877 $2,060,391 $3,946,333 $7,350,601Advertising Cost $0 $123,524 $500 $124,024Printing and Binding Fees $157,554 $929,474 $21,650 $1,1<strong>08</strong>,678112
Budget by Object Code - Operating BudgetFY <strong>2007</strong>-<strong>08</strong>Object Code State Local Federal TotalSpeech and Language Contract Services $0 $21,120 $1,000 $22,120Other Professional and Technical Services $45,000 $665 $0 $45,665Professional and Technical Services $11,122,660 $31,160,751 $5,505,636 $47,789,0471% 3% 0% 4%<strong>Public</strong> Utilities-Electric Services $0 $20,067,096 $0 $20,067,096<strong>Public</strong> Utilities-Natural Gas $0 $5,737,921 $0 $5,737,921<strong>Public</strong> Utilities-Water and Sewer $0 $2,595,065 $0 $2,595,065Waste Management $0 $1,064,122 $0 $1,064,122Contracted Repairs and Maintenance-Land/Buildings $579,402 $21,862,917 $0 $22,442,319Contracted Repairs and Maintenance-Equipment $0 $164,485 $0 $164,485Property Services $579,402 $51,491,606 $0 $52,071,0<strong>08</strong>0% 4% 0% 5%Pupil Transportation-Contracted $8,177,065 $1,472,686 $90,000 $9,739,751Travel Reimbursement $88,106 $1,014,872 $175,147 $1,278,125Field Trips $27,336 $26,721 $28,800 $82,857Transportation Services $8,292,507 $2,514,279 $293,947 $11,100,7331% 0% 0% 1%Telephone $0 $92,493 $0 $92,493Postage $800 $254,045 $950 $255,795Mobile Communication Costs $37,530 $2,186,354 $0 $2,223,884Communications $38,330 $2,532,892 $950 $2,572,1720% 0% 0% 0%Tuition Fees $860 $89,500 $0 $90,360Employee Education Reimbursement $0 $181,771 $64,363 $246,134Dues and Fees $860 $271,271 $64,363 $336,4940% 0% 0% 0%Membership Dues and Fees $0 $161,822 $0 $161,822Bank Service Fees $0 $53,388 $0 $53,388Liability Insurance $0 $886,596 $0 $886,596Vehicle Liability Insurance $79,649 $116,898 $0 $196,547Property Insurance $0 $995,283 $0 $995,283Fidelity Bond Premium $0 $2,855 $0 $2,855Scholastic Accident Insurance $0 $105,148 $0 $105,148Other Insurance and Judgements $12,604 $6,420 $0 $19,024Insurance and Judgements $92,253 $2,328,410 $0 $2,420,6630% 0% 0% 0%113 FY <strong>2007</strong>-<strong>08</strong> <strong>Plan</strong> for Student Success
Budget by Object Code - Operating BudgetFY <strong>2007</strong>-<strong>08</strong>Object Code State Local Federal TotalTax Payments $0 $40,400 $0 $40,400Indirect Cost $0 $4,766,996 $2,385,645 $7,152,641Contingency Funds $0 $0 $0 $0Unbudgeted Funds $0 $123,183 $1,198,031 $1,321,214Other Administrative Costs $0 $4,930,579 $3,583,676 $8,514,2550% 0% 0% 1%PURCHASED SERVICES TOTAL $20,126,012 $95,229,788 $9,448,572 $124,804,3723% 23% 17% 11%SUPPLIES AND MATERIALSSupplies and Materials $12,293,956 $15,822,711 $1,776,702 $29,893,369State Textbooks $0 $10,654,632 $0 $10,654,632Other Textbooks $55,645 $2,013 $0 $57,658<strong>School</strong> and Office Supplies $12,349,601 $26,479,356 $1,776,702 $40,605,6591% 2% 0% 4%Fuel for Facilities $0 $197,324 $0 $197,324Repair Parts, Materials, and Related Labor,Grease, and Anti-Freeze $2,001,872 $2,746,741 $0 $4,748,613Gas/Diesel Fuel $3,802,412 $890,639 $0 $4,693,051Oil $122,110 $11,323 $0 $133,433Tires and Tubes $725,145 $64,981 $0 $790,126Operational Supplies $6,651,539 $3,911,0<strong>08</strong> $0 $10,562,5471% 0% 0% 1%Food Purchases $0 $15,239,398 $900 $15,240,298Food Processing Supplies $0 $2,289,066 $0 $2,289,066Other Food Purchases $7,900 $1,000 $0 $8,900Food Supplies $7,900 $17,529,464 $900 $17,538,2640% 2% 0% 2%Furniture and Equipment-Inventoried-Federal Programs Only $0 $0 $302,000 $302,000Computer Equipment-Inventoried-Federal Programs Only $0 $0 $502,400 $502,400Non-Capitalized Equipment $0 $0 $804,400 $804,4000% 0% 0% 0%SUPPLIES AND MATERIALS TOTAL $19,009,040 $47,919,828 $2,582,002 $69,510,8703% 12% 5% 6%114
Budget by Object Code - Operating BudgetFY <strong>2007</strong>-<strong>08</strong>Object Code State Local Federal TotalCAPITAL OUTLAYGeneral Contracts $0 $1,560,426 $0 $1,560,426Electrical Contract $0 $5,000 $0 $5,000Architects Fees $0 $111,179 $0 $111,179Miscellaneous Contracts and Other Charges $0 $2,344,849 $0 $2,344,849Building Contracts $0 $4,021,454 $0 $4,021,4540% 0% 0% 0%Purchase of Equipment-Capitalized $0 $851,422 $5,248 $856,670Purchase of Computer Hardware-Capitalized $0 $0 $0 $0Equipment $0 $851,422 $5,248 $856,6700% 0% 0% 0%Purchase of Vehicles $191,705 $1,056,767 $0 $1,248,472License and Title Fees $73,960 $27,090 $0 $101,050Vehicles $265,665 $1,<strong>08</strong>3,857 $0 $1,349,5220% 0% 0% 0%CAPITAL OUTLAY TOTAL $265,665 $5,956,733 $5,248 $6,227,6460% 1% 0% 1%TRANSFERSTransfers to Charter <strong>School</strong>s $0 $10,025,007 $0 $10,025,007TRANSFERS TOTAL $0 $10,025,007 $0 $10,025,0070% 2% 0% 1%GRAND TOTAL $688,579,048 $411,309,064 $56,956,065 $1,156,844,177100% 100% 100% 100%115 FY <strong>2007</strong>-<strong>08</strong> <strong>Plan</strong> for Student Success
Staff AllotmentsMonths of EmploymentAllotments are allocations of state, federal, and local resources to schools.The staff budget schedules on the next several pages are in terms of“months” rather than full-time equivalent positions due to the way weallot and track the human resources of the school system. Months ofemployment are allotted for staffi ng each year. Principals can use thesemonths for full-time or part-time employees on 9, 10, 11, or 12-monthcontracts. They may also use individual months or groups of monthsto hire temporary workers during critical times. In <strong>Wake</strong> <strong>County</strong> <strong>Public</strong><strong>School</strong> <strong>System</strong> (WCPSS), controlling the hiring process within a budgetof months is called “position control.”Allotment ProcessThe allotment process for <strong>2007</strong>-<strong>08</strong> begins in March <strong>2007</strong>. Much workmust occur during the spring so that staff will be in place when schoolsopen in July and August. Over 80 percent of the school system’s operatingbudget is spent on salaries and benefi ts. Quick and accurate communicationis important during this process.WCPSS has an interactive website on the intranet that allows principalsto view allotments by category for each school. It also provides an areafor calculating “what-if” scenarios. Data in the allotment website is thebasis for positions entered as months of employment into the Oraclehuman resource and fi nancial system. Once positions are entered inOracle, the posting, recruiting, hiring, and paying processes can occur.<strong>System</strong>s that once stood alone for budget, human resources, and compensationare integrated into a seamless operation with no redundancyof work effort.The allotment process begins once the Board of Education adopts thestudent assignment plan. The growth management department establishesstudent membership projections by school and grade. These areentered into the allotment website. Principals have a three-day period toreview the student membership fi gures on their site and discuss any concernswith Growth Management. Revisions to projections are enteredinto the website at the end of that week. The projection fi gures will notchange after that date.Once the student projections are entered into the allotment website, themonths of employment for regular Average Daily Membership (ADM)teachers and teacher assistants are displayed according to formulas builtinto the website. The budget department aligns the positions in Oracle tothese months by site. Position numbers are added for schools that areprojected to increase in numbers. End dates are assigned to positionnumbers for schools that are projected to decrease in numbers. Budgetstaff consults with human resource administrators and principals whendetermining position numbers that must be end dated. Regular ADMteacher, teacher assistant, and clerical months will be adjusted laterbased on the actual tenth day student membership. Therefore, principalsuse the data on the website for these categories as a planning tool.Principals are cautious when hiring for the regular ADM teacher andteacher assistant positions due to the “reconciliation” of months that willoccur on the tenth day of school. If the principal hires more staff than theschool earns on the tenth day, then one of three steps occurs:(1) <strong>School</strong> reorganizes; employees are moved to anotherschool that has vacancies.(2) Charge months to the individual school account in fund6.(3) <strong>School</strong> requests a conversion.No reserve of months is held at the central level to cover “overages”that might occur. This is intentional. We want the maximum amount ofresources provided to the schools at the beginning of the school year.Holding reserves that might be released at a later time would disrupt theorganization of classes at each site.If a principal determines that the student membership at a school willlikely be signifi cantly higher than the planning fi gures loaded by growthmanagement, then additional months of employment can be added forteachers and teacher assistants. These are labeled as “self-allotted”months of employment on the website and Oracle and fall under thesame reconciliation process on the tenth day of school as the other positions.There are other administrative, instructional, and support categories ofallotments on the website other than regular ADM teachers and teacher116
Staff Allotmentsassistants. These include: Principal, assistant principal, clerical, custodians,child nutrition, media specialist, curriculum and instruction, academicallygifted, magnet, Title I, English as a Second Language, grants,Title V, local literacy, at-risk, special education, accelerated learning program,challenged schools, counselor, speech, psychologist, social work,and Student Assistant Program (SAP) coordinators. Budget managersin central offi ce departments are “allotters” of these categories. Allottersuse the adjusted planning allotments loaded by growth managementto provide months of employment for each category by school. Thesemonths are loaded into the allotment website and balanced to positionnumbers in Oracle. These allotments will not change based on tenth daystudent membership. Months on the website in these categories are anauthorization to hire staff.FlexibilityEfficient and Effective Use of ResourcesAs mentioned previously, there is a reconciliation process for each schoolbased on tenth day student membership. Administrative Services Divisionstaff strives to provide the maximum resources to schools as earlyas possible. We evaluate the allotment process annually to improveand streamline the fl ow of data. The allotment website and Oracle haveenhanced our ability to capture, analyze, report, and project data in adetailed and summarized level. Our staff serves in a supporting role toassist school staff in spending the resources in accordance with state,local, and federal laws and procedures. <strong>School</strong> staff must be accountablethat the resources are used in an effi cient and effective manner tosupport the strategic plan of the school system and provide a qualityinstructional program for our students.Flexibility among categories of positions is important to meet the uniqueneeds at each site. The state allows limited fl exibility among categoriesin compliance with Section 115C-105.25 of <strong>Public</strong> <strong>School</strong> Law ofNorth Carolina. WCPSS allows additional fl exibility within locally fundedmonths of employment. There is a service/allotment description pagefor each allotment category on the website. These pages identify if themonths may be converted to another category or not.Conversions• Conversions that are typically done each year by schools:• Conversion of teacher assistant to teacher months (2 to 1 ratio)• Conversion of teacher assistant months to technology assistants (1 to0.83 ratio)• Conversion of teachers to teacher assistants in the English as aSecond Language Program.• Conversions between assistant principal and teacher months.(1 assistant principal month equates to 1.20 teacher months)• Conversions between types of clerical assistants (ratios vary for clericalassistants, media assistants, secretaries, receptionists, registrars,NC Wise data managers, bookkeepers, and lead secretaries)• Conversion of Accelerated Learning and Challenged <strong>School</strong>s monthsof employment to tutor and supply dollars.117 FY <strong>2007</strong>-<strong>08</strong> <strong>Plan</strong> for Student Success
Staff BudgetThe “Staff” and “Analysis of Increase (Decrease) in Months of Employment” shows months of employment that are budgeted. Position control allotmentsare managed in terms of months rather than positions. <strong>Wake</strong> <strong>County</strong> <strong>Public</strong> <strong>School</strong> <strong>System</strong> has employees on 9, 10, 11, and 12 monthcontract basis. <strong>School</strong>s may process conversions from one type of position to another within ABC Transfer Policies. These conversions are for aone-year period only. The effects of the conversions have been removed from the data in this chart. To get a rough estimate of full-time equivalent(FTE) positions divide total month of employment by 10. This will be an estimate because our employees have different contract lengths of 9, 10,11 or 12 months.Increase/2006-<strong>2007</strong>Total State Local<strong>2007</strong>-20<strong>08</strong>Federal Enterprise Total(Decrease)2006-<strong>2007</strong> to<strong>2007</strong>-20<strong>08</strong>AdministrationSuperintendent 12.00 12.00 12.00Chief Officer 72.00 24.00 48.00 72.00Director/Supervisor 3,276.60 453.96 2,534.64 1 60.00 240.00 3,288.60 12.00Principals 1,782.50 1,848.00 3.00 1,851.00 68.50Finance Officer 12.00 12.00 12.00Assistant Principals 2,744.80 1,666.00 1,283.80 2,949.80 205.00Assistant Superintendent 132.00 72.00 60.00 132.00Other Administrative Assign. 201.00 173.00 28.00 201.0<strong>08</strong>,232.90 4,260.96 3,957.44 60.00 240.00 8,518.40 285.50Professional EducatorTeachers 87,277.71 81,361.81 7,589.5824,435.00 25.00 93,411.39 6,133.68Media Specialists 2,115.00 2,167.00 25.00 2,192.00 77.00Counselors 3,114.96 3,275.96 41.00 40.00 3,356.96 242.00Teacher - ROTC 42.50 42.50342.50Teacher - Speech/Pathology 1,326.40 354.20 352.20 764.00 1,470.40 144.00Extended Contract Days 2.50 2.50 2.50Interim Teacher - Noncert. 96.00 96.00 96.00Retired Teacher - Not Earning Cap 811.00 732.00 60.50 18.50 811.00Other Professional Ed. Assign. 544.50 463.00 32.004495.00 (49.50)95,330.57 88,449.97 8,145.28 5,257.50 25.00 101,877.75 6,547.18Professional - OtherOther Professional Assign. 2,285.87 590.35 1,164.735523.79 12.00 2,290.87 5.00Psychologists 890.90 928.90 35.50 5.50 969.90 79.00Social Workers 634.00 674.91 22.75 697.66 63.663,810.77 2,194.16 1,200.23 552.04 12.00 3,958.43 147.66112.0 months funded by Skills for Life and 495.00 months funded by <strong>Wake</strong> Capital Improvement Fund.214.0 months funded by Athens Library.342.5 months funded by ROTC.52.5 months funded by Emergent Literacy Grant, 8.0 months funded by ECAC Contract, 12.0 months funded by NCAE,2.0 months funded by More at Four, 3.<strong>08</strong> months funded by Human Services Community Grant, 136.20 months fundedby Smart Start programs, and 5.8 months funded by Project Enlightenment fees.410.0 months funded by Peace College.118
Staff BudgetIncrease/(Decrease)2006-<strong>2007</strong><strong>2007</strong>-20<strong>08</strong>2006-<strong>2007</strong> toTotal State Local Federal Enterprise Total<strong>2007</strong>-20<strong>08</strong>TechnicalAV (Audiovisual) Mat. Coord. 72.00 72.00672.00Teacher Assistants 24,662.30 23,254.80 1,182.5071,949.00 28.00 26,414.30 1,752.00Therapists 522.75 379.75 191.00 570.75 48.00Technology Assistants 167.04 155.00 155.00 (12.04)Other Prof. Assign. Noncert. 1,032.00 24.00 852.0<strong>08</strong>12.00 168.00 1,056.00 24.00Other Technical Assignment 1,216.20 684.00 496.20 36.00 1,216.2027,672.29 24,342.55 2,948.70 1,961.00 232.00 29,484.25 1,811.96Office/ClericalOffice Personnel 11,916.26 6,340.60 5,882.16985.50 174.00 12,482.26 566.00Other Office/Clerical Assign. 82.00 12.00 58.00 10 12.00 82.0011,998.26 6,352.60 5,940.16 97.50 174.00 12,564.26 566.00Crafts/TradesTransportation Personnel 1,428.00 1,020.00 516.00 1,536.00 1<strong>08</strong>.00Other Crafts and Trade Assign. 2,882.00 1,860.00 11 1,090.00 2,950.00 68.004,310.00 1,020.00 2,376.00 1,090.00 4,486.00 176.00OthersDrivers 8,567.26 8,402.26 815.00 96.00 9,313.26 746.00Subsitute Drivers 465.80 225.80 540.00 765.80 300.00Custodians 6,132.00 6,126.00 6.00 6,132.00Child Nutrition Employees 4,645.20 4,799.20 4,799.20 154.00Warehouse Person 126.00 126.00 126.00Managers 2,133.00 804.00 1,497.00 2,301.00 168.00Cashiers 33.80 33.80 33.80Other Assignments 1,127.49 10.00 1,066.49 11.00 170.00 1,257.49 130.0023,230.55 14,764.06 3,351.49 11.00 6,602.00 24,728.55 1,498.00Total 174,585.34 141,384.30 27,919.30 7,939.04 8,375.00 185,617.64 11,032.30624.00 months funded by Athens Library.730.00 months funded by Athens Pre-school fees.824.00 months funded by <strong>Wake</strong> Capital Improvement.9234.00 months funded by <strong>Wake</strong> Capital Improvement Fund10 10.00 months funded by CIS-Garner Magnet High <strong>School</strong> Grant.11 84.00 months funded by Print Shop internal service fund.119 FY <strong>2007</strong>-<strong>08</strong> <strong>Plan</strong> for Student Success
Staff BudgetIncrease/(Decrease)2006-<strong>2007</strong><strong>2007</strong>-20<strong>08</strong>2006-<strong>2007</strong> toTotal State Local Federal Enterprise Total<strong>2007</strong>-20<strong>08</strong><strong>School</strong> - Based Months<strong>School</strong>-Based Allocations 157,106.32 136,914.94 16,438.98 6,896.70 7,411.00 167,661.62 10,555.30Centrally Allocated Positions Based in <strong>School</strong>sStudent Support 2,967.15 2,072.40 515.70 516.05 3,104.15 137.00Maintenance and Operations 2,544.00 48.00 2,496.00 2,544.00Curriculum and Instruction 977.22 111.00 549.93 322.29 983.22 6.00Technology 384.00 12.00 372.00 384.00Area Superintendents 72.00 72.00 72.00Auxiliary Services 1,278.49 36.00 1,194.49 202.00 1,432.49 154.00Human Resources 58.00 22.00 36.00 58.0<strong>08</strong>,280.86 2,279.40 5,222.12 874.34 202.00 8,577.86 297.00165,387.18 139,194.34 21,661.10 7,771.04 7,613.00 176,239.48 10,852.3095% 95%Centrally Located MonthsGrowth and <strong>Plan</strong>ning 264.00 264.00 264.00Administrative Services 1,285.56 12.00 1,261.56 36.00 1,309.56 24.00Human Resources 887.00 120.00 755.00 24.00 12.00 911.00 24.00Student Services 879.00 405.36 401.64 72.00 879.00Curriculum and Instruction 1,112.60 452.60 564.00 72.00 1,<strong>08</strong>8.60 (24.00)Facilities 660.00 648.00 12.00 660.00Technology 684.00 684.00 684.00Auxiliary Services 1,650.00 996.00 252.00 534.00 1,782.00 132.00Maintenance & Operations 444.00 120.00 336.00 456.00 12.00Area Superintendents 204.00 72.00 132.00 204.00Communications 474.00 324.00 162.00 486.00 12.00Superintendent's Office 354.00 12.00 336.00 6.00 354.00Evaluation and Research 300.00 300.00 300.009,198.16 2,189.96 6,258.20 168.00 762.00 9,378.16 180.005% 5%Total Months174,585.34 141,384.30 27,919.30 7,939.04 8,375.00 185,617.64 11,032.30120
Analysis of Increase (Decrease) in Months of EmploymentG - GrowthS - <strong>System</strong>wideC - Commitments by BOE to programs for future fundingN - New ProgramV - SavingsT - Grant SavingsMonths of EmploymentState Local Federal Enterprise TotalPageAdministrationDirector/SupervisorG 209 Director of communications months 12.00 12.00S 263 Senior administrator months for security systems maintenance 12.00 12.00T 331 Smaller Learning Communities director months - grant ending (12.00) (12.00)0.00 24.00 (12.00) 0.00 12.00PrincipalsG 147 Principal months for schools opening in <strong>2007</strong>-<strong>08</strong> 60.00 60.00G 155 Early hire principal months for schools opening in 20<strong>08</strong>-09 12.00 3.00 15.00C 288 Principal months for East <strong>Wake</strong> High whole school conversion 12.00 12.00V 322 One-time principal months allotted in 2006-07 for leave, class size, and scheduling issues (18.50) (18.50)84.00 (15.50) 0.00 0.00 68.50Assistant PrincipalsG 142 Assistant principal months for schools opening in <strong>2007</strong>-<strong>08</strong> and growth 141.00 41.50 182.50G 142 Assistant principal months for ninth grade centers at <strong>Wake</strong> Forest High and <strong>Wake</strong>field24.00 24.00HighC 282 Assistant principal months for traditional to year-round conversion 21.00 21.00C 288 Assistant principal months for East <strong>Wake</strong> High whole school conversion (12.00) (12.00)V 322 One-time assistant principal months allotted in 2006-07 for leave, class size, and(10.50) (10.50)scheduling issues129.00 76.00 0.00 0.00 205.00Subtotal - Administration 213.00 84.50 (12.00) 0.00 285.50Professional EducatorTeachersG 139 Classroom teacher months for new schools and growth 3,806.00 113.00 3,919.00G 155 Early hire teacher months for schools opening in 20<strong>08</strong>-09 21.00 21.00G 170 Career and technical education teacher months for schools opening in <strong>2007</strong>-<strong>08</strong> 120.00 120.00121 FY <strong>2007</strong>-<strong>08</strong> <strong>Plan</strong> for Student Success
Analysis of Increase (Decrease) in Months of EmploymentG - GrowthS - <strong>System</strong>wideC - Commitments by BOE to programs for future fundingN - New ProgramV - SavingsT - Grant SavingsMonths of EmploymentState Local Federal Enterprise TotalPageProfessional EducatorG 170 Career and technical education teacher months for growth 110.00 110.00G 171 K-5 Curriculum and instruction teacher months for new schools and growth 292.00 292.00G 172 Academically gifted teacher months for new schools and growth 86.00 86.00G 174 English as a second language teacher months for growth 65.00 65.00G 175 Advancement via individual determination (AVID) teacher months for third cohort group 56.00 56.00G 176 Local literacy teacher months to support K-2 intervention and coaching for new18.00 18.00elementary schoolsG 177 In-school suspension teacher months for new middle schools 16.00 16.00G 183 Special education teacher months for growth 937.00 190.00 1,127.00G 192 Accelerated learning teacher months due to increase in Level I and II students in math on197.00 197.00the 2005-06 end of grade math testG 194 Challenged schools teacher months for growth 20.00 20.00G 244 Intersession teacher months for new year round elementary schools 30.00 30.00C 275 Local literacy teacher months for traditional to year round conversion 19.00 19.00C 277 In-school suspension teacher months for traditional to year round conversion 6.00 6.00C 286 Intersession teacher months for traditional to year round conversion 190.00 190.00N 299 English as a second language teacher months 84.00 84.00V 324 One-time teacher months allotted in 2006-07 for tenth day overages (93.07) (93.07)V 322 One-time teacher months allotted in 2006-07 for leave, class size, and scheduling issues (79.75) (79.75)T 334 Title V Innovative Education Learning Strategies teacher months - grant ending (33.00) (33.00)T One-time teacher months paid by individual school accounts in 2006-07 (16.50) (16.50)T Fewer teacher months will be paid from IDEA Title VI-B Pre-<strong>School</strong> grant (10.00) (10.00)T Fewer teacher months will be paid from IDEA Title VI-B grant (10.00) (10.00)5,146.00 956.68 31.00 0.00 6,133.68Media SpecialistsG 173 Media specialist months for new schools 58.00 58.00G 173 Media specialist months for ninth grade centers at <strong>Wake</strong>field High and <strong>Wake</strong> Forest High 10.00 10.00C 276 Media specialist months for traditional to year round conversion 54.00 54.00122
Analysis of Increase (Decrease) in Months of EmploymentG - GrowthS - <strong>System</strong>wideC - Commitments by BOE to programs for future fundingN - New ProgramV - SavingsT - Grant SavingsMonths of EmploymentState Local Federal Enterprise TotalPageProfessional EducatorC 276 Media specialist months decrease in allotment to magnet schools due to traditional toyear round conversion(45.00) (45.00)77.00 0.00 0.00 0.00 77.00CounselorsG 166 Counselor months for ninth grade centers at <strong>Wake</strong> Forest High and <strong>Wake</strong>field High 24.00 24.00G 187 <strong>School</strong> counselor months for growth 152.00 152.00G 187 SAP coordinator moving from federal to state funding 10.00 (10.00) 0.00G 196 Transitional counselor months due to growth and increase in number of long-term11.00 11.00suspended studentsG 198 High school intervention coordinator months for <strong>Wake</strong> Early College of Health and5.00 5.00ScienceC 280 <strong>School</strong> counselor months for traditional to year round conversion 50.00 50.00223.00 29.00 (10.00) 0.00 242.00Speech PathologistG 189 Speech therapist months for school-age services 120.00 120.00G 189 Speech therapist months for preschool services 24.00 24.000.00 144.00 0.00 0.00 144.00Other Professional Educator AssignmentsT 331 Smaller Learning Communities coordinator months - grant ending (49.50) (49.50)0.00 0.00 (49.50) 0.00 (49.50)Subtotal - Professional Educator 5,446.00 1,129.68 (28.50) 0.00 6,547.18Professional - OtherOther Professional AssignmentG 197 Audiologist months for growth 6.00 6.00T Fewer coordinating teacher months will be paid from Emergent Literacy grant (1.00) (1.00)0.00 6.00 (1.00) 0.00 5.00123 FY <strong>2007</strong>-<strong>08</strong> <strong>Plan</strong> for Student Success
Analysis of Increase (Decrease) in Months of EmploymentG - GrowthS - <strong>System</strong>wideC - Commitments by BOE to programs for future fundingN - New ProgramV - SavingsT - Grant SavingsMonths of EmploymentState Local Federal Enterprise TotalPageProfessional - OtherPsychologist<strong>School</strong> psychologist months for growth and increase in number of lont-term suspended 51.00 51.00G 190 studentsC 279 Psychologist months for traditional to year round conversion 22.00 22.00N 300 Psychologist months for academically gifted program 6.00 6.0079.00 0.00 0.00 0.00 79.00Social WorkersG 191 Social worker months for growth and increase in number of long-term suspended41.66 41.66studentsC 278 Social worker months for traditional to year round conversion 22.00 22.0063.66 0.00 0.00 0.00 63.66Subtotal - Professional - Other 142.66 6.00 (1.00) 0.00 147.66TechnicalTeacher AssistantsG 140 Teacher assistant months for new schools and growth 1,1<strong>08</strong>.00 1,1<strong>08</strong>.00G 185 Special education teacher assistant and transition training facilitator months for growth 226.00 228.00 454.00G 244 Intersession teacher assistant months for new year round elementary schools 30.00 30.00C 286 Intersession teacher assistant months for traditional to year round conversion 190.00 190.00V 322 One-time teacher assistant months allotted in 2006-07 for leave, class size, and(14.00) (14.00)scheduling issuesV One-time teacher assistant months paid by individual school accounts in 2006-07 (14.00) (14.00)TFewer teacher assistant months will be paid from Title III - Language Acquisition grant(2.00) (2.00)1,334.00 420.00 (2.00) 0.00 1,752.00TherapistsG 193 Occupational therapist months for growth 36.00 36.00G 195 Physical therapist months for growth 12.00 12.000.00 48.00 0.00 0.00 48.00124
Analysis of Increase (Decrease) in Months of EmploymentG - GrowthS - <strong>System</strong>wideC - Commitments by BOE to programs for future fundingN - New ProgramV - SavingsT - Grant SavingsMonths of EmploymentState Local Federal Enterprise TotalPageTechnicalTechnology AssistantT 333 Educational Technology Grant Customer Support Analyst months - grant ending (12.00) (12.00)V 321 One-time technology assistant months paid by individual school accounts in 2006-07 (0.04) (0.04)0.00 (0.04) (12.00) 0.00 (12.04)Other Professional NonCertifiedG 232 Operations manager for transportation district at Knightdale 12.00 12.00S 254 Operations manager months for exceptional children contract cars and buses program 12.00 12.000.00 24.00 0.00 0.00 24.00Subtotal - Technical 1,334.00 491.96 (14.00) 0.00 1,811.96Office/ClericalOffice PersonnelG 144 <strong>School</strong>-Based Clerical 440.00 440.00G 155 Early hire of lead secretary for schools opening in 20<strong>08</strong>-09 15.00 15.00G 144 Clerical months for ninth grade centers at <strong>Wake</strong> Forest High and <strong>Wake</strong>field High 20.00 20.00G 201 Oracle processing technician for Human Resources 12.00 12.00G 201 Workers' compensation technician for Human Resources 12.00 12.00G 211 Child nutrition clerical assistant months for new schools and growth 36.00 36.00G 218 Processing technician for building program 12.00 12.00S 256 Bookkeeper months for transportation department 12.00 12.00C 288 Lead secretary months for East <strong>Wake</strong> High whole school conversion 12.00 12.00V 324 One-time clerical months allotted in 2006-07 for tenth day overages (3.00) (3.00)V 322 One-time clerical months allotted in 2006-07 for leave, class size, and scheduling issues (1.00) (1.00)V One-time clerical months paid by individual school accounts in 2006-07 (1.00) (1.00)452.00 78.00 0.00 36.00 566.00Subtotal - Office/Clerical 452.00 78.00 0.00 36.00 566.00125 FY <strong>2007</strong>-<strong>08</strong> <strong>Plan</strong> for Student Success
Analysis of Increase (Decrease) in Months of EmploymentG - GrowthS - <strong>System</strong>wideC - Commitments by BOE to programs for future fundingN - New ProgramV - SavingsT - Grant SavingsMonths of EmploymentState Local Federal Enterprise TotalPageCrafts/TradesTransportation PersonnelG 230 Bus mechanic months for growth 72.00 72.00G 232 Bus operations team leader months for transportation district at Knightdale 12.00 12.00S 254 Bus operations team leader months for exceptional contract cars and buses program 12.00 12.00S 264 Safety/recruitment officer months for transportation 12.00 12.0<strong>08</strong>4.00 24.00 0.00 0.00 1<strong>08</strong>.00Other Crafts and Trade AssignmentsG 211 Child nutrition assistant manager months for new schools and growth 68.00 68.000.00 0.00 0.00 68.00 68.00Subtotal - Crafts/Trades 84.00 24.00 0.00 68.00 176.00OthersDriverG 202 Courier 12.00 12.00G 222 Bus driver months for drivers moving from ten to twelve month positions 374.00 374.00G 222 Bus driver months for new middle school routes 360.00 360.00374.00 372.00 0.00 0.00 746.00Substitute DriverG 225 Substitute driver months due to increase in number buses on the road and theconversion of schools from traditional to year round calendar300.00 300.000.00 300.00 0.00 0.00 300.00Child NutritionG 211 Child nutrition cashier/assistant months for new schools and growth 154.00 154.000.00 0.00 0.00 154.00 154.00ManagersG 211 Child nutrition manager months for new schools and growth 48.00 48.00G 211 Child nutrition training specialist months for new schools and growth 12.00 12.00Child nutrition manager month for schools converting from traditional to year round1<strong>08</strong>.00 1<strong>08</strong>.00G 211 calendar0.00 0.00 0.00 168.00 168.00126
Analysis of Increase (Decrease) in Months of EmploymentG - GrowthS - <strong>System</strong>wideC - Commitments by BOE to programs for future fundingN - New ProgramV - SavingsT - Grant SavingsMonths of EmploymentState Local Federal Enterprise TotalPageOthersOther AssignmentsG 229 Bus safety assistants for growth 130.00 130.000.00 130.00 0.00 0.00 130.00Subtotal - Other 374.00 802.00 0.00 322.00 1,498.00Total 8,045.66 2,616.14 (55.50) 426.00 11,032.30G Growth 7,906.66 2,399.50 (10.00) 426.00 10,722.16S <strong>System</strong>wide 12.00 48.00 60.00C Board of Education Commitments 121.00 420.00 541.00N New Program 6.00 84.00 90.00V Savings and Reductions (251.36) (106.50) (357.86)T Grant Adjustments (23.00) (23.00)Total 8,045.66 2,616.14 (55.50) 426.00 11,032.30127 FY <strong>2007</strong>-<strong>08</strong> <strong>Plan</strong> for Student Success
Uniform Format§ 115C-426. Uniform Budget FormatThe Uniform Budget Format is a presentation of the budget as requiredby the legislation in §115C-426.(a) The State Board of Education, in cooperation with the Local GovernmentCommission, shall cause to be prepared and promulgated a standardbudget format for use by local school administrative units throughoutthe State.(b) The uniform budget format shall be organized so as to facilitate accomplishmentof the following objectives: (i) to enable the board of educationand the board of county commissioners to make the local educationaland local fi scal policies embodied therein; (ii) to control and facilitate thefi scal management of the local school administrative unit during the fi scalyear; and (iii) to facilitate the gathering of accurate and reliable fi scal dataon the operation of the public school system throughout the State.(c) The uniform budget format shall require the following funds:(1) The State <strong>Public</strong> <strong>School</strong> Fund.(2) The local current expense fund.(3) The capital outlay fund.In addition, other funds may be required to account for trust funds, federalgrants restricted as to use, and special programs. Each local schooladministrative unit shall maintain those funds shown in the uniform budgetformat that are applicable to its operations.(d) The State <strong>Public</strong> <strong>School</strong> Fund shall include appropriations for the currentoperating expenses of the public school system from monies madeavailable to the local school administrative unit by the State Board ofEducation.(e) The local current expense fund shall include appropriations suffi cient,when added to appropriations from the State <strong>Public</strong> <strong>School</strong> Fund, forthe current operating expense of the public school system in conformitywith the educational goals and policies of the State and the local boardof education, within the fi nancial resources, and consistent with the fi s-cal policies of the board of county commissioners. These appropriationsshall be funded by revenues accruing to the local school administrativeunit by virtue of Article IX, Sec. 7 of the Constitution, monies madeavailable to the local school administrative unit by the board of countycommissioners, supplemental taxes levied by or on behalf of the localschool administrative unit pursuant to a local act or G.S. 115C-501 to115C-511, State money disbursed directly to the local school administrativeunit, and other monies made available or accruing to the localschool administrative unit for the current operating expenses of the publicschool system.(f) The capital outlay fund shall include appropriations for:(1) The acquisition of real property for school purposes, including butnot limited to school sites playgrounds, athletic fi elds, administrativeheadquarters, and garages.(2) The acquisition, construction, reconstruction, enlargement, renovation,or replacement of buildings and other structures, includingbut not limited to buildings for classrooms and laboratories, physicaland vocational educational purposes, libraries, auditoriums,gymnasiums, administrative offi ces, storage, and vehicle maintenance.(3) The acquisition or replacement of furniture and furnishings, instructionalapparatus, data-processing equipment, business machines,and similar items of furnishings and equipment.(4) The acquisition of school buses as additions to the fl eet.(5) The acquisition of activity buses and other motor vehicles.(6) Such other objects of expenditure as may be assigned to thecapital outlay fund by the uniform budget format.The cost of acquiring or constructing a new building, or reconstructing,enlarging, or renovating an existing building, shall include the cost of allreal property and interests in real property, and all plants, works, appurtenances,structures, facilities, furnishings, machinery, and equipment necessaryor useful in connection therewith; fi nancing charges; the cost ofplans, specifi cations, studies, reports, and surveys; legal expenses; andall other costs necessary or incidental to the construction, reconstruction,enlargement, or renovation.No contract for the purchase of a site shall be executed, nor any fundsexpended, without the approval of the board of county commissionersas to the amount to be spent for the site. In case of a disagreementbetween the board of education and the board of county commissionersas to the amount to be spent for the site, the procedure provided in G.S.128
Uniform Format115C-431 shall, insofar as the same may be applicable, be used to settlethe disagreement.Appropriations in the capital outlay fund shall be funded by revenuesmade available for capital outlay purposes by the State Board of Educationand the board of county commissioners, supplemental taxes leviedby or on behalf of the local school administrative unit pursuant to a localact or G.S. 115C-501 to 115C-511, the proceeds of the sale of capital assets,the proceeds of claims against fi re and casualty insurance policies,and other sources.(g) Other funds shall include appropriations for such purposes fundedfrom such sources as may be prescribed by the uniform budget format.129 FY <strong>2007</strong>-<strong>08</strong> <strong>Plan</strong> for Student Success
Uniform FormatSummary of Revenues<strong>County</strong>AppropriationLocalCurrentState<strong>Public</strong> Federal Multiple Capital Total Budget<strong>2007</strong>-20<strong>08</strong> Expense <strong>School</strong> Grant Enterprise OutlayFund Fund Fund Fund Fund <strong>2007</strong>-20<strong>08</strong>REVENUESState Sources $ 10,638,337 $ 688,579,048 $ - $ 46,342 $ - $ 699,263,727Federal Sources 1,495,000 - 56,956,065 17,363,119 - 75,814,184300,744,100 Local Sources 319,623,231 - - 39,197,256 636,832,818 995,653,305300,744,100 Total Operating Revenues 331,756,568 688,579,048 56,956,065 56,606,717 636,832,818 1,770,731,216Fund Balance Appropriated 17,730,668 1,285,810 19,016,478300,744,100 Total Revenues $ 349,487,236 $ 688,579,048 $ 56,956,065 $ 56,606,717 $ 638,118,628 $ 1,789,747,694Summary of ExpendituresEXPENDITURESInstructional Programs77,868,366 Regular Instructional Services $ 102,499,737 $ 410,360,043 $ 2,389,693 $ - $ - $ 515,249,47323,301,371 Special Populations Services 23,874,047 93,2<strong>08</strong>,235 22,171,254 - - 139,253,53611,015,207 Alternative Programs and Services 12,248,639 22,4<strong>08</strong>,221 15,664,771 282,186 - 50,603,81726,559,522 <strong>School</strong> Leadership Services 27,976,003 38,851,116 - - - 66,827,1196,936,583 Co-Curricular Services 7,076,199 48,717 - - - 7,124,9168,650,274 <strong>School</strong>-Based Support Services 10,330,755 56,749,392 4,713,285 - 2,697,509 74,490,941154,331,323 $ 184,005,380 $ 621,625,724 $ 44,939,003 $ 282,186 $ 2,697,509 $ 853,549,802<strong>System</strong>wide Support Services4,322,297 Support and Developmental Services $ 6,445,970 $ 2,988,490 $ 7,066,925 $ - $ - $ 16,501,3851,963,688 Special Population Support and 1,998,604 3,<strong>08</strong>6,760 343,724 - - 5,429,<strong>08</strong>8Developmental Services - - - - - -919,311 Alternative Programs and Services 1,115,259 450,584 535,146 - - 2,100,989- Support and Developmental Services - - - - - -12,102,943 Technology Support Services 13,070,255 1,717,567 149,920 - 12,289,821 27,227,56387,313,043 Operational Support Services 99,362,739 57,009,656 244,062 - 557,542,959 714,159,41617,297,773 Financial and Human Resource 18,457,918 211,409 14,613 - 45,330 18,729,270- Services - - - - - -1,985,965 Accountability Services 2,278,629 59,048 10,000 - - 2,347,6773,454,619 <strong>System</strong>wide Pupil Support Services 4,887,695 456,714 68,096 - - 5,412,5056,519,195 Policy, Leadership and <strong>Public</strong> 7,407,457 971,374 - - - 8,378,831- Relations - - - - - -135,878,834 $ 155,024,526 $ 66,951,602 $ 8,432,486 $ - $ 569,878,110 $ 800,286,724Ancillary Services- Community Services $ 250,682 $ 1,722 $ - $ 10,501,307 $ - $ 10,753,711- Nutrition Services - - 900 39,874,933 - 39,875,833- Adult Services - - - 850,193 - 850,193- $ 250,682 $ 1,722 $ 900 $ 51,226,433 $ - $ 51,479,737130
Uniform Format<strong>County</strong>AppropriationLocalCurrentState<strong>Public</strong> Federal Multiple Capital Total Budget<strong>2007</strong>-20<strong>08</strong> Expense <strong>School</strong> Grant Enterprise OutlayFund Fund Fund Fund Fund <strong>2007</strong>-20<strong>08</strong>Non-Programmed Charges10,025,007 Payments to Other Governmental Units $ 10,<strong>08</strong>3,465 $ - $ 2,385,645 $ 4,7<strong>08</strong>,538 $ 454,259 $ 17,631,907105,581 Unbudgeted Funds 123,183 - 1,198,031 - - 1,321,214- Interfund Transfers - - - 5,939,243 5,939,24310,130,588 Subtotal Non-Programmed Chgs. 10,206,648 - 3,583,676 4,7<strong>08</strong>,538 6,393,502 24,892,364300,340,745 Total Operating Expenditures $ 349,487,236 $ 688,579,048 $ 56,956,065 $ 56,217,157 $ 578,969,121 $ 1,730,2<strong>08</strong>,627Capital Outlay403,355 Capital Outlay $ - $ - $ - $ 389,560 $ 59,149,507 $ -403,355 Total Capital Outlay $ - $ - $ - $ 389,560 $ 59,149,507 $ 59,539,067300,744,100 Total Expenditures $ 349,487,236 $ 688,579,048 $ 56,956,065 $ 56,606,717 $ 638,118,628 $ 1,789,747,694131 FY <strong>2007</strong>-<strong>08</strong> <strong>Plan</strong> for Student Success
Uniform FormatLocal StateCurrent <strong>Public</strong> Federal Multiple CapitalExpense <strong>School</strong> Grant Enterprise Outlay TotalFund Fund Fund Fund Fund BudgetRevenues from State & Federal SourcesState RevenuesAllocations from State <strong>Public</strong> <strong>School</strong> Fund $ - $ 688,579,048 $ - $ - $ - $ 688,579,048Other State Allocations for Current Operations: - - - - - -Textbooks 10,527,837 - - - - 10,527,837Other State Allocations 110,500 - - - - 110,500State Reimbursement - Breakfast - - - 46,342 - 46,342Total State Revenues $ 10,638,337 $ 688,579,048 $ - $ 46,342 $ - $ 699,263,727Federal RevenuesRevenues from Federal Sources - Unrestricted:Impact Area Grants (P. L. 874) $ 10,000 $ - $ - $ - $ - $ 10,000Revenues from Federal Sources - Restricted: - - - - -IDEA Title VI-B - - 21,877,819 - - 21,877,819ESEA Title 1 - Basic Program - - 21,391,903 - - 21,391,903Title II - Improving Teacher Quality - - 8,455,282 - - 8,455,282Title III - Language Acquisition - - 1,073,511 - - 1,073,511Career Technical Education - Program Improvement - - 1,252,646 - - 1,252,646IDEA VI-B Pre-<strong>School</strong> Handicapped - - 452,380 - - 452,380Title III - Language Acquisition - Significant Increase - - - - - -Safe and Drug - Free <strong>School</strong>s - - 414,596 - - 414,596IDEA VI-B Capacity Bldg. & Improvement - - 278,733 - - 278,733McKinney - Vento - Homeless Assistance Act - - 50,000 - - 50,000Abstinence Education - - 56,395 - - 56,395Learn and Serve America - - 20,000 - - 20,000Title V - Innovative Education Program Strategies - - 177,941 - - 177,941Education Technology Formula - - 167,013 - - 167,013Title I - Comprehensive <strong>School</strong> Reform - - - - - -Revenues from Federal Sources - Other Restricted Grants: - - - - - -Medicaid Administrative Outreach Program 1,010,000 - - - - 1,010,000Medicaid Direct Reimbursement Program 300,000 - - - - 300,000Other Restricted Federal Grants - - 1,287,846 - - 1,287,846Other Revenues from Federal Sources - Restricted Grants: - - - - - -USDA Grants - Regular - - - 17,279,952 - 17,279,952USDA Grants - Summer Feeding - - - 83,167 - 83,167ROTC 175,000 - - - - 175,000Total Federal Sources $ 1,495,000 $ - $ 56,956,065 $ 17,363,119 $ - $ 75,814,184132
Uniform FormatRevenues from Local and Other SourcesLocal Sources - General:<strong>County</strong> Appropriations $ 296,964,799 $ - $ - $ - $ 3,779,301 $ 300,744,100Local Sources - Tuition and Fees: - - - - - -Tuition and Fees - Regular and Parking 801,460 - - - - 801,460Tuition and Fees - Adult Basic Education - - - 5,286,007 - 5,286,007Tuition and Fees - Before and After <strong>School</strong> Care 124,320 - - 7,026,252 - 7,150,572Tuition and Fees - Summer - - - - - -Local Sources - Revenues: - - - - - -Sales - Supplemental Sales - - - 13,658,792 - 13,658,792Sales - Lunch - Full Pay - - - 10,299,332 - 10,299,332Sales - Breakfast - Full Pay - - - 587,317 - 587,317Catered Meals - - - 494,121 - 494,121Sales - Lunch - Reduced - - - 360,405 - 360,405Sales - Breakfast - Reduced - - - 79,532 - 79,532Local Sources - Unrestricted: - - - - - -Rental of <strong>School</strong> Property - - - 850,193 - 850,193Interest Earned on Investments 2,500,000 - - 555,305 150,000 3,205,305Fines and Forfeitures 3,775,000 - - - - 3,775,000Miscellaneous Local Operating Revenues 1,520,060 - - - - 1,520,060Local Sources - Restricted: - - - - - -Bond and Note Proceeds - - - - 632,903,517 632,903,517Indirect Cost Allocated 5,450,000 - - - - 5,450,000Other Restricted Local Sources 2,094,090 - - - - 2,094,090Special Revenue Services: - - - - - -Fund Transfers: - - - - - -Transfer from the Capital Outlay Fund 6,393,502 - - - - 6,393,502Total Local Revenues $ 319,623,231 $ - $ - $ 39,197,256 $ 636,832,818 $ 995,653,305Total Revenues $ 331,756,568 $ 688,579,048 $ 56,956,065 $ 56,606,717 $ 636,832,818 $ 1,770,731,216- - - - - -Fund Balance Appropriated 17,730,668 - - - 1,285,810 19,016,478- - - - - -Total $ 349,487,236 $ 688,579,048 $ 56,956,065 $ 56,606,717 $ 638,118,628 $ 1,789,747,694133 FY <strong>2007</strong>-<strong>08</strong> <strong>Plan</strong> for Student Success
Uniform FormatCategory I Projects: Acquisition of real property andacquisition, construction, enlargement, renovation, orreplacement of buildings and other structures for schoolpurposes.Category II Project: Acquisition or replacement offurnishings and equipment.Category III Project: Acquisition of school buses, activitybuses, and other motor vehicles.Capital OutlayTotal<strong>County</strong> Capital Local Fund ProjectFunds Improvements Funds Balance Cost$ 2,720,404 $ 632,903,517 $ - $ 1,283,067 $ 636,906,9882,720,404 632,903,517 - 1,283,067 636,906,988272,130 - - 2,743 274,873272,130 - - 2,743 274,873786,767 - 150,000 - 936,767786,767 - 150,000 - 936,767Total $ 3,779,301 $ 632,903,517 $ 150,000 $ 1,285,810 $ 638,118,628134
Statement of Revenues, Expenditures, and Changes in Fund BalanceGeneral State <strong>Public</strong> Individual Capital Non-Major Total GovernmentalFund <strong>School</strong> Fund <strong>School</strong>s Fund Projects Fund Funds FundsREVENUES:<strong>County</strong> $ 251,247,744 $ - $ - $ 227,358,356 $ - $ 478,606,100State 7,485,887 543,264,410 - 1,446,453 - 552,196,750Federal 243,820 - - - 50,492,666 50,736,486Other Local 22,359,589 - 12,627,651 9,481,796 2,890 44,471,926Total Revenues 281,337,040 543,264,410 12,627,651 238,286,605 50,495,556 1,126,011,262EXPENDITURES:Current operations:Instructional programs:Regular 69,507,721 267,143,037 - - 2,188,506 338,839,264Special 13,934,406 44,525,878 - - 23,176,349 81,636,633Co-curricular 237,304 - 12,005,302 - - 12,242,606Remediation services 4,335,890 11,<strong>08</strong>5,288 - - 1,057,078 16,478,256Student services 13,721,972 35,645,561 - - 5,452,378 54,819,911Other 20,291,876 88,623,710 - - 11,207,285 120,122,871Supporting services:Pupil 2,097,254 90,251 - - 123,123 2,310,628Instructional staff 4,076,240 2,479,988 - - 2,554,394 9,110,622General administration 7,446,153 1,713,404 - - 558,394 9,717,951<strong>School</strong> administration 19,272,199 29,285,822 - - 750 48,558,771Business 69,922,569 44,856,171 - - 4<strong>08</strong>,072 115,186,812Central 23,671,565 233,899 - - 385,281 24,290,745Other 14,283,078 17,578,715 - - 1,115,409 32,977,202Community services 215,673 2,686 - - - 218,359Nonprogram charges 9,076,830 - - - 2,265,647 11,342,477Capital outlay:Land, buildings, and other - - - 231,263,943 - 231,263,943Equipment - - - 2,379,157 - 2,379,157Vehicles - - - 3,272,121 - 3,272,121Debt service:Principal 449,462 - - 1,446,453 69,110 1,965,025Interest 35,530 - - - 2,890 38,420Total Expenditures 272,575,722 543,264,410 12,005,302 238,361,674 50,564,666 1,116,771,774Excess (deficiency) of revenues overexpenditures 8,761,318 - 622,349 (75,069) (69,110) 9,239,488OTHER FINANCING SOURCES (USES):Transfers in 3,572,258 - - 6,857,615 - 10,429,873Transfers out (6,857,615) - - (3,572,258) - (10,429,873)Total other financing sources (uses) (3,285,357) - - 3,285,357 - -Net change in fund balance 5,475,961 - 622,349 3,210,288 (69,110) 9,239,488Fund balances, beginning of year 36,916,713 - 7,563,138 7,367,913 116,966 51,964,730Increase in reserve for inventories 256,633 - - - - 256,633Fund Balances, end of the year $ 42,649,307 $ - $ 8,185,487 $ 10,578,201 $ 47,856 $ 61,460,851The notes to the basic financial statements are an integral part of this statement.WAKE COUNTY BOARD OF EDUCATIONSTATEMENT OF REVENUES, EXPENDITURES, AND CHANGES IN FUND BALANCEGOVERNMENTAL FUNDSFOR THE YEAR ENDED JUNE 30, 2006135 FY <strong>2007</strong>-<strong>08</strong> <strong>Plan</strong> for Student Success
Blueprint for Excellence 2006 Capital Improvement <strong>Plan</strong>In the year 2000, the <strong>Wake</strong> <strong>County</strong> <strong>Public</strong> <strong>School</strong> <strong>System</strong> (WCPSS) had97,853 students, including an increase of about 2,800 students. For2006, WCPSS and county planners projected a student population of127,513 students, but the actual enrollment was 128,072 – growth ofmore than 7,500 students. The face of growth has changed in <strong>Wake</strong><strong>County</strong>. Families seeking a good quality of life and a good educationfor their children have found what they are looking for here, but theyare coming in greater numbers than ever before. The result has beencrowded campuses, long lines, mobile units, and a great deal of ingenuityin each of our schools as WCPSS employees have worked to overcomethe challenge.In 1999, the <strong>Wake</strong> <strong>County</strong> Board of Education and <strong>Wake</strong> <strong>County</strong> Board ofCommissioners developed a comprehensive building program fi nancedby bonds that would have required an increase in the property tax rate.However, <strong>Wake</strong> <strong>County</strong> voters rejected the bond referendum that year.The school board and county commissioners went back before thevoters the following year with a smaller building program requiring no taxincrease: PLAN 2000. This time, <strong>Wake</strong> <strong>County</strong> citizens supported thebonds.Another bond referendum was held in 2003 to support the PLAN 2004building program. It also called for no tax increases, and was approvedby the voters. In both cases, compromises had to be made to hold downthe cost of the building program, with some needed renovations and newschools being deferred. Despite the passage of PLAN 2000, the failureof the 1999 referendum interrupted the building of schools. No newschools were opened in 2001. At the same time, our student populationgrowth was beginning to accelerate. WCPSS grew by 3,500 students in2001, 3,000 in 2002, and then there was a huge jump to 4,600 in 2003.This was well ahead of county planners’ projections, and the questionwas whether that growth was just an aberration. In 2004, WCPSS grewby 5,100 students, in 2005 by almost 6,500, and in 2006 by 7,500. ThePLAN 2004 building program simply was not designed to respond to somany new students. At the same time, steep infl ation in constructioncosts meant that PLAN 2004 was running out of money ahead ofschedule. Some school renovation projects that were originally part ofPLAN 2004 were delayed in order to implement a “crowding solution” for2005. WCPSS opened three modular campuses in order to give threeschools an early start before their permanent buildings were ready, andbrought the number of temporary classrooms systemwide above 1,000(with another hundred coming soon).A year earlier than originally planned, the school board and countycommissioners presented a new school building program to <strong>Wake</strong> <strong>County</strong>voters in November 2006, and the voters approved the referendum by53 to 47 percent. The Blueprint for Excellence 2006 builds new schools,identifi es land for future building programs, renovates existing schools,and provides needed technology upgrades. For the fi rst time since 1999,<strong>Wake</strong> citizens were asked to approve a property tax increase to fund theBlueprint. In an effort to keep that tax increase low and make optimal useof school facilities, 22 elementary and middle schools will be transitioningto the multi-track year-round calendar in the <strong>2007</strong>-<strong>08</strong> school year.<strong>Wake</strong> <strong>County</strong> has changed dramatically in the last few years. It is thefastest growing county in the state, adding 22,000 people each year.WCPSS has added more than 16,000 students to the system since 2002.The challenge, moving forward, is for our school system to respond tothat growth, while keeping the focus on our students’ academic needs.What Will the Capital Improvement <strong>Plan</strong>Provide?The new $1.056 billion building program, Blueprint for Excellence2006, is primarily fi nanced through the $970 million school constructionbond program. The Blueprint covers four main areas: constructionand crowding solutions, land banking, renovations, and technology;and represents an investment in the future of <strong>Wake</strong> <strong>County</strong>’s children,schools, and community.Construction and Crowding Solutions: <strong>Wake</strong> <strong>County</strong> classrooms arecrowded: Teachers are holding class in closets and workrooms, andare not always able to give students the individual attention they need;lunch is starting at 10:15 a.m.; and mobile units are overtaking play fi eldsand parking lots. In addition to the existing crowding, the <strong>Wake</strong> <strong>County</strong><strong>Public</strong> <strong>School</strong> <strong>System</strong> is expected to gain 40,000 new students by 2010.With these things in mind, the Capital Improvement <strong>Plan</strong> (CIP) will build17 new schools, easing crowding for current teachers and students andproviding classrooms for the thousands of additional students movinginto the county. Eleven elementary schools, four middle schools and two136
Blueprint for Excellence 2006 Capital Improvement <strong>Plan</strong>high schools will open between 20<strong>08</strong> and 2011.Year-round schools: WCPSS will gain an additional 3,000 elementaryseats by converting 19 existing elementary schools to the multi-trackyear-round calendar. The plan also calls for gaining 2,000 middle schoolseats through the conversion of three middle schools to year-round and/or the addition of mobile/modular classrooms. <strong>School</strong>s on the multi-trackyear-round calendar can serve 20-33 percent more students than schoolson the traditional calendar because at any given time, one of four groupsis out on break. For every three schools on the year-round calendar, thatis one less school that WCPSS needs to build.Ninth Grade Centers: To help with crowding at high schools, WCPSSplans to add fi ve or six ninth-grade centers in 2006 through 20<strong>08</strong>. Oneof the centers in particular is a great example of WCPSS’ innovativesolutions for providing classrooms: WCPSS is retrofi tting a former WinnDixie in <strong>Wake</strong> Forest for <strong>Wake</strong>fi eld High’s ninth-graders. In addition,<strong>Wake</strong> Forest-Rolesville High will use the modular campus at the DuBoisCenter, Millbrook High will use the mobile/modular units already oncampus from its earlier renovation project, Cary High’s new classroomaddition included in this bond will function as an interim ninth-gradecenter, Garner High will utilize additional modular classrooms on itscurrent property later this year, and there will probably be another centerin southwestern <strong>Wake</strong>.to addressing traffi c safety issues to making areas accessible to thosewith disabilities.The plan also addresses repairs and maintenance projects at nearly100 schools across the county. These deferred life-cycle replacementsinvolve roofs, air conditioning systems, boiler replacements, etc. -things one typically does not think about until they stop working. Todetermine renovation needs, WCPSS looks at building system lifecyclereplacements and a 40-year major renovation cycle. <strong>School</strong>s areprioritized based on a facility condition index, a ratio of the cost of workneeded at the building divided by the building replacement value.Technology: The bond will allow WCPSS to implement a technologyreplacement and upgrade program. A signifi cant number of thecomputers used by students and teachers in <strong>Wake</strong> <strong>County</strong> schools areold and outdated. They cannot run much of the current instructionalsoftware; they run so slowly that students are frustrated trying to usethem; they frequently break down and are out of service until repairs canbe made; or teachers are fearful of using them due to other performanceissues. A systematic replacement of these computers will enable studentand teacher access to the wealth of technology resources and onlineinformation available to support teaching and learning in <strong>Wake</strong> <strong>County</strong>schools.Land Banking: Signs advertising new developments are evident all overthe county. With the availability of suitable land shrinking and the costof land skyrocketing, it is wise to buy land now for future use. That iswhy the CIP includes funding for land and design start up for 13 futureschools - seven elementary, four middle, and two high - to open in 2011-2013. Ideally, WCPSS wants to purchase property further ahead, butthis is a good start.Renovations: Older schools need renovation to ensure they are qualityplaces for teachers to teach and children to learn. This CIP covers majorrenovations at 13 schools: Aversboro Elementary, Bugg Elementary,Cary High, East Millbrook Middle, East <strong>Wake</strong> High, Enloe High, LacyElementary, Lynn Road Elementary, Martin Middle, Poe Elementary,Root Elementary, Smith Elementary, and Wilburn Elementary.Renovations range from replacing or renovating 40 year-old classrooms137 FY <strong>2007</strong>-<strong>08</strong> <strong>Plan</strong> for Student Success
Notes138
Growth RequestsInitiative: Classroom TeacherCurrent Funding Formula:Base AllotmentsCalculations based on 10th day student membership. All students inkindergarten through Grade 12 are reported. Pre-school students arenot included. Distributed through self-allotment through day prior to Day1 of Traditional Calendar schools. MOE unearned on 10th day removedfrom payroll or charged to individual school Fund 6.FormulasElementary: Integer ((Kindergarten+Grade1+Grade2+Grade3)/20.5+(Grade4+Grade5)25.5))*10Middle <strong>School</strong>: Integer ((Grade6+Grade7+Grade8)/22.5))*10High <strong>School</strong>: Integer ((Grade9+Grade10+Grade11+Grade12))/2.4Implementation Timeline & Budget Needed:<strong>2007</strong>-<strong>08</strong> MOE Amount CodeADMTeacher Months3,806.00 $ 11,178,222855,134798,1251,540,2883,806.00 $ 14,371,769 State113.00 $ 331,8811,525,118142,060132,59045,73190,921Base 01.5100.001.121.0154.0000SS 01.5910.001.211.0154.0000Ret 01.5910.001.221.0154.0000Hosp 01.5910.001.231.0154.0000Base 02.5100.001.121.0154.0000Supp 02.5100.001.181.0154.0000SS 02.5910.001.211.0154.0000Ret 02.5910.001.221.0154.0000Hosp 02.5910.001.231.0154.0000Dental 02.5910.001.234.0154.000020<strong>08</strong>-09 MOE Amount CodeADMTeacher Months2009-10ADMTeacher Months3,500.00 $ 10,279,500786,382733,9561,487,1503,500.00 $ 13,286,988 State0.00 $ 01,362,060104,19897,251<strong>08</strong>1,200$ 1,644,709 LocalTotal: 3,500.00 $14,931,6973,575.00 $ 10,499,775803,233749,6841,594,8<strong>08</strong>3,575.00 $ 13,647,500 State0.00 $ 01,391,247106,43099,335<strong>08</strong>2,940$ 1,679,952 LocalTotal: 3,575.00 $15,327,452Base 01.5100.001.121.0154.0000SS 01.5910.001.211.0154.0000Ret 01.5910.001.221.0154.0000Hosp 01.5910.001.231.0154.0000Base 02.5100.001.121.0154.0000Supp 02.5100.001.181.0154.0000SS 02.5910.001.211.0154.0000Ret 02.5910.001.221.0154.0000Hosp 02.5910.001.231.0154.0000Dental 02.5910.001.234.0154.0000Base 01.5100.001.121.0154.0000SS 01.5910.001.211.0154.0000Ret 01.5910.001.221.0154.0000Hosp 01.5910.001.231.0154.0000Base 02.5100.001.121.0154.0000Supp 02.5100.001.181.0154.0000SS 02.5910.001.211.0154.0000Ret 02.5910.001.221.0154.0000Hosp 02.5910.001.231.0154.0000Dental 02.5910.001.234.0154.0000$ 2,268,301 LocalTotal: 3,919.00 $16,640,070139 FY <strong>2007</strong>-<strong>08</strong> <strong>Plan</strong> for Student Success
Growth RequestsInitiative: Teacher AssistantsCurrent Funding Formula:WCPSS Formula:Calculations based on 10th day student membership. All students inkindergarten through Grade 3 are reported. Pre- school students are notincluded. Distributed through self-allotment through day prior to Day 1for Traditional Calendar schools. Unearned MOE after 10th day removedor charged to individual school Fund 6.Calculated monthsof employment(MOE)MOE allotted onthe website2006-07 TenthDay StudentMembership15,24014,810<strong>2007</strong>-<strong>08</strong> TenthDay StudentMembership16,38020<strong>08</strong>-09 TenthDay StudentMembership17,3902009-10 TenthDay StudentMembership18,210Formulas:Integer ((Kindergarten+Grade1+Grade2+Grade3)/28))*10Year Round:Year round schools receive ten months for an intersession teacherassistant.Implementation Timeline & Budget Needed:2006-07 TenthDay StudentMembership<strong>2007</strong>-<strong>08</strong> TenthDay StudentMembership20<strong>08</strong>-09 TenthDay StudentMembership2009-10 TenthDay StudentMembershipK 11,065 11,878 12,658 13,4391 11,029 11,773 12,059 12,5202 10,388 11,403 12,124 12,4183 10,194 10,833 11,866 12,616Total: 42,676 45,887 48,707 50,993Increase: 3,211 2,820 2,286Rounding DownFactorApply RoundingDown Factor tocalculated MOENew MOE neededeach year2.82%2.82%15,9181,1<strong>08</strong>2.82%16,900982<strong>2007</strong>-<strong>08</strong> MOE Amount CodeTeacherAssistants1,1<strong>08</strong>.00 $ 1,980,782151,530141,428448,4<strong>08</strong>1,1<strong>08</strong>.00 2,722,148 State0.00 25,706 LocalTotal: 1,1<strong>08</strong>.00 $ 2,747,8542.82%17,696797Base 01.5100.027.142.0101.0000SS 01.5910.027.211.0101.0000Ret 01.5910.027.221.0101.0000Hosp 01.5910.027.231.0101.000025,706 Dental 02.5910.027.234.0101.000020<strong>08</strong>-09TeacherAssistants981.00 $ 1,753,744134,161125,217416,827Base 01.5100.027.142.0101.0000SS 01.5910.027.211.0101.0000Ret 01.5910.027.221.0101.0000Hosp 01.5910.027.231.0101.0000981.00 2,429,949 State22,759 Dental 02.5910.027.234.0101.00000.00 22,759 LocalTotal: 981.00 $ 2,452,7<strong>08</strong>140
Growth Requests2009-10 MOE Amount CodeTeacherAssistants796.00 $ 1,423,0171<strong>08</strong>,861101,603355,096Base 01.5100.027.142.0101.0000SS 01.5910.027.211.0101.0000Ret 01.5910.027.221.0101.0000Hosp 01.5910.027.231.0101.0000796.00 1,988,577 State18,467 Dental 02.5910.027.234.0101.00000.00 18,467 LocalTotal: 796.00 $ 2,007,044141 FY <strong>2007</strong>-<strong>08</strong> <strong>Plan</strong> for Student Success
Growth RequestsInitiative: Assistant PrincipalsCurrent Funding Formula:Not calculated by formula. Allotment determined by broad bands at eachlevel, contingent on available Months of Employment (MOE) and otherconditions. The formula below has been proposed, but not implemented,pending funding.If your projectedstudent count is:000-899900-10991100+Proposed FormulaElementaryThen your APallotment is:12 MOE18 MOE24 MOEIf your projectedstudent count is:000-449450-799800-11991200-19992000-22992300+SecondaryThen your APallotment is:12 MOE24 MOE36 MOE48 MOE60 MOE72 MOEImplementation Timeline & Budget Needed:It is too early to know the student count by school for each of the nextthree years. Therefore, we are projecting the assistant principal monthsby applying the months per Average Daily Membership (ADM) from 2006-07 to the projected student membership for the next three years. Monthswill be allotted to schools each year by applying the phase-in formulaabove to projected student memberships for each school.2006-07Assistant Principal(AP) MonthsTotal numberof AP MonthsAlloted10th DayStudentsEquals Monthsper ADM from2006-072,803.50 127,767 0.021942286<strong>2007</strong>- <strong>08</strong> MOE Amount CodeThe 2006-07 allotments were calculated using the following bands.This is a phase-in until funding is approved for the proposed formula.Elementary <strong>School</strong>s:If your projected student count is: Then your AP allotment is:000-899 11 MOE Trad/12 MOE YR900-1099 16.5 MOE Trad/18 MOE YR1100+ 24 MOEMiddle <strong>School</strong>s:If your projected student count is: Then your AP allotment is:000-699 12 MOE700-949 24 MOE950-1399 29 MOE1400+ 36 MOEHigh <strong>School</strong>s:If your projected student count is: Then your AP allotment is:Base Allotment 18 MOE1650-2399 48 MOE2400+ 60 MOE142AdditionalAP Months- Projectedstudents =136,<strong>08</strong>6141.00 $ 685,82452,46648,96851,888141.00 $ 839,146 State41.50 $ 201,856191,62527,12525,31615,2723,83341.50 $ 465,027 Local182.50 $1,304,173Base 01.6410.005.116.0109.0000SS 01.6910.005.211.0109.0000Ret 01.6910.005.221.0109.0000Hosp 01.6910.005.231.0109.0000Base 02.6410.005.116.0109.0000Supp 02.6410.005.181.0109.0000SS 02.6910.005.211.0109.0000Ret 02.6910.005.221.0109.0000Hosp 02.6910.005.231.0109.0000Dental 02.6910.005.234.0109.0000
Growth Requests20<strong>08</strong>-09AdditionalAP Months- Projectedstudents =144,03599.00 $ 5<strong>08</strong>,06838,86736,27638,21499.00 $ 621,425 StateBase 01.6410.005.116.0109.0000SS 01.6910.005.211.0109.0000Ret 01.6910.005.221.0109.0000Hosp 01.6910.005.231.0109.000075.00 $ 384,900192,79244,19341,24728,9503,654Base 02.6410.005.116.0109.0000Supp 02.6410.005.181.0109.0000SS 02.6910.005.211.0109.0000Ret 02.6910.005.221.0109.0000Hosp 02.6910.005.231.0109.0000Dental 02.6910.005.234.0109.000075.00 $ 695,736 Local174.00 $1,317,1612009-10AdditionalAP Months- Projectedstudents =152,206103.00 $ 555,06742,46339,63241,818103.00 $ 678,980 StateBase 01.6410.005.116.0109.0000SS 01.6910.005.211.0109.0000Ret 01.6910.005.221.0109.0000Hosp 01.6910.005.231.0109.000077.00 $ 414,953209,34047,75844,57531,2623,780Base 02.6410.005.116.0109.0000Supp 02.6410.005.181.0109.0000SS 02.6910.005.211.0109.0000Ret 02.6910.005.221.0109.0000Hosp 02.6910.005.231.0109.0000Dental 02.6910.005.234.0109.000077.00 $ 751,668 Local180.00 $1,430,648143 FY <strong>2007</strong>-<strong>08</strong> <strong>Plan</strong> for Student Success
Growth RequestsInitiative: <strong>School</strong>-Based Clerical AllotmentCurrent Funding Formula:Base AllotmentsElementary: 44 MOE (12 MOE Lead Secretary, 12 MOE NCWise DataManager, 10 MOE Media Assistant, 10 MOE Clerical)Middle: 68 MOE (12 MOE Lead Secretary, 12 MOE NCWise DataManager, 12 MOE Bookkeeper, 12 MOE Guidance Assistant, 10 MOEMedia Assistant, 10 MOE Receptionist)High: 99 MOE (12 MOE Lead Secretary, 12 MOE NCWise Data Manager,12 MOE Bookkeeper, 12 MOE Registrar, 11 MOE Secretary, 40 MOEClerical Assistant)10th Day K-12 Membership Adjustments to Base (only if positive)Elementary: 1 month of employment per 35 students for schools inexcess of 500 students. Partial months are rounded down.Middle: 1 month of employment per 35 students for schools in excess of800 students. Partial months are rounded down.High: 1 month of employment per 35 students for schools in excess of1,200 students. Partial months are rounded down.OtherYear round schools adjusted four MOE.Due to small size, Longview, Redirection, River Oaks, and <strong>Wake</strong> EarlyCollege have total allotment of 24 MOE, and Phillips has a base of 30MOE.Implementation Timeline & Budget Needed:<strong>2007</strong>-<strong>08</strong> MOE Cost CodeEast Garner ESNorth Forest Pines ESSanford Creek ESLead SecretaryNCWise Data MgrMedia AssistantClericalEast Cary MSGuidance AssistantMedia AssistantReceptionistNCWise Date MgrBookkeeperLead SecretaryWendell MSGuidance AssistantMedia AssistantReceptionistNCWise Date MgrBookkeeperLead SecretaryGrowth in StudentsClerical Assistant36.0036.0036.0036.0012.0012.0012.0012.0012.0012.0012.0010.0010.0012.0012.0012.00156.00$ 797,93561,04256,973140,026$ 138,84910,6229,91420,235440.00 $ 1,235,596 State$ 8,0271,1600.00 $ 9,187 LocalTotal 440.00 $1,244,783Base 01.6410.003.151.0109.0000SS 01.6910.003.211.0109.0000Ret 01.6910.003.221.0109.0000Hosp 01.6910.003.231.0109.0000Base 01.6410.003.151.0231.0000SS 01.6910.003.211.0231.0000Ret 01.6910.003.221.0231.0000Hosp 01.6910.003.231.0231.0000Dental 02.6910.003.234.0109.0000Dental 02.6910.003.234.0231.0000144
Growth Requests20<strong>08</strong>-09 MOE Cost CodeE17 Leesville AreaE22 Cary Park AreaE26 Laurel Park AreaClerical AssistantNCWise Data MgrLead SecretaryMedia AssistantGrowth in StudentsClerical Assistant36.0036.0036.0036.00176.00$ 615,72247,10343,962113,023$ 85,3926,5336,09712,747320.00 $ 930,579 State$ 6,1716960.00 $ 6,867 LocalTotal 320.00 $ 937,446Base 01.6410.003.151.0109.0000SS 01.6910.003.211.0109.0000Ret 01.6910.003.221.0109.0000Hosp 01.6910.003.231.0109.0000Base 01.6410.003.151.0231.0000SS 01.6910.003.211.0231.0000Ret 01.6910.003.221.0231.0000Hosp 01.6910.003.231.0231.0000Dental 02.6910.003.234.0109.0000Dental 02.6910.003.234.0231.00002009-10E23 Banks Road AreaE27 Southern <strong>Wake</strong>E28 Randleigh AreaE30 Amberly Park Area$ 827,61863,31359,092152,566Base 01.6410.003.151.0109.0000SS 01.6910.003.211.0109.0000Ret 01.6910.003.221.0109.0000Hosp 01.6910.003.231.0109.0000Clerical AssistantNCWise Data MgrLead SecretaryMedia AssistantHeritage High <strong>School</strong>Clerical AssistantNCWise Data MgrLead SecretarySecretaryBookkeeperRegistrar48.0048.0048.0048.0040.0012.0012.0011.0012.0012.00$ 145,16511,10510,36522,305Base 01.6410.003.151.0231.0000SS 01.6910.003.211.0231.0000Ret 01.6910.003.221.0231.0000Hosp 01.6910.003.231.0231.0000Growth in StudentsClerical AssistantLocal (Level 0109)Local (Level 0231)142.00433.00 $ 1,291,529 State$ 7,9341,160$ 9,094 LocalTotal 433.00 $ 1,300,623Dental 02.6910.003.234.0109.0000Dental 02.6910.003.234.0231.0000145 FY <strong>2007</strong>-<strong>08</strong> <strong>Plan</strong> for Student Success
Growth RequestsInitiative: Classroom Materials, Instructional Supplies, and EquipmentCurrent Funding Formula:Grades K-3 $86.13Grades 4-5 $79.83Grades 6-8 $88.48Grades 9-12 $92.73Implementation Timeline & Budget Needed:<strong>2007</strong>-<strong>08</strong>EstimatedStudentCountAmountCodeClassroom Materials,Instructional Suppliesand Equipment8,014 $ 419,212 01.5100.061.411.0207.0000$ 419.212 State276,335 02.5100.061.411.0207.0000$ 276,335 LocalTotal: 8,014 $ 695,54720<strong>08</strong>-09Classroom Materials,Instructional Suppliesand Equipment7,949 $ 415,812 01.5100.061.411.0207.0000$ 415,812 State$ 274,101 02.5100.061.411.0207.0000$ 274,101 LocalTotal: 7,949 $ 689,9132009-10Classroom Materials,Instructional Suppliesand Equipment8,171 $ 427,425 01.5100.061.411.0207.0000$ 427,425 State$ 281,752 02.5100.061.411.0207.0000$ 281,752 LocalTotal: 8,171 $ 709,177146
Growth RequestsInitiative: PrincipalsCurrent Funding Formula:Each school with 100 or more pupils in fi nal Average Daily Membership(ADM) and/or seven or more full-time equivalent state allotted/paidteachers, unrounded, (based on prior year sixth pay period) is entitledto twelve months of employment for a principal. Year-round schools,multi-track organizational patterns, and other sub-urbanization patternsdeveloped within the existing framework of an established campus arenot automatically entitled to additional months of employment.Implementation Timeline & Budget Needed:<strong>2007</strong>- <strong>08</strong> MOE Amount CodePrincipals - EastGarner ES, NorthForest Pines ES,Sanford Creek ES,East Cary Middle,Wendell Middle60.00 $ 382,09429,23027,28120,23560.00 $ 458,840 StateBase 01.6410.005.114.0109.0000SS 01.6910.005.211.0109.0000Ret 01.6910.005.221.0109.0000Hosp 01.6910.005.231.0109.00002009-10 MOE Amount CodePrincipals - BanksRoad Area ES,Southern <strong>Wake</strong>Area ES, RandleighArea ES, AmberlyPark Area ES,Heritage High60.00 $ 430,54232,93630,74122,30560.00 $ 516,524 State$ 155,38511,88711,0941,1600.00 $ 179,526 Local60.00 696,050Base 01.6410.005.114.0109.0000SS 01.6910.005.211.0109.0000Ret 01.6910.005.221.0109.0000Hosp 01.6910.005.231.0109.0000Supp 02.6410.005.181.0109.0000SS 02.6910.005.211.0109.0000Ret 02.6910.005.221.0109.0000Dental 02.6910.005.234.0109.0000$ 136,05210,4<strong>08</strong>9,7141,160Supp 02.6410.005.181.0109.0000SS 02.6910.005.211.0109.0000Ret 02.6910.005.221.0109.0000Dental 02.6910.005.234.0109.00000.00 $ 157,334 Local60.00 $ 616,17420<strong>08</strong>-09Principals -Leesville Area ES,Cary Park Area ES,Laurel Park AreaES36.00 $ 244,25018,68517,43912,74736.00 $ 293,121 StateBase 01.6410.005.114.0109.0000SS 01.6910.005.211.0109.0000Ret 01.6910.005.221.0109.0000Hosp 01.6910.005.231.0109.0000$ 81,8096,2595,841696Supp 02.6410.005.181.0109.0000SS 02.6910.005.211.0109.0000Ret 02.6910.005.221.0109.0000Dental 02.6910.005.234.0109.00000.00 $ 94,605 Local36.00 $ 387,726147 FY <strong>2007</strong>-<strong>08</strong> <strong>Plan</strong> for Student Success
Growth RequestsInitiative: Textbooks for Elementary, Middle, and High <strong>School</strong>sCurrent Funding Formula:The distribution of textbook funds to each school is based on the totalstudent count at each school. The allocation in 2006-07 is $65.43 perstudent.Implementation Timeline & Budget Needed:<strong>2007</strong>-<strong>08</strong>EstimatedStudentCountAmountCodeTextbooks - increaseof 8,014 students136,068 $ 524,356 02.5100.130.421.0277.0000Total: $ 524,35620<strong>08</strong>-09Textbooks - increaseof 7,949 students144,035 $ 520,103 02.5100.130.421.0277.0000Total: $ 520,1032009-10Textbooks - increaseof 8,171 students152,206 $ 534,629 02.5100.130.421.0277.0000Total: $ 534,629148
Growth RequestsInitiative: Sick Leave Substitute Pay for Noncategorical State and Local TeachersCurrent Funding Formula:Funds are budgeted centrally based on historical experience. Actualexpenditures are accounted for by school cost center.Implementation Timeline & Budget Needed:YearsActual Expenditures for Substitute Pay SickLeave for Funds 1 and 2 NoncategoricalTeachers (included matching Social Security)1999-00 $2,684,828IncreaseoverPreviousYear2000-01 2,943,576 10%2001-02 3,177,932 8%20<strong>08</strong>-09Sick leavesub pay2009-10Sick leavesub payProjectedExpendituresAmount$5,043,834 $ 347,06626,551Total: $ 373,617ProjectedExpendituresAmount$5,447,341 $ 374,83228,675CodeBase 02.5100.003.182.0276.0000SS 02.5910.003.211.0276.0000CodeBase 02.5100.003.182.0276.0000SS 02.5910.003.211.0276.0000Total: $ 403,507Note: This does not include substitute pay for staff development. It does not includesubstitute pay for teachers in categorical programs.2002-03 3,302,451 4%2003-04 3,518,577 7%2004-05 3,851,141 9%2005-06 4,003,958 10%Average increase of 8% over these yearsYearsProjected Expenditures for 2006-07 byapplying 8% increase to 2005-06 expendituresIncreaseoverPreviousYear2006-07 $4,324,275 8%Projected expenditures for <strong>2007</strong>-<strong>08</strong> through 2009-10 by applying eightpercent increase annually.<strong>2007</strong>-<strong>08</strong>ProjectedExpendituresAmountCodeSick leavesub pay$4,670,217 $ 321,35824,584Base 02.5100.003.182.0276.0000SS 02.5910.003.211.0276.0000Total: $ 345,942149 FY <strong>2007</strong>-<strong>08</strong> <strong>Plan</strong> for Student Success
Growth RequestsInitiative: Teacher Assistants as Substitutes (Regular Education)Current Funding Formula:This provision gives Principals the fl exibility to assign classroom teacherassistants as substitute teachers for teachers who are absent. When ateacher assistant assigned to a classroom acts as a substitute teacher inthat classroom during the ten-month employment period, he/she shall bepaid for that service the same as the daily salary of an entry-level teacherwith an A certifi cate for each day he/she serves as a substitute. TeacherAssistants as Substitutes are paid $132.60 per day.• While savings may be an incentive, instructional continuity inthe classroom should be the fi rst priority. Therefore, a teacherassistant may not be assigned to substitute for more than ten(10) consecutive workdays for one teacher without prior approvalfrom Human Resources. There will be no replacements forregular education or grant-funded teacher assistants who serveas substitute teachers.• Teacher assistants may not substitute in schools other than theschools to which they are assigned.• Use of funds to pay a teacher assistant as substitute teacherswill be monitored according to these guidelines.• Unauthorized use of a teacher assistant as substitute teacherswill result in charging schools’ Fund 6 accounts.• Clerical assistants, media assistants, and other offi ce personnelmay not be paid as substitute teachers.Implementation Timeline & Budget Needed:Expenditures are diffi cult to project. Increases each year are due toincreased numbers of teacher assistants due to increased studentmembership, increase in rate of pay per day, and the availability ofregular substitutes.The average increase of the historical years shown above is 18 percent.We have applied an 18 percent increase to the projected costs through2010.YearsProjected Expenditures for 2006-07 byapplying 18% increase to 2005-06 expendituresIncreaseoverPreviousYear2006-07 $4,324,275 18%Projected expenditures for <strong>2007</strong>-<strong>08</strong> through 2009-10 by applying eighteenpercent increase annually.<strong>2007</strong>-<strong>08</strong> Projection Amount CodeTAs as Subs $ 619,859 $ 82,6026,3195,63420<strong>08</strong>-09Total: $ 94,555TAs as Subs $ 731,434 $ 97,4717,4576,6472009-10Total: $ 111,575TAs as Subs $ 863,092 $ 115,0158,7997,844Base 01.5100.027.146.0276.0000SS 01.5910.027.211.0276.0000Ret 01.5910.027.221.0276.0000Base 01.5100.027.146.0276.0000SS 01.5910.027.211.0276.0000Ret 01.5910.027.221.0276.0000Base 01.5100.027.146.0276.0000SS 01.5910.027.211.0276.0000Ret 01.5910.027.221.0276.0000Historical Data - actualexpenditures at year endActualExpendituresPercent Increaseover Previous YearTotal: $ 131,6582005-06 $ 525,304 27%2004-05 412,950 17%2003-04 352,989 11%2002-03 317,667150
Growth RequestsInitiative: Contracted Services for <strong>School</strong>sCurrent Funding Formula:Local: $6.17 per 10th day student count.Implementation Timeline & Budget Needed:<strong>2007</strong>-<strong>08</strong>Increase inStudentsNewDollarsNeededCodeLocal K-12 8,014 $ 49,446 02.6410.061.311.0109.000020<strong>08</strong>-09Local K-12 7,949 $ 49,045 02.6410.061.311.0109.00002009-10Local K-12 8,171 $ 50,415 02.6410.061.311.0109.0000151 FY <strong>2007</strong>-<strong>08</strong> <strong>Plan</strong> for Student Success
Growth RequestsInitiative: Staff Development for Elementary, Middle, and High <strong>School</strong>sCurrent Funding Formula:The distribution of staff development funds to each school is based onthe total months of employment of all positions at each school. Theallocation in 2006-07 is $3.84 per month of employment (this equates to$38.40 per 10-month position and $46.<strong>08</strong> per 12-month position).Implementation Timeline & Budget Needed:<strong>2007</strong>-<strong>08</strong> Students Amount CodeStaff Development:East Garner ESNorth Forest Pines ESSanford Creek ESEast Cary MiddleWendell Middle8,014.00 $ 35,422 01.5930.028.312.0217.0000Total: 8,014.00 $ 35,42220<strong>08</strong>-09Staff Development:E17 Leesville AreaE22 Cary Park AreaE26 Laurel Park Area7,949.00 $ 35,135 01.5930.028.312.0217.0000Total: 7,949.00 $ 35,1352009-10Staff Development:E23 Banks Road AreaE27 Southern <strong>Wake</strong> AreaE28 Randleigh AreaE30 Amberly Park AreaHeritage High8,171.00 $ 36,116 01.5930.028.312.0217.0000Total: 8,171.00 $ 36,116152
Growth RequestsInitiative: Travel for Elementary, Middle, and High <strong>School</strong>sCurrent Funding Formula:Round trip mileage to Crossroads x 72 (36 weeks x 2) x .445 (mileagereimbursement rate) + 1,000 (200 days x 5 miles) x .445 (mileagereimbursement rate).Implementation Timeline & Budget Needed:<strong>2007</strong>-<strong>08</strong> Mileage Amount CodeTravel:East Garner ESNorth Forest Pines ESSanford Creek ESEast Cary MiddleWendell Middle214345657$ 1,1181,8231,8876372,27102.6410.061.332.0109.0000Total: 172 $ 7,73620<strong>08</strong>-09Travel:E17 Leesville AreaE22 Cary Park AreaE26 Laurel Park Area231114$1,18279789402.6410.061.332.0109.0000Total: 48 $ 2,8732009-10Travel:E23 Banks Road AreaE27 Southern <strong>Wake</strong> AreaE28 Randleigh AreaE30 Amberly Park AreaHeritage High2525252544$1,2461,2461,2461,2461,85502.6410.061.332.0109.0000Total: 144 $ 6,839153 FY <strong>2007</strong>-<strong>08</strong> <strong>Plan</strong> for Student Success
Growth RequestsInitiative: Instrument RepairCurrent Funding Formula:The instrument repair budget is designed to pay for the repair of schoolownedband instruments. Each middle school and high school willreceive $1,000.Implementation Timeline & Budget Needed:<strong>2007</strong>-<strong>08</strong> Amount CodeInstrument Repair - EastCary Middle and WendellMiddle$ 2,000 02.5100.061.311.0215.0000Total $2,00020<strong>08</strong>-09No Middle or High <strong>School</strong>sscheduled to open$ 0Total $ 02009-10Instrument Repair -Heritage High$ 1,000 02.5100.061.311.0215.0000Total $ 1,000154
Growth RequestsInitiative: Early hires, purchased services, and staff development dollars for new schoolsCurrent Funding Formula:During the spring prior to a new school opening, the following resources are allotted as startup months and dollars. These dollars carry over toSeptember 30 each year. Staff development funds carry over for three years.Elementary (YR) Middle HighYear State Local State Local State Local1 4 monthsprincipal1 month principal5 months clerical7 months teacherContract Dollars $3,000Purchased Services$18,750Staff Development$30,0004 monthsprincipal2 months principal6 months clerical10 months teacherContract Dollars $3,000Purchased Services$18,750 (Trad), $21,875(YR)Staff Development$30,0004 monthsprincipal2 months principal6 months clerical10 months teacherContract Dollars $3,000Purchased Services $23,438Staff Development $30,0002 Purchased Services$3,1253 Purchased Services$3,125Purchased Services -$7,031 (Trad), $10,938(YR)Purchased Services$3,125 (Trad), $10,938(YR)Purchased Services $11,719Purchased Services $11,719*Purchased services - $31.25 per pupil allocation155 FY <strong>2007</strong>-<strong>08</strong> <strong>Plan</strong> for Student Success
Growth Requests<strong>2007</strong>-<strong>08</strong> MOE Amount Code20<strong>08</strong>-09E17 Leesville Road AreaES (YR)E22 Cary Park ES (YR)E26 Laurel Park ES (YR)E17 Leesville Road AreaES (YR)E22 Cary Park ES (YR)E26 Laurel Park ES (YR)North Forest Pines ES(YR)East Garner ES (YR)Sanford Creek ES (YR)East Cary Middle (YR)Wendell MiddleBarwell Road ES (YR)Brier Creek ES (YR)Carpenter ES (YR)Holly Grove ES (YR)River Bend ES (YR)Holly Springs HighPanther Creek HighLess: one-time costsfrom previous year4.004.004.00$ 72,5165,5475,1784,04412.00 $ 87,285 State13.0013.0013.00$ 18,13016,32037,7855,5265,1586,06657075,16010,1436,5256,0907,07739965,25090,0003,1253,1253,12510,9387,0313,1253,1253,1253,1253,12511,71911,71939.00 $ 416,606($448,765)39.00 ($ 32,159) LocalBase 01.6410.005.114.0109.0000SS 01.6910.005.211.0109.0000Ret 01.6910.005.221.0109.0000Hosp 01.6910.005.231.0109.000002.6410.848.114.0254.000002.6410.848.181.0254.000002.6410.848.151.0254.000002.6910.848.211.0254.000002.6910.848.221.0254.000002.6910.848.231.0254.000002.6910.848.234.0254.000002.5100.848.121.0254.000002.5100.848.181.0254.000002.5910.848.211.0254.000002.5910.848.221.0254.000002.5910.848.231.0254.000002.5910.848.234.0254.000002.6410.848.311.0254.000002.5930.848.312.0217.000002.6410.848.311.0254.051402.6410.848.311.0254.034202.6410.848.311.0254.055402.6410.848.311.0254.040202.6410.848.311.0254.060102.6410.848.311.0254.032902.6410.848.311.0254.034202.6410.848.311.0254.035802.6410.848.311.0254.045702.6410.848.311.0254.030202.6410.848.311.0254.045502.6410.848.311.0254.0526E23 Banks Road ES(YR)E27 Southern Area ES(YR)E28 Randleigh Area ES(YR)E30 Amberly Park AreaES (YR)Heritage HighE23 Banks Road ES(YR)E27 Southern Area ES(YR)E28 Randleigh Area ES(YR)E30 Amberly Park AreaES (YR)Heritage HighNorth Forest Pines ES(YR)Brier Creek ESSanford Creek ES (YR)East Cary Middle (YR)Wendell MiddleLess: one-time costsfrom previous year4.004.004.004.004.00$130,0459,9509,2857,<strong>08</strong>020.00 $ 156,360 State13.0013.0013.0013.0018.00$39,52430,53267,13210,4939,79611,328988143,48819,38012,45911,62813,452722121,250150,0003,1253,1253,12510,9383,12570.00 $ 665,610($ 416,606)70.00 249,004 LocalTotal: 90.00 $ 405,364Base 01.6410.005.114.0109.0000SS 01.6910.005.211.0109.0000Ret 01.6910.005.221.0109.0000Hosp 01.6910.005.231.0109.000002.6410.848.114.0254.000002.6410.848.181.0254.000002.6410.848.151.0254.000002.6910.848.211.0254.000002.6910.848.221.0254.000002.6910.848.231.0254.000002.6910.848.234.0254.000002.5100.848.121.0254.000002.5100.848.181.0254.000002.5910.848.211.0254.000002.5910.848.221.0254.000002.5910.848.231.0254.000002.5910.848.234.0254.000002.6410.848.311.0254.000002.5930.848.312.0217.000002.6410.848.311.0254.051402.6410.848.311.0254.034202.6410.848.311.0254.055402.6410.848.311.0254.040202.6410.848.311.0254.0601Total: 51.00 ($ 55,126)156
Growth Requests2009-10 MOE Amount CodeE25 NE <strong>Wake</strong> Area ES(YR)E29 EWHS Site ES (YR)E31 Southern <strong>Wake</strong>Area ES (YR)M9 Southwest AreaMiddle (YR)M10 Cary Park AreaMiddle (YR)4.004.004.004.004.00$ 137,72810,5369,8347,440Base 01.6410.005.114.0109.0000SS 01.6910.005.211.0109.0000Ret 01.6910.005.221.0109.0000Hosp 01.6910.005.231.0109.000020.00 $ 165,538 StateE25 NE <strong>Wake</strong> Area ES(YR)E29 EWHS Site ES (YR)E31 Southern <strong>Wake</strong>Area ES (YR)M9 Southwest AreaMiddle (YR)M10 Cary Park AreaMiddle (YR)E23 Banks Road ES(YR)E27 Southern Area ES(YR)E28 Randleigh Area ES(YR)E30 Amberly Park AreaES (YRHeritage HighE17 Leesville Road AreaES (YR)E22 Cary Park ES (YR)E26 Laurel Park ES (YR)13.0013.0013.0018.0018.00$ 48,78233,57971,11811,74310,95612,6481,026162,56521,97614,11613,17815,252779148,594150,00002.6410.848.114.0254.000002.6410.848.181.0254.000002.6410.848.151.0254.000002.6910.848.211.0254.000002.6910.848.221.0254.000002.6910.848.231.0254.000002.6910.848.234.0254.000002.5100.848.121.0254.000002.5100.848.181.0254.000002.5910.848.211.0254.000002.5910.848.221.0254.000002.5910.848.231.0254.000002.5910.848.234.0254.000002.6410.848.311.0254.000002.5930.848.312.0217.000075.00 $ 716,312Leass: one-time costsfrom previous year($ 665,610)75.00 $50,702 LocalTotal: 95.00 $ 216,240157 FY <strong>2007</strong>-<strong>08</strong> <strong>Plan</strong> for Student Success
Growth RequestsInitiative: Eastern Area <strong>School</strong>sCurrent Funding Formula:Based on the Non-Personnel Budget report for Area Superintendents,provided by the budget department, the average funding per school in<strong>Wake</strong> <strong>County</strong> is $998. To align the per school average for the 27 schoolsthat will be in Eastern <strong>Wake</strong> in <strong>2007</strong> through 2010 to the current per schoolaverage for <strong>Wake</strong> <strong>County</strong>, the average amount of $998 was multipliedtimes 27 in order to determine the total budget amount the Eastern AreaSuperintendent would need to be allotted. The difference between thatcalculated total and the current budget total equals the amount that isbeing requested in this budget proposal, which is $12,847.Implementation Timeline and Budget Needed:The additional funding requested for <strong>2007</strong>-<strong>08</strong> (including projectionsfor 20<strong>08</strong>-09 and 2009-10) totals $12,847. The budget increase willaccommodate the addition of four new schools in Eastern <strong>Wake</strong><strong>County</strong> in <strong>2007</strong>-<strong>08</strong> and will more closely align the Eastern <strong>Wake</strong> perschool budget with the current <strong>Wake</strong> <strong>County</strong> per school budget for areasuperintendents.Budget 2006-07 <strong>2007</strong>- <strong>08</strong> 20<strong>08</strong>-09 2009-10Number of schools 23 27 27 27Contracted Services02.6330.801.311.0381.0906Workshop/Travel02.6930.801.312.0381.0906Telephone02.6330.801.341.0381.0906Reproduction Costs02.6330.801.362.0381.0906Supplies/Materials02.6330.801.412.0381.0906Membership Dues/Fees02.6330.801.611.0381.0906Workshop/Travel/Special Asst.02.5930.801.312.0381.<strong>08</strong>06$ 619 $ 1,258 $ 1,258 $ 1,2581,723 7,000 7,000 7,0001,000 1,000 1,000 1,0001,000 1,200 1,200 1,2002,769 7,000 7,000 7,000500 500 500 5001500 2000 2000 2000The following chart refl ects the requested funding increase for eachaccount code, to include the addition of one account code for the <strong>2007</strong>-<strong>08</strong>, 20<strong>08</strong>-09, and the 2009-10 fi scal years. The funding increase for<strong>2007</strong>-<strong>08</strong> is a recurring expense for 20<strong>08</strong>-09 and 2009-10.Travel/Special Asst.02.5890.801.332.0381.<strong>08</strong>06Telephone/Special Asst.02.5890.801.341.0381.<strong>08</strong>06Supplies/Materials/Special Asst.02.5890.801.412.0381.<strong>08</strong>063000 3,500 3,500 3,5000 1,000 1,000 1,0002000 2,500 2,500 2,500Total: $ 14,111 $ 26,958 $ 26,958 $ 26,958Per <strong>School</strong> Allotment $ 613 $ 998 $ 998 $ 998158
Growth RequestsIncrease Requested <strong>2007</strong>-<strong>08</strong> 20<strong>08</strong>-09 2009-10Contracted Services02.6330.801.311.0381.0906Workshop/Travel02.6930.801.312.0381.0906Reproduction Costs02.6330.801.362.0381.0906Supplies/Materials02.6330.801.412.0381.0906Workshop/Travel02.5930.801.312.0381.<strong>08</strong>06Travel02.5890.801.332.0381.<strong>08</strong>06Telephone02.5890.801.341.0381.<strong>08</strong>06Supplies/Materials02.5890.801.412.0381.<strong>08</strong>06$ 639 $ 0 $ 05,277 0 0200 0 04,231 0 0500 0 0500 0 01,000 0 0500 0 0Total: $ 12,847 $ 0 $ 0159 FY <strong>2007</strong>-<strong>08</strong> <strong>Plan</strong> for Student Success
Growth RequestsInitiative: South Central Area <strong>School</strong>sIncrease the budget managed by the area superintendent overseeingSouth Central <strong>Wake</strong> <strong>County</strong> schools in an effort to accommodateadditional schools. In an effort to accomodate additional schools, abudget increase is requested by the Area Superintendent overseeingSouth Central <strong>Wake</strong> <strong>County</strong> schools.Current Funding Formula:The current funding was based on twenty-two schools, but is usedfor twenty-fi ve schools. By dividing the current funding by twenty-fi veschools, the current funding is $194 less than the average per schoolin the area superintendents’ budgets. In an effort to cover twenty-sixschools in 20<strong>08</strong>-09 (E26), an increase in funding is needed. The currentallocations for supplies/materials, reproduction, food, travel, etc. do nottake into account additional expenses for additional schools added to thesouth central area.2006-07 non-personnel budget = $20,100Divided by 25 schoolsEquals $804 total per schoolImplementation Timeline & Budget Needed:Based on the Non-Personnel Budget report for Area Superintendents,the average funding per school is $998. An increase is requested forthe average amount per school to be added to the South Central Areabudget. Additional budget increases will cover expenses for materialsand supplies for (1) area meetings, (2) principals’ staff developmentactivities, and (3) the special assistant’s Nextel, staff developmentactivities, supplies/materials, and travel. The increases refl ect the 20<strong>08</strong>-09 projected opening of a new school, E26. The budget increases for20<strong>08</strong>-09 and 2009-10 are recurring expenses.The following Budget Projection Chart refl ects the requested budgetincreases for each account code. The total budgeted increase is strictlyrelated to growth and allows operations and support to continue at acomparable level.Budget 2006-07 <strong>2007</strong>- <strong>08</strong> 20<strong>08</strong>-09 2009-10Contracted Services02.6330.801.311.0383.0906Workshop/Travel02.5930.801.312.0383.<strong>08</strong>06Workshop/Travel02.6930.801.312.0383.0906Travel02.5890.801.332.0383.<strong>08</strong>06Travel02.6330.801.332.0383.0906Telephone02.5890.801.341.0383.<strong>08</strong>06Telephone02.6330.801.341.0383.0906Reproduction Costs02.6330.801.362.0383.0906Supplies/Materials02.5890.801.412.0383.<strong>08</strong>06Supplies/Materials02.6330.801.412.0383.0906Food02.6330.801.451.0383.0906Membership02.6330.801.611.0383.0906$ 0 $ 900 $ 900 $ 9001,500 1,500 1,500 1,5002,900 2,500 3,000 3,0003,000 3,500 3,700 3,7004,500 5,000 5,298 5,2980 800 800 800700 800 800 8001,000 1,000 1,000 1,0002,000 2,500 2,500 2,5004,000 4,500 4,500 4,5000 1,461 1,461 1,461500 500 500 500Total: $ 20,100 $ 24,961 $ 25,959 $ 25,959Per <strong>School</strong> Allotment $ 804 $ 998 $ 998 $ 998Total Funding IncreaseRequested$ 4,861 $ 998 $ 0160
Growth RequestsIncrease Requested <strong>2007</strong>- <strong>08</strong> 20<strong>08</strong>-09 2009-10Workshop/Travel02.6330.801.311.0383.0906Workshop/Travel02.6930.801.312.0383.0906Travel02.5890.801.332.0383.<strong>08</strong>06Travel02.6330.801.332.0383.0906Telephone02.5890.801.341.0383.<strong>08</strong>06Telephone02.6330.801.341.0383.0906Supplies/Materials02.5890.801.412.0383.<strong>08</strong>06Supplies/Materials02.6330.801.412.0383.0906Food02.6330.801.451.0383.0906$ 900 $ 0 $ 0(400) 500 0500 200 0500 298 <strong>08</strong>00 0 0100 0 0500 0 0500 0 01,461 0 0Total: $ 4,861 $ 998 $ 0161 FY <strong>2007</strong>-<strong>08</strong> <strong>Plan</strong> for Student Success
Growth RequestsInitiative: Southern Area <strong>School</strong>sTo increase the budget managed by the Southern Area Superintendentin an effort to accommodate anticipated growth with the opening of newschools.Current Funding Formula:The current budget was assessed to project the additional dollars neededto support the district growth of new schools scheduled to open. Inan effort to arrive at and apply a funding formula, each current dollaramount allotted to the different account codes was divided by the existingnumber of schools. A further analysis was conducted by the BudgetDepartment and an average amount per school was calculated to be$998 (excluding graduation funding and national award travel funding).The average of $998 is the amount that was used in the calculations andbudget planning process for this specifi c business case. Specifi cally, thisfi gure was multiplied by the number of existing schools and additionalnew schools projected to open in <strong>2007</strong>-<strong>08</strong>, 20<strong>08</strong>-09, and 2009-10, andthe projected increases were included in the appropriate budget codes.Budget 2006-07 <strong>2007</strong>- <strong>08</strong> 20<strong>08</strong>-09 2009-10Number of schools 26 27* 27 30**Contracted Services02.6330.801.311.0379.0906Workshop/Travel/Special Asst.02.5930.801.312.0379.<strong>08</strong>06Workshop Expenses02.6930.801.312.0379.0906Travel/Special Assistant02.5890.801.332. 0379.<strong>08</strong>06Travel02.6330.801.332. 0379.0906Telephone/Special Assistant02.5890.801.341.0379.<strong>08</strong>06Telephone02.6330.801.341. 0379.0906$ 1,291 $ 1,500 $ 1,500 $ 1,7001,500 1,500 1,500 1,6501,453 7,939 7,939 9,1993,000 3,000 3,000 3,1961,067 1,067 1,067 1,0670 700 700 7001,300 1,500 1,500 1,500An increase of $2,000 is being requested for the account Workshop Expenses.With the addition of new schools and the growing number ofnewly appointed principals, the projected increase is allocated to supportthe work sessions and leadership development being conducted forprincipals. The allocated amount is based upon historical costs relatedto materials, resources, and training.Reproduction Costs02.6330.801.362. 0379.0906Supplies/Materials/SpecialAsst.02.5890.801.412. 0379.<strong>08</strong>06Supplies/Materials02.6330.801.412. 0379.0906507 1,000 1,000 1,1902,000 2,000 2,000 2,5004,576 8,300 8,300 8,799The only account in the current budget that is not included in the calculationsis Travel, <strong>School</strong> Awards, and Competitions. The following chartrefl ects the breakdown of increase per account code.Membership Dues & Fees02.6330.801.611. 0379.0906452 452 452 452Total: $ 17,146 $ 28,958 $ 28,958 $ 31,953Per <strong>School</strong> Allotment $ 659 $ 998 $ 998 $ 998Total Funding IncreaseRequested$ 11,812 $ 0 $ 2,995162* Adjustment based on average budget breakdown per school inWCPSS and opening of East Garner Elementary <strong>School</strong>.**Adjustment based on average budget breakdown per school inWCPSS and opening of E23 Banks Elementary <strong>School</strong>, E27 Elementary<strong>School</strong> (Southern area), and E28 Elementary <strong>School</strong>(Randleigh area).
Growth RequestsIncrease Requested <strong>2007</strong>- <strong>08</strong> 20<strong>08</strong>-09 2009-10Contracted Services02.6330.801.311.0379.0906Workshop Expenses02.5930.801.312.0379.<strong>08</strong>06Workshop Expenses02.6930.801.312.0379.0906Travel02.5890.801.332.0379.<strong>08</strong>06Telephone02.5890.801.341.0379.<strong>08</strong>06Telephone02.6330.801.341.0379.0906Reproduction Costs02.6330.801.362.0379.0906Supplies/Materials02.5890.801.412.0379.<strong>08</strong>06Supplies/Materials02.6330.801.412.0379.0906$ 209 $ 0 $ 2000 0 1506,486 0 1,2600 0 196700 0 0200 0 0493 0 1900 0 5003,724 0 499Total: $ 11,812 $ 0 $ 2,995Implementation Timeline and Budget Needed:The budget increase accommodates the addition of East GarnerElementary <strong>School</strong> during the fi scal year of <strong>2007</strong>-<strong>08</strong> and the alignmentof the budget to refl ect the per-school average calculated by the BudgetDepartment. The budget amounts projected for the 2009-10 fi scal yearaccommodate the opening of Banks Road Elementary <strong>School</strong> (E23), anelementary school (E27) in the Southern area of the school district, andan elementary school (E28) in the Randleigh area.The total budgeted increase is strictly related to growth and allows operationsand support to continue at a comparable level. The increaseto the account code of workshop expenses addresses growth of newschools and new principals. In addition, this budget increase is necessaryto support the continuation of strategic work sessions designed tofacilitate leadership development for principals and focus and align theirwork to the Superintendent’s strategic directives.163 FY <strong>2007</strong>-<strong>08</strong> <strong>Plan</strong> for Student Success
Growth RequestsInitiative: Western Area <strong>School</strong>sCurrent Funding Formula:The current budget was assessed to project the additional dollars neededto support the district growth of new schools scheduled to open. In aneffort to arrive at and apply a funding formula, each current dollar amountallotted to the different account codes was divided by the existing numberof schools. A further analysis was conducted by the Finance/BudgetOffi ce and an average amount per school was calculated to be $998 (excludinggraduation funding and national award travel funding). The averageof $998 is the amount that was used in the calculations and budgetplanning process for this specifi c business case. Specifi cally, this fi gurewas multiplied by the number of additional schools projected for fi scalyears <strong>2007</strong>-<strong>08</strong>, 20<strong>08</strong>-09 and 2009-10, with projected increases includedin the appropriate budget codes.Implementation Timeline and Budget Needed:The additional dollars requested and added to the budget for <strong>2007</strong>-<strong>08</strong>total $1,960 to accommodate the addition of East Cary MS and alignthe overall Western Area budget with the per-area, per-school average.Budget increases for 20<strong>08</strong>-09 accommodate the addition of E17 andE22 elementary schools, $1,997. No new schools are added to the WesternArea for 2009-10. Hence, the anticipated budget projection, at thistime, is the same as for 20<strong>08</strong>-09.The following Budget Projection Chart refl ects the requested budgetamounts for each account code. This budget increase is necessary tosupport the continuation of strategic work sessions designed to facilitateleadership development for principals and focus and align their work tothe Superintendent’s strategic directives.Budget 2006-07 <strong>2007</strong>- <strong>08</strong> 20<strong>08</strong>-09 2009-10Number of <strong>School</strong>s 25 26 28 28Projected New <strong>School</strong>sEast CaryMSE17 & E22Budget 2006-07 <strong>2007</strong>- <strong>08</strong> 20<strong>08</strong>-09 2009-10Workshop Expenses02.5930.801.312.0380.<strong>08</strong>06500 1,500 1,500 1,500Travel02.6330.801.332.0380.09065,100 5,575 6,025 6,025Travel02.5890.801.332.0380.<strong>08</strong>06500 3,000 3,100 3,100Telephone02.6330.801.341.0380.0906680 900 900 900Telephone02.5890.801.341.0380.<strong>08</strong>06500 385 385 385Reproduction Costs02.6330.801.362.0380.0906800 800 800 800Reproduction Costs (<strong>School</strong>s)02.5890.801.362.0380.<strong>08</strong>061,500 1,700 1,700 1,700Supplies/Materials02.6330.801.412.0380.09065,746 4,000 4,050 4,050Supplies/Materials02.5890.801.412.0380.<strong>08</strong>063,500 2,000 2,000 2,000Membership Dues02.6330.801.611.0380.0906350 600 600 600Food02.6330.801.451.0380.0906450 500 500 500Workshop Participant02.6930.801.186.0380.0906239 0 0 0Workshop Participant02.6910.801.211.0380.090618 0 0 0Workshop Participant02.6910.801.221.0380.090617 0 0 0Total: $ 24,000 $ 25,960 $ 27,957 $ 27,957Per <strong>School</strong> Allotment $ 960 $ 998 $ 998 $ 998Contracted Services02.6330.801.311.0380.0906$ 700 $ 1,000 $ 1,197 $ 1,197Total Funding IncreaseRequested$ 1,960 $ 1,997 $ 0Workshop Expenses02.6930.801.312.0380.0906$ 3,400 4,000 5,200 5,200164
Growth RequestsIncrease Requested <strong>2007</strong>- <strong>08</strong> 20<strong>08</strong>-09 2009-10Contracted Services02.6330.801.311.0380.0906Workshop Expenses02.6930.801.312.0380.0906Travel02.6330.801.332.0380.0906Travel02.5890.801.332.0380.<strong>08</strong>06Telephone02.6330.801.341.0380.0906Telephone02.5890.801.341.0380.<strong>08</strong>06Supplies/Materials02.6330.801.412.0380.0906Food02.6330.801.451.0380.0906Workshop Expenses02.5930.801.312.0380.<strong>08</strong>06Reproduction Costs02.5890.801.362.0380.<strong>08</strong>06Supplies/Materials02.5890.801.412.0380.<strong>08</strong>06Membership Dues/Fees02.6330.801.611.0380.0906Workshop Participant02.6330.801.186.0300.0906Workshop Participant02.6910.801.211.0300.0906Workshop Participant02.6910.801.221.0380.0906$ 300 $ 197 $ 0600 1,200 0475 450 02,500 100 0220 0 0(115) 0 0(1,746) 50 050 0 01,000 0 0200 0 0(1,500) 0 0250 0 0(239) 0 0(18) 0 0(17) 0 0Total $ 1,960 $ 1,997 $ 0165 FY <strong>2007</strong>-<strong>08</strong> <strong>Plan</strong> for Student Success
Growth RequestsInitiative: Ninth Grade CentersTo allot the principals of high schools who have off-campus 9th gradecenters additional Months of Employment (MOE) for select personnel toprovide adequate support to the students and staff assigned to the 9thgrade centers.Current Funding Formula:Any high school that establishes a 9th grade center located off site fromthe main campus will need the following additional MOE to adequatelysupport the students and staff for the duration of the centers’ existence.• 12 MOE assistant principal• 10 MOE clerical assistant• 12 MOE guidance counselor• 5 MOE media specialist*Cary High <strong>School</strong> established an off-campus 9th grade center previously,so a growth case was prepared for their additional MOE prior to theopening of that center. Cary High <strong>School</strong>’s off-campus 9th grade centerwill cease to exist after the <strong>2007</strong>-<strong>08</strong> school year, therefore the additionalMOE will need to be deleted from the budget/allotment, as indicatedbelow.In <strong>2007</strong>-<strong>08</strong> <strong>Wake</strong> Forest-Rolesville High <strong>School</strong> and <strong>Wake</strong>fi eld High<strong>School</strong> will both establish separate off-campus 9th grade centers andwill need the additional MOE as listed.*The 5 MOE for media specialist was previously included in a growth casesubmitted by the Curriculum and Instruction Department and, therefore,does not appear in this growth case.<strong>2007</strong>-<strong>08</strong> MOE Amount CodeClerical Assistant• <strong>Wake</strong> Forest -RolesvilleHigh <strong>School</strong>• <strong>Wake</strong>fi eld High <strong>School</strong>Guidance Counselor• <strong>Wake</strong> Forest -RolesvilleHigh <strong>School</strong>• <strong>Wake</strong>fi eld High <strong>School</strong>20<strong>08</strong>-09Assistant Principal• Cary High <strong>School</strong>Clerical Assistant• Cary High <strong>School</strong>20.00 $ 36,8402,8182,63<strong>08</strong>,094464Subtotal: 20.00 $ 50,84624.00 $ 75,43211,1126,6206,1798,094464Subtotal: 24.00 $ 107,901Total: 68.00 $, 330,233(12.00) ($ 58,368)(12,600)(5,429)(5,067)(4,249)(232)Subtotal: (12.00) ($ 85,945)(10.00) ($ 18,420)(1,409)(1,315)(4,249)(232)Base 02.6410.003.151.0109.0000SS 02.6910.003.211.0109.0000Ret 02.6910.003.221.0109.0000Hosp 02.6910.003.231.0109.0000Dental 02.6910.003.231.0109.0000Base 02.5830.007.121.0146.0000Supp 02.5830.007.181.0146.0000SS 02.5910.007.211.0146.0000Ret 02.5910.007.221.0146.0000Hosp 02.5910.007.231.0146.0000Dental 02.5910.007.234.0146.0000Base 02.6410.005.116.0109.0000Supp 02.6910.005.181.0109.0000SS 02.6910.005.211.0109.0000Ret 02.6910.005.221.0109.0000Hosp 02.6910.005.231.0109.0000Dental 02.6910.005.234.0109.0000Base 02.6410.003.151.0109.0000SS 02.6910.003.211.0109.0000Ret 02.6910.003.221.0109.0000Hosp 02.6910.003.231.0109.0000Dental 02.6910.003.231.0109.0000Implementation Timeline & Budget Needed:<strong>2007</strong>-<strong>08</strong> MOE Amount CodeAssistant Principal• <strong>Wake</strong> Forest -RolesvilleHigh <strong>School</strong>• <strong>Wake</strong>fi eld High <strong>School</strong>24.00 $ 116,73625,20010,85810,1348,094464Subtotal: 24.00 $ 171,486Base 02.6410.005.116.0109.0000Supp 02.6910.005.181.0109.0000SS 02.6910.005.211.0109.0000Ret 02.6910.005.221.0109.0000Hosp 02.6910.005.231.0109.0000Dental 02.6910.005.234.0109.0000Guidance Counselor• Cary High <strong>School</strong>Subtotal: (10.00) ($ 25,625)(12.00) ($ 37,716)(5,556)(3,310)(3,090)(4,249)(232)Subtotal: (12.00) ($ 54,153)Total: (34.00) ($165,723)Base 02.5830.007.121.0146.0000Supp 02.5830.007.181.0146.0000SS 02.5910.007.211.0146.0000Ret 02.5910.007.221.0146.0000Hosp 02.5910.007.231.0146.0000Dental 02.5910.007.234.0146.0000166
Growth RequestsInitiative: Graduation and rehearsal facilities for the high schools in the school districtCurrent Funding Formula:Currently the school system rents the facilities for rehearsals andgraduations for each high school in the district, except Longview High<strong>School</strong>, which has its graduation on the Longview campus. Since thenew Civic Center will not be available until the summer of 20<strong>08</strong>, differentlocations must be secured for graduation 20<strong>08</strong>. <strong>Plan</strong>s are being made toreturn to the new Civic Center for the 2009 graduation. The exact rentalcosts are not known at this time. Adjustments will be made for the 20<strong>08</strong>and 2009 graduation costs estimates when exact costs are available.Implementation Timeline & Budget Needed:Since graduation is held in June, the invoice is usually not received orpaid until after July 1. Therefore, graduation <strong>2007</strong> will be paid from the<strong>2007</strong>-<strong>08</strong> budget, and graduations 20<strong>08</strong> and 2009 will be paid from the20<strong>08</strong>-09 and 2009-10 budget respectively. A 10 percent increase isprojected each year for the cost of graduation <strong>2007</strong> and 20<strong>08</strong> with a 20percent increase projected for graduation 2009, which will be the yearthe new Civic Center will be used. Therefore, the projected increase willbe $7,129, $7,842, and $17,253, respectively, for the next three years.YearPercentIncreaseAmountCode<strong>2007</strong>-<strong>08</strong> 10% $ 7,129 02.6330.801.311.0378.<strong>08</strong>0620<strong>08</strong>-09 10% $ 7,842 02.6330.801.311.0378.<strong>08</strong>062009-10 20% $ 17,253 02.6330.801.311.0378.<strong>08</strong>06167 FY <strong>2007</strong>-<strong>08</strong> <strong>Plan</strong> for Student Success
Growth RequestsInitiative: Student Due Process (SDP) and PolicyThe Offi ce of Student Due Process & Policy is responsible for:Development/reproduction of the Student/Parent Handbook in Englishand SpanishDevelopment/reproduction of Due Process Procedures Manual forlong-term suspended studentsMonitoring all suspensions and creating yearly reports submitted tothe North Carolina Department of <strong>Public</strong> Instruction (NCDPI)Monitoring/assisting with development of Board PolicyProviding translation services in appeal hearing when English is notthe fi rst languageProviding training for administrators regarding due process, proceduresand policyCurrent Funding Formula:The current budget is $75,279. Based on the projected student growthadditional funds are required to meet the listed initiatives. Most of theinitiatives are required by General Statues.Formula for Increased cost for Student/Parent Handbook:Stone Printing & Graphics, LLC has obtained the bid for printing the Student/ParentHandbook for 2005-06 and 2006-07.While the printing/binding costs for future years are very diffi cult to predictand considering Stone is at the mercy of the paper mills who supplythe paper, they advised that about an 8% increase for 20<strong>08</strong>-09 and2009-10 should be enough to adjust for the cost of printing/binding.Year Rounded 20day numbersEstimated numberof schoolsEstimated numberof HandbooksEstimated CostPrinting/Binding2006-07 129,000 147 150,000 38,000<strong>2007</strong>-<strong>08</strong> 138,000 154 170,000 45,00020<strong>08</strong>-09 148,000 156 185,000 48,6002009-10 160,000 160 200,000 52,488Note: Student/Parent Handbooks are printed each spring for the following school year.(i.e. the handbooks for 2006-07 were paid for out of 2005-06 funds). Therefore, the fundsrequested for <strong>2007</strong>-<strong>08</strong>, $48,600.00 refl ects the cost of handbooks to be printed for the20<strong>08</strong>-09 school year.Formula for Increase for Contracted Services:The only predictable cost that our offi ce has incurred is $1,042.80/yearfor the service/maintenance contract for the copier we share with Accounting.Developing a formula for contracted services is diffi cult. Our offi ce isrequired by General Statues to provide translation services for studentssuspended when English is not the home language. It is impossibleto predict the number of non-English speaking families that will be facinga student suspended from school. The offi ce is also responsiblefor providing appeal hearing transcripts, processed by a court reportingcompany, at the request of the student attorney or school attorney.Also, there is no way to predict the dollars needed for this cost. Finally,we currently pay for the printing of SDP: Procedures ‘Redbooks’through contracted services. The cost for the 2006-07 school year was$4,357.04. Additional ‘redbooks’ must be printed to correspond with thenumber of new administrators in each of the new schools opening for the20<strong>08</strong>-09 school year and the number of students that will be suspendedfrom those schools for the 20<strong>08</strong>-09 school year. As with Student/Parenthandbooks these are printed in the spring for the new school year.Note: As of January, <strong>2007</strong>, $4,500 is earmarked for printing of <strong>2007</strong>-<strong>08</strong> ‘redbooks’. Withall other costs deducted, we have a current balance of $1,297.20. Additional hearings arealready scheduled that require translation services. There is also a pending charge fortranslation services for policy revisions that are required for inclusion in the English/Spanish:<strong>2007</strong>-<strong>08</strong> Student/Parent Handbook. These services normally run around $3,500.Formula for Increase for Supplies:Replacement of three main computer hard drivesCurrent hard drives are 3+ years old and do not have the memory orspeed to cope with the expected growth.Keith Cooper assisted in advising the type of hard drive to meet thedemands:1 G of memory80 G hard drive vs. 60G hard driveDual core processor (makes computer extremely fast)Internal CD burner.168
Growth RequestsKeep same monitors only order the CPUEstimate of $800 per hard drive, taxes included = $2,400Implementation Timeline & Budget Needed:<strong>2007</strong>-<strong>08</strong> Amount CodeReproduction: WithStudent/Parent HandbookSupplies: replace three maincomputer hard drivesContracted Services: increasedcost for translation and transcriptionservice$ 8,6002,4001,50002.6330.801.362.0218.0906.00002.6330.801.412.0218.0906.00002.6330.801.311.0218.0906.000Total: $ 12,50020<strong>08</strong>-09Reproduction: WithoutStudent/Parent Handbook$ 500 02.6330.801.362.0218.0906.000Reproduction: WithStudent/Parent HandbookSupplies: replace two laptopsTravelContracted ServicesLess: one time cost from previousyear$ 3,8882,4002001,000(2,400)02.6330.801.362.0218.0906.00002.6330.801.412.0218.0906.00002.6330.801.332.0218.0906.00002.6330.801.311.0218.0906.000Total: $ 5,5882009-10Reproduction: WithoutStudent/Parent Handbook$ 500 02.6330.801.362.0218.0906.000Reproduction: WithStudent/Parent HandbookSuppliesTravelContracted ServicesLess: one time cost from previousyear$ 5,000300200500(2,400)02.6330.801.362.0218.0906.00002.6330.801.412.0218.0906.00002.6330.801.332.0218.0906.00002.6330.801.311.0218.0906.000Total: $ 4,100169 FY <strong>2007</strong>-<strong>08</strong> <strong>Plan</strong> for Student Success
Growth RequestsInitiative: Career-Technical Education (CTE) Months of Employment (MOE)Current Funding Formula:Determined by the state - based on ADM at grades 8-12. The <strong>Wake</strong><strong>County</strong> <strong>Public</strong> <strong>School</strong> <strong>System</strong> (WCPSS) formula for allocation to schoolsis based on the total school enrollment with consideration of the numberof students enrolled in CTE courses.Implementation Timeline & Budget Needed:<strong>2007</strong>-<strong>08</strong> MOE Amount CodeBase positions fromState 2006-07:5,105.00East Cary MSWendell MSGrowth at existingschoolsMonths to be paidfrom lapsed salaries20<strong>08</strong>-09Base positions fromState <strong>2007</strong>-<strong>08</strong>:5,335.0060.0060.00140.00(30.00)$ 1,059,38<strong>08</strong>1,04375,64093,<strong>08</strong>1230.00 $ 1,309,144 State$ 137,71910,5369,8335,3360.00 $ 163,424 LocalTotal: 230.00 $ 1,472,568Base 01.5100.013.121.0180.0000SS 01.5910.013.211.0180.0000Ret 01.5910.013.221.0180.0000Hosp 01.5910.013.231.0180.0000Supp 02.5100.013.181.0180.0000SS 02.5910.013.211.0180.0000Ret 02.5910.013.221.0180.0000Dental 02.5910.013.234.0180.0000Anticipated additionalMOE from state basedon WCPSS growthAdditional monthsneeded due to largegrowth increase insixth grade250.00 $ 1,151,50<strong>08</strong>8,09<strong>08</strong>2,217106,225250.00 $ 1,428,032 State$ 149,69511,45210,6885,8000.00 $ 177,635 LocalTotal: 250.00 $ 1,605,667Base 01.5100.013.121.0180.0000SS 01.5910.013.211.0180.0000Ret 01.5910.013.221.0180.0000Hosp 01.5910.013.231.0180.0000Supp 02.5100.013.181.0180.0000SS 02.5910.013.211.0180.0000Ret 02.5910.013.221.0180.0000Dental 02.5910.013.234.0180.00002009-10 MOE Amount CodeBase positions fromState 20<strong>08</strong>-09:5,585.00Anticipated additionalMOE from state basedon WCPSS growthHeritage High schoolgrowth 80.00CTE Programs 200.00Months to be paidfrom lapsed salaries(10.00)270.00 $ 1,243,62095,13788,794120,447270.00 $ 1,547,998 State$ 161,67112,36811,5436,2640.00 $ 191,846 LocalTotal: 270.00 $ 1,739,844Base 01.5100.013.121.0180.0000SS 01.5910.013.211.0180.0000Ret 01.5910.013.221.0180.0000Hosp 01.5910.013.231.0180.0000Supp 02.5100.013.181.0180.0000SS 02.5910.013.211.0180.0000Ret 02.5910.013.221.0180.0000Dental 02.5910.013.234.0180.0000170
Growth RequestsInitiative: K-5 Curriculum and Instruction Months of Employment (MOE)Current Funding Formula:Current ratio of 1:13.75Implementation Timeline & Budget Needed:<strong>2007</strong>- <strong>08</strong> MOE Amount CodeK-5Projected enrollment67,094 divided by13.75 = 4,880.00Less: 06-07 months4588.00292.006-12 allocation is notformula driven butdetermined by electiveneeds 2006-07 CurrentMOE 798292.00 $ 857,604113,63574,30069,347118,1726,774Base 02.5100.001.121.0155.0000Supp 02.5100.001.181.0155.0000SS 02.5910.001.211.0155.0000Ret 02.5910.001.221.0155.0000Hosp 02.5910.001.231.0155.0000Dental 02.5910.001.234.0155.00002009-10 MOE Amount CodeK-54,041 additionalstudents @1:13.75=294265.00 $ 778,30559,54055,571118,217Subtotal: 265.00 $ 1,011,633 State29.00 $ 85,173114,41315,26814,25012,9376,821Subtotal: 29.00 $ 248,862 LocalTotal 294.00 $1,260,495Base 01.5100.001.121.0155.0000SS 01.5910.001.211.0155.0000Ret 01.5910.001.221.0155.0000Hosp 01.5910.001.231.0155.0000Base 02.5100.001.121.0155.0000Supp 02.5100.001.181.0155.0000SS 02.5910.001.211.0155.0000Ret 02.5910.001.221.0155.0000Hosp 02.5910.001.231.0155.0000Dental 02.5910.001.234.0155.000020<strong>08</strong>-09Subtotal: 292.00 $1,239,832 LocalTotal 292.00 $1,239,832K-54,158 additionalstudents @1:13.75=302No New Secondary<strong>School</strong>s270.00 $ 792,99060,66456,619114,723Base 01.5100.001.121.0155.0000SS 01.5910.001.211.0155.0000Ret 01.5910.001.221.0155.0000Hosp 01.5910.001.231.0155.0000Subtotal: 270.00 $1,024,996 State32.00 $ 93,984117,52616,18015,10213,5977,006Base 02.5100.001.121.0155.0000Supp 02.5100.001.181.0155.0000SS 02.5910.001.211.0155.0000Ret 02.5910.001.221.0155.0000Hosp 02.5910.001.231.0155.0000Dental 02.5910.001.234.0155.0000Subtotal: 32.00 $ 263,395 LocalTotal 302.00 $1,288,391171 FY <strong>2007</strong>-<strong>08</strong> <strong>Plan</strong> for Student Success
Growth RequestsInitiative: Academically Gifted (AG) Teacher Months for new schools and increased Months of Employment (MOE) at existing schoolsCurrent Funding Formula:• State Formula: $1,012.60 per child for 4% of ADM• WCPSS Formula: Complete annual student identifi cation. MOE aredetermined and distributed according to the number of identifi ed AGstudents in a school.2009-10 MOE Amount CodeAdditional MOE 88.00 $ 258,45619,77218,45439,257Base 01.5200.034.121.0143.0000SS 01.5910.034.211.0143.0000Ret 01.5910.034.221.0143.0000Hosp 01.5910.034.231.0143.0000Implementation Timeline & Budget Needed:<strong>2007</strong>- <strong>08</strong> MOE Amount CodeAdditional MOE 86.00 $ 252,58219,32318,03434,804Base 01.5200.034.121.0143.0000SS 01.5910.034.211.0143.0000Ret 01.5910.034.221.0143.0000Hosp 01.5910.034.231.0143.0000Subtotal: 88.00 $ 335,939 State0.00 $34,2452,6202,4452,042Subtotal: 0.00 $ 41,352 LocalTotal 88.00 $377,291Base 02.5100.034.181.0143.0000SS 02.5910.034.211.0143.0000Ret 02.5910.034.221.0143.0000Dental 02.5910.034.234.0143.0000Subtotal: 86.00 $ 324,743 State$ 33,4682,5602,3901,995Base 02.5200.034.181.0143.0000SS 02.5910.034.211.0143.0000Ret 02.5910.034.221.0143.0000Dental 02.5910.034.234.0143.000020<strong>08</strong>-09Subtotal: 0.00 $ 40,413 LocalTotal 86.00 $ 365,156Additional MOE 85.00 $ 249,64519,09817,82536,117Base 01.5200.034.121.0143.0000SS 01.5910.034.211.0143.0000Ret 01.5910.034.221.0143.0000Hosp 01.5910.034.231.0143.0000Subtotal: 85.00 $322,685 State$ 33,9492,5972,424972Base 02.5100.034.181.0143.0000SS 02.5910.034.211.0143.0000Ret 02.5910.034.221.0143.0000Dental 02.5910.034.234.0143.0000Subtotal: 0.00 $ 39,942 LocalTotal 85.00 $ 362,627172
Growth RequestsInitiative: Media SpecialistsCurrent Funding Formula:150-824: 10 MOE (12 MOE YR) 825-999: 15 MOE1000 -1499: 20 MOE 1500-1999: 25 MOE2000-2499: 30 MOE Over 2500: 35 MOEImplementation Timeline & Budget Needed:<strong>2007</strong>- <strong>08</strong> MOE Amount CodeSanford Creek ES 12.00N. Forest Pines ES 12.00E. Garner ES 12.00E. Cary MS12.00Wendell MS10.00<strong>Wake</strong>fi eld 9 th5.00<strong>Wake</strong> Forest 9 th 5.00$ 199,71615,27814,26027,52068.00 $ 256,774 StateBase 01.5100.007.121.0170.0000SS 01.5910.007.211.0170.0000Ret 01.5910.007.221.0170.0000Hosp 01.5910.007.231.0170.00002009-10 MOE Amount Code4 Year-Round ES1 HS48.0020.00$ 199,71615,27814,26030,33568.00 $ 259,589 State$ 26,4632,0241,8891,5780.00 $ 31,954 LocalTotal: 68.00 $ 291,543Base 01.5100.007.121.0170.0000SS 01.5910.007.211.0170.0000Ret 01.5910.007.221.0170.0000Hosp 01.5910.007.231.0170.0000Supp 02.5100.007.181.0170.0000SS 02.5910.007.211.0170.0000Ret 02.5910.007.221.0170.0000Dental 02.5910.007.234.0170.0000$ 26,4632,0241,8891,578Supp 02.5100.007.181.0170.0000SS 02.5910.007.211.0170.0000Ret 02.5910.007.221.0170.0000Dental 02.5910.007.234.0170.00000.00 $ 31,954 Local68.00 $ 288,72820<strong>08</strong>-093 Year-Round ES36.00 $ 105,7328,<strong>08</strong>87,54915,296Base 01.5100.007.121.0170.0000SS 01.5910.007.211.0170.0000Ret 01.5910.007.221.0170.0000Hosp 01.5910.007.231.0170.000036.00 $ 136,665 State$ 14,0101,0721,00<strong>08</strong>35Supp 02.5100.007.181.0170.0000SS 02.5910.007.211.0170.0000Ret 02.5910.007.221.0170.0000Dental 02.5910.007.234.0170.00000.00 $ 16,917 LocalTotal:36.00 $ 153,582173 FY <strong>2007</strong>-<strong>08</strong> <strong>Plan</strong> for Student Success
Growth RequestsInitiative: English as a Second Language (ESL) Teacher Months of Employment (MOE)• Serve all elementary Limited English Profi ciency (LEP)/ESL studentsin base• New middle and high schools begin as ESL sites20<strong>08</strong>-09 MOE Amount CodeBase positions<strong>2007</strong>-<strong>08</strong>: 1,771Current Funding Formula:Annual review of identifi ed ESL students occurs. Examination of<strong>Wake</strong> <strong>County</strong> <strong>Public</strong> <strong>School</strong> <strong>System</strong> (WCPSS) locator to identify ESLdesignated school. Recommendation of additional ESL designatedschools.Teacher: student ratio at ESL designated schools determined bydividing projected ESL funding by number of ESL students on locator.(Average ESL teacher to student ratio 1:47)IncreasedESL studentpopulation:3202006-07 ESLStudent Population:6,390x5% increasedue to growth=6,71070.00 $ 205,59015,72814,67929,74370.00 $ 265,740 State$ 27,2412,<strong>08</strong>41,9451,624Base 01.5100.054.121.0132.0000SS 01.5910.054.211.0132.0000Ret 01.5910.054.231.0132.0000Hosp 01.5910.054.231.0132.0000Supp 02.5100.054.181.0132.0000SS 02.5910.054.211.0132.0000Ret 02.5910.054.231.0132.0000Dental 02.5910.054.234.0132.0000Implementation Timeline & Budget Needed:<strong>2007</strong>-<strong>08</strong> MOE Amount CodeBase positions2006-07: 1,706IncreasedESL studentpopulation:3032006-07 ESLStudent Population:6,<strong>08</strong>7x5% increasedue to growth=6,39065.00 $ 190,90414,60413,63126,30665.00 $ 245,445 State$ 25,2961,9351,8061,5<strong>08</strong>0.00 $ 30,545 LocalTotal 65.00 $ 275,990Base 01.5100.054.121.0132.0000SS 01.5910.054.211.0132.0000Ret 01.5910.054.221.0132.0000Hosp 01.5910.054.231.0132.0000Supp 02.5100.054.181.0132.0000SS 02.5910.054.211.0132.0000Ret 02.5910.054.221.0132.0000Dental 02.5910.054.234.0132.00002009-10Base positions20<strong>08</strong>-09: 1,841IncreasedESL studentpopulation:3362006-07 ESLStudent Population:6,710x5% increasedue to growth=7,0460.00 $ 32,894 LocalTotal 70.00 $ 298,63472.00 $ 211,39416,17215,09432,19972.00 $ 274,859 State$ 28,0202,1432,0011,6700.00 $ 33,834 LocalTotal 72.00 $ 3<strong>08</strong>,693Base 01.5100.054.121.0132.0000SS 01.5910.054.211.0132.0000Ret 01.5910.054.231.0132.0000Hosp 01.5910.054.231.0132.0000Supp 02.5100.054.181.0132.0000SS 02.5910.054.211.0132.0000Ret 02.5910.054.231.0132.0000Dental 02.5910.054.234.0132.0000174
Growth RequestsInitiative: Advancement Via Individual Determination (AVID)Current Funding Formula:AVID is a research-based college-preparatory program which successfullyserves students “in the middle” – underrepresented students such asfi rst generation college goers, students from low Socio-Economic Status(SES) families, Limited English Profi ciency (LEP) students, and studentswho are not achieving their academic potential. AVID will prepare moreof our students for success in Advanced Placement (AP) and honorslevel courses, completion of Algebra I by grade eight, and will create aclimate of rigor for all students in our middle schools and with subsequentexpansion, in our high schools. AVID has a 20-year research basesupporting the program’s outcomes.Implementation Timeline & Budget Needed:<strong>2007</strong>-<strong>08</strong> MOE Amount Code2.00 MOE for eachschool for additionof third cohort group/section of AVID (4MOE per school)56.00 $ 164,47321,79314,24913,29922,6631,299Base 02.5100.001.121.0142.0000Supp 02.5100.001.181.0142.0000SS 02.5910.001.211.0142.0000Ret 02.5910.001.221.0142.0000Hosp 02.5910.001.231.0142.0000Dental 02.5910.001.234.0142.0000Total: 56.00 $ 237,77620<strong>08</strong>-090.00 $ 0Total: 0.00 $ 02009-100.00 $ 0Total: 0.00 $ 0175 FY <strong>2007</strong>-<strong>08</strong> <strong>Plan</strong> for Student Success
Growth RequestsInitiative: Local Literacy Teachers to support K-2 Intervention and CoachingCurrent Funding Formula:Six Months of Employment (MOE) for a local literacy teaching positionper year-round elementary school and fi ve MOE for each traditionalcalendar elementary school.Implementation Timeline & Budget Needed:<strong>2007</strong>- <strong>08</strong> MOE Amount CodeBase positions2006-07: 481.003 new year-roundelementary schools18.00 $ 52,8667,0054,5804,2757,285418Base 02.5500.001.121.0293.0000Supp 02.5500.001.181.0293.0000SS 02.5910.001.211.0293.0000Ret 02.5910.001.221.0293.0000Hosp 02.5910.001.231.0293.0000Dental 02.5910.001.234.0293.000020<strong>08</strong>-09Base positions<strong>2007</strong>-<strong>08</strong>: 498.00Total: 18.00 $ 76,4293 new year-roundelementary schools18.00 $ 52,8667,0054,5804,2757,648418Base 02.5500.001.121.0293.0000Supp 02.5500.001.181.0293.0000SS 02.5910.001.211.0293.0000Ret 02.5910.001.221.0293.0000Hosp 02.5910.001.231.0293.0000Dental 02.5910.001.234.0293.00002009-10Base positions20<strong>08</strong>-09: 516.00Total: 18.00 $ 76,7924 new year-roundelementary schools24.00 $ 70,4889,3406,1075,70010,706557Base 02.5500.001.121.0293.0000Supp 02.5500.001.181.0293.0000SS 02.5910.001.211.0293.0000Ret 02.5910.001.221.0293.0000Hosp 02.5910.001.231.0293.0000Dental 02.5910.001.234.0293.0000Total: 24.00 $ 102,898176
Growth RequestsInitiative: In-<strong>School</strong> Suspension Teacher Months of Employment (MOE)Current Funding Formula:• 12 MOE for each Year-Round Middle <strong>School</strong> (East Cary will openwith sixth grade only; therefore six month allotment the fi rst year.)• 10 MOE for each Traditional Middle <strong>School</strong>Implementation Timeline & Budget Needed:<strong>2007</strong>-<strong>08</strong> MOE Amount CodeBase positionsgoing forward from2006-07: 3<strong>08</strong>.002009-10 MOE Amount CodeNo New Middle<strong>School</strong>s0.00 $ 0Subtotal 0.00 $ 0 State0.00 $ 0Subtotal 0.00 $ 0 LocalTotal 0.00 $ 0East Cary (6 MOE)Wendell (10 MOE)16.00 $ 46,9923,5953,3556,475Base 01.5500.069.121.0147.0000SS 01.5910.069.211.0147.0000Ret 01.5910.069.221.0147.0000Hosp 01.5910.069.231.0147.0000Subtotal 16.00 $ 60,417 State0.00 $ 6,227476445371Supp 02.5500.069.181.0147.0000SS 02.5910.069.211.0147.0000Ret 02.5910.069.221.0147.0000Dental 02.5910.069.234.0147.000020<strong>08</strong>-09Subtotal 0.00 $ 7,519 LocalTotal 16.00 $ 67,936East Cary Middle 6.00 $ 17,6221,3481,2582,549Base 01.5500.069.121.0147.0000SS 01.5910.069.211.0147.0000Ret 01.5910.069.221.0147.0000Hosp 01.5910.069.231.0147.0000Subtotal 6.00 $ 22,777 State0.00 $ 2,335179167139Supp 02.5500.069.181.0147.0000SS 02.5910.069.211.0147.0000Ret 02.5910.069.221.0147.0000Dental 02.5910.069.234.0147.0000Subtotal 0.00 $ 2,820 LocalTotal 6.00 $ 25,597177 FY <strong>2007</strong>-<strong>08</strong> <strong>Plan</strong> for Student Success
Growth RequestsInitiative: Online resources for new schoolsCurrent Funding Formula:Online resources and Athena (library automation) support for newschools.Annual Cost:Elementary: $734Middle: $809High: $5,219Implementation Timeline & Budget Needed:<strong>2007</strong>-<strong>08</strong> Amount CodeOnline Materials/Subscriptions (3 ES, 2 MS)Contracted Services (support 5 schools)$ 3,03079002.5810.801.435.0170.<strong>08</strong>2502.5810.801.311.0170.<strong>08</strong>25Total: $ 3,82020<strong>08</strong>-09Online Materials/Subscriptions (3 ES)Contracted Services (support 3 schools)$1,72847402.5810.801.435.0170.<strong>08</strong>2502.5810.801.311.0170.<strong>08</strong>25Total: $ 2,2022009-10Online Materials/Subscriptions (4 ES,1 HS)Contracted Services (support 5 schools)$ 7,36579002.5810.801.435.0170.<strong>08</strong>2502.5810.801.311.0170.<strong>08</strong>25Total: $ 8,155178
Growth RequestsInitiative: Swimming Pool Rental for Heritage High <strong>School</strong>Current Funding Formula:Current Rate $4,492 per 19 High <strong>School</strong>sImplementation Timeline & Budget Needed:<strong>2007</strong>-<strong>08</strong> Amount CodeTotal: $ 020<strong>08</strong>-09Total: $ 02009-10Heritage High <strong>School</strong> $ 4,492 02.5400.801.311.0119.<strong>08</strong>25Total: $ 4,492179 FY <strong>2007</strong>-<strong>08</strong> <strong>Plan</strong> for Student Success
Growth RequestsInitiative: Minimum Competency Teachers Months of Employment (MOE)Current Funding Formula:1:5.8 (Students with 4+ Academic Risk Factors)The formula may be revisited to more closely align with currentperformance on an established measure.Implementation Timeline & Budget Needed:<strong>2007</strong>-<strong>08</strong> MOE Amount CodeBase positions goingforward from 2006-07- 495.00No new high schools20<strong>08</strong>-09Total: 0.00 $ 0.002009-10Total: 0.00 $ 0.00Heritage High <strong>School</strong> 20.00 $ 58,7404,4944,1948,922Base 01.5500.069.121.0192.0000SS 01.5910.069.211.0192.0000Ret 01.5910.069.221.0192.0000Hosp 01.5910.069.231.0192.0000Subtotal 20.00 $ 76,350 State$ 7,783595556464Base 02.5500.069.181.0192.0000SS 02.5910.069.211.0192.0000Ret 02.5910.069.221.0192.0000Dental 02.5910.069.234.0192.0000Subtotal 0.00 $ 9,398 LocalTotal: 20.00 $ 85,748180
Growth RequestsInitiative: NovaNet Teachers Months of Employment (MOE)Current Funding Formula:10 MOE for each High <strong>School</strong>Implementation Timeline & Budget Needed:<strong>2007</strong>-<strong>08</strong> MOE Amount CodeBase positions goingforward from 2006-07- 210.00 MOE20<strong>08</strong>-09No new High <strong>School</strong>s2009-10Total: 0.00 $ 0.00Total: 0.00 $ 0.00Heritage High <strong>School</strong> 10.00 $ 29,3702,2472,0974,461Base 01.5500.069.121.0175.0000SS 01.5910.069.211.0175.0000Ret 01.5910.069.221.0175.0000Hosp 01.5910.069.231.0175.0000Subtotal 10.00 $ 38,175 State$ 3,892298278232Base 02.5500.069.181.0175.0000SS 02.5910.069.211.0175.0000Ret 02.5910.069.221.0175.0000Dental 02.5910.069.234.0175.0000Subtotal 0.00 $ 4,700 LocalTotal: 10.00 $ 42,875181 FY <strong>2007</strong>-<strong>08</strong> <strong>Plan</strong> for Student Success
Growth RequestsInitiative: Cost to Administer Tests, Test Coordinator Travel and Seasonal Overtime in Testing Offi ceCurrent Funding Formula:Cost to Administer Tests:The requested increases are based solely on increased numbersof students in the particular grade levels at the current costs with theexception of CogATs which is expected to cost $0.84 more per test in<strong>2007</strong>-<strong>08</strong>; $0.17 more in 20<strong>08</strong> and $0.18 more in 2009.Test Coordinator Travel:In the 2005-06 year, the Evaluation and Research (E&R) Department paidthe expenses for test coordinators to travel to and from central locationsfor required training programs, along with test pickup and delivery. Theaverage cost for test coordinator travel in 2005-06 per school was $321at a mileage rate of $0.445. Thus, for <strong>2007</strong>-<strong>08</strong>, we calculate that 153schools will require $53,574 at a rate of $0.485 per mile.Seasonal Overtime in Testing Offi ce:The current funding formula is based on the overtime for four staff andsummer temporary staff at the rate of $0.18 per pupil. Due to an expectedincrease in numbers of assessments as well as students in <strong>2007</strong>-<strong>08</strong>,funds should be increased.Implementation Timeline & Budget Needed:<strong>2007</strong>-<strong>08</strong> Amount CodeEOGs/EOCs - Grade 3-12, $0.50each $4,679CogATs - Grade 3 only $4,248All other tests - $1.40/student$11,906Travel for Test Coordinators andIPT Contacts$ 4,6794,24811,90612,39902.6620.801.412.0223.<strong>08</strong>70 $13,88902.6620.801.362.0223.<strong>08</strong>70 $ 6,94402.6620.801.332.0223.<strong>08</strong>7020<strong>08</strong>-09 Amount CodeEOGs/EOCs - Grade 3-12, $0.50 eachCogATs - Grade 3 onlyAll other tests - $1.40/studentTravel for TestCoordinators and IPTContacts7,949 students @ $0.18/pupil2009-10EOGs/EOCs - Grade 3-12, $0.50 eachCogATs - Grade 3 onlyAll other tests - $1.40/studentTravel for TestCoordinators and IPTContacts8,171 students @ $0.18/pupil$ 4,7116,2138,9311,0501,431109102Total: $ 22,547$ 4,9735,8429,6602,0111,471103105Total: $ 24,16502.6620.801.412.0223.<strong>08</strong>70 $10,09602.6620.801.362.0223.<strong>08</strong>70 $ 5,04802.6620.801.332.0223.<strong>08</strong>70Base 02.6620.801.180.0223.0970SS 02.6910.801.211.0223.0970Ret 02.6910.801.221.0223.097002.6620.801.412.0223.<strong>08</strong>70 $13,65002.6620.801.362.0223.<strong>08</strong>70 $ 6,82502.6620.801.332.0223.<strong>08</strong>70Base 02.6620.801.180.0223.0970SS 02.6910.801.211.0223.0970Ret 02.6910.801.221.0223.097<strong>08</strong>,014 students @ $0.18/pupil1,443110103Base 02.6620.801.180.0223.0970SS 02.6910.801.211.0223.0970Ret 02.6910.801.221.0223.0970Total: $ 34,888182
Growth RequestsInitiative: Special Education TeachersEstablish 94 teacher positions (940 MOE)State funding for special education funding is capped at 12.5%. Basedon expected growth, this means that we will not receive funding for 1,216students. This equates to $3,274,464 in additional funding. In addition,national studies have shown that it takes two and one half times thefunding received for students without disabilities to serve students withspecial education needs.Projected Special Education Growth:7,998 WCPSS student growth projection x 15.2% (based on the April 12006 percentage of WCPSS students in special education) = 1,216Based on current special education class enrollments, growth trends forspecial education students from December (federal) and April (State)head counts, student membership projections (7,998, WCPSS studentgrowth), and current funding formulas (see below), ninety-four (94) specialeducation teacher positions will be needed for the <strong>2007</strong>-<strong>08</strong> school year tosupport growth and new classes. Projections for 20<strong>08</strong>-09 and 2009-10are based on the same rate of continued growth.DPI Class Size Guideline Considered When Making Projections:• Elementary: Resource - 1:30, Separate - varies by type of classfrom 6-18• Middle: Resource and Separate - 1:22• High: Resource - 1:35, OCS - 1:12, Separate - 1:12Current Funding Formula:• 1,216 students Preschool-grade twelve divided by 13 studentsper class average = 94 teachers.• Class average is determined yearly based on projected need fornew classes. It ranges from 11 to 15. For the current projections,an average of 13 is most appropriate.Addendum to business case for growth for Special Education Teachersbeyond the 94 required for growth (8,000 students):The 22 schools converted to year-round need additional MOE because ofthe year-round model. (All special education students cannot be servedon the same track).• 2 MOE per seperate class• 1 MOE per resource classCurrent classes:65 Resource classes times one additional MOE = 65 MOE61 Seperate classes times two additional MOE = 122 MOETotal additional MOE needed = 187 MOEThis allows for students to be served across tracks so that tracks are notdisability identifi able. This will also allow for sibling track matches andthe provision of extended school year services required.Implementation Timeline & Budget Needed:<strong>2007</strong>-<strong>08</strong> MOE Amount CodeSpecial EducationTeachers7,998 (new students)x 15.2%= 1,216divided by 13(students per classaverage)=937 months937.00 $ 2,751,969210,526196,491379,204937.00 3,538,190 State190.00 $ 364,64327,89526,03621,738558,03073,94048,34645,12376,8934,4<strong>08</strong>Base 01.5200.032.121.0136.0000SS 01.5910.032.211.0136.0000Ret 01.5910.032.221.0136.0000Hosp 01.5910.032.231.0136.0000Supp 02.5200.032.181.0136.0000SS 02.5910.032.211.0136.0000Ret 02.5910.032.221.0136.0000Hosp 02.5910.032.231.0136.0000Base 02.5200.001.121.0136.0000Supp 02.5200.001.181.0136.0000SS 02.5910.001.211.0136.0000Ret 02.5910.001.221.0136.0000Hosp 02.5910.001.231.0136.0000Dental 02.5910.001.234.0136.0000183 FY <strong>2007</strong>-<strong>08</strong> <strong>Plan</strong> for Student Success
Growth Requests<strong>2007</strong>-<strong>08</strong> MOE Amount Code20<strong>08</strong>-09Special EducationTeachers7,949 (new students)x 15.2%= 1,2<strong>08</strong>divided by 13(students per classaverage)=929 monthsSubtotal 190.00 $ 1,247,052 LocalTotal: 1,127.00 $ 4,785,242929.00 $ 2,728,4732<strong>08</strong>,728194,813394,732929.00 $ 3,526,746 State271.00 $ 361,53127,65725,81321,553795,927105,46268,95664,359115,1486,287Base 01.5200.032.121.0136.0000SS 01.5910.032.211.0136.0000Ret 01.5910.032.221.0136.0000Hosp 01.5910.032.231.0136.0000Supp 02.5200.032.181.0136.0000SS 02.5910.032.211.0136.0000Ret 02.5910.032.221.0136.0000Hosp 02.5910.032.231.0136.0000Base 02.5200.001.121.0136.0000Supp 02.5200.001.181.0136.0000SS 02.5910.001.211.0136.0000Ret 02.5910.001.221.0136.0000Hosp 02.5910.001.231.0136.0000Dental 02.5910.001.234.0136.00002009-10 MOE Amount CodeSpecial EducationTeachers8,171 (new students)x 15.2%=1,242divided by 13(students per classaverage)=955 months955.00 $ 2,804,835214,570200,265426,026955.00 $ 3,645,696 State341.00 $ 371,64828,43126,53622,1561,001,517132,70486,76880,983152,1207,911341.00 $ 1,910,774 LocalTotal: 1,296.00 $ 5,556,470Base 01.5200.032.121.0136.0000SS 01.5910.032.211.0136.0000Ret 01.5910.032.221.0136.0000Hosp 01.5910.032.231.0136.0000Supp 02.5200.032.181.0136.0000SS 02.5910.032.211.0136.0000Ret 02.5910.032.221.0136.0000Hosp 02.5910.032.231.0136.0000Base 02.5200.001.121.0136.0000Supp 02.5200.001.181.0136.0000SS 02.5910.001.211.0136.0000Ret 02.5910.001.221.0136.0000Hosp 02.5910.001.231.0136.0000Dental 02.5910.001.234.0136.0000271.00 $1,592,693 LocalTotal: 1,200.00 $ 5,119,439184
Growth RequestsInitiative: Special Education Teacher Assistants, Transition Training FacilitatorsEstablish 45.4 teacher assistant and transition training facilitatorpositions.Special Education teacher assistants are required for self-containedclasses as established by state law. Additionally, teacher assistants arerequired to meet a student’s unique needs as established by the student’sIndividual Education <strong>Plan</strong>s(IEPs). Transition Training Facilitators assistwith Occupational Course of Study students and job training. Currentlywe have 25 Transition Training Facilitators.Projected Special Education Growth:• 8,014 WCPSS student growth projection x 15.2% (based onthe April 1, 2006 percentage of WCPSS students in specialeducation) = 1,218Establish 45.4 teacher assistant and transition training facilitatorpositions. Projections for 20<strong>08</strong>-09 and 2009-10 are based on the samerate of continued growth.Current Funding Formula:• Elementary: 13 new separate classes = 13 teacher assistantpositions plus 45 for anticipated growth during the year basedon number needed for 2006-07 growth during the year. As ofNovember 2006, thirty (30) additional positions have beenadded. We anticipate, based on the number of positions addedin 2005-06, we will add 15 positions before the end of the 2006-07 school year.• Secondary: 8 new separate classes = 8 teacher assistants plus10 for anticipated growth during the year plus 14 for resourceclasses (ratio of 1:50). [Of the 1216 projected new students,59% or 717 will be secondary (717 / 50 = 14)].• Additional transition-training facilitators are needed to work withstudents in the Occupational Course of Study. Program growth,since the Occupational Course of Study Program began in 2000,has increased the need to one position per high school andone additional position for our largest job sites to ensure propersupervision of students. We have added four large sites resultingin the need for four additional Transition Training Facilitator (TTF)positions.• Total teacher assistants and transition training facilitators=45.4Implementation Timeline & Budget Needed:<strong>2007</strong>- <strong>08</strong> MOE Amount CodeTeacher AssistantsTransition TrainingFacilitators8,014 (new students) x15.2%= 1,218divided by 50(student ratio)=244 monthsplus 210(new classrooms)=454 months226.00 $ 404,02230,9<strong>08</strong>28,84791,462Subtotal: 226.00 $555,239 State228.00 $ 5,243407,59831,18129,10292,2725,290Subtotal: 228.00 $ 570,686 LocalTotal 454.00 $1,125,925Base 01.5200.027.142.0136.0000SS 01.5910.027.211.0136.0000Ret 01.5910.027.221.0136.0000Hosp 01.5910.027.231.0136.0000Base 02.5910.027.234.0136.0000Supp 02.5200.032.142.0136.0000SS 02.5910.032.211.0136.0000Ret 02.5910.032.221.0136.0000Hosp 02.5910.032.231.0136.0000Dental 02.5910.032.234.0136.0000185 FY <strong>2007</strong>-<strong>08</strong> <strong>Plan</strong> for Student Success
Growth Requests20<strong>08</strong>-09 MOE Amount Code2009-10 MOE Amount CodeTeacher AssistantsTransition TrainingFacilitators7,949 (new students) x15.2%= 1,2<strong>08</strong>divided by 50(student ratio)=242 monthsplus 210(new classrooms)=452 months139.00 $ 248,49219,01017,74259,061Base 01.5200.027.142.0136.0000SS 01.5910.027.211.0136.0000Ret 01.5910.027.221.0136.0000Hosp 01.5910.027.231.0136.0000364.00 $ 2,413632,85048,41345,185157,9198,213Subtotal: 364.00 $ 894,993 LocalTotal 468.00 $1,154,807Base 02.5910.027.234.0136.0000Supp 02.5100.032.142.0136.0000SS 02.5910.032.211.0136.0000Ret 02.5910.032.221.0136.0000Hosp 02.5910.032.231.0136.0000Dental 02.5910.032.234.0136.0000Subtotal: 139.00 $344,305 State313.00 $ 3,225559,55342,80639,952132,9947,262Base 02.5910.027.234.0136.0000Supp 02.5200.032.142.0136.0000SS 02.5910.032.211.0136.0000Ret 02.5910.032.221.0136.0000Hosp 02.5910.032.231.0136.0000Dental 02.5910.032.234.0136.00002009-10Subtotal: 313.00 $ 785,792 LocalTotal 452.00 $1,130,097Teacher AssistantsTransition TrainingFacilitators8,171 (new students) x15.2%= 1242divided by 50(student ratio)=248 monthsplus 210(new classrooms)=458 months104.00 $ 185,92214,22313,27546,394Base 01.5200.027.142.0136.0000SS 01.5910.027.211.0136.0000Ret 01.5910.027.221.0136.0000Hosp 01.5910.027.231.0136.0000Subtotal: 104.00 $ 259,814 State186
Growth RequestsInitiative: <strong>School</strong> counselor months of employment due to growth in student enrollmentCurrent Funding Formula:The American <strong>School</strong> Counselor Association recommends 1:250 asthe appropriate ratio for school counselors to students. The currentfunding formula used in <strong>Wake</strong> <strong>County</strong> <strong>Public</strong> <strong>School</strong> <strong>System</strong> (WCPSS)yields counselor-to-student ratios that signifi cantly exceed this nationalrecommendation.Counselors are allotted according to school enrollment as follows:Elementary <strong>School</strong>s• Under 824 students: 10 MOEs per traditional-calendar /12 MOEsper year-round school• 824—999 students: 15 MOEs per school• 1000 students: 20 MOEs per schoolAllotments are made based on student-planning enrollment projections.Year-round allocation is based on ¾ of the student-planning enrollmentprojections.Middle <strong>School</strong>s• 1—400 students: 10 MOEs• 401—849 students: 20 MOEs• 850—1249 students: 10 MOEs per grade level• 1250—1549 students: 10 additional MOEs• 1550—1850 students: 10 additional MOEsYear -round allocation is based on ¾ of the student-planning enrollmentprojections plus 2 additional MOEs.Implementation Timeline & Budget Needed:<strong>2007</strong>-<strong>08</strong> MOE Amount Code16 counselors- salary projectionbased on 5 yearsexperience(Includes 10 MOEto move one SAPposition from the048 grant to statefunding)20<strong>08</strong>-0915 counselors- salary projectionbased on 5 yearsexperience162.00 $ 600,04845,90442,84365,561162.00 $ 754,356 State$ 117,9209,0218,4193,7580.00 $ 139,118 LocalTotal: 162.00 $893,474150.00 $ 555,60042,50339,67063,735150.00 $ 701,5<strong>08</strong> State$ 109,1858,3537,7963,4800.00 $ 128,814 LocalTotal: 150.00 $830,322Base 01.5830.007.121.0146.0000SS 01.5910.007.211.0146.0000Ret 01.5910.007.221.0146.0000Hosp 01.5910.007.231.0146.0000Base 02.5830.007.181.0146.0000SS 02.5910.007.211.0146.0000Ret 02.5910.007.221.0146.0000Dental 02.5910.007.234.0146.0000Base 01.5830.007.121.0146.0000SS 01.5910.007.211.0146.0000Ret 01.5910.007.221.0146.0000Hosp 01.5910.007.231.0146.0000Base 02.5830.007.181.0146.0000SS 02.5910.007.211.0146.0000Ret 02.5910.007.221.0146.0000Dental 02.5910.007.234.0146.0000High <strong>School</strong>s• 1—1849 students: 10 MOEs per grade level (plus two additionalMOEs for the Dean of Student Services)• 1850—2249 students: 10 additional MOEs• 2250—2649 students: 10 additional MOEs2009-1019 counselors- salary projectionbased on 5 yearsexperience190.00 $ 703,76053,83850,24884,759Base 01.5830.007.121.0146.0000SS 01.5910.007.211.0146.0000Ret 01.5910.007.221.0146.0000Hosp 01.5910.007.231.0146.0000190.00 $892,605 State187 FY <strong>2007</strong>-<strong>08</strong> <strong>Plan</strong> for Student Success
Growth Requests2009-10 MOE Amount Code$ 138,30110,5809,8754,4<strong>08</strong>Base 02.5830.007.181.0146.0000SS 02.5910.007.211.0146.0000Ret 02.5910.007.221.0146.0000Dental 02.5910.007.234.0146.00000.00 $ 163,164 LocalTotal: 190.00 $1,055,769188
Growth RequestsInitiative: Speech TherapistsEstablish 120 MOE for school age and 24 MOE for preschool positionsfor a total of 144 MOE for speech therapists positions in <strong>2007</strong>-<strong>08</strong>.Implementation Timeline & Budget Needed:<strong>2007</strong>-<strong>08</strong> MOE Amount CodeSpeech therapy is required based on state and federal mandates. Speech/Language Pathologists deliver speech therapy services as specifi ed in astudent’s IEP. Speech pathologists are an integral part of a school’s teambecause of their knowledge of speech/language development and how itimpacts a student’s academic, social and/or vocational development.Currently we have 105 Speech Pathologists serving school-age studentsand 20.5 serving preschool students. We are contracting for an additional43 hours per week.Current Funding Formula:<strong>School</strong> Age• Currently, approximately 5,100 are receiving speech/languageservices. This equates to 4% of the total school-age population.• Using a projected enrollment in <strong>2007</strong>-<strong>08</strong> of 136,<strong>08</strong>6 we expect toprovide speech services to 5,443 students. This would require115 positions. We currently have 105 positions and this wouldmean 10 additional school-age speech positions for <strong>2007</strong>-<strong>08</strong>. For20<strong>08</strong>-09, six new positions will be needed and eight additionalpositions will be needed for 2009-10.Preschool• Preschool positions are based on a combination of evaluationsand direct services. In 2004-05, preschool speech pathologistsevaluated 614 students and provided services to an additional381. During the 2005-06 school year, 739 evaluations wereconducted and 502 students received services. This is a growthof 125 evaluations and an additional 121 students receivingspeech services. Using an average growth rate of 4.3% forevaluations and services, we expect to provide services to 1,294students in <strong>2007</strong>-<strong>08</strong>. This will require 2 additional positions for<strong>2007</strong>-<strong>08</strong>, and 2.5 positions for 20<strong>08</strong>-09 and 2009-10.Speech Therapists 144.00 $ 570,24078,4<strong>08</strong>49,62246,31348,5642,78420<strong>08</strong>-09Total: 144.00 $ 795,931Speech Therapists 102.00 $ 403,92055,53935,14932,80536,1171,9722009-10Total: 102.00 $ 565,502Speech Therapists 126.00 $ 498,96068,60743,41940,52446,8412,436Total: 126.00 $ 700,787Base 02.5860.032.124.0136.0000Supp 02.5860.032.181.0136.0000SS 02.5910.032.211.0136.0000Ret 02.5910.032.221.0136.0000Hosp 02.5910.032.231.0136.0000Dental 02.5910.032.234.0136.0000Base 02.5860.032.124.0136.0000Supp 02.5860.032.181.0136.0000SS 02.5910.032.211.0136.0000Ret 02.5910.032.221.0136.0000Hosp 02.5910.032.231.0136.0000Dental 02.5910.032.234.0136.0000Base 02.5860.032.124.0136.0000Supp 02.5860.032.181.0136.0000SS 02.5910.032.211.0136.0000Ret 02.5910.032.221.0136.0000Hosp 02.5910.032.231.0136.0000Dental 02.5910.032.234.0136.0000189 FY <strong>2007</strong>-<strong>08</strong> <strong>Plan</strong> for Student Success
Growth RequestsInitiative: <strong>School</strong> psychologist months of employment due to growth in student enrollmentCurrent Funding Formula:Add one psychologist month of employment (MOE) for every 158 newstudents. The National Association of <strong>School</strong> Psychologists recommendsa ratio of one psychologist per 1000 students, or one psychologist MOEper 91 students. Currently in the <strong>Wake</strong> <strong>County</strong> <strong>Public</strong> <strong>School</strong> <strong>System</strong>(WCPSS), there is a ratio of one psychologist per 1,970 students, or oneMOE to 179 students.Implementation Timeline & Budget Needed:<strong>2007</strong>-<strong>08</strong> MOE Amount Code2009-10 MOE Amount Code<strong>School</strong>Psychologist MOEs(recurring)8171 / 158 = 52.0052.00 $ 205,92015,75314,70321,<strong>08</strong>852.00 $ 257,464 State$ 43,1023,2973,0781,097Base 01.5850.007.139.0202.0000SS 01.5910.007.211.0202.0000Ret 01.5910.007.221.0202.0000Hosp 01.5910.007.231.0202.0000Base 02.5850.007.181.0202.0000SS 02.5910.007.211.0202.0000Ret 02.5910.007.221.0202.0000Dental 02.5910.007.234.0202.0000<strong>School</strong>Psychologist MOEs(recurring)8014 / 158 = 51.0051.00 $ 201,96015,45014,42018,76351.00 $ 250,593 State$ 42,2743,2343,0181,0760.00 $ 49,602 LocalBase 01.5850.007.139.0202.0000SS 01.5910.007.211.0202.0000Ret 01.5910.007.221.0202.0000Hosp 01.5910.007.231.0202.0000Base 02.5850.007.181.0202.0000SS 02.5910.007.211.0202.0000Ret 02.5910.007.221.0202.0000Dental 02.5910.007.234.0202.00000.00 $ 50,574 LocalTotal: 52.00 $ 3<strong>08</strong>,038Note: Salary grade is based on $126 added per month for advanced certifi cation and fi veyears of experience.20<strong>08</strong>-09Total: 51.00 $ 300,195<strong>School</strong>Psychologist MOEs(recurring)7949 / 158 = 50.0050.00 $ 198,00015,14714,13719,314Base 01.5850.007.139.0202.0000SS 01.5910.007.211.0202.0000Ret 01.5910.007.221.0202.0000Hosp 01.5910.007.231.0202.000050.00 $ 246,598 State$ 41,4453,1712,9591,055Base 02.5850.007.181.0202.0000SS 02.5910.007.211.0202.0000Ret 02.5910.007.221.0202.0000Dental 02.5910.007.234.0202.00000.00 $ 48,630 LocalTotal: 50.00 $ 295,228190
Growth RequestsInitiative: Social work months of employment due to growth in student enrollmentCurrent Funding Formula:One new social work month of employment (MOE) for every 192students.Implementation Timeline & Budget Needed:<strong>2007</strong>-<strong>08</strong> MOE Amount Code<strong>School</strong> SocialWork MOEs(recurring)8014 / 19241.66 $ 134,60310,2979,61116,86041.66 $ 171,371 State$ 26,4502,0231,8889677,8001,0000.00 $ 40,128 LocalBase 01.5820.007.139.0213.0000SS 01.5910.007.211.0213.0000Ret 01.5910.007.221.0213.0000Hosp 01.5910.007.231.0213.0000Base 02.5820.007.181.0213.0000SS 02.5910.007.211.0213.0000Ret 02.5910.007.221.0213.0000Dental 02.5910.007.234.0213.0000Equip 02.5820.801.412.0146.0000Supplies 02.5820.801.412.0146.00002009-10 MOE Amount Code<strong>School</strong> SocialWork MOEs(recurring)8171 / 19247.97 $ 154,99211,85711,06621,39947.97 $ 199,314 State$ 30,4552,3302,1751,1137,8001,0000.00 $ 44,873 LocalTotal: 47.97 $ 244,187Base 01.5890.007.139.0213.0000SS 01.5910.007.211.0213.0000Ret 01.5910.007.221.0213.0000Hosp 01.5910.007.231.0213.0000Base 02.5890.007.181.0213.<strong>08</strong>20SS 02.5910.007.211.0213.<strong>08</strong>20Ret 02.5910.007.221.0213.<strong>08</strong>20Dental 02.5910.007.234.0213.<strong>08</strong>20Equip 02.5820.801.412.0146.0000Supplies 02.5820.801.412.0146.0000Note: Salary grade is based on $126 added per month for advanced certifi cation and 10years of experience, since position requires Master of Social Work degree.20<strong>08</strong>-09Total: 41.66 $ 211,499<strong>School</strong> SocialWork MOEs(recurring)7949 / 19244.36 $ 143,32710,96510,23418,849Base 01.5820.007.139.0213.0000SS 01.5910.007.211.0213.0000Ret 01.5910.007.221.0213.0000Hosp 01.5910.007.231.0213.000044.36 $ 183,375 State$ 28,1642,1552,0111,0297,8001,000Base 02.5890.007.181.0213.0000SS 02.5910.007.211.0213.0000Ret 02.5910.007.221.0213.0000Dental 02.5910.007.234.0213.0000Equip 02.5820.801.412.0146.0000Supplies 02.5820.801.412.0146.00000.00 $ 42,159 LocalTotal: 44.36 $ 225,534191 FY <strong>2007</strong>-<strong>08</strong> <strong>Plan</strong> for Student Success
Growth RequestsInitiative: Accelerated Learning Program (ALP) (3-8)Elementary and middle schools are allocated Months of Employment(MOE) to provide supplemental math, reading, and language artsinstruction to Level I and II students in grades three through eight.Services are typically scheduled during the day, after school, and/or onSaturdays.Current Funding Formula:Total Number of Level I and II students in grades 3-8 for the 2005-06school year was 15,786. The request is to fund ALP at a level of 1 Monthof Employment (MOE) for every 13 Level I and II students. This requiresa total of 1,214 MOE.<strong>2007</strong>-<strong>08</strong> MOE Amount CodeALP Positions150.00 monthsto be paid fromlapsed salary47.00150.00$ 138,03918,28311,81811,16118,1141,090(1,000)(92)(2,839)(3,263)Total: 197.00 $ 191,311Base 02.5500.072.121.0103.0000Supp 02.5500.072.181.0103.0000SS 02.5910.072.211.0103.0000Ret 02.5910.072.221.0103.0000Hosp 02.5910.072.231.0103.0000Dental 02.5910.072.234.0103.0000Reprod 02.6210.072.362.0103.0920Instr Supp 02.5500.072.411.0103.<strong>08</strong>20Supplies 02.6210.072.412.0103.0920Contr Svcs 02.5500.072.311.0103.<strong>08</strong>20Implementation Timeline & Budget Needed:Positions:These are teacher MOE in codes 01.0000.072.000.0103.000 and02.0000.072.000.0103.000 calculated at pay grade A02.Budget Needed:An analysis of the 2006-07 funds for ALP (PRC 072, Level 0103) showsthat there is suffi cient budget to recommend an increase of 150 MOEwith no increase in local funding. Therefore the request is to fund anadditional 150 months at the 2006-07 level, and request the 47 MOEgrowth with and increase local funds needed.The request for new Accelerated Learning Programs (ALP) months issignifi cantly increased for <strong>2007</strong>-<strong>08</strong> due to dramatic increase in Level Iand II students in math on the 2005-06 End of Grade Math test.20<strong>08</strong>-09ALP Positions 23.00 $ 67,5518,9475,7835,4628,8645342009-10Total: 23.00 $ 97,141ALP Positions 30.00 $ 88,11011,6707,5437,12411,562696Total: 30.00 $ 126,705Base 02.5500.072.121.0103.0000Supp 02.5500.072.181.0103.0000SS 02.5910.072.211.0103.0000Ret 02.5910.072.221.0103.0000Hosp 02.5910.072.231.0103.0000Dental 02.5910.072.234.0103.0000Base 02.5500.072.121.0103.0000Supp 02.5500.072.181.0103.0000SS 02.5910.072.211.0103.0000Ret 02.5910.072.221.0103.0000Hosp 02.5910.072.231.0103.0000Dental 02.5910.072.234.0103.0000<strong>School</strong> Year Recurring MOE New Growth MOE Total MOE<strong>2007</strong>-<strong>08</strong> 1,017 197 1,21420<strong>08</strong>-09 1,214 23 1,2372009-10 1,237 30 1,267*These MOE are addressed in a separate Accelerated Learning Program Commitmentsby the Board of Education for Programs for Future Funding business case.192
Growth RequestsInitiative: Occupational Therapists (OT)Establish 36 MOE for occupational therapist positions in <strong>2007</strong>-<strong>08</strong> forgrowthOccupational Therapy is a state and federally mandated related service.Occupational therapists screen, evaluate, and provide interventionservices for students under IDEA and Section 504. In addition, theyprovide consultation to regular and special education teachers regardingfi ne motor and handwriting, sensory motor and attending, oral motorand feeding and self-help skills. Occupational therapists participate onStudent Support Teams and provide staff training as needed.Currently we have 32.5 occupational therapists on staff and we contractfor an additional 46 hours per week.Calculations:7,998 (estimated new student growth) times 15.2% (percentage ofSpecial Needs Students) = 1,216 Special Needs Students1,216 (Special Needs Students) times 9% (percentage of SpecialNeeds Students that need OT service) = 109.44 Students that need OTservices.109.44 (students that need OT services) times 40 (recommendedcaseload established by NCDPI) = 2.74 positions needed.Implementation Timeline & Budget Needed:<strong>2007</strong>-<strong>08</strong> MOE Amount CodeCurrent Funding Formula:• Current WCPSS caseload average, 55 students.• State recommended caseload, 35-40 students. Our projectionsare based on an average caseload of 40 students.• Of the 18,346 students with disabilities, approximately 9% or1,651 students receive OT services. For school year <strong>2007</strong>-<strong>08</strong>,approximately 1,725 students will need occupational therapyservices and two will be needed because of growth. In addition,there has been a 35% increase in the number of preschoolevaluations, because the Children Developmental ServicesAgency (formerly Developmental Evaluation Center) no longerconducts preschool evaluations.Addendum to business case for growth for Occupational Therapists:Nine percent of students with disabilities require occupational therapyservices. Based on growth projections, approximately 110 additionalstudents will need occuptional therapy services (1,216 times 9%).Using the recommended caseload established by the North CarolinaDepartment of <strong>Public</strong> Instruction (NCDPI), three additional positions willbe needed (110 divided by 40=2.74).Adding only two positions means that 29 students will not receiveservices. We need three positions (36 MOE) for growth.OccupationalTherapists20<strong>08</strong>-09OccupationalTherapists2009-10OccupationalTherapists36.00 $ 128,00311,84010,6989,98512,141696Total: 36.00 $ 173,36336.00 $ 128,00311,84010,6989,98512,747696Total: 36.00 $ 173,96936.00 $ 128,00311,84010,6989,98513,383696Total: 36.00 $ 174,605Base 02.5890.032.145.0136.<strong>08</strong>20Supp 02.5890.032.181.0136.<strong>08</strong>20SS 02.5910.032.211.0136.<strong>08</strong>20Ret 02.5910.032.221.0136.<strong>08</strong>20Hosp 02.5910.032.231.0136.<strong>08</strong>20Dental 02.5910.032.234.0136.<strong>08</strong>20Base 02.5890.032.145.0136.<strong>08</strong>20Supp 02.5890.032.181.0136.<strong>08</strong>20SS 02.5910.032.211.0136.<strong>08</strong>20Ret 02.5910.032.221.0136.<strong>08</strong>20Hosp 02.5910.032.231.0136.<strong>08</strong>20Dental 02.5910.032.234.0136.<strong>08</strong>20Base 02.5890.032.145.0136.<strong>08</strong>20Supp 02.5890.032.181.0136.<strong>08</strong>20SS 02.5910.032.211.0136.<strong>08</strong>20Ret 02.5910.032.221.0136.<strong>08</strong>20Hosp 02.5910.032.231.0136.<strong>08</strong>20Dental 02.5910.032.234.0136.<strong>08</strong>20193 FY <strong>2007</strong>-<strong>08</strong> <strong>Plan</strong> for Student Success
Growth RequestsInitiative: Challenged <strong>School</strong>s Program (CSP)<strong>School</strong>s with high percentages of students qualifying for free or reducedlunch face signifi cant challenges meeting No Child Left Behind (NCLB)and North Carolina ABC standards. Challenged <strong>School</strong>s Program fundsare allotted to provide additional resources to help these schools increasestudent achievement.Current Funding Formula:Challenged <strong>School</strong>s months of employment are intended to provideadditional resources to schools with a free/reduced population of 30percent or more.• <strong>School</strong>s are determined to be eligible based on spring projectionsfrom the Offi ce of Growth Management.• Eligible schools receive months of employment based on theprojected Free and Reduced (F&R) count provided by the Offi ceof Growth Management.• For 2006-07, we used a formula of one (1) Month of Employment(MOE) for every eighty (80) free/reduced students projected ineligible schools.Implementation Timeline & Budget Needed:Positions:There were 77 elementary and middle schools that qualifi ed forChallenged <strong>School</strong>s Program funds during the 2006-07 schoolyear. The average allotment was four MOE per school. Taking intoconsideration the addition of eligible schools due to growth and theopening of new schools, the following is requested:<strong>2007</strong>-<strong>08</strong> MOE Amount CodeTeacher 20.00 $ 58,7407,7835,<strong>08</strong>94,75<strong>08</strong>,09446420<strong>08</strong>-09Total: 20.00 $ 84,920Teacher 8.00 $ 23,4963,1132,0361,9003,3991862009-10Total: 8.00 $ 34,130Teacher 12.00 $ 35,2444,6703,0532,8505,353278Total: 12.00 $ 51,448Base 02.5500.072.121.0356.0000Supp 02.5500.072.181.0356.0000SS 02.5910.072.211.0356.0000Ret 02.5910.072.221.0356.0000Hosp 02.5910.072.231.0356.0000Dental 02.5910.072.234.0356.0000Base 02.5500.072.121.0356.0000Supp 02.5500.072.181.0356.0000SS 02.5910.072.211.0356.0000Ret 02.5910.072.221.0356.0000Hosp 02.5910.072.231.0356.0000Dental 02.5910.072.234.0356.0000Base 02.5500.072.121.0356.0000Supp 02.5500.072.181.0356.0000SS 02.5910.072.211.0356.0000Ret 02.5910.072.221.0356.0000Hosp 02.5910.072.231.0356.0000Dental 02.5910.072.234.0356.0000<strong>School</strong> Year Recurring MOE New Growth MOE Total MOE<strong>2007</strong>-<strong>08</strong> 267 20 28720<strong>08</strong>-09 287 8 2952009-10 295 12 307194
Growth RequestsInitiative: Physical Therapists (PT)Physical Therapy is a required related service based on state and federallaw for students needing PT in order to benefi t from their special education.Physical therapists work as a team with teachers, other professionals,school support staff and administrators to assess students, plan andimplement interventions, and provide technical support to promotethe participation and educational success of students with disabilities.Interventions are provided in integrated, natural environments with peersas much as possible. In addition, physical therapists work with schoolstaff to identify the need for extra support personnel, to plan and providesafe transportation of students with disabilities and to insure facilityaccess by addressing specifi cations and modifi cations for <strong>Wake</strong> <strong>County</strong><strong>Public</strong> <strong>School</strong> <strong>System</strong> (WCPSS) buildings.Currently employ 11 Physical Therapists.Current Funding Formula:• Current average caseload is 65 students.• State recommended caseload is 40 students.• Of the 18,346 students with disabilities, approximately 710 students,or 3.9 percent receive PT services.8,014 increase in students x 15% approximate percent special needs x3.9% approximate percent receiving PT services=47 additional studentsreceiving services / 65 caseload = 1 new position (<strong>2007</strong>-<strong>08</strong>)7,949 increase in students x 15% approximate percent special needs x3.9% approximate percent receiving PT services=47 additional studentsreceiving services / 65 caseload = 1 new position (20<strong>08</strong>-09)Implementation Timeline & Budget Needed:<strong>2007</strong>-<strong>08</strong> MOE Amount CodePhysical TherapistsProjected ADM:8014 x 15% x 3.9% =47 / 65 = 120<strong>08</strong>-09Physical TherapistsProjected ADM:7949 x 15% x 3.9% =47 / 65 = 12009-10Physical TherapistsProjected ADM:8171 x 15% x 3.9% =47 / 65 = 112.00 $ 42,6683,9473,5663,3284,047232Total: 12.00 $ 57,78812.00 $ 42,6683,9473,5663,3284,249232Total: 12.00 $ 57,99012.00 $ 42,6683,9473,5663,3284,461232Total: 12.00 $ 58,202Base 02.5890.032.145.0136.<strong>08</strong>20Supp 02.5890.032.181.0136.<strong>08</strong>20SS 02.5910.032.211.0136.<strong>08</strong>20Ret 02.5910.032.221.0136.<strong>08</strong>20Hosp 02.5910.032.231.0136.<strong>08</strong>20Dental 02.5910.032.234.0136.<strong>08</strong>20Base 02.5890.032.145.0136.<strong>08</strong>20Supp 02.5890.032.181.0136.<strong>08</strong>20SS 02.5910.032.211.0136.<strong>08</strong>20Ret 02.5910.032.221.0136.<strong>08</strong>20Hosp 02.5910.032.231.0136.<strong>08</strong>20Dental 02.5910.032.234.0136.<strong>08</strong>20Base 02.5890.032.145.0136.<strong>08</strong>20Supp 02.5890.032.181.0136.<strong>08</strong>20SS 02.5910.032.211.0136.<strong>08</strong>20Ret 02.5910.032.221.0136.<strong>08</strong>20Hosp 02.5910.032.231.0136.<strong>08</strong>20Dental 02.5910.032.234.0136.<strong>08</strong>2<strong>08</strong>,171 increase in students x 15% approximate percent special needs x3.9% approximate percent receiving PT services=47 additional studentsreceiving services / 65 caseload = 1 new position (2009-10)195 FY <strong>2007</strong>-<strong>08</strong> <strong>Plan</strong> for Student Success
Growth RequestsInitiative: Transitional counselor months of employment due to growth in student enrollment and subsequent increase in number of long-term suspendedstudentsCurrent Funding Formula:One Transition Counselor per 110 additional long-term suspendedstudent cases.Implementation Timeline & Budget Needed:<strong>2007</strong>-<strong>08</strong> MOE Amount CodeTransition Counselor 11.00 $ 35,5402,7192,5384,4521 laptop computer,printer, and offi cesuppliesTravel20<strong>08</strong>-0911.00 $ 45,249 State$ 6,9845344992552,50<strong>08</strong>000.00 $ 11,572 LocalTotal: 11.00 $ 56,821Transition Counselor 11.00 $ 35,5402,7192,5384,6741 laptop computer,printer, and offi cesuppliesTravel11.00 $ 45,471 State$ 6,9845344992552,50<strong>08</strong>00Base 01.5830.069.121.0342.0000SS 01.5910.069.211.0342.0000Ret 01.5910.069.221.0342.0000Hosp 01.5910.069.231.0342.0000Base 02.5830.069.181.0342.0000SS 02.5910.069.211.0342.0000Ret 02.5910.069.221.0342.0000Dental 02.5910.069.234.0342.0000Supplies 02.5830.801.412.0146.<strong>08</strong>20Travel 02.5830.801.332.0146.<strong>08</strong>20Base 01.5830.069.121.0342.0000SS 01.5910.069.211.0342.0000Ret 01.5910.069.221.0342.0000Hosp 01.5910.069.231.0342.0000Supp 02.5830.069.181.0342.0000SS 02.5910.069.211.0342.0000Ret 02.5910.069.221.0342.0000Hosp 02.5910.069.234.0342.0000Supplies 02.5830.801.412.0146.<strong>08</strong>20Travel 02.5830.801.332.0146.<strong>08</strong>2020<strong>08</strong>-09 MOE Amount CodeLess: one-time costfrom previous year2009-10($ 1,000)0.00 $ 10,572 LocalTotal: 11.00 $ 56,043Transition Counselor 11.00 $ 35,5412,7192,5384,9071 laptop computer,printer, and offi cesuppliesTravelLess: one-time costfrom previous year11.00 $ 45,705 State$ 6,9845344992552,50<strong>08</strong>00($ 1,000)0.00 $ 10,572 LocalTotal: 11.00 $ 56,277Base 01.5830.069.121.0342.0000SS 01.5910.069.211.0342.0000Ret 01.5910.069.221.0342.0000Hosp 01.5910.069.231.0342.0000Base 01.5830.069.181.0342.0000SS 01.5910.069.211.0342.0000Ret 01.5910.069.221.0342.0000Hosp 01.5910.069.231.0342.0000Supplies 02.5830.801.412.0146.<strong>08</strong>20Travel 02.5830.801.332.0146.<strong>08</strong>20*Note: Salary grade is based on 5 years of experience. Transition Counselor positionrequires a Master’s Degree in <strong>School</strong> Counseling and/or Master’s Degree in Social Work.Justification: Long-term suspensions continue to rise, just as the <strong>Wake</strong> <strong>County</strong> <strong>Public</strong><strong>School</strong> <strong>System</strong> (WCPSS) student population increases each year. Number of long-termsuspensions: 502 students during the 2000-2001 school year, 556 students during the2001-2002 school year, 672 students during the 2002-2003 school year, 774 studentsduring the 2003-2004 school year and 1,010 students during the 2004-2005 school year.This data justifi es the need for a new Transition Counselor position each year.196
Growth RequestsInitiative: AudiologistsAudiology is a required related service according to state and federallaw. Audiologists identify and manage the needs of students withhearing loss, manage the classroom amplifi cation needed by hearingimpaired students, and support regular and special education classroomteachers in meeting the educational needs of hearing impaired students.In addition, audiologists participate in child fi nd, conduct audiologicalevaluations and help teachers understand and manage varying degreesof hearing loss and amplifi cation.20<strong>08</strong>-09 MOE Amount CodeAudiologists 6.00$ 23,7593,2672,0681,9302,125116Total: 6.00 $ 33,265Base 02.5860.032.139.0136.<strong>08</strong>20Supp 02.5860.032.181.0136.<strong>08</strong>20SS 02.5910.032.211.0136.<strong>08</strong>20Ret 02.5910.032.221.0136.<strong>08</strong>20Hosp 02.5910.032.231.0136.<strong>08</strong>20Dental 02.5910.032.234.0136.<strong>08</strong>20Currently we employ 9 audiologists.Current Funding Formula:Current funding formula for adiology services is one audiologist per18,000 plus one per 100 students with identifi ed hearing loss. Thisformula is an average between recommendations made by the AmericanSpeech and Hearing Association (ASHA) and NCDPI.Using this formula, we will need to add a half-time (6 MOE) position for<strong>2007</strong>-<strong>08</strong>. We will need an additional 6 MOE for growth in 20<strong>08</strong>-09 and2009-10.Implementation Timeline & Budget Needed:<strong>2007</strong>-<strong>08</strong> MOE Amount Code2009-10Audiologists 6.00$ 23,7593,2672,0681,9302,231116Total: 6.00 $ 33,371Base 02.5860.032.139.0136.<strong>08</strong>20Supp 02.5860.032.181.0136.<strong>08</strong>20SS 02.5910.032.211.0136.<strong>08</strong>20Ret 02.5910.032.221.0136.<strong>08</strong>20Hosp 02.5910.032.231.0136.<strong>08</strong>20Dental 02.5910.032.234.0136.<strong>08</strong>20Audiologists 6.00 $ 23,7593,2672,0681,9302,024116Base 02.5860.032.139.0136.<strong>08</strong>20Supp 02.5860.032.181.0136.<strong>08</strong>20SS 02.5910.032.211.0136.<strong>08</strong>20Ret 02.5910.032.221.0136.<strong>08</strong>20Hosp 02.5910.032.231.0136.<strong>08</strong>20Dental 02.5910.032.234.0136.<strong>08</strong>20Total: 6.00 $ 33,164197 FY <strong>2007</strong>-<strong>08</strong> <strong>Plan</strong> for Student Success
Growth RequestsInitiative: High <strong>School</strong> Intervention CoordinatorsCurrent Funding Formula:Each large high school is allotted a 10-month position for High <strong>School</strong>Intervention Coordinator. Small Learning Community High <strong>School</strong>s andAlternative <strong>School</strong>s receive a 5-month position each. There was noallotment made for <strong>Wake</strong> Early College of Health and Science during<strong>2007</strong>-<strong>08</strong>.Implementation Timeline & Budget Needed:<strong>2007</strong>-<strong>08</strong> MOE Amount CodeIntervention Coordinator- <strong>Wake</strong> Early College ofHealth and Science, A02pay scale5.00 $ 16,1553,1741,4791,3802,024116Base 02.5830.072.121.0354.0000Supp 02.5830.072.181.0354.0000SS 02.5910.072.211.0354.0000Ret 02.5910.072.221.0354.0000Hosp 02.5910.072.231.0354.0000Dental 02.5910.072.234.0354.0000Total: 5.00 $ 24,32820<strong>08</strong>-09No new High <strong>School</strong>sTotal: 0.00 $ 02009-10Intervention Coordinator- Heritage High <strong>School</strong>10.00 $ 32,3106,3492,9572,7604,461232Base 02.5830.072.121.0354.0000Supp 02.5830.072.181.0354.0000SS 02.5910.072.211.0354.0000Ret 02.5910.072.221.0354.0000Hosp 02.5910.072.231.0354.0000Dental 02.5910.072.234.0354.0000Total: 10.00 $ 49,069198
Growth RequestsInitiative: Increase Extra Duty budget to accommodate new schoolsCurrent Funding Formula:Extra Duty positions are allotted to schools through an establishedformula. The dollar amounts below are calculated according to the 2006-07 extra duty salary schedule based on experience level C.GradeA:0-1YearsB:2-4YearsExtra Duty AssignmentsC:5-8YearsD:9-13YearsE:14-19YearsF:20+Years1 $ 402 $ 441 $ 482 $ 523 $ 563 $ 6091.5 609 665 723 786 849 9072 803 890 969 1,050 1,130 1,2103 1,210 1,331 1,450 1,572 1,698 1,8174 1,618 1,778 1,939 2,099 2,259 2,4215 2,018 2,220 2,421 2,626 2,826 3,0286 2,421 2,666 2,907 3,148 3,389 3,6357 2,826 3,1<strong>08</strong> 3,389 3,670 3,957 4,2378 3,229 3,550 3,876 4,197 4,518 4,8459 3,635 3,997 4,358 4,724 5,<strong>08</strong>6 5,468Notes:1) Extra Duty amounts are for a full year of service.2) The following positions are paid on the above scale three times per year: athleticdirectors, trainer/safety technician, assistant trainer/safety technician, HS choral musicdirectors, HS dance director, and HS drama director.3) The following positions are paid on the above scale two times per year: cheerleadingcoaches (including asst/JV).4) Years are relevant years in the extra duty activity.Extra Duty Grades by PositonAcademic Positions Elementary MiddleAG Production (magnet only) 1 NAGrade or Department Chairperson 1.5 1.5Testing Coordinator 5 5Student Support Team Coordinator 3 3Student Support Team Member 1.5 1.5Non-Athletic Activities Middle HighActivity Advisor 1 1Band Director (full-time) 3 8Band Director (other) 2 NAChoral Music Director 1.5 3Dance Director 1.5 1.5Drama Director 1.5 3Newspaper Advisor NA 3Set Designer 1 1Strings Director 2 2Student Council Advisor NA 3Yearbook Advisor NA 3199 FY <strong>2007</strong>-<strong>08</strong> <strong>Plan</strong> for Student Success
Growth RequestsAthletics Middle HighAthletic Director 3 8Baseball Coach (head) NA 5Baseball Coach (asst/JV) NA 3Basketball Coach 2 6Basketball Coach (JV) NA 3Cheerleading Coach 2 6Cheerleading Coach (asst/JV) NA 4Cross Country Coach NA 3“Flex” Assistant Coach NA 3Football Coach (head) 3 8Football Coach (asst/JV) 2 5Golf Coach NA 3Gymnastics Coach NA 3Soccer Coach 2 5Soccer Coach (asst/JV) NA 3Softball Coach 2 5Softball Coach (asst/JV) NA 3Swim Coach NA 5Team Leader 1 NAImplementation Timeline & Budget Needed:<strong>2007</strong>-<strong>08</strong> Amount CodeExtra Duty Salaries $ 89,9606,8826,42320<strong>08</strong>-09Total: $ 103,265Extra Duty Salaries $ 23,4001,7901,6712009-10Total: $ 26,861Extra Duty Salaries $ 31,2002,3872,268Total: $ 35,855Base 02.5100.853.199.0241.0000SS 02.5910.853.211.0241.0000Ret 02.5910.853.221.0241.0000Base 02.5100.853.199.0241.0000SS 02.5910.853.211.0241.0000Ret 02.5910.853.221.0241.0000Base 02.5100.853.199.0241.0000SS 02.5910.853.211.0241.0000Ret 02.5910.853.221.0241.0000Specifics<strong>2007</strong>-<strong>08</strong>: Three Elementary <strong>School</strong>s @ $7,800 per school = $23,400Two Middle <strong>School</strong>s @ $33,280 per school = $66,56020<strong>08</strong>-09: Three Elementary <strong>School</strong>s @ $7,800 per school = $23,4002009-10: Four Elementary <strong>School</strong>s @ $7,800 per school = $31,200---Budget code for above 02-5100-853-199-0241Tennis Coach NA 3Track Coach (head) 2 5Track Coach (asst/JV) NA 3Trainer/Safety Technician 3 8Trainer/Safety Technician (asst) NA 4Volleyball Coach (head) 2 4Volleyball Coach (JV) NA 3Wrestling Coach NA 5200
Growth RequestsInitiative: Human Resources (HR) PersonnelFund additional positions in Human Resources to meet the needs ofcurrent and prospective <strong>Wake</strong> <strong>County</strong> <strong>Public</strong> <strong>School</strong> <strong>System</strong> (WCPSS)employees, and to establish a basis for additional HR positions to beestablished as the school system grows.Current Funding Formula:Implementation Timeline & Budget Needed:<strong>2007</strong>-<strong>08</strong> MOE Amount CodeOracle ProcessingTechnician, Grade 23Workers’ CompensationTechnician, Grade 2812.0012.00$ 69,7075,3334,9778,0944648,000Base 02.6640.801.151.0109.0935SS 02.6910.801.211.0109.0935Ret 02.6910.801.221.0109.0935Hosp 02.6910.801.231.0109.0935Dental 02.6910.801.234.0109.0935Equip 02.6640.801.412.0109.09352009-10 MOE Amount CodeSenior AdministratorOracle ProcessingTechnician, Grade 23Staffi ng ProcessingTechnician, Grade 2312.0012.0012.00$ 74,20662,01910,4219,72613,38369611,000Total: 36.00 $ 181,451Base 02.6640.002.113.0109.0935Base 02.6640.801.151.0109.0935SS 02.6910.801.211.0109.0935Ret 02.6910.801.221.0109.0935Hosp 02.6910.801.231.0109.0935Dental 02.6910.801.234.0109.0935Equip 02.6640.801.412.0109.0935Total: 24.00 $ 96,57520<strong>08</strong>-09Senior AdministratorStaffi ng ProcessingTechnician, Grade 23Employee File RoomTechnician, Grade 21Applicant File RoomTechnician, Grade 22Processing Technicianfor Initially LicensedTeachers, Grade 23UnemploymentProcessing Technician,Grade 23Coordinating Teacherfor RecruitmentCoordinating Teacherfor Initially LicensedTeachers12.0012.0012.0012.0012.0012.0012.0012.00$ 72,395151,26790,11424,00420,24433,9921,62430,000Base 02.6640.002.113.0109.0935Base 02.6640.801.151.0109.0935Base 02.6640.801.139.0109.<strong>08</strong>35SS 02.6910.801.211.0109.0935Ret 02.6910.801.221.0109.0935Hosp 02.6910.801.231.0109.0935Dental 02.6910.801.234.0109.0935Equip 02.6640.801.412.0109.0935Contracted Services (58,240) 02.6640.801.311.0109.0935Total: 96.00 $ 365,400201 FY <strong>2007</strong>-<strong>08</strong> <strong>Plan</strong> for Student Success
Growth RequestsInitiative: Courier and delivery van to deliver intra-offi ce mail, small packages, and Board of Education (BOE) materialsCurrent Funding Formula:To provide courier service, which includes materials to schools andspecial deliveries, the following formula has been developed basedon current traffi c conditions, volume carried and driving distances. Theimportant parts in this formula are the required time to sort mail and packthe vehicle for the route and the distance schools are located from RockQuarry Road. It takes a minimum of one and one half hours each day tosort and pack the vehicles. Distance and traffi c impact delivery times. Wecurrently average 39.25 stops per driver each day. Each driver has sixand one half hours daily travel time. This allows ten minutes per stop.Formula: number of stops x 10 minutes per stop = total time (max 390minutes)We have 1,560 minutes of delivery time available. Currently our requireddelivery time totals 1,600 minutes. We will add at least nine new stopsnext year for at least another 90 minutes of delivery time. This does nottake into consideration the additional volume of mail to sort due to studentand teacher growth.Implementation Timeline & Budget Needed:<strong>2007</strong>- <strong>08</strong> MOE Amount CodeCourierGrade 1912.00 $ 29,7592,2772,1254,047232Base 02.6570.801.171.0229.0965SS 02.6910.801.211.0229.0965Ret 02.6910.801.221.0229.0965Hosp 02.6910.801.231.0229.0965Dental 02.6910.801.234.0229.0965Delivery van 16,900 04.9300.801.551.0229.096520<strong>08</strong>-09Total: 12.00 $ 55,340Remove one-time costfrom previous year($ 16,900) 04.9300.801.551.0229.0965Total: 0.00 ($ 16,900)202
Growth RequestsInitiative: Criminal Record ChecksTo increase funding for Contracted Services.N.C.G.S. 115C-332 required the Board of Education to adopt a policypertaining to Criminal Record Checks. As a result of the law our Boardapproved policy 2303/3003/4003 Criminal Record Checks states,“criminal record checks will be conducted on applicants and/or newlyhired employees, including substitutes.” The effect of the populationgrowth will have an enormous impact on the number of criminal recordchecks that we will be required to run. Not providing funding for actionthat is required by the Board per state law puts us in jeopardy of notcomplying with state and board mandates.Current Funding Formula:During the 2006-07 school year, <strong>Wake</strong> <strong>County</strong> <strong>School</strong>s employed8,091 teachers. The system experienced a 6.25 percent growth rate,which resulted in 506 new positions. In addition, the school system’s9.36 percent teacher turnover rate resulted in hiring 757 new teachers.At a minimum, this required the school system to run criminal recordchecks on 1,263 certifi ed staff alone during the 2006-07 school year.Please note, the teacher turnover rate and growth rate for the schoolsystem refl ects only teacher status. It does not refl ect all employeeson whom criminal record checks need to be run. We continue to seean increase in the hiring of support staff, including but not limited to busdrivers, cafeteria workers, custodians, clerical, and teacher assistants.We also run criminal record checks on all administrators. Therefore,the volume of criminal record checks we run on new employees, as wellas substitute applicants, has increased signifi cantly. With the openingof 14 new schools during this projection period, we anticipate a steadyincrease in employees, which will directly impact the number of criminalrecord checks we will be required to run.Growth Formula:$102,860 divided by A = B x 757 = C$102,860: Total dollars spent on criminal record checks during2005-06 school year.A: 3,064 (Total number of criminal record checks runduring 2005-06)B: $33.60 (Average dollar amount spent on each criminalrecord check during 2005-06 school year).757: Total number of teachers hired in 2006-07 due to 6.25%growth rate and 9.36% teacher turnover rate.C: Amount of increase requested for projection period per year.<strong>2007</strong>-<strong>08</strong>3,064 (criminal record checks ran in 05-06)x 1.0625 (assumes 6.25% growth in 06-07)x 1.0625 (assumes 6.25% growth rate 07-<strong>08</strong>)= 3,459 (total # of criminal record checks)x 33.60 (average cost per criminal record check)= $116,222 (budget for 07-<strong>08</strong>)-100,000 (06-07 budget for criminal record checks)= $16,222 (increase for <strong>08</strong>-09)20<strong>08</strong>-093,459 (criminal record checks ran)x 1.0626 (assumes 6.26% growth rate <strong>08</strong>-09)= 3,676 (total # of criminal record checks)x 33.60 (average cost per criminal record check)= $123,513 (budget for <strong>08</strong>-09)- $116,222 (06-07 budget for criminal record checks)= $7,291 (increase for <strong>08</strong>-09)2009-103,676 (criminal record checks ran)x 1.0637 (assumes 6.37% growth rate <strong>08</strong>-09)3,910 (total # of criminal record checks)x 33.60 (average cost per criminal record check)= $131,376 (budget for 09-10)203 FY <strong>2007</strong>-<strong>08</strong> <strong>Plan</strong> for Student Success
Growth Requests- 123,513 (<strong>08</strong>-09) budget for criminal record checks)= $7,863 (increase for 09-10)Implementation Timeline & Budget Needed:<strong>2007</strong>-<strong>08</strong> Amount CodeCriminal Records $16,222 02.6640.801.311.0109.093520<strong>08</strong>-09Criminal Records $ 7,291 02.6640.801.311.0109.09352009-10Criminal Records $ 7,863 02.6640.801.311.0109.0935204
Growth RequestsInitiative: Occupational Safety and Health Administration (OSHA) NurseTo increase the number of hours for the OSHA Nurse in order to conductadditional school audits; employee education; vaccinations; studentbloodborne; and First Aid Response training.Current Funding Formula:During the 2006-07 school year, <strong>Wake</strong> <strong>County</strong> <strong>School</strong>s employed 8,091teachers. The system experienced a 6.25 percent growth rate, whichresulted in 506 new positions. In addition, the school system’s 9.36percent teacher turnover rate resulted in hiring 757 new teachers. Theschool system continues to see an increase in growth in employeesas well as the addition of 14 new schools during this budget projectionperiod. The increased demand for school audits; employee education;vaccinations; student bloodborne; and First Aid Response training isevident, to ensure compliance with <strong>Wake</strong> <strong>County</strong> <strong>Public</strong> <strong>School</strong> <strong>System</strong>polices and applicable laws and regulations.2009-10 Amount CodeOSHA Nurse/BBP Training(4 schools opening)Total: $ 1,592$ 1,592 02.6640.801.311.0109.0935Growth Formula:$58,500 divided by A = B x C = D$58,500: OSHA Nurse yearly salaryA: 147 (number of schools in 2006-07)B: $398 (Average dollar amount spent per school)C: Number of schools opening during projection periodD: Amount of increase requested for projection periodImplementation Timeline & Budget Needed:<strong>2007</strong>-<strong>08</strong> Amount CodeOSHA Nurse/BBP Training(7 schools opening)$ 2,786 02.6640.801.311.0109.0935Total: $ 2,78620<strong>08</strong>-09OSHA Nurse/BBP Training(3 schools opening)$ 1,19402.6640.801.311.0109.0935Total: $ 1,194205 FY <strong>2007</strong>-<strong>08</strong> <strong>Plan</strong> for Student Success
Growth RequestsInitiative: Senior Budget AnalystCurrent Funding Formula:One Senior Budget Analyst for Conversions and Allotments.One Senior Budget Analyst for Federal Grants.The heavy workload associated with each of these areas is seasonal anddoes not overlap.We are requesting this position so that the processing time fortransactions can be reduced and the effi ciency of the department canbe increased. Transactions that used to have a two-day turnaround timecurrently have a six-day turnaround time due to increased volume andfi scal accountability procedures.2009-10 MOE Amount CodeLess: one-timecosts from previousyear($ 2,018)($ 2,000)Total: 0.00 ($ 4,018)02.6520.801.412.0139.096502.6520.801.412.0139.0965Adding a new position will also provide stability to the system in that wewill have two individuals processing conversions, allotments, and federalgrant transactions for the entire <strong>Wake</strong> <strong>County</strong> <strong>Public</strong> <strong>School</strong> <strong>System</strong>(WCPSS), whereas now we have one in each role.Implementation Timeline & Budget Needed:<strong>2007</strong>-<strong>08</strong> MOE Amount Code20<strong>08</strong>-09Total: 0.00 $ 0Senior BudgetAnalystComputer/Printer/Extra MemoryOffi ce Furniture andsetupTravelWorkshopsSupplies andMaterials12.00 $ 41,5333,1772,9664,2492322,0182,000752751,055Base 02.6520.801.148.0139.0965SS 02.6910.801.211.0139.0965Ret 02.6910.801.221.0139.0965Hosp 02.6910.801.231.0139.0965Dental 02.6910.801.234.0139.096502.6520.801.412.0139.096502.6520.801.412.0139.096502.6520.801.332.0139.096502.6930.801.312.0139.096502.6520.801.412.0139.0965Total: 12.00 $ 57,580206
Growth RequestsInitiative: Benefi ts TechnicianCurrent Funding Formula:None. Proposed formula is 1:1682 employees per benefi t technician.Presently, the workload per benefi t technician is 1:3552 employees.Implementation Timeline & Budget Needed:<strong>2007</strong>-<strong>08</strong> MOE Amount Code0.00 $ 0Total: 0.00 $ 020<strong>08</strong>-09Benefi ts TechnicianGrade 2312.00 $ 30,2552,3152,1604,2492322,050Base 02.6520.801.151.0195.0965SS 02.6910.801.211.0195.0965Ret 02.6910.801.221.0195.0965Hosp 02.6910.801.231.0195.0965Dental 02.6910.801.234.0195.0965Supplies 02.6520.801.412.0195.09652009-10Total: 12.00 $ 41,261Benefi ts TechnicianGrade 23Less: one-timecost from previousyear12.00 $ 30,8602,3612,2034,4612322,050(2,050)Base 02.6520.801.151.0195.0965SS 02.6910.801.211.0195.0965Ret 02.6910.801.221.0195.0965Hosp 02.6910.801.231.0195.0965Dental 02.6910.801.234.0195.0965Supplies 02.6520.801.412.0195.0965Total: 12.00 $ 40,117207 FY <strong>2007</strong>-<strong>08</strong> <strong>Plan</strong> for Student Success
Growth RequestsInitiative: Payroll TechniciansCurrent Funding Formula: 1:1,850 per payroll technicianCurrently the workload per payroll technician is 1:2,069. For <strong>2007</strong>-<strong>08</strong> anadditional position would bring the workload to 1:1,839. One additionalposition requested each year would align technicians with the currentworkload formula.Implementation Timeline & Budget Needed:<strong>2007</strong>-<strong>08</strong> MOE Amount Code20<strong>08</strong>-090.00 $ 0Total: 0.00 $ 0Payroll TechnicianGrade 2312.00 $ 30,2552,3152,1604,2492322,050Base 02.6520.801.151.0195.0965SS 02.6910.801.211.0195.0965Ret 02.6910.801.221.0195.0965Hosp 02.6910.801.231.0195.0965Dental 02.6910.801.234.0195.0965Supplies 02.6520.801.412.0195.09652009-10Total: 12.00 $ 41,261Payroll TechnicianGrade 23Less: one-time costfrom previous year12.00 $ 30,8602,3612,2034,4612322,050($ 2,050)Base 02.6520.801.151.0195.0965SS 02.6910.801.211.0195.0965Ret 02.6910.801.221.0195.0965Hosp 02.6910.801.231.0195.0965Dental 02.6910.801.234.0195.0965Supplies 0 2 .6 52 0. 8 01.412 .019 5.0 9 6 5Total: 12.00 $ 40,1172<strong>08</strong>
Growth RequestsInitiative: Director of CommunicationsTo create the position of Director of Communications to assist the ChiefCommunications Offi cer in the day to day management of the system’scommunications programs. The position would supervise fi ve senior administratorand two administrator positions. This position would be fundedfrom local dollars at the mid-point of the Director-level salary band.Current Funding Formula:None at the current time, local fundingImplementation Timeline & Budget Needed:<strong>2007</strong>-<strong>08</strong> MOE Amount CodeDirector ofCommunicationsOffi ce furniture, computer,one time initial set up12.00 $ 77,3105,9145,5204,0472326,500Base 02.6630.002.113.0120.0907SS 02.6910.002.211.0120.0907Ret 02.6910.002.221.0120.0907Hosp 02.6910.002.231.0120.0907Dental 02.6910.002.234.0120.0907Equip 02.6630.801.412.0120.0907Total: 12.00 $ 99,52320<strong>08</strong>-09Remove one-time costsfrom previous year($ 6,500)Total: ($ 6,500)209 FY <strong>2007</strong>-<strong>08</strong> <strong>Plan</strong> for Student Success
Growth RequestsInitiative: Communications Department - AdvertisingCurrent Funding Formula:Currently the system is spending $14,000 per year for costs associatedwith insertion fees to area newspapers and advertising of Board ofEducation public meetings, etc. to inform, engage and encourage thecommunity. The Communications Department has been informed by areamedia to expect an increase in the <strong>2007</strong>-<strong>08</strong> school year of approximately$2,500 based upon our current activity.Implementation Timeline & Budget Needed:<strong>2007</strong>-<strong>08</strong> Amount CodeAdvertising $ 2,500 02.6630.801.351.0120.0907Total: $ 2,500210
Growth RequestsInitiative: Child Nutrition Services (CNS)Current Funding Formula:The 2006-07 funding formula is based on 128,070 students attending the<strong>Wake</strong> <strong>County</strong> <strong>Public</strong> <strong>School</strong> <strong>System</strong> (WCPSS). By dividing the currentfunding by 128,070 students, the current revenue per student is $312. It isprojected that 136,068 students will attend WCPSS in <strong>2007</strong>-<strong>08</strong>,144,584students will attend WCPSS in 20<strong>08</strong>-09 and 153,794 students will attendWCPSS in 2009-10.<strong>2007</strong>-<strong>08</strong> Budget divided by 136,068 students = $319/student20<strong>08</strong>-09 Budget divided by 144,584 students = $313/student2009-10 Budget divided by 153,794 students = $306/student1) Growth: CNS is projecting 5.9 percent average annual growth inrevenues and expenses through fi scal year 2009-10. CNS is planning topurchase a delivery truck in the <strong>2007</strong>-<strong>08</strong> and 2009-10 school year. Thisplanned rotation should enable CNS to maintain the required deliveryschedules.2) Floating Managers: As additional year-round schools are added tothe system, CNS needs a ‘fl oating’ manager in each of the nine supervisorareas. Managers of traditional schools are required to take their vacationon teacher workdays. There are no teacher workdays in year-roundschools, therefore managers must take vacation when students areattending school and meals are being served. The ‘fl oating’ managerin each area will operate schools, while managers are on vacation oron extended sick leave. When schools are converted to a year-roundcalendar, existing 10-month positions change to 12-month positions. Atthis time, CNS is assuming all new elementary schools will be opened onthe year-round calendar.3) Net Asset Balance: In 2005, CNS successfully completed an updatingof equipment and redecorating of the Broughton High <strong>School</strong> cafeteriaat a cost of approximately $200,000. CNS plans to expand this programto an additional 3-5 schools during this budget period. CNS is in the veryearly planning stages of this program and is not prepared to announcethe total cost. However, very early estimates will be in the range from$750,000 to $1,000,000. When fi rm cost estimates are available, CNSmanagement will bring a proposal before the Board for approval.4) Delivery Truck: CNS is planning to purchase a delivery truck in the<strong>2007</strong>-<strong>08</strong> and 2009-10 school year. This planned rotation should enableCNS to maintain the required delivery schedules.Implementation Timeline & Budget Needed:“Projected Labor for New <strong>School</strong>s” for the next three school years bymonths of employment is shown below. Position names, months ofemployment, salary and benefi ts are shown. As indicated above,positions are subject to change depending upon the number of yearroundschools mandated by the Board of Education.Months of Employment <strong>2007</strong>- <strong>08</strong> 20<strong>08</strong>-09 2009-10Manager 48.00 36.00 58.00Assistant Manager 68.00 36.00 58.00Cashier/Assistant 154.00 54.00 112.00Driver 0.00 12.00 0.00Training Specialist 12.00 0.00 0.00Tech Clerical Asst. 12.00 0.00 0.00CNS Clerical Asst. 12.00 0.00 0.00F & R Clerical Asst. 12.00 0.00 0.00<strong>School</strong>s converting from traditional toyear-round calendar1<strong>08</strong>.00 0.00 0.00Total: 426.00 138.00 228.00211 FY <strong>2007</strong>-<strong>08</strong> <strong>Plan</strong> for Student Success
Growth RequestsExpense line items increased due to expected enrollment growth eachyear are:Months of Employment <strong>2007</strong>- <strong>08</strong> 20<strong>08</strong>-09 2009-10Labor/Benefi tsContracted ServicesTravelSupplies/MaterialsOther SuppliesFoodVehiclesIndirect Cost$ 2,538,73043,6761,1686,59666,672432,96450,468362,494$ 1,068,18244,9861,2046,79568,672445,953(50,000)156,9<strong>08</strong>$ 1,161,66746,3361,2396,99770,733459,33250,00<strong>08</strong>4,158Total: $ 3,502,768 $ 1,742,700 $ 1,880,462The above increases are based on historical trends of expenditures asthey relate to student enrollment growth.All revenue lines are increased due to enrollment growth. The unauditedFC-1A fi gures were used to determine percentages for each revenuecode.<strong>2007</strong>- <strong>08</strong> 20<strong>08</strong>-09 2009-10State ReimbursementUSDA GrantBreakfast SalesLunch SalesSupplemental SalesCatered Meals/SnacksSuppers/BanquetsInterest$ 3,7361,399,93253,765859,4611,101,26328,04711,79244,773$ 1,859696,49526,750427,599547,90113,9545,86722,275$ 2,006751,55328,865461,401591,21415,0566,33124,036Total: $ 3,502,769 $ 1,742,700 $ 1,880,462212
Growth RequestsInitiative: Utility budget increase for new square footage (SF)Traditional Year-Round<strong>2007</strong>-<strong>08</strong> 311,523 SF 618,247 SF20<strong>08</strong>-09 122,733 SF 544,792 SF2009-10 325,427 SF 615,916 SFCurrent Funding Formula:Continue funding at current funded rate of $1.39 per SFfor traditional SF.Continue funding at current funded rate of $1.65 per SFfor year-round SF.Implementation Timeline & Budget Needed:Year Traditional Year-Round Total<strong>2007</strong>-<strong>08</strong> $431,721 $1,023,719 (recurring) $1,455,44020<strong>08</strong>-09 $170,<strong>08</strong>9 $ 902,<strong>08</strong>8 (recurring) $1,072,1772009-10 $450,989 $1,019,860 (recurring) $1,470,849<strong>2007</strong>- <strong>08</strong> Current SFCurrentBudget2006-07Sys Costper SF2006-07Trad Costper SFTraditionalSF2006-07YR Costper SFYear-Round SFTraditionalCostYear-RoundCostElectric02.6540.802.321.0203.0980Natural Gas02.6540.802.322.0203.0980Other (W/Sew/Storm)02.6540.802.323.0203.0980LP/Oil02.6540.802.413.0203.0980Solid Waste02.6580.802.323.0297.<strong>08</strong>3018,414,661 $ 17,659,903 $ 0.96 $ 0.94 311,523 $ 1.12 618,247 $ 291,635 $ 691,53918,414,661 5,078,602 0.28 0.27 311,523 0.32 618,247 83,868 198,87218,414,661 2,288,804 0.12 0.12 311,523 0.14 618,247 37,797 89,62718,414,661 174,272 0.01 0.01 311,523 0.01 618,247 2,878 6,82418,414,661 941,210 0.05 0.05 311,523 0.06 618,247 15,543 36,857Total: $ 26,142,791 $ 1.42 $ 1.39 $ 1.65 $ 431,721 $ 1,023,719213 FY <strong>2007</strong>-<strong>08</strong> <strong>Plan</strong> for Student Success
Growth Requests20<strong>08</strong>-09 Current SFCurrentBudget2006-07Sys Costper SF2006-07Trad Costper SFTraditionalSF2006-07 YRCost per SFYear-RoundSFTraditionalCostYear-RoundCostElectric02.6540.802.321.0203.0980$ 0.96 $ 0.94 122,733 $ 1.12 544,792 $ 114,898 $ 609,376Natural Gas02.6540.802.322.0203.09800.28 0.27 122,733 0.32 544,792 33,042 175,243Other (W/Sew/Storm)02.6540.802.323.0203.09800.12 0.12 122,733 0.14 544,792 14,891 78,978LP/Oil02.6540.802.413.0203.09800.01 0.01 122,733 0.01 544,792 1,134 6,013Solid Waste02.6580.802.323.0297.<strong>08</strong>300.05 0.05 122,733 0.06 544,792 6,124 32,478Total: $ 1.42 $ 1.39 $ 1.65 $ 170,<strong>08</strong>9 $ 902,<strong>08</strong>82009-10Electric02.6540.802.321.0203.0980$ 0.96 $ 0.94 325,427 $ 1.12 615,916 $ 304,651 $ 688,932Natural Gas02.6540.802.322.0203.09800.28 0.27 325,427 0.32 615,916 87,611 198,122Other (W/Sew/Storm)02.6540.802.323.0203.09800.12 0.12 325,427 0.14 615,916 39,484 89,289LP/Oil02.6540.802.413.0203.09800.01 0.01 325,427 0.01 615,916 3,006 6,799Solid Waste02.6580.802.323.0297.<strong>08</strong>300.05 0.05 325,427 0.06 615,916 16,237 36,718Total: $ 1.42 $ 1.39 $ 1.65 $ 450,989 $ 1,019,860214
Growth RequestsInitiative: Custodial dollars to include housekeeping of new square footage (SF)Traditional Year Round<strong>2007</strong>-<strong>08</strong> 311,523 SF 618,247 SF20<strong>08</strong>-09 122,733 SF 544,792 SF2009-10 325,427 SF 615,916 SFCurrent Funding Formula:Continue funding at current-funded rate of $1.44 per SF for traditionalschools. Continue funding at current-funded rate of $1.46 per SF foryear-round schools.Implementation Timeline & Budget Needed:<strong>2007</strong>- <strong>08</strong> Traditional Year-Round Total CodeContractServices$ 450,000 $ 905,000 $1,355,000Less: Funds anticipated to be paid byCommunity <strong>School</strong>s($ 100,000)Total $1,255,000 01.6540.003.311.0264.<strong>08</strong>30 $579,40202.6540.003.311.0264.<strong>08</strong>30 $675,59820<strong>08</strong>-09ContractServices$ 180,000 $ 795,000 $ 975,000 01.6540.003.311.0264.<strong>08</strong>30 $975,00002.6540.003.311.0264.<strong>08</strong>30 $ 0$ 975,0002009-10ContractServices$ 470,000 $ 900,000 $ 1,370,000 01.6540.003.311.0264.<strong>08</strong>30 $761,92502.6540.003.311.0264.<strong>08</strong>30 $6<strong>08</strong>,075CustodialFieldSupervisorsMOE12.00 32,8393,2902,1784,46123212.00 $1 ,413,000Base 02.6540.003.176.0264.<strong>08</strong>30SS 02.6910.003.211.0264.<strong>08</strong>30Ret 02.6910.003.221.0264.<strong>08</strong>30Hosp 02.6910.003.231.0264.<strong>08</strong>30Dental 02.6910.003.234.0264.<strong>08</strong>30An additional custodial fi eld supervisor position will need to be added in2009-10 to supervise the operations of the new square footage.215 FY <strong>2007</strong>-<strong>08</strong> <strong>Plan</strong> for Student Success
Growth RequestsInitiative: Maintenance dollars to include maintenance of new square footage (SF)Traditional Year Round<strong>2007</strong>-<strong>08</strong> 311,523 SF 618,247 SF20<strong>08</strong>-09 122,733 SF 544,792 SF2009-10 325,427 SF 615,916 SFCurrent Funding Formula:Continue funding at current-funded rate of $0.96 per SF for traditionalschools. Continue funding at current-funded rate of $1.12 per SF foryear-round schools.Implementation Timeline & Budget Needed:<strong>2007</strong>- <strong>08</strong> Total CodeTraditional SF311,523$ 995,000Year-round SF618,247Less: Funds anticipatedto be paid byCommunity <strong>School</strong>sTotal($ 200,000)$ 795,000 60% to 02.6580.802.311.0296.<strong>08</strong>30 $477,00040% to 02.6580.802.311.0295.<strong>08</strong>30 $318,00020<strong>08</strong>-09Traditional SF122,733$ 730,000 60% to 02.6580.802.311.0296.<strong>08</strong>30 $438,00040% to 02.6580.802.311.0295.<strong>08</strong>30 $292,000Year-round SF325,427Total $ 730,0002009-10Traditional SF325,427$ 1,005,000 60% to 02.6580.802.311.0296.<strong>08</strong>30 $603,00040% to 02.6580.802.311.0295.<strong>08</strong>30 $402,000Year-round SF615,916Total $ 1,005,000216
Growth RequestsInitiative: Maintenance dollars to include landscape maintenance of new acreage<strong>2007</strong>-<strong>08</strong> 86 additional acres20<strong>08</strong>-09 97 additional acres2009-10 186 additional acresCurrent Funding Formula:The current funding rate is $1,940 per acre.Implementation Timeline & Budget Needed:<strong>2007</strong>-<strong>08</strong> Amount CodeContracted Services $ 167,000 02.6580.802.311.0288.<strong>08</strong>3020<strong>08</strong>-09Contracted Services $ 188,000 02.6580.802.311.0288.<strong>08</strong>302009-10Contracted Services $ 361,000 02.6580.802.311.0288.<strong>08</strong>30Grounds maintenance includes mowing grass, trimming shrubbery, BestManagement Practices (BMP) maintenance, keeping storm drain clean,removal of weeds in plant beds, trash removal from grounds, minor fencerepairs, minor pavement repairs and leaf removal. Funding requested isfor contracting this work.217 FY <strong>2007</strong>-<strong>08</strong> <strong>Plan</strong> for Student Success
Growth RequestsInitiative: Processing Technician in the Accounting Department for Bond ProgramCurrent Funding Formula:This is a new position to be funded with Bond Program Managementfunds.This position will provide timely processing of contractor payapplications.The invoice volume for the Building Program continues to grow asthe program budget of each program is growing and programs areoverlapping. Current staffi ng levels are insuffi cient to handle additionalwork.Implementation Timeline & Budget Needed:<strong>2007</strong>- <strong>08</strong> MOE Amount CodeProcessingTechnician12.00 $ 28,6562,1922,0464,047232Total: 12.00 $ 37,173Base 02.6520.857.151.0104.0965SS 02.6910.857.211.0104.0965Ret 02.6910.857.221.0104.0965Hosp 02.6910.857.231.0104.0965Dental 02.6910.857.234.0104.0965218
Growth RequestsInitiative: Integrated Pest Management (IPM)Environmental Health and Safety (EHAS) Department: Add two (2) IPMMaster Craftsman positions over the next 3 years. Each position is atSalary Grade 27 to comply with the <strong>School</strong> Children’s Health Act andincreased workload related to fi re ant and other pests. Provide equipmentneeded for each person to begin and continue work. Each of these two(2) positions is a 12-month yearly position.Current Funding Formula:2006-07 <strong>2007</strong>- <strong>08</strong> 20<strong>08</strong>-09 2009-10# of <strong>School</strong>s 147 153 156 161SQ Footage (schools) 17,984,735 19,032,188 21,948,537 22,889,880SQ Footage (admin) 429,926 429,926 429,926 429,926SQ Foot Total: 18,414,661 19,462,114 22,378,463 23,319,806Available Labor Hours/MonthActual Monthly Coverage (from current usage)236.8 236.8 236.8 236.8Labor Hours/SQ Foot 1.29 1.22 1.06 1.02Labor Hours/<strong>School</strong> 1.61 1.55 1.52 1.47Minimum Required Monthly Coverage (from industry standards)Labor Hours/SQ Foot 2.39 2.36 2.09 2.07Labor Hours/<strong>School</strong> 3.00 3.00 3.00 3.00Shortfall in Monthly CoverageLabor Hours/SQ Foot 1.11 1.14 1.03 1.06Labor Hours/<strong>School</strong> 1.39 1.45 1.48 1.53New Positions Needed 2.59 2.82 2.93 3.12Note: Requesting two new positions - one Mastercraftsmen to fi ll routineIPM work orders; one Mastercraftsman to serve as fi re ants specialist.Implementation Timeline & Budget Needed:<strong>2007</strong>-<strong>08</strong> MOE Amount Code20<strong>08</strong>-09Recurring Costs,Grade 272009-10Recurring Costs,Grade 270.00 $ 0Total: 0.00 $ 012.00 $ 37,5842,8752,6834,24923210,0004,5003,000Total: 12.00 $ 65,12312.00 $ 38,5232,9472,7514,46123210,0004,5003,000Total: 12.00 $ 66,414Base 02.6580.802.148.0243.0930SS 02.6910.802.211.0243.<strong>08</strong>30Ret 02.6910.802.221.0243.<strong>08</strong>30Hosp 02.6910.802.231.0243.<strong>08</strong>30Dental 02.6910.802.234.0243.<strong>08</strong>30Contract Svcs 02.6580.802.311.0243.0930Supplies 02.6580.802.412.0243.0930Training 02.6580.802.312.0243.0930Base 02.6580.802.148.0243.0930SS 02.6910.802.211.0243.<strong>08</strong>30Ret 02.6910.802.221.0243.<strong>08</strong>30Hosp 02.6910.802.231.0243.<strong>08</strong>30Dental 02.6910.802.234.0243.<strong>08</strong>30Contract Svcs 02.6580.802.311.0243.0930Supplies 02.6580.802.412.0243.0930Training 02.6580.802.312.0243.0930Expected Effect on Goal 2010:Any program output is a function of people. The number and kind ofpeople needed for even minimal pest management activities haschanged dramatically since FY 2005-06. Much as the public expectsmore than just instruction of its school system, both the public and the<strong>Wake</strong> <strong>County</strong> <strong>Public</strong> <strong>School</strong> <strong>System</strong> (WCPSS) itself expect more ofits IPM, Water Quality, and Safety Programs. In a shift occurring since2005, expectations of IPM staff are shifting from traditional pest control tomanaging the new dangerous pest problem of fi re ants, while continuingto perform traditional duties. The magnitude of the new problem is seen in219 FY <strong>2007</strong>-<strong>08</strong> <strong>Plan</strong> for Student Success
Growth Requestsseveral measures, yet the most signifi cant is the daily new interaction allpersons on school grounds have with fi re ants. Even a casual interactioncreates agonizing injury and can cause death. In addition, the NorthCarolina Legislature expects more of our environmental programs andstated its expectations in the “<strong>School</strong> Children’s Health Act” whose fullrequirements were implemented October 1, 2006. Even though notadopted yet by the <strong>School</strong> Board, this Act represents a mandated yetunfunded imperative with which WCPSS must comply. Adding and fi llingthese two (2) Positions will:1.Comply with legislative mandate.2.Create a full-time fi re ant control program for grounds andbuildings.3.Enable staff to manage pest control at new schools, year-roundconversion schools, and renovated schools.4.Allow staff to develop a pest management program integrated withsystem personnel and resources.The 2010 goal is creating safe, accessible, and healthful facilityenvironments while increasing citizen/school support. We present thisinitiative as a method for reducing the overall pest control costs, whilemeeting the goals and objectives of the WCPSS.Evidence or Reasoning for This Strategy:IPM has matured from a best management practice to a legislativelymandated program (<strong>School</strong> Children’s Health Act). The WCPSS was anational leader in IPM years in advance of the 2006 legislative interestand received many awards in recognition of their efforts. The WCPSSlong ago established a modest yet effective Integrated Pest Managementprogram. The program was effective because the pest problems wereroutine and because the program was created to serve the school systemsized at the time of program establishment. The program has functionedat its establishment level since inception even though the square footageof schools it serves has increased by nearly 50 percent with no increasein IPM staffi ng. By implementing a call and rotation system, existing staffnow perform at 130 percent of work output compared to a few yearsago, even while school grounds and building areas subject to pestmanagement continue to increase. The workload has increased to thepoint staff will no longer readily be able to meet previous service levels.The graph below shows in the exponential increase in Maximo WorkOrders for the new problem of fi re ants.4003002001000Maximo Work Orders (Pest Management)Projectionbased on1st quarterof 200603-04 04-05 05-06 06-07That represents a doubling in fi led, offi cial requests each year…a ratethat is now expected to increase faster because that rate is tied to newconstruction (that imports fi re ants), year-round school conversion andbecause the growth rate of pests is exponential.Traditional budgeting assumes a geometric rate of increase. The fl awin budgeting on that assumption shows up when looking at invoicerecords for ant control chemicals. In 2001 no control chemicals werebought. In 2003-04 two bags of chemical were bought. In 2005-06, 172bags were bought. For <strong>2007</strong>-<strong>08</strong> a justifi cation for nearly 1,500 bags ofchemical is presented. Chemicals by themselves are of no use…eachpound or treatment of chemical requires a licensed IPM technician, avehicle, application equipment, time to apply chemical, meet humancontact and notifi cation requirements, data management devices andrecording time to comply with federal record keeping requirements. Themore time that is spent on fi re ant control, the less time that is availableto spend on all other pest management. This currently forces IPM staffto choose between work that reduces the risk of human injury and workthat reduces unwanted invasions by lesser pests such as cockroaches.Of course, preserving human life and preventing injury must win overcockroach sightings.220
Growth RequestsThe effects created converging, competing demands as staff racesfrom school to school to try to keep current with fi re ant demands allowsfewer and fewer hours that can be spent at any one school. Even longestablished preventive maintenance schedules that allowed effi cientArea and Regional focus by the three existing technicians are now beingeffectively abandoned, because most fi re ant calls are emergency callsand require immediate response from wherever an IPM staff member islocated when the call is received. This means that staff is having to dropwhat they are doing, drive across the county, attend to a time-consumingand dangerous pest problem, and hope to resume their regular workduties and schedule the next day. Unfortunately, the same thing happensthe next day. This is reducing time each staff person can spend at any oneschool to approximately an hour and a half per month, when a minimumof three hours are required for the most routine pest management andassistance to school staff, not including fi re ant control.school system. It is expected that the safety and health of the studentsand staff who occupy WCPSS’s facilities must be preserved so that theycan continue to focus on teaching and learning.Legal Implications (if any):Failure to act with due diligence in response to known hazards placesWCPSS in a position of being negligent, per se. Because of the rapidincrease in fi re ant invasions of our facilities with resulting known studentinjury, and because of the known relation of insects and food borne illness,a proactive response to these hazards is needed. Also, the increase innew school construction, year-round school conversion and old schoolrenovation will create more human-to-pest interactions. Failure to act inthe face of these hazards will subject WCPSS to unnecessary risk.Requested staff will be fi lled with licensed Pest Control Operators. Oneposition will be dedicated to fi re ant control, including wide area controlsuch as football fi elds and playgrounds. This is a specialized activity thatcan no longer be performed by athletic coaches. It requires close timingand scheduling with proposed fi eld use, thus must be attended to by aperson not subject to being pulled off a task by emergency calls. Theother requested position will allow creation of an IPM system in which onetechnician works within one assigned Region, which mimics the currentMaintenance and Operations (M&O) Department system. Further, theclose relationship of the person to the Region allows the technician toreally “know” the problems in his/her Region and effi ciently attend tothose problems. We show a vital need for three more positions .This initiative is further accelerated by the <strong>School</strong> Children’s Health Actrequirements. These are explicit legislative imperatives to comply withpublic expectations of public school facilities. Without the requested two(2) additional staff positions, WCPSS will experience unwanted insect,rodent, bird, bat and other small animal invasions. These invasionsare detrimental to health and damage property and erode the studentteachereducational environment. Dollars spent on IPM maintain ateaching environment conducive to undisturbed learning and do so atpeak effi ciency by leveraging teaching and administrative dollars andeffort. Environmental dollars create the best physical environment forlearning and maintaining the environment for all who interact with the221 FY <strong>2007</strong>-<strong>08</strong> <strong>Plan</strong> for Student Success
Growth RequestsInitiative: Bus DriversBus Drivers – an additional 30 positions for 6 new schools, two 9th gradecenters, and additional growth for <strong>2007</strong>-<strong>08</strong>, 3 new schools for 20<strong>08</strong>-09,and 5 new schools for 2009-10. The addition of Nextels for new busdriver staff. Increase in MOE (months of employment) for drivers at newyear-round schools.Current Funding Formula:Start-up routes for all new schools are as follows:Elementary schools = 8 routesMiddle schools = 15 routesHigh <strong>School</strong>s = 15 routesYear-round schools hire 12-month drivers and traditional schools hire10-month drivers.For new positions, use the 7 standard hours and the beginning salary of$11.49 for 240 days.Addition of Nextels for all new bus drivers:$15.97 per phone per month for no cellular use -$15.97 x 30 x 12 = $5,749$15.97 x 24 x 12 = $4,599$15.97 x 42 x 12 = $8,049Increase in Months of EmploymentNorthern Area needs:63 10-month positions will go to 12-month positions = 126 additionalmonthsWestern Area needs:84 10-month positions will go to 12-month positions = 168 additionalmonthsSouthern Area needs:40 10-month positions will go to 12-month positions = 80 additionalmonths12 month positions use 7 standard hrs and mid point range for salary$12.85grow and add schools, additional drivers will need to be hired to handleadditional routes.• <strong>2007</strong>-<strong>08</strong> has 5 new school sites being opened - 3 year-round elementaryschools, and 2 year-round middle schools. Requests for drivers aredone on a school-by-school basis based on geographical locations andbus tiers. It has been determined that the 3 new elementary schoolsopening in <strong>2007</strong>-<strong>08</strong> can be absorbed into existing routes, thus enhancingthe effi ciency of existing runs.• The two new middle schools for <strong>2007</strong>-<strong>08</strong> will require the addition of 15routes per school or 30 positions for 12 months each.• Two ninth grade centers at <strong>Wake</strong>fi eld and <strong>Wake</strong> Forest will be absorbedinto the existing routes.• 20<strong>08</strong>-09 will follow the formula of 8 routes per elementary school (12-month positions).• 2009-10 will follow the formula of 8 routes per elementary (12-monthpositions) and 15 routes per high school (10-month positions)Communication between drivers and managers is essential to the effi cientoperation of a large bus fl eet. This instant communication allows fasterresponse for any type of emergency and increases the safety levels forstudents and staff.As <strong>Wake</strong> <strong>County</strong> <strong>Public</strong> <strong>School</strong> <strong>System</strong> (WCPSS) continues to grow andadd year-round schools, additional drivers will need to be converted from10 to 12-month drivers in <strong>2007</strong>-<strong>08</strong> to handle addition of routes and rundays. As the growth of year-round schools continues, more 10-monthdrivers must now drive 12 months.As the <strong>Wake</strong> <strong>County</strong> <strong>Public</strong> <strong>School</strong> <strong>System</strong> (WCPSS) continues to222
Growth RequestsImplementation Timeline and Budget Needed:<strong>2007</strong>-<strong>08</strong> MOE Amount Code*Increased MOE=374 months/12 = 31.16 positions7 hrs. x 12.85 x 240 days x 31.16 positions = $672,682Increased MOE*Bus Drivers374.00 $ 672,68251,46148,029374.00 $ 772,172 StateBase 01.6550.056.171.0225.0000SS 01.6910.056.211.0225.0000Ret 01.6910.056.221.0225.0000Since this is an addition of MOE only, no additional benefi ts are needed.*Using an average salary rate for conversion of existing drivers, since most drivers are ona higher step on the salary scale than 00.Bus Drivers 360.00 $ 579,09644,30141,347121,4106,9605,749360.00 $ 798,863 LocalTotal: 734.00 $ 1,571,035Base 02.6550.056.171.0225.0000SS 02.6910.056.211.0225.0000Ret 02.6910.056.221.0225.0000Hosp 02.6910.056.231.0225.0000Dental 02.6910.706.234.0225.0000Nextels 02.6550.056.311.0225.0980Expected Effect on Goal 20<strong>08</strong>:On-time delivery of students to school enhances teaching and learning.Fast and reliable communication in case of emergency helps buspersonnel to keep buses moving and on schedule to promote teachingand learning for all students. This ability for bus drivers to haveimmediate communication when the need arises also helps retain theseemployees.20<strong>08</strong>-09Bus Drivers 288.00 $ 463,27735,44133,078101,976Base 01.6550.056.171.0225.0000SS 01.6910.056.211.0225.0000Ret 01.6910.056.221.0225.0000Hosp 01.6910.056.231.0225.0000Legal Implications (if any):None288.00 $ 633,772 State5,5684,599Dental 02.6910.706.234.0225.0000Nextels 02.6550.056.311.0225.09802009-100.00 $ 10,167 LocalTotal: 288.00 $ 643,939Bus Drivers 534.00 $ 814,18162,28558,133209,667Base 01.6550.056.171.0225.0000SS 01.6910.056.211.0225.0000Ret 01.6910.056.221.0225.0000Hosp 01.6910.056.231.0225.0000534.00 $ 1,144,266 State10,9048,049Dental 02.6910.706.234.0225.0000Nextels 02.6550.056.311.0225.09800.00 $ 18,953 LocalTotal: 534.00 $ 1,163,219223 FY <strong>2007</strong>-<strong>08</strong> <strong>Plan</strong> for Student Success
Growth RequestsInitiative: Exceptional Children (EC) Pupil Contract TransportationCurrent Funding Formula:Current budget for 2006-07 $10,646,321Data for these children has not been tracked in prior fi scal years; we areusing the overall WCPSS student enrollment growth rate of 6.28 percentfor budgeting purposes. On-going data analysis will be done throughoutfi scal year 2006-07 to determine a more accurate funding formula andgrowth rate for this sub population of EC.The transport of Exceptional Children is regulated by various State andFederal regulations that WCPSS is required to follow. IEPs (IndividualEducation <strong>Plan</strong>s) which are initiated by the Exceptional Children’s areaare the trigger for growth in this population of students.2009-10 Amount CodeExceptional Children PupilContract Transportation$ 536,192 01.6550.056.331.0225.<strong>08</strong>80$ 536,192 State$ 219,009 02.6550.056.331.0225.<strong>08</strong>80$ 219,009 LocalTotal: $ 755,201In fi scal year <strong>2007</strong>-<strong>08</strong>, the contract for EC Transportation will be goingout for bid.Implementation Timeline & Budget Needed:It is estimated that $7,841,104 (71 percent) will be covered by Statedollars. The remaining balance of $3,287,641 (29 percent) will be paidfrom local dollars. This percentage ratio is being used to divide thebudget between State and Local dollars.<strong>2007</strong>-<strong>08</strong> Amount CodeExceptional Children PupilContract Transportation$ 192,483 01.6550.056.331.0225.<strong>08</strong>80$ 192,483 State$ 476,106 02.6550.056.331.0225.<strong>08</strong>80$ 476,106 LocalTotal: $ 668,58920<strong>08</strong>-09Exceptional Children PupilContract Transportation$ 504,509 01.6550.056.331.0225.<strong>08</strong>80$ 504,509 State$ 206,067 02.6550.056.331.0225.<strong>08</strong>80$ 206,067 LocalTotal: $ 710,576224
Growth RequestsInitiative: Bus Driver SubstitutesTwenty-fi ve new full-time bus driver substitute positions are needed dueto increase in buses on the road to 890 in <strong>2007</strong>-<strong>08</strong> and the conversion of22 schools to year round, 17 new full-time bus substitute driver positionsdue to increase of buses on the road to 942 in 20<strong>08</strong>-09, and 17 new fulltimebus driver substitute positions needed due to the increase of buseson the road to 996. Also the addition of Nextels for all positions.Current Funding Formula:10% absentee rate (monthly)890 x 10% absentee rate = 89 full-time subs89 – current staff of 40 = 49Projected number of buses on the road:• <strong>2007</strong>-<strong>08</strong> – 890• 20<strong>08</strong>-09 – 942• 2009-10 – 996Addition of Nextels for all full-time substitute drivers• $15.97 per phone per month for no cellular use• $15.97 x 25 x 12 = $4,791This request is being divided over three years to reach our goal of 99full-time substitutes by 2009-10.Full-time substitutes are necessary for all schools. A suffi cient substitutepool allows full-time drivers to take vacation and allows area managersto keep their districts functioning effi ciently with knowledgeable staffready to step in for vacant routes. We anticipate a need for more fulltimesubstitutes this year due to the conversion of the 22 schools.Currently there are 40 full-time substitute drivers for all schools. As thebus fl eet continues to grow and more and more schools are convertedto year-round, additional substitutes will be needed. This will also allowthe 42 lead drivers to stop driving buses.Communication between drivers and managers is essential to theeffi cient operations of a large bus fl eet. This instant communicationallows faster response for any type of emergency and increases thesafety levels for students and staff.Implementation Timeline & Budget Needed:<strong>2007</strong>-<strong>08</strong> MOE Amount CodeBus Driver Substitutes 300.00 $ 413,64031,64329,534101,1755,8004,79120<strong>08</strong>-09Total: 300.00 $ 586,583Bus Driver Substitutes 204.00 $ 281,27521,51820,<strong>08</strong>372,2333,9443,2582009-10Total: 204.00 $ 402,311Bus Driver Substitutes 204.00 $ 281,27521,51820,<strong>08</strong>375,8373,9443,258Total: 204.00 $ 405,915Base 02.6550.056.172.0225.0000SS 02.6910.056.211.0225.0000Ret 02.6910.056.221.0225.0000Hosp 02.6910.056.231.0225.0000Dental 02.6910.706.234.0225.0000Nextels 02.6550.056.311.0225.0980Base 02.6550.056.172.0225.0000SS 02.6910.056.211.0225.0000Ret 02.6910.056.221.0225.0000Hosp 02.6910.056.231.0225.0000Dental 02.6910.706.234.0225.0000Nextels 02.6550.056.311.0225.0980Base 02.6550.056.172.0225.0000SS 02.6910.056.211.0225.0000Ret 02.6910.056.221.0225.0000Hosp 02.6910.056.231.0225.0000Dental 02.6910.706.234.0225.0000Nextels 02.6550.056.311.0225.098011.49 per hr x 6 hrs per day x 240 days x 25 = $413,64011.49 per hr x 6 hrs per day x 240 days x 17 = $281,27511.49 per hr x 6 hrs per day x 240 days x 17 = $281,275225 FY <strong>2007</strong>-<strong>08</strong> <strong>Plan</strong> for Student Success
Growth RequestsInitiative: Oil, Fuel, Tires, and Bus Parts and SuppliesCurrent Funding Formula:The mileage driven last fi scal year for school buses was 15,291,182miles. The addition of new schools for 2006-07 is estimated to addan additional 451,685 or a three percent increase. This three percentmileage increase will be used as part of the projected increase in oil,tires, and fuel cost.Tires, Parts, and Fuel were all reduced by the projected TD-19 Statereimbursement formula.Code: 01.6550.056.414.0225.0980 - Oil15,742,867 x 1.03 = 16,215,153 miles16,215,153/6000 x 32 qts. x 1.25 = $1<strong>08</strong>,101Code: 01.6550.056.415.0225.0980 – Tires16,215,153/20000 = 811(recaps)16,215,153/25000 = 649 (new tires)811 x 4 recaps x 129.35 = $419,611*649 x 2 new x 235.62 = $305,534*An increase in cost of tires is expected in fi scal year <strong>2007</strong>-<strong>08</strong> due to the factthat fewer tires will be bought in 2006-07. This is due to the purchase of 76 newschool buses. It is the common practice to remove new tires from the rear of newbuses and replace with recaps. This reserve of new tires will be exhausted thiscurrent fi scal year. This has also allowed <strong>Wake</strong> <strong>County</strong> <strong>Public</strong> <strong>School</strong> <strong>System</strong>(WCPSS) to have tires readily available for unexpected repairs and not beadversely affected by the current tire company strike.Code:01.6550.056.417.0225.0980 – Fuel**16,215,153/6.6 x $1.97 = $4,839,977This percentage ratio is being used to divide the budget between Stateand Local dollars.<strong>2007</strong>-<strong>08</strong> Amount CodePurchase of Oil, Fuel,Tires, and Bus Parts andSupplies20<strong>08</strong>-09Purchase of Oil, Fuel,Tires, and Bus Parts andSupplies2009-10$ 17,15881,464230,679103,062$ 432,363 State10,5009,1866,541$ 26,227 LocalTotal: $ 458,590$ 25,51120,965145,19911,561180,168$ 383,404 State10,81510,0137,129$ 27,957 LocalTotal: $ 411,361Oil 01.6550.056.414.0225.0980Tires 01.6550.056.415.0225.0980Fuel 01.6550.056.417.0225.0980Parts 01.6550.056.416.0225.0980Fuel 02.6550.706.417.0225.0980Supplies 02.6550.706.412.0225.0980Parts 02.6550.706.416.0225.0980Oil 01.6550.056.414.0225.0980Tires 01.6550.056.415.0225.0980Fuel 01.6550.056.417.0225.0980Supplies 01.6550.056.412.0225.0980Parts 01.6550.056.416.0225.0980Fuel 02.6550.706.417.0225.0980Supplies 02.6550.706.412.0225.0980Parts 02.6550.706.416.0225.0980**Fuel costs are in constant fl ux. It is expected that costs will rise during thecurrent fi scal year. Request is being lowered by expected reimbursementthrough TD-19 of $124,000.Implementation Timeline & Budget Needed:It is estimated that $7,841,104 (71 percent) will be covered by Statedollars. The remaining balance of $3,287,641 (29 percent) will be paidfrom local dollars.Purchase of Oil, Fuel,Tires, and Bus Parts andSupplies$ 4,00921,611149,55612,602196,384$ 384,162 StateOil 01.6550.056.414.0225.0980Tires 01.6550.056.415.0225.0980Fuel 01.6550.056.417.0225.0980Supplies 01.6550.056.412.0225.0980Parts 01.6550.056.416.0225.0980226
Growth Requests2009-1011,13910,9147,771Fuel 02.6550.706.417.0225.0980Supplies 02.6550.706.412.0225.0980Parts 02.6550.706.416.0225.0980Legal Implications (if any):None$ 29,824 LocalTotal: $ 413,986Expected Effect on Goal 20<strong>08</strong>:Maintenance and repair of buses is critical in delivering students toschool on time. On time school delivery enhances teaching and learningfor students and teachers.Evidence or Reasoning for this Strategy:Budget request is based on oil changes every 6,000 miles. Otherprojected years will use 5,000 miles.32 quarts are used per oil changecost per quart is 1.25Tire changes occur every 15,000 miles for recaps and every 25,000 milesfor new tires6 tires per change (4 recaps and 2 new)average price per recap = 129.35average price per new = 235.62Fuel average cost - $1.97 per gal.Average bus fuel usage is 6.6 miles per gal.16,215,153/6.6 x 1.97 = 4,839,977Since the cost of fuel is extremely volatile, our projected cost could behigher or lower. Due to current trends, this cost may increase before thebudget is fi nalized.In an effort to keep cost down, no increases will be requested for <strong>2007</strong>-<strong>08</strong> in Fund 1 supplies. The increase noted for bus parts of $103,062 isa reallocation of savings from license fees for buses. Future projectionswill use a 9 percent growth rate. Local request for supplies, fuel, andparts all use the 9 percent as an increase.227 FY <strong>2007</strong>-<strong>08</strong> <strong>Plan</strong> for Student Success
Growth RequestsInitiative: Activity BusesCurrent Funding Formula:$68,155 Cost per bus (base cost)985 Rear heater469 Door locks1,651 Overhead luggage rack$71,260 TotalProjected increase for future years 5 percentThe purchase of additional activity buses was decided by a committeeformed in 2004-05 and comprised of staff from Instructional ServicesDivision (ISD), Operation Services and <strong>Wake</strong> <strong>County</strong> Division ofPrincipals. After an initial purchase of 10 activity buses, it was decidedto continue purchase at a level of 6 per year. As the district continuesto grow, additional activity buses will be required to maintain servicelevels and replace high mileage activity buses in the fl eet. Due to budgetconstraints for <strong>2007</strong>-<strong>08</strong> we will purchase only 5 buses. One bus will bepurchased using designated fund balance while the other 4 buses will bepart of this budget request.Implementation Timeline & Budget Needed:<strong>2007</strong>-<strong>08</strong> Amount Code4 activity busesLicense/title fees20<strong>08</strong>-096 activity busesLicense/title fees$ 285,0404,024Total: $ 289,064$ 427,5606,03604.9300.801.551.0225.<strong>08</strong>8002.6550.706.691.0225.098004.9300.801.551.0225.<strong>08</strong>8002.6550.706.691.0225.0980Less: one-time cost from previous year ($ 289,064)2009-10Total: $ 144,5326 activity busesLicense/title fees$ 427,5606,03604.9300.801.551.0225.<strong>08</strong>8002.6550.706.691.0225.0980Less: one-time cost from previous year ($433,596)Total: $ 0228
Growth RequestsInitiative: Bus Safety AssistantsTwelve new bus safety assistants (seven @10 months and fi ve @12months).Current Funding Formula:• 12 new positions (12 percent growth over current year)• Seven vacancies to be fi lled in current year (Individual Education<strong>Plan</strong>s ((IEPs) requiring these positions).Since the needs for these positions is wholly dependent upon individualIEPs and needs of the exceptional child, future projections will be fora minimum of six positions per year. Each year will require furtherevaluation of the Exceptional Children’s population and needs.These positions were budgeted last year by the Exceptional Children’sDepartment. They have been transferred to the TransportationDepartment for fi scal year beginning 2006-07. Positions budgeted werenot suffi cient to cover the needs in this fi scal year and additional positionshave been added. The continued rapid growth of this student populationis driving the increase in these staff positions.The IEPs for Exceptional Children determines the need for additionalsafety assistants. IEPs happen throughout the school year based on theindividual needs of students. This creates a growth rate that cannot becontrolled by the Transportation Department. We must respond to therequests for additional safety assistants when the need is identifi ed forthe individual child.Implementation Timeline & Budget Needed:<strong>2007</strong>-<strong>08</strong> MOE Amount CodeBus Safety Assistants- 130 new monthsplus funding for 70months covered bylapsed salaries inprevious year.20<strong>08</strong>-09130.00 $ 163,66612,52011,68648,5642,784Total: 130.00 $ 239,220Bus Safety Assistants 60.00 $ 69,2215,2954,94225,4941,3922009-10Total: 60.00 $ 106,344Bus Safety Assistants 60.00 $ 69,2215,2954,94226,7661,392Total: 60.00 $ 107,616Base 02.6550.706.199.0136.<strong>08</strong>80SS 02.6910.706.211.0136.<strong>08</strong>80Ret 02.6910.706.221.0136.<strong>08</strong>80Hosp 02.6910.706.231.0136.<strong>08</strong>80Dental 02.6910.706.234.0136.<strong>08</strong>80Base 02.6550.706.199.0136.<strong>08</strong>80SS 02.6910.706.211.0136.<strong>08</strong>80Ret 02.6910.706.221.0136.<strong>08</strong>80Hosp 02.6910.706.231.0136.<strong>08</strong>80Dental 02.6910.706.234.0136.<strong>08</strong>80Base 02.6550.706.199.0136.<strong>08</strong>80SS 02.6910.706.211.0136.<strong>08</strong>80Ret 02.6910.706.221.0136.<strong>08</strong>80Hosp 02.6910.706.231.0136.<strong>08</strong>80Dental 02.6910.706.234.0136.<strong>08</strong>80229 FY <strong>2007</strong>-<strong>08</strong> <strong>Plan</strong> for Student Success
Growth RequestsInitiative: Bus MechanicsCurrent Funding Formula:Classifi cation of mechanics:• Regular shop mechanics who deal with PMs (preventivemaintenance) only - total of 17. Ratio to total fl eet - 835/17 =1:49 (current ratio).• Road mechanics who deal with complaint sheets completed bydrivers, 30-day inspections, and breakdowns at district sites -total of 19. Ratio to total fl eet - 835/19 = 1:44 (current ratio).• The State recommended ratio for the road mechanics is 1:35.The addition of these six positions would allow us to get closerto this level. The current year request does not address the ratioof shop mechanics. Our future goal would bring this ratio to thesame level in the next fi scal year.• The projected bus fl eet will grow to 942 by 20<strong>08</strong>-09.This request is in conjunction with a request to purchase service trucksfor road mechanics. It is expected that the current more experiencedshop mechanics would be converted into road mechanics to service thebuses at sites eliminating the need to run them to Rock Quarry. Thisprovides more timely maintenance on the buses and keeps down time toa minimum. Additional shop mechanics would then need to be hired tofi ll the vacancies left from this shift in employees.• $19.47 per phone per month for restricted cellular use• Uniform cost of $10.00 per month per employee for twelve monthsShortage of mechanics has resulted in preventive and routine maintenancenot being performed on schedule. As the size of the bus fl eet continuesto grow and buses continue to age, we must keep adding mechanics tohandle this growth and to keep our buses operating in a safe manner forall students.Implementation Timeline & Budget Needed:<strong>2007</strong>-<strong>08</strong> MOE Amount CodeBus Mechanic 72.00 $ 171,93513,15312,27624,28272020<strong>08</strong>-0972.00 $ 222,366 State1,3921,4020.00 $ 2,794 LocalTotal: 72.00 $ 225,160Bus Mechanic 72.00 $ 171,93513,15312,27625,4947202009-1072.00 $ 223,578 State1,3921,4020.00 $ 2,794 LocalTotal: 72.00 $ 226,372Bus Mechanic 96.00 $ 229,24717,53716,36835,688960Base 01.6550.056.165.0225.0980SS 01.6910.056.211.0225.0980Ret 01.6910.056.221.0225.0980Dental 01.6910.056.231.0225.0980Uniforms 01.6550.056.311.0225.0980Dental 02.6910.706.234.0225.0980Nextel 02.6550.056.311.0225.0980Base 01.6550.056.165.0225.0980SS 01.6910.056.211.0225.0980Ret 01.6910.056.221.0225.0980Hosp 01.6910.056.231.0225.0980Uniforms 01.6550.056.311.0225.0980Dental 02.6910.706.234.0225.0980Nextel 02.6550.056.311.0225.0980Base 01.6550.056.165.0225.0980SS 01.6910.056.211.0225.0980Ret 01.6910.056.221.0225.0980Hosp 01.6910.056.231.0225.0980Uniforms 01.6550.056.311.0225.098096.00 $ 299,800 State$1,8561,869Dental 02.6910.706.234.0225.0980Nextel 02.6550.056.311.0225.09800.00 $ 3,725 LocalTotal: 96.00 $ 303,525230
Growth RequestsInitiative: Salary differential increase for bus drivers, full-time bus driver substitutes, and bus driver leads making over the State maximum hourly ratefor bus driversCurrent Funding Formula:Expenditures from the prior fi scal year are being compared to current.The average percentage of growth will be used as a basis for increasingthese funds. This average percentage rate is 14 percent.Salary Differential 2005-06 2006-07 % IncreaseDrivers and full-time substitutesOctober 71,013.92 83,281.41 0.17September 53,128.61 60,261.41 0.13August 44,587.06 49,546.23 0.11.Implementation Timeline & Budget Needed:<strong>2007</strong>-<strong>08</strong> Amount CodeSalary Differential $ 123,0059,41<strong>08</strong>,783Base 02.6550.706.187.0225.0000SS 02.6910.706.211.0225.0000Ret 02.6910.706.221.0225.0000Total: $ 141,198231 FY <strong>2007</strong>-<strong>08</strong> <strong>Plan</strong> for Student Success
Growth RequestsInitiative: Transportation District at KnightdaleCurrent Funding Formula:District staffi ng One Operations ManagerTwo Bus Operations Team Leaders• Buses per district: 50 to 60• Supplies $600/person• Computer $1,000/person• Staff Vehicle for Operations Manager $15,355• $19.47/phone per month for Restricted Cellular UseGrowth in the East <strong>Wake</strong> area requires the creation of a new district.Currently, there are 80 buses at East <strong>Wake</strong> while other districts average50 to 60 buses. To alleviate this problem another district will be createdat Knightdale. No additional district is expected to be needed within thenext three fi scal years.Implementation Timeline & Budget Needed:20<strong>08</strong>-09 MOE Amount CodeBus Operations TeamLeader, Grade 25,Step 0012.00 $ 32,4012,4792,3134,2492326001,000234Base 02.6550.056.165.0225.0000SS 02.6910.056.211.0225.0000Ret 02.6910.056.221.0225.0000Hosp 02.6910.056.231.0225.0000Dental 02.6910.706.234.0225.0000Supplies 02.6550.706.412.0225.0980Computer 02.6550.706.412.0225.0980Nextel 02.6550.056.311.0225.0980Less: one-time cost from previous year ($15,355) Vehicle 04.9300.801.551.0225.09802009-10Total: 12.00 $ 28,153Less: one-time cost from previous year ($ 1,000) Computer 02.6550.706.412.0225.0980Total: ($ 1,000)<strong>2007</strong>-<strong>08</strong> MOE Amount CodeOperations Manager,Grade 29, Step 0012.00$ 41,5333,1772,9674,0472326001,00023415,355Base 02.6550.056.148.0225.<strong>08</strong>80SS 02.6910.056.211.0225.<strong>08</strong>80Ret 02.6910.056.221.0225.<strong>08</strong>80Hosp 02.6910.056.231.0225.<strong>08</strong>80Dental 02.6910.706.234.0225.<strong>08</strong>80Supplies 02.6550.706.412.0225.0980Computer 02.6550.706.412.0225.0980Nextel 02.6550.056.311.0225.0980Vehicle 04.9300.801.551.0225.0980Bus Operations TeamLeader, Grade 25,Step 0012.0032,4012,4792,3134,0472326001,000234Base 02.6550.056.165.0225.0000SS 02.6910.056.211.0225.0000Ret 02.6910.056.221.0225.0000Hosp 02.6910.056.231.0225.0000Dental 02.6910.706.234.0225.0000Supplies 02.6550.706.412.0225.0980Computer 02.6550.706.412.0225.0980Nextel 02.6550.056.311.0225.0980Total: 24.00 $ 112,451232
Growth RequestsInitiative: Fuel TruckCurrent Funding Formula:North Carolina State Board Policy:“Fuel Trucks- Fuel trucks are the primary source for distributing fuel to theschool bus fl eet. With the buses typically staged away from the garage,a remote system of fueling is essential. The general rule is one fuel truckper 75 school buses.”State recommends 1 fuel truck for every 75 buses:• 890/75 = 11• 942/75 = 12• 996/75 = 13Cost of 1,800 gallon fuel truck: $73,842Evidence or Reasoning for this Strategy:Currently, the department has 10 fuel trucks and is running 835 buseswith a projection of 890 buses for the <strong>2007</strong>-<strong>08</strong> school year. We need atleast 1 additional fuel truck to get close to meeting the recommendedratio by the State Board of Education. As the fl eet continues to grow bythe number listed above, we will need to add a fuel truck each year forthe next three years.Implementation Timeline & Budget Needed:<strong>2007</strong>-<strong>08</strong> Amount Code1,800 gallon fuel truck $ 73,842 04.9300.801.551.0225.098020<strong>08</strong>-09Total: $ 73,842Less: one time cost fromprevious year($73,842) 04.9300.801.551.0225.0980Total: ($73,842)233 FY <strong>2007</strong>-<strong>08</strong> <strong>Plan</strong> for Student Success
Growth RequestsInitiative: Exceptional Children (EC) contract transportation in cars and buses for PreK childrenCurrent Funding Formula:Projected student growth rate of 6.28 percent.Data for these children has not been tracked in prior fi scal years. Ongoingdata analysis will be done throughout fi scal year 2006-07 todetermine a more accurate funding formula and growth rate for this subpopulation of Exceptional Children.Evidence or Reasoning for this Strategy:The transport of Exceptional Children is regulated by various Stateand Federal regulations that the <strong>Wake</strong> <strong>County</strong> <strong>Public</strong> <strong>School</strong> <strong>System</strong>(WCPSS) is required to follow. IEPs (Individual Education <strong>Plan</strong>s), whichare initiated by the Exceptional Children’s area are the trigger for growthin this population of students.In fi scal year <strong>2007</strong>-<strong>08</strong>, the contract for Exceptional Children Transportationwill be going out for bid.Implementation Timeline & Budget Needed:<strong>2007</strong>-<strong>08</strong> Amount CodeExceptional Children Contract forPreK$ 66,625 02.6550.706.331.0225.<strong>08</strong>80Total: $ 66,62520<strong>08</strong>-09Exceptional Children Contract forPreK$ 70,809 02.6550.706.331.0225.<strong>08</strong>80Total: $ 70,8092009-10Exceptional Children Contract forPreK$ 75,255 02.6550.706.331.0225.<strong>08</strong>80Total: $ 75,255234
Growth RequestsInitiative: Service Trucks to meet North Carolina State Board Policy recommended ratioCurrent Funding Formula:North Carolina State Board Policy:“Service Trucks- These service vehicles are used by the garagemechanics to access the fl eet for maintenance and service. The busesare typically staged at schools or other parking facilities mid-day and areavailable for routine inspections and minor servicing. A local board mayadd a service truck to the state replacement schedule if the ratio of busesoperated per service truck inventory exceeds 25.”2009-10 Amount CodeLess: one time cost from previous year ($ 56,250) 04.9300.801.551.0225.0980Total: ($ 56,250)Currently, the department has 27 service trucks for 835 buses. This ratiois 1:31 buses per service truck. The number of service trucks the NorthCarolina State Board Policy ratio recommends for <strong>Wake</strong> <strong>County</strong> is 1:25.We need six additional service trucks to meet the recommended ratio bythe State Board of Education.The addition of six service trucks would decrease the number of busesassigned to service mechanics for maintenance at the 14 Districts(landing sites). This would increase the number of buses inspected atlanding sites and improve the overall maintenance of the buses.Implementation Timeline & Budget Needed:<strong>2007</strong>-<strong>08</strong> Amount Code3 service trucks (cab and chassis)3 utility bodies$ 45,75010,50004.9300.801.551.0225.0980Total: $ 56,25020<strong>08</strong>-093 service trucks (cab and chassis)3 utility bodies$ 45,75010,50004.9300.801.551.0225.0980Subtotal $ 56,250Less: one time cost from previous year ($ 56,250) 04.9300.801.551.0225.0980Total: $ 0235 FY <strong>2007</strong>-<strong>08</strong> <strong>Plan</strong> for Student Success
Growth RequestsInitiative: Staff Development for bus drivers, bus substitutes, and bus safety assistantsCurrent Funding Formula:• The current number of positions for 2006-07 for theseclassifi cations of employee is 937 (795 drivers, 102 safetyassistants, and 40 full-time substitutes).• Projected growth for <strong>2007</strong>-<strong>08</strong> for these classifi cations of employeeis 72 employees if vacancies are fi lled.• This is an eight percent increase. This percentage is being usedto project a growth rate for staff development dollars.Implementation Timeline & Budget Needed:<strong>2007</strong>-<strong>08</strong> Amount CodeStaff Development $ 15,0751,1531,077Base 01.6930.056.186.0225.<strong>08</strong>80SS 01.6910.056.211.0225.<strong>08</strong>80Ret 01.6910.056.221.0225.<strong>08</strong>80Total: $ 17,30520<strong>08</strong>-09Staff Development $ 16,2811,2451,163Base 01.6930.056.186.0225.<strong>08</strong>80SS 01.6910.056.211.0225.<strong>08</strong>80Ret 01.6910.056.221.0225.<strong>08</strong>80Total: $ 18,6892009-10Staff Development $ 17,5831,3451,256Base 01.6930.056.186.0225.<strong>08</strong>80SS 01.6910.056.211.0225.<strong>08</strong>80Ret 01.6910.056.221.0225.<strong>08</strong>80Total: $ 20,184236
Growth RequestsInitiative: Exceptional Children (EC) parent contract transportation for PreK childrenCurrent Funding Formula:Projected student growth rate of 6.28 percent.Data for these children has not been tracked in prior fi scal years. Ongoingdata analysis will be done throughout fi scal year 2006-07 todetermine a more accurate funding formula and growth rate for this subpopulation of EC Children.The transport of Exceptional Children is regulated by various Stateand Federal regulations that the <strong>Wake</strong> <strong>County</strong> <strong>Public</strong> <strong>School</strong> <strong>System</strong>(WCPSS) is required to follow. Individual Education <strong>Plan</strong>s (IEPs) whichare inititated by Exceptional Children’s area are the trigger for growth inthis population of students.Implementation Timeline & Budget Needed:<strong>2007</strong>-<strong>08</strong> Amount CodeExceptional Children ParentContract for PreK$ 16,014 02.6550.706.331.0230.<strong>08</strong>80Total: $ 16,01420<strong>08</strong>-09Exceptional Children ParentContract for PreK$ 17,019 02.6550.706.331.0230.<strong>08</strong>80Total: $ 17,0192009-10Exceptional Children ParentContract for PreK$ 18,<strong>08</strong>8 02.6550.706.331.0230.<strong>08</strong>80Total: $ 18,<strong>08</strong>8Expected Effect on Goal 20<strong>08</strong>:Effi cient transportation of Exceptional Children promotes teaching andlearning.Legal Implications (if any):None237 FY <strong>2007</strong>-<strong>08</strong> <strong>Plan</strong> for Student Success
Growth RequestsInitiative: Perfect Attendance Incentive for Transportation Department personnelCurrent Funding Formula:Estimated funding needed for the current fi scal year is $160,000, basedon $1,000 per district, times 16 districts, times 10 months. One additionaldistrict is being added in <strong>2007</strong>-<strong>08</strong>. Mechanics may also participate in thisprogram. Estimated funding needed for the current fi scal year is $12,000,based on $1,000 per month for 12 months. Only 10 mechanics per monthmay receive the bonus.In 2005, the Superintendent authorized establishment of an amount offunds to be used for an incentive to bus drivers and mechanics for perfectattendance. Under this concept, drivers and mechanics that have perfectattendance for a month are eligible for a $100 incentive, to be awarded toten persons within each transportation district by random drawing. It isproposed to continue this program for the current fi scal year.Implementation Timeline & Budget Needed:<strong>2007</strong>-<strong>08</strong> Amount CodePerfect Attendance BusDriversMechanics$ 10,0007657143,000230214Total: $ 14,923Base 02.6550.706.183.0225.<strong>08</strong>80SS 02.6910.706.211.0225.<strong>08</strong>80Ret 02.6910.706.221.0225.<strong>08</strong>80Base 02.6550.706.183.0225.0980SS 02.6910.706.211.0225.0980Ret 02.6910.706.221.0225.0980During the past several years, the Transportation Department hasexperienced a vacancy rate of 6-10 percent of both bus driver and busmechanic positions. The impacts of this high rate have been:• Shortage of mechanics has resulted in preventive and routinemaintenance not being performed on schedule; managementhas authorized overtime to keep up with urgent repairs.• Shortage of drivers has required assignment of substitutes tofull-time routes, depleting the supply of substitutes available fordrivers out on a daily basis.• Shortage has required assignment of mechanics to buses, takingthem from their work; and of Team Leaders, taking them fromadministrative tasks, such as monitoring time cards, verifyingroute effi ciencies and addressing parents’ concerns.• Shortage of drivers has required doubling-up of bus routes,lengthening the ride times of students, and in some cases makingbuses late arriving to school and late arriving at homes.The shortage of personnel has been exacerbated this year by theincrease in student ridership. The less than satisfactory service on someroutes has been manifested in calls from both parents and principals.The impact on route timeliness is lessened if the rate of driver absenceis reduced.238
Growth RequestsInitiative: Parent Contracts for Exceptional Children (EC) TransportationCurrent Funding Formula:Data for these children has not been tracked in prior fi scal years; weare using the overall WCPSS growth rate of 6.28 percent for budgetingpurposes. On-going data analysis will be done throughout fi scal year2006-07 to determine a more accurate funding formula and growth ratefor this sub population of EC.Evidence or Reasoning for this Strategy:The transport of Exceptional Children is regulated by various State andFederal regulations that WCPSS is required to follow. IEPs (IndividualEducation <strong>Plan</strong>s) which are initiated by the Exceptional Children’s areaare the trigger for growth in this population of students.Implementation Timeline & Budget Needed:<strong>2007</strong>-<strong>08</strong> Amount CodeParent Contracts for ExceptionalChildren$ 8,478 01.6550.056.331.0235.<strong>08</strong>80Total: $ 8,47820<strong>08</strong>-09Parent Contracts for ExceptionalChildren$ 9,866 01.6550.056.331.0235.<strong>08</strong>80Total: $ 9,8662009-10Parent Contracts for ExceptionalChildren$ 10,540 01.6550.056.331.0235.<strong>08</strong>80Total: $ 10,540239 FY <strong>2007</strong>-<strong>08</strong> <strong>Plan</strong> for Student Success
Growth RequestsInitiative: <strong>School</strong> BusesCurrent Funding Formula:• Ridership @ 53 percent• 81 students per bus• Cost per bus $67,567YearProjectedStudentCountRidership at53%Studentsper busNumber ofbuses required2006-07 128,072 67,878 81 838<strong>2007</strong>-<strong>08</strong> 136,<strong>08</strong>6 72,126 81 89020<strong>08</strong>-09 144,035 76,339 81 9422009-10 152,206 80,669 81 99620<strong>08</strong>-09 Amount CodeNew school buses $ 2,905,381 04.9300.120.551.0225.<strong>08</strong>80Licensing fees 43,258 01.6550.056.691.0225.09802009-10Total: $ 2,948,639New school buses $ 3,648,618 04.9300.120.551.0225.0980Licensing fees 54,324 01.6550.056.691.0225.0980$ 3,702,942Less: one-time cost fromprevious year ($ 2,948,639)Total: $ 754,303Year Buses on Site Buses Needed Budget2006-07 899 0 $ 0<strong>2007</strong>-<strong>08</strong> 899 0 $ 020<strong>08</strong>-09 899 43 $ 2,905,3812009-10 942 54 $ 3,648,618Due to the purchase of buses in 2005-06, we have a pool of buses availablethrough <strong>2007</strong>-<strong>08</strong>. Buses were delivered one year earlier than normal schedule.Implementation Timeline & Budget Needed:<strong>2007</strong>-<strong>08</strong> Amount CodeNew school buses $ 0Licensing fees 0Total: $ 0240
Growth RequestsInitiative: Charter <strong>School</strong>sCurrent Funding Formula:In accordance with § 115C-238.29H...... If a student attends a charter school, the local school administrative unit in which the child resides shalltransfer to the charter school an amount equal to the per pupil local current expense appropriation to the local school administrative unit for thefi scal year. The amount transferred under this subsection that consists of revenue derived from supplemental taxes shall be transferred only to acharter school located in the tax district for which these taxes are levied and in which the student resides.Implementation Timeline & Budget Needed:2006-07 Amount Amount TotalEstimated Expenditures to Charter <strong>School</strong>s $ 9,490,516 Estimated Expenditures to Charter <strong>School</strong>s $ 121,128 $ 9,611,644<strong>2007</strong>-<strong>08</strong>Estimated <strong>County</strong> Appropriation as of July 1, <strong>2007</strong>$300,744,100Estimated fi nes and forfeitures as of July 1, <strong>2007</strong>$3,700,000Less: Portion of county appropriation for capital outlay(3,779,301)Estimated current expense county appropriation296,964,799Projected Student MembershipWCPSSCharter <strong>School</strong>s136,<strong>08</strong>64,694140,780Projected Student MembershipWCPSSCharter <strong>School</strong>s136,<strong>08</strong>64,694140,780<strong>County</strong> Appropriation per Student$ 2,109.42Fines and forfeitures per Student$ 26.28Estimated Expenditures to Charter <strong>School</strong>s$ 9,901,639Estimated Expenditures to Charter <strong>School</strong>s$ 123,368$ 10,025,007Increase from Previous YearChange due to increase in county appropriationChange due to increase in students20<strong>08</strong>-09Estimated <strong>County</strong> Appropriation as of July 1, 20<strong>08</strong>Less: Portion of county appropriation for capital outlay$ 411,123 Increase from Previous Year$ 2,240 $ 413,363$ 66,686 Change due to increase in fi nes and forfeitures $ 13,337 $ 80,023$ 344,437 Change due to increase in students($ 11,097) $ 333,340$ 411,123 $ 2,240 $ 413,363$332,161,732(7,233,359)Estimated fi nes and forfeitures as of July 1, 20<strong>08</strong>$3,800,000Estimated current expense county appropriationProjected Student MembershipWCPSSCharter <strong>School</strong>s324,928,373144,0354,879148,914Projected Student MembershipWCPSSCharter <strong>School</strong>s144,0354,879148,914<strong>County</strong> Appropriation per Student$ 2,181,99Fines and forfeitures per Student$ 25.52241 FY <strong>2007</strong>-<strong>08</strong> <strong>Plan</strong> for Student Success
Growth Requests20<strong>08</strong>-09 Amount Amount TotalEstimated Expenditures to Charter <strong>School</strong>s$ 10,645,913 Estimated Expenditures to Charter <strong>School</strong>s$ 124,503 $10,770,416Increase from Previous YearChange due to increase in county appropriationChange due to increase in students$ 744,274$ 916,195($ 171,921)Increase from Previous YearChange due to increase in fi nes and forfeituresChange due to increase in students$ 1,134$ 3,276$ (2,142)$ 745,4<strong>08</strong>$ 919,471($ 174,063)$ 744,274 $ 1,134 $ 745,4<strong>08</strong>2009-10Estimated <strong>County</strong> Appropriation as of July 1, 2009$358,954,855Estimated fi nes and forfeitures as of July 1, 2009$ 3,900,000Less: Portion of county appropriation for capital outlay(9,904,862)Estimated current expense county appropriation349,049,993Projected Student MembershipWCPSSCharter <strong>School</strong>s152,2065,055157,261Projected Student MembershipWCPSSCharter <strong>School</strong>s152,2065,055157,261<strong>County</strong> Appropriation per Student$ 2,219,56Fines and forfeitures per Student$ 24.80Estimated Expenditures to Charter <strong>School</strong>s$11,219,868Estimated Expenditures to Charter <strong>School</strong>s$ 125,362$ 11,345,230Increase from Previous YearChange due to increase in county appropriationChange due to increase in students$ 573,955$ 775,366($ 201,411)Increase from Previous YearChange due to increase in fi nes and forfeituresChange due to increase in students$ 859$ 3,214($ 2,355)$ 574,814$ 778,580($ 203,766)$ 573,955 $ 859 $ 574,814WCPSS sent confi rmation letters to each charter school to get a projected student count for the current year and next three years.The data returned from the charter schools is provided below.242
Growth RequestsCHARTER SCHOOL VERIFICATION LETTERS<strong>School</strong> 2006-07 <strong>2007</strong>-<strong>08</strong> 20<strong>08</strong>-09 2009-10BakerCarter CharterCasa EsperanzaCentral ParkChathamCross CreekCommunity Ptnrs.CrossnoreEast <strong>Wake</strong>ExplorisFranklinGrandfatherHealth Start AcademyHopeKestrel HeightsMagellanMaureen Joy CharterNew CenturyOrangePacePreeminentProvisions AcademyQuestRaleigh HighRocky Mount PreparatorySparcSterlingTorchlightWoods002571168205<strong>08</strong>180757121110433410114970133509113547330000327211151150559192800151114104003112580013551401504753305052891120126061519282015211415400410135800135516016548036010073001025138067719285015211420400015045800135518018048039012Total: 4,304 4,694 4,879 5,055Increase: 390 185 176Increase Percentage: 9 percent 4 percent 4 percent243 FY <strong>2007</strong>-<strong>08</strong> <strong>Plan</strong> for Student Success
Growth RequestsInitiative: Intersession teachers and teacher assistants for new year-round elementary schoolsCurrent Funding Formula:Each year-round elementary school gets one 10-month teacher and one10-month teacher assistant for intersession to serve students who enterschool late or for students needing remediation.Many students who attend year-round elementary schools do not enrolluntil after the school year has started. Intersession teachers work withstudents during the intersession period to “catch them up” and to provideremediation to other students who are behind in their academic work.The target population, in many cases, tends to be students with lowachievement and/or low income and who are in need of an enhancedlearning model.Implementation Timeline & Budget Needed:<strong>2007</strong>-<strong>08</strong> MOE Amount Code3 10-month teachers(@$50,000)(Sanford CreekElementary, EastGarner Elementary,North Forest PinesElementary)3 10-monthteacher assistants(@$25,000)30.0030.00$ 127,78922,21111,47510,71012,14169675,0005,7385,35512,141696Base 02.5100.001.121.0105.0000Supp 02.5100.001.181.0105.0000SS 02.5910.001.211.0105.0000Ret 02.5910.001.221.0105.0000Hosp 02.5910.001.231.0105.0000Dental 02.5910.001.234.0105.0000Base 02.5100.027.142.0105.0000SS 02.5910.027.211.0105.0000Ret 02.5910.027.221.0105.0000Hosp 02.5910.027.231.0105.0000Dental 02.5910.027.234.0105.000020<strong>08</strong>-09 MOE Amount Code3 10-month teachers(@$50,000) (Leesvillearea, Cary Park area,Bespack conversion)3 10-monthteacher assistants(@$25,000)2009-104 10-month teachers(@$50,000) (BanksRoad area, Southern<strong>Wake</strong>, TBD, TBD)4 10-monthteacher assistants(@$25,000)30.0030.00$ 127,78922,21111,47510,71012,14169675,0005,7385,35512,141696Total: 60.00 $ 283,95240.0040.00$ 200,00015,30014,28016,188928100,0007,6507,14016,188928Total: 80.00 $ 378,602Base 02.5100.001.121.0105.0000Supp 02.5100.001.181.0105.0000SS 02.5910.001.211.0105.0000Ret 02.5910.001.221.0105.0000Hosp 02.5910.001.231.0105.0000Dental 02.5910.001.234.0105.0000Base 02.5100.027.142.0105.0000SS 02.5910.027.211.0105.0000Ret 02.5910.027.221.0105.0000Hosp 02.5910.027.231.0105.0000Dental 02.5910.027.234.0105.0000Base 02.5100.001.121.0105.0000Supp 02.5100.001.181.0105.0000SS 02.5910.001.211.0105.0000Ret 02.5910.001.221.0105.0000Hosp 02.5910.001.231.0105.0000Dental 02.5910.001.234.0105.0000Base 02.5100.027.142.0105.0000SS 02.5910.027.211.0105.0000Ret 02.5910.027.221.0105.0000Hosp 02.5910.027.231.0105.0000Dental 02.5910.027.234.0105.0000Total: 60.00 $ 283,952244
Growth RequestsInitiative: <strong>School</strong> Resource Offi cer (SRO) for two new 9th grade centersCurrent Funding Formula:Two new 9th Grade Centers will open for the <strong>2007</strong>-<strong>08</strong> school year. Thisrequest for additional funding is to provide SROs at the <strong>Wake</strong> Forest-Rolesville High 9th Grade Center and the <strong>Wake</strong>fi eld High 9th Grade Center.Currently, every high school campus in <strong>Wake</strong> <strong>County</strong> <strong>Public</strong> <strong>School</strong><strong>System</strong> (WCPSS) has a fulltime <strong>School</strong> Resource Offi cer assigned and isfunded at $37,878.00 per school.This request is to provide an SRO at Heritage High <strong>School</strong> in 2009-10.The WCPSS Security Department is requesting this budget increase toensure a safe, inviting, optimal learning environment to support the strategicdirective of focusing on teaching and learning.Implementation Timeline & Budget Needed:<strong>2007</strong>-<strong>08</strong> Amount Code<strong>School</strong> Resource Offi cer$ 75,756 01.6420.069.311.0210.<strong>08</strong>05.000(SRO)Total: $ 75,75620<strong>08</strong>-09<strong>School</strong> Resource Offi cer$ 0 01.6420.069.311.0210.<strong>08</strong>05.000(SRO)Total: $ 02009-10<strong>School</strong> Resource Offi cer$ 37,878 01.6420.069.311.0210.<strong>08</strong>05.000(SRO)Total: $ 37,878245 FY <strong>2007</strong>-<strong>08</strong> <strong>Plan</strong> for Student Success
Growth RequestsInitiative: Workshop Expenses/Allowable Travel for the Board of EducationCurrent Funding Formula:<strong>School</strong> Board Members are required to attend different conferences, worksessions, and training activities as a part of their responsibilities. BoardMembers should also be involved in a variety of leadership developmentactivities to increase their awareness and knowledge for conductingmeetings and activities. The total budget is $12,369. This amount isinadequate to cover mandatory activities.Implementation Timeline & Budget Needed:<strong>2007</strong>-<strong>08</strong> Amount CodeIntercity VisitGreater Raleigh ChamberLeadership DevelopmentConferences (including <strong>School</strong> BoardAssociationRetreats/Work SessionsLocal Travel (including Joint BoardWork Sessions)Training for new Board MembersLess: current budget$ 2,0005,0009,0001,0002,0001,000(12,369)Total: $ 7,631 02.6930.801.312.0171.0900246
Growth RequestsInitiative: Substitutes for 12 Months of Employment (MOE) staff for planning days at Year-Round schoolsCurrent Funding Formula:$1,800 per elementary school; $3,600 per middle schoolImplementation Timeline & Budget Needed:<strong>2007</strong>-<strong>08</strong> Amount Code$1,800 for each of 3 newmulti-track year-roundelementary schools$1,200 for East Cary (newyear-round 6th grade).$ 6,600505Base 02.5100.801.182.0105.<strong>08</strong>05SS 02.5910.801.211.0105.<strong>08</strong>05Total: $ 7,10520<strong>08</strong>-09$1,800 for each of 3 newmulti-track year-roundelementary schools$1,200 additional for EastCary adding 7th grade.$ 6,600505Base 02.5100.801.182.0105.<strong>08</strong>05SS 02.5910.801.211.0105.<strong>08</strong>05Total: $ 7,1052009-10$1,800 for each of 4 newmulti-track year-roundelementary schools$1,200 additional for EastCary adding 8th grade.$8,400643Base 02.5100.801.182.0105.<strong>08</strong>05SS 02.5910.801.211.0105.<strong>08</strong>05Total: $ 9,043247 FY <strong>2007</strong>-<strong>08</strong> <strong>Plan</strong> for Student Success
Growth RequestsInitiative: Internal Audit DepartmentCurrent Funding Formula:There is not a funding formula for internal audit positions. However, dueto the projected growth in the system, both in the number of schoolsand in the number of programs, an additional senior administrator will beneeded. There are 150 schools in the system and it takes approximately3.5 days to conduct an individual school audit, assuming that there are noserious problems identifi ed. This translates into a need for one position.The department has also experienced a large number of special requestsin the past calendar year, as the result of fi nancial irregularities that havebeen initially identifi ed by management and through the fraud hotline. Itis unlikely that the number of these requests will decline in the future.In order to be a service to the administration and the principals and toprovide for strong internal controls, this additional position is needed.Implementation Timeline & Budget Needed:<strong>2007</strong>-<strong>08</strong> MOE Amount Code20<strong>08</strong>-09Total: 0.00 $ 0Senior Administrator,Band 412.00 $ 65,6205,0204,6854,2492324,0004,0007504,725Base 02.6320.002.113.0148.0905SS 02.6910.002.211.0148.0905Ret 02.6910.002.221.0148.0905Hosp 02.6910.002.231.0148.0905Dental 02.6910.002.234.0148.0905ContractSvcs02.6320.801.311.0148.0905Workshops 02.6930.801.312.0148.0905Travel 02.6320.801.332.0148.0905Supplies 02.6320.801.412.0148.0905Total: 12.00 $ 93,2812009-10Less: one-time costsfrom previous year0.00 ($ 3,569) 02.6320.801.412.0148.0905Total: 0.00 ($ 3,569)248
Growth RequestsInitiative: <strong>School</strong> Technology FundThis addresses the implementation of technology supporting schools.Current Funding Formula:$6.97 per ADMImplementation Timeline & Budget Needed:Initial Allotment$6.97/ADM<strong>2007</strong>-<strong>08</strong> Amount CodeEst. fi nes/forfeitureEst. annual interest$ 948,5191,600,00<strong>08</strong>8,000Initial Allotment$6.97/ADM2009-10 Amount CodeEst. fi nes/forfeitureEst. annual interest$1,060,8761,797,76098,876Subtotal $ 2,957,512Less: previous yearbudget($2,793,204)Total: $ 164,3<strong>08</strong> 01.6670.015.311.0231.0231.<strong>08</strong>10Subtotal $ 2,636,519Less: previous yearbudget($3,356,125)Total: ($ 719,606)01.6620.015.311.0231.<strong>08</strong>10 $352,11301.6580.015.412.0231.<strong>08</strong>10 ($100,055)01.5100.015.541.0231.<strong>08</strong>10 ($2,685,487)01.6670.015.311.0231.<strong>08</strong>10 $1,713,82320<strong>08</strong>-09Initial Allotment$6.97/ADMEst. fi nes/forfeitureEst. annual interest$1,003,9241,696,00093,280Subtotal $ 2,793,204Less: previous yearbudget($2,636,519)Total: $ 156,685 01.6670.015.311.0231.<strong>08</strong>10249 FY <strong>2007</strong>-<strong>08</strong> <strong>Plan</strong> for Student Success
Notes250
<strong>System</strong>wide - Fiscal AccountabilityInitiative: InsuranceEstablishing a cost-effective risk management program to provide andsupport quality management systems to prevent and reduce the loss ofresources.Implementation Timeline & Budget Needed:<strong>2007</strong>- <strong>08</strong> Amount CodeLiability InsuranceProperty InsuranceWorkers’ Comp Self-InsuranceWorkers’ Comp Self-InsuranceVehicle InsuranceFidelity Bond PremiumScholastic Accident Insurance20<strong>08</strong>-09Liability InsuranceProperty InsuranceWorkers’ Comp Self-InsuranceWorkers’ Comp Self-InsuranceVehicle InsuranceFidelity Bond PremiumScholastic Accident Insurance2009-10Liability InsuranceProperty InsuranceWorkers’ Comp Self-InsuranceVehicle InsuranceFidelity Bond PremiumScholastic Accident Insurance($ 106,204)( 15,596)190,78093,967( 76,770)619,423Total: $ 95,661$ 102,266115,92150,63424,93919,5631439,028Total: $ 322,494$ 135,159131,38179,35121,51915010,456Total: $ 378,01602.6520.801.621.0258.096502.6520.801.623.0258.096502.5910.801.232.0258.<strong>08</strong>6502.6910.801.232.0258.<strong>08</strong>6502.6520.801.622.0258.096502.6520.801.625.0258.096502.5400.801.628.0258.<strong>08</strong>6502.6520.801.621.0258.096502.6520.801.623.0258.096502.5910.801.232.0258.<strong>08</strong>6502.6910.801.232.0258.<strong>08</strong>6502.6520.801.622.0258.096502.6520.801.625.0258.096502.5400.801.628.0258.<strong>08</strong>6502.6520.801.621.0258.096502.6520.801.623.0258.096502.5910.801.232.0258.<strong>08</strong>6502.6520.801.622.0258.096502.6520.801.625.0258.096502.5400.801.628.0258.<strong>08</strong>65Liability Insurance (CGL, <strong>School</strong> & Law Enforcement Professional liability,& Excess Umbrella) Budget Code 02.6520.801.621.0258.0965.000:The estimated premium for <strong>2007</strong>-<strong>08</strong> will reduce by eleven percent due toa reduction in loss trend over the past four years. The estimated premiumis projected to increase eleven percent for 20<strong>08</strong>-09 and fourteen percentfor 2009-10. This estimate is a result of current market condition,annual increase in student population of six percent, and nine-year lossexperience of fi fty-seven percent.Property Insurance (Real Property, Musical Instruments, and Boiler &Machinery) Budget Code 02.6520.801.623.0258.0965.000:It is projected that the <strong>2007</strong>-<strong>08</strong> Fiscal Year will include an increase inmobile classrooms, modular schools, 3-new school openings and existingcampus new/renovated construction. However, our property loss ratiohas decreased to single digits over the past fi ve years. This will reducethe budget for <strong>2007</strong>-<strong>08</strong> by $15,596. The 20<strong>08</strong>-09 and 2009-10 premiumsare projected to increase at a rate of twelve percent each year.Workers’ Compensation Insurance Budget Codes 02.5910.801.232.0258.<strong>08</strong>65.000 and 02.6910.801.232.0258.<strong>08</strong>65.000:It is estimated that cost will increase based upon a 2.5 percent increase innumber of employees. Medical cost infl ation will be offset by the savingsof the comprehensive safety program yielding a net annual increase of 5percent for <strong>2007</strong>-<strong>08</strong>, 20<strong>08</strong>-09, and 2009-10.Vehicle Liability Insurance (Excluding Drivers’ Education) Budget Code 02.6520.801.622.0258.0965.000: Based on a 9-year loss ratio of 41.7percent, the <strong>2007</strong>-<strong>08</strong> premium will reduce by $76,770. The estimatedchange in fl eet schedule will result in a ten percent premium increase in20<strong>08</strong>-09 and 2009-10.Fidelity Bond Premium Budget Code 02.6520.801.625.0258.0965.000:As a result of no covered losses in the past 9-years and system of checksand balances utilized by <strong>Wake</strong> <strong>County</strong> <strong>Public</strong> <strong>School</strong> <strong>System</strong> (WCPSS),premiums remain stable. It is estimated that annual infl ation will occur ata rate of five percent for <strong>2007</strong>-<strong>08</strong>; 20<strong>08</strong>-09; and 2009-10 with budgetedpremiums increases of $61; $143; and $150 respectively.Scholastic Accident Insurance Budget Code 02.5400.801.628.0258.<strong>08</strong>65.000: Based on the increase in Middle <strong>School</strong> Catastrophe Coverage feeper school, three additional middle schools during the <strong>2007</strong>-10 budgetedperiod, and increase in student population averaging six percent peryear; it is estimated that the <strong>2007</strong>-<strong>08</strong> premium will increase an averageof nine percent for <strong>2007</strong>-<strong>08</strong>, 20<strong>08</strong>-09, and 2009-10.251 FY <strong>2007</strong>-<strong>08</strong> <strong>Plan</strong> for Student Success
<strong>System</strong>wide - Fiscal AccountabilityExpected Effect on Goal 20<strong>08</strong>:Finance recovery from accidental losses and prevention of onecatastrophic or a series of smaller losses to prevent adverse fi nancialimpact on <strong>Wake</strong> <strong>County</strong> Board of Education’s budget.Evidence or Reasoning for this Strategy:<strong>System</strong>wide growth in facilities, employees, students, vehicles requiresus to protect WCPSS assets and prevent losses from adversely effectingrevenues.Strategic Directive 2: Retain, recruit, and train high quality employees.Strategic Directive 4: Expand fi scal accountability.Legal Implications (if any):<strong>Wake</strong> <strong>County</strong> Board of Education must have funds readily available forpayment of claim or judgments for damage or injury as a result of ournegligence or tort acts.252
<strong>System</strong>wide - Fiscal AccountabilityInitiative: Fuel Management <strong>System</strong> (FMS)Implementation Timeline & Budget Needed:<strong>2007</strong>- <strong>08</strong> Amount CodeInstall 270 buses, 4 fuel trucksAIM 2 based20<strong>08</strong>-09Install 270 buses, 3 fuel trucksAIM 2 basedTotal: $ 135,000$ 135,000 04.9200.801.541.0225.0980$ 82,998 04.9200.801.541.0225.0980Less: one-time cost from previousyear(135,000)Total: ($ 52,002)2009-10Install 270 buses, 3 fuel trucksAIM 2 based$ 82,998 04.9200.801.541.0225.0980Less: one-time cost from previousyear($82,998)also decrease the number of errors recorded by staff, since all data wouldbe captured electronically and imported in the maintenance program.**The Automotive Information Module (AIM) two FMS adds an AIMvehicle kit to each bus that would be able to read the nozzle of the fueltruck. This would allow the two to communicate and eliminate manualwriting of data all together.Areas of Cost Savings:1. Fuel operating Effi ciency2. Monitoring of idle time3. Monitoring and communicating to the other On Board Diagnostics(OBD) outputs from the vehicle manufacturer. These includeengine warning lights, hard braking events, high speed eventsand other vehicle parameters.Legal Implications (if any):NoneTotal: $ 0Expected Effect on Goal 20<strong>08</strong>:Fiscal accountability for fuel expenditures would be enhanced by thisproduct.Evidence or Reasoning for this Strategy:The annual budget for diesel fuel is $4.5 million.Currently, the department fuels approximately 450 buses daily anddispenses an average 13,000 gallons of diesel fuel. Fuel truck driversmanually write the mileage and fuel for each bus fueled per day. Dataentry clerk spends three hours per day entering fuel and mileage in toour maintenance program.The new FMS would be able to interface with our maintenance programand eliminate the need for data to be entered manually in to ourmaintenance program, thus saving $11,781 per year in salary. This would253 FY <strong>2007</strong>-<strong>08</strong> <strong>Plan</strong> for Student Success
<strong>System</strong>wide - Fiscal AccountabilityInitiative: Operations staff for contract cars and buses for exceptional programsImplementation Timeline & Budget Needed:District staffi ng 1 Operations Manager2 Bus Operations Team LeadersBuses per district 50 to 60<strong>2007</strong>- <strong>08</strong> MOE Amount CodeBus OperationsTeam Leader12.00 $ 32,4012,4792,3134,04741,240 State2326002341,00012.00 43,306Total 24.00 $ 112,451Operations Manager 12.00 $ 41,5333,1772,9674,0472326001,0002342,066 Local$ 53,790 Local12.00 $ 69,145Base 01.6550.056.165.0225.<strong>08</strong>80SS 01.6910.056.211.0225.<strong>08</strong>80Ret 01.6910.056.221.0225.<strong>08</strong>80Hosp 01.6910.056.231.0225.<strong>08</strong>80Dental 02.6910.706.234.0225.<strong>08</strong>80Supplies 02.6550.706.412.0225.0980Nextel 02.6550.056.311.0225.0980Equip 02.6550.706.412.0225.0980Base 02.6550.056.148.0225.<strong>08</strong>80SS 02.6910.056.211.0225.<strong>08</strong>80Ret 02.6910.056.221.0225.<strong>08</strong>80Hosp 02.6910.056.231.0225.<strong>08</strong>80Dental 02.6910.706.234.0225.<strong>08</strong>80Supplies 02.6550.706.412.0225.0980Equip 02.6550.706.412.0225.0980Nextel 02.6550.056.311.0225.0980$ 15,355 Vehicle 04.9300.801.551.0225.0980<strong>2007</strong>- <strong>08</strong> MOE Amount CodeBus OperationsTeam Leader12.00 $ 32,4012,4792,3134,24912.00 $ 41,442 State$ 2326002341,000Total 12.00 43,5<strong>08</strong>$ 2,066 LocalBase 01.6550.056.165.0225.<strong>08</strong>80SS 01.6910.056.211.0225.<strong>08</strong>80Ret 01.6910.056.221.0225.<strong>08</strong>80Hosp 01.6910.056.231.0225.<strong>08</strong>80Dental 02.6910.706.234.0225.<strong>08</strong>80Supplies 02.6550.706.412.0225.0980Nextel 02.6550.056.311.0225.0980Equip 02.6550.706.412.0225.0980Expected Effect on Goal 20<strong>08</strong>:Fiscal responsibility will be enhanced by the addition of staff to helpoversee the proper use of these vehicles. The goal of teaching andlearning will also be enhanced for Exceptional Children by more effi cientand timely management of their transportation to school.Evidence or Reasoning for this Strategy:The current ratio of school buses to Operations Managers is 45:1.There are currently 65 buses and over 200 cars in Exceptional ChildrenTransportation. The management of 102 safety assistants will also fallunder these new positions.The creation of these positions will free the existing staff from therouting duties required of such a large fl eet. This will allow the SeniorAdministrator and her staff to handle the continuing growth in thesestudents by attending Individual Education <strong>Plan</strong>s (IEPs) , validating over12 million in contract expenditures, and dealing with the daily interactionof Principals, Social Workers, and parents of over 3,000 students.Legal Implications (if any):None254
<strong>System</strong>wide - Fiscal AccountabilityInitiative: Real-time inventory for Parts DepartmentImplementation Timeline & Budget Needed:<strong>2007</strong>- <strong>08</strong> Amount CodeOne-time purchase at a cost ofServer$ 40,8525,20002.6550.706.412.0225.098004.9200.801.541.0225.0980Accuracy would improve by the elimination of hand-written documentationnow being used for data entry into the BSIP application.Legal Implications (if any):NoneTotal: $ 46,05220<strong>08</strong>-09Service agreement annual fee $ 6,840 02.6550.706.311.0225.0980Less: one-time cost fromprevious year2009-10(40,852)(5,200)Total: ($39,212)02.6550.706.311.0225.098004.9200.801.541.0225.0980Service agreement annual fee $ 6,840 02.6550.706.311.0225.0980Less: one-time cost fromprevious year(6,840) 02.6550.706.311.0225.0980Total: ($ 0)The cost will include all hardware, software and installation fees.Expected Effect on Goal 20<strong>08</strong>:Fiscal accountability for inventory would be enhanced by this system.Evidence or Reasoning for this Strategy:The Parts Department in Transportation has over 3,500 inventory itemswith a value of 1.2 million dollars. There are over 150 transactions dailyinvolving parts being received into inventory and or be charged to workorders. This system would increase accountability within inventory andreduce time for inventory audits.Currently, an audit of the parts room requires at least 24 staff membersto be pulled from their regular duties to complete the physical countof inventory in two days. Savings would be realized in staff time, thusfreeing up staff members to continue with bus maintenance duties andmore up-to-date entry into Business <strong>System</strong> Information Portal (BSIP) ofinventory data.255 FY <strong>2007</strong>-<strong>08</strong> <strong>Plan</strong> for Student Success
<strong>System</strong>wide - Fiscal AccountabilityInitiative: Bookkeeping staff for the Transportation DepartmentCurrent Funding Formula:There is no current funding formula for the Transportation Department forclerical staffi ng. In order to assure accountability for funds, we requesta bookkeeper position for each of the main areas in the Department—Maintenance and Administration.Implementation Timeline & Budget Needed:<strong>2007</strong>- <strong>08</strong> MOE CodeBookkeeper, Grade22, Step 0020<strong>08</strong>-0912.00 $ 26,9612,0621,9254,0472326001,000Total: 12.00 $ 36,827Base 02.6550.706.151.0225.0980SS 02.6910.706.211.0225.0980Ret 02.6910.706.221.0225.0980Hosp 02.6910.706.231.0225.0980Dental 02.6910.706.234.0225.0980Supplies 02.6550.706.412.0225.0980Computer 02.6550.706.412.0225.0980Expected Effect on Goal 20<strong>08</strong>:The addition of two bookkeepers will improve the overall effi ciency andthe fi scal accountability of the Transportation Department.Evidence or Reasoning for this Strategy:Currently the Senior Administrative staff is overwhelmed with clericalduties for Exceptional children billing, verifi cation, routing, payrollresponsibilities for 102 safety assistants and 65 mechanics that do notcomplete their own timesheets, the payment of approximately 20 milliondollars in bills, and the tracking of equipment and supplies for all busdistricts and central offi ce area. The addition of two bookkeepers wouldallow the Administrative staff to concentrate more on data analysis andimproved processes instead of the day-to-day clerical activities of theDepartment.Legal Implications (if any):NoneLess: one-time costfrom previous year12.00 $ 26,9612,0621,9254,2492326001,000(1,000)Base 02.6550.706.151.0225.0980SS 02.6910.706.211.0225.0980Ret 02.6910.706.221.0225.0980Hosp 02.6910.706.231.0225.0980Dental 02.6910.706.234.0225.0980Supplies 02.6550.706.412.0225.0980Computer 02.6550.706.412.0225.098002.6550.706.412.0225.09802009-10Total: 12.00 $ 36,029Less: one-time costfrom previous year($ 1,000) 02.6550.706.412.0225.0980Total: ($ 1,000)256
<strong>System</strong>wide - Rate IncreaseInitiative: Swimming Pool Rental Rate Increase for High <strong>School</strong>sCurrent Funding Formula:$449 X 19 High <strong>School</strong>s = $8,531Rate is expected to increase from $4,492 to $4,941 per high school. East<strong>Wake</strong> is one school athletically. Alternative schools do not have athleticprograms, therefore no swimming pool rental.Implementation Timeline & Budget Needed:<strong>2007</strong>- <strong>08</strong> Amount CodeContracted Services $ 8,531 02.5400.801.311.0119.<strong>08</strong>2520<strong>08</strong>-09Total: $ 8,531Contracted Services $ 0 02.5400.801.311.0119.<strong>08</strong>252009-10Total: $ 0Contracted Services $ 449 02.5400.801.311.0119.<strong>08</strong>25Total: $ 449Expected Effect on Goal 20<strong>08</strong>:According to the latest North Carolina High <strong>School</strong> Athletic Association(NCHSAA) study, athletes perform signifi cantly better than non-athletes.Evidence or Reasoning for this Strategy:The sport of swimming and diving is one of the most popular sports in the<strong>Wake</strong> <strong>County</strong> <strong>Public</strong> <strong>School</strong> <strong>System</strong> (WCPSS). Swimming pools are notincluded in our building plans for schools. In order to continue to provide thesport of swimming, we must pay for the increased costs associated with therental of the pools.Legal Implications (if any):None257 FY <strong>2007</strong>-<strong>08</strong> <strong>Plan</strong> for Student Success
<strong>System</strong>wide - Rate IncreaseInitiative: Utility budget - utility ratesIncrease utility budget for expected increase in utility rates.Implementation Timeline & Budget Needed:<strong>2007</strong>-<strong>08</strong> $1,216,675 (recurring)20<strong>08</strong>-09 $1,316,274 (recurring)2009-10 $1,437,499 (recurring)<strong>2007</strong>- <strong>08</strong>PreviousBudgetBudgetIncreasefor GrowthIncrease forConversionNew 07-<strong>08</strong>Budget atPreviousRateProjectedRateIncreaseAdditionalCost forRateIncreaseElectric 02.6540.802.321.0203.0980 $ 17,659,903 $ 983,174 $ 362,331 $ 19,005,409 1.04 $ 760,216Natural Gas 02.6540.802.322.0203.0980 5,078,602 282,739 104,199 5,465,540 1.05 273,277Other (W/Sew/Storm) 02.6540.802.323.0203.0980 2,288,804 127,424 46,960 2,463,188 1.05 123,159LP/Oil 02.6540.802.413.0203.0980 174,272 9,702 3,576 187,550 1.05 9,377Solid Waste 02.6580.802.323.0297.<strong>08</strong>30 941,210 52,400 19,311 1,012,921 1.05 50,646Total: $ 26,142,791 $ 1,455,439 $ 536,377 $ 28,134,607 $ 1,216,67520<strong>08</strong>-09Electric 02.6540.802.321.0203.0980 $ 19,765,625 $ 724,274 $ 20,489,899 1.04 $ 819,596Natural Gas 02.6540.802.322.0203.0980 5,738,817 2<strong>08</strong>,285 5,947,102 1.05 297,355Other (W/Sew/Storm) 02.6540.802.323.0203.0980 2,586,347 93,869 2,680,216 1.05 134,011LP/Oil 02.6540.802.413.0203.0980 196,927 7,147 204,075 1.05 10,204Solid Waste 02.6580.802.323.0297.<strong>08</strong>30 1,063,567 38,601 1,102,168 1.05 55,1<strong>08</strong>Total: $ 29,351,283 $ 1,072,176 $ 30,423,460 $ 1,316,274258
<strong>System</strong>wide - Rate Increase2009-10PreviousBudgetBudgetIncreasefor GrowthIncrease forConversionNew 07-<strong>08</strong>Budget atPreviousRateProjectedRateIncreaseAdditionalCost forRateIncreaseElectric 02.6540.802.321.0203.0980 $ 21,309,495 $ 993,583 $ 22,303,078 1.04 $ 892,123Natural Gas 02.6540.802.322.0203.0980 6,244,458 285,733 6,530,190 1.05 326,510Other (W/Sew/Storm) 02.6540.802.323.0202.980 2,814,227 128,773 2,943,000 1.05 147,150LP/Oil 02.6540.802.413.0203.980 214,278 9,805 224,<strong>08</strong>3 1.05 11,204Solid Waste 02.6580.802.323.0297.830 1,157,276 52,954 1,210,231 1.05 60,512Total: $ 31,739,734 $ 1,470,848 $ 33,210,582 $ 1,437,499Expected Effect on Goal 20<strong>08</strong>:Facility operation has a signifi cant impact on the classroom-learningenvironment. A classroom must have utilities in order to operate.Evidence or Reasoning for this Strategy:Electricity, gas, water, sewer, and solid waste removal are required tooperate schools. Recent events have shown a double-digit increase infuel costs. Progress Energy (electric) has granted a base rate increaseof six percent over the next three years. All other utility companies haveestimated fi ve percent.Legal Implications (if any):Utility bills must be paid.259 FY <strong>2007</strong>-<strong>08</strong> <strong>Plan</strong> for Student Success
<strong>System</strong>wide - Facility LeasesInitiative: Costs of existing mobile units and future mobile unitsCurrent Funding Formula:The current operating budget for fi scal year 2006-07 is $1,566,400. Thelease costs for fi scal year 2006-07 is estimated to be $1,131,582 andrelocation costs to be $434,818 for approximately ten units. We areadding funding for leasing an additional 48 modular classrooms at a costof $397,116 and 56 single unit classrooms per year at a cost of $134,400for a total of $531,516.Implementation Timeline & Budget Needed:<strong>2007</strong>-<strong>08</strong> Amount CodeMobile Unit Leases $ 531,516 04.9100.801.529.0198.0940Total: $ 531,51620<strong>08</strong>-09Mobile Unit Leases $ 531,516 04.9100.801.529.0198.0940Total: $ 531,51620<strong>08</strong>-09Mobile Unit Leases $ 531,516 04.9100.801.529.0198.0940Total: $ 531,516260
<strong>System</strong>wide - Facility LeasesInitiative: Leases - Real Estate ServicesThere are several elements included in the increased budget requestfor the <strong>2007</strong>-<strong>08</strong> fi scal year. The Bannister Properties Lease, the WinnDixie lease and the Crossroads lease all increased, in accordance withthe Board of Education approved contracts, for fi scal year <strong>2007</strong>-<strong>08</strong>. ThePeakway lease decreased by $6,170 and the Dubois lease was renewedto June 30, 20<strong>08</strong>. The Bannister Property lease, Town of Garner lease,Crossroads and the Peakway Development lease are rentals in supportof Administrative functions. The Dubois lease and Winn Dixie lease arerentals providing school space to help support the growth of the system.Implementation Timeline & Budget Needed:The following shows the need over the next three fi scal years:<strong>2007</strong>-<strong>08</strong> 20<strong>08</strong>-09 2009-10Administrative LeasesBannister Lease (Warehouse) $ 30,375 $ 30,375 $ 0Crossroads LeaseJuly - AprilMay - June958,430197,869989,347204,0531,020,268210,2362% Contingency 23,126 23,868 24,610$ 1,179,425 $ 1,217,268 $ 1,255,114Peakway Development Lease (BusParking)$ 20,200 $ 20,200 $ 0Town of Garner Lease $ 1 $ 1 $ 0Subtotal: $ 1,230,001 $ 1,267,844 $ 1,255,114Instructional LeasesDubois Lease $ 44,773 $ 46,937 $ 48,345Winn Dixie Lease $ 503,650 $ 506,337 $ 506,337Moore Square additional parking $ 16,800 $ 16,800 $ 16,800<strong>Wake</strong> Forest Rolesville High additionalparking$ 10,000 $ 10,000 $ 10,000<strong>2007</strong>-<strong>08</strong> 20<strong>08</strong>-09 2009-10Subtotal: $ 575,223 $ 580,074 $ 581,482Less: cost from previous year ($1,681,752) ($1,805,224) ($1,847,918)02.6530.801.311.0318.0940 Total: $ 123,472 $ 42,694 ($ 11,322)Bannister Properties Lease: Budget code 02.6530.801.311.0318.0940$30,375Annual payment recurring next two fi scal years.Crossroads Lease: Budget code 02.6530.801.311.0318.0940CURRENT SQUARE FOOTAGE (74,201 sq. ft.)July 2006-April <strong>2007</strong> $927,512.50May <strong>2007</strong>-June <strong>2007</strong> $191,685.92July <strong>2007</strong>-April 20<strong>08</strong> $958,429.60May 20<strong>08</strong>-June 20<strong>08</strong> $197,869.34July 20<strong>08</strong>-April 2009 $989,346.70May 2009-June 2009 $204,052.74July 2009-April 2010 $1,020,267.70May 2010-June 2010 $210,236.16Add 2% annual contingency for excess use.Peakway Development Lease: Budget code 02.6530.801.311.0318.0940$20,200Annual payment recurring next two fi scal years.Moore Square additional parking:July <strong>2007</strong>-June 20<strong>08</strong> $16,800July 20<strong>08</strong>-June 2009 $16,800July 2009-June 2010 $16,800<strong>Wake</strong> Forest Rolesville High additional parking;July <strong>2007</strong>-June 20<strong>08</strong> $10,000July 20<strong>08</strong>-June 2009 $10,000July 2009-June 2010 $10,000261 FY <strong>2007</strong>-<strong>08</strong> <strong>Plan</strong> for Student Success
<strong>System</strong>wide - Facility LeasesTown of Garner Lease: Budget code 02.6530.801.311.0318.0940 $1Annual payment recurring next two fi scal years.Dubois Lease: Budget code 02.6530.801.311.0318.0940July 07 at $3,000 per month and August 07-June <strong>08</strong> at $3,797.50 permonth for a total fiscal 07-<strong>08</strong> cost of $44,772.50. Recurring the next twofi scal years:July 20<strong>08</strong>-June 2009 $46,937July 2009-June 2010 $48,345Winn Dixie Lease: Budget code 02.6530.801.311.0318.0940July 2006-June <strong>2007</strong> $449,448July <strong>2007</strong>-June 20<strong>08</strong> $503,650July 20<strong>08</strong>-June 2009 $506,337July 2009-June 2010 $506,337Expected Effect on Goal 20<strong>08</strong>:Leasing the warehouse space will enable the storage of both new andused furniture until facilities are ready for use in newly acquired mobileunits, modular complexes and renovated existing facilities.Crossroads houses various Administrative Staff.Growth of Administration required additional space.The Peakway Development lease is for parking of buses.The Dubois lease is for the lease of a modular elementary campus.The Winn Dixie lease is for a school.Evidence or Reasoning for this Strategy:Leases as approved by the Board of Education.Legal Implications (if any):Leases must be paid.262
<strong>System</strong>wide - Safety and SecurityInitiative: Transfer Security <strong>System</strong>s Maintenance Functions to Maintenance and OperationsImplementation Timeline & Budget Needed:Implementation: July, <strong>2007</strong><strong>2007</strong>- <strong>08</strong> MOE Amount CodeSenior AdministratorSecurity TechnicianManagerPosition 9050220Security TechnicianManagerSecurity TechnicianPosition 9050218,9050219Security TechnicianPosition 9050229Security Technician12.00(12.00)12.00(24.00)(12.00)36.00$ 68,5735,2464,8964,047232(49,195)(3,763)(3,513)(4,047)(232)49,1953,7633,5134,047232(94,983)(7,266)(6,782)(8,094)(464)(33,372)(2,553)(2,383)(4,047)(232)128,3559,8199,16512,141696Base 02.6580.002.113.0109.0930SS 02.6910.002.211.0109.0930Ret 02.6910.002.221.0109.0930Hosp 02.6910.002.231.0109.0930Dental 02.6910.002.234.0109.0930Base 02.6330.801.169.0210.0905SS 02.6910.801.211.0210.0905Ret 02.6910.801.221.0210.0905Hosp 02.6910.801.231.0210.0905Dental 02.6910.801.234.0210.0905Base 02.6580.802.176.0109.0930SS 02.6910.802.211.0109.0930Ret 02.6910.802.221.0109.0930Hosp 02.6910.802.231.0109.0930Dental 02.6910.802.234.0109.0930Base 02.6330.801.169.0210.0905SS 02.6910.801.211.0210.0905Ret 02.6910.801.221.0210.0905Hosp 02.6910.801.231.0210.0905Dental 02.6910.801.234.0210.0905Base 02.6330.801.148.0210.0905SS 02.6910.801.211.0210.0905Ret 02.6910.801.221.0210.0905Hosp 02.6910.801.231.0210.0905Dental 02.6910.801.234.0210.0905Base 02.6580.802.169.0109.0930SS 02.6910.802.211.0109.0930Ret 02.6910.802.221.0109.0930Hosp 02.6910.802.231.0109.0930Dental 02.6910.802.234.0109.0930The following funding will transfer from the Security purpose and costcenter codes to Maintenance and Operations purpose and cost centercodes.Expected Effect on Goal 20<strong>08</strong>:The safety/security of students and staff is paramount to the success ofteaching and learning.Evidence or Reasoning for this Strategy:The security maintenance function currently resides in the securitydepartment. This function is dissimilar to the remaining functions in thedepartment and occupies management resources that should be appliedto security operational issues. The maintenance and installation part ofthis function is very similar to the fi re alarms function in Maintenanceand Operations. The transfer of these functions will improve functionality,response time, management oversight, fi scal accountability, the qualityand timeliness for design review, recommendations, and quality control.This remains a critical function (Closed Caption TV (CCTV) systems,security systems, Intelli-Key and card access keyway systems) and aproposed alignment with the Communications Shop (fi re alarm systems,Master Antenna TV (MATV) systems and intercom systems) will providea very important addition to the safety of our schools. These functionscurrently report directly to a director and a senior director position. Thistransfer would require the addition of a senior administrator positionto provide full-time management attention that both functions aredesperately lacking in the current arrangement. This individual will bedealing with contractors on a regular basis, principals, and municipalfi re/police alarm centers in resolving common alarm issues such as falseand trouble alarms, excessive response fees, installations, repairs, etc.Legal Implications (if any):Failure of the fi re alarm or security systems could have signifi cant legalimplications.Supplies(92,000)92,000Total: 12.00 $ 82,99402.6330.801.412.0210.<strong>08</strong>0502.6580.802.412.0109.0930263 FY <strong>2007</strong>-<strong>08</strong> <strong>Plan</strong> for Student Success
<strong>System</strong>wide - Safety and SecurityInitiative: Safety/Recruitment Offi cer for TransportationImplementation Timeline & Budget Needed:<strong>2007</strong>- <strong>08</strong> MOE Amount CodeSafety/RecruitmentOffi cer forTransportation12.00 $ 44,2423,3853,1594,047232Base 02.6550.706.165.0225.0980SS 02.6910.706.211.0225.0980Ret 02.6910.706.221.0225.0980Hosp 02.6910.706.231.0225.0980Dental 02.6910.706.234.0225.0980Total: 12.00 $ 55,065Expected Effect on Goal 20<strong>08</strong>:An employee dedicated to recruitment of quality staff will enhance effortsto recruit and retain the best employee for <strong>Wake</strong> <strong>County</strong> <strong>Public</strong> <strong>School</strong><strong>System</strong> (WCPSS). A focus on educating employees and children onsafety issues will also enhance teaching and learning for all.Evidence or Reasoning for this Strategy:The current vacancy rate for WCPSS bus drivers is between six and tenpercent. Efforts to create bonus incentives for recruiting new drivershas been moderately successful, but added efforts by an employeededicated to recruiting drivers would be an additional positive step inTransportation’s recruitment efforts.The Charlotte-Mecklenburg system, similar in size to WCPSS, has onesuch employee in their Transportation Department.Legal Implications (if any):None.264
<strong>System</strong>wide - Safety and SecurityInitiative: New Computer and diagnostic software for mechanics to improve the safety of the bus fl eet for transporting studentsCurrent Funding Formula:Computer costs w/software, Prolink 14 Districts, 1 Shop(15 x $3,500)Computer cost w/software, 5 team leaders (5 x $1,000)Software cost (6 manufacture specifi c) (6 x $7,000)$ 52,5005,00042,000Evidence or Reasoning for this Strategy:The State of North Carolina has recommended that we put in placeprocesses that will help us obtain a better rating for our preventivemaintenance. The addition of this software would be a step that wouldhelp us improve our overall effi ciency in bus maintenance and repairbuses in a more timely manner.Total: $ 99,500Implementation Timeline & Budget Needed:<strong>2007</strong>- <strong>08</strong> Amount CodePro-Link Software andcomputers for mechanics$ 50,000 02.6550.706.412.0225.0980Total: $ 50,00020<strong>08</strong>-09Pro-Link Software andcomputers for mechanics$ 0(500)02.6550.706.412.0225.0980Total: ($ 500)2009-10Pro-Link Software andcomputers for mechanics($ 49,500) 02.6550.706.412.0225.0980Total: ($ 49,500)Expected Effect on Goal 20<strong>08</strong>:Buses needing repair can be diagnosed and returned to service in atimely manner to not interrupt the safe and on-time transportation ofstudents to and from school. On-time delivery of students enhancesteaching and learning.Having updated and appropriate equipment for an employee to performhis job helps in retention of employees.265 FY <strong>2007</strong>-<strong>08</strong> <strong>Plan</strong> for Student Success
<strong>System</strong>wide - Fixed Asset Replacement and Capital BudgetInitiative: Replace liquifi ed propane (LP) forklift with an electric unitCurrent Funding Formula:The current units are becoming a maintenance burden due to ageand safety concerns. New workplace air quality standards require weeliminate LP gas fumes from the work environment. Industry replacementis recommended at 10 years or 10,000 hours. Currently one lift is 12years old and has maintenance issues. Another will reach the hours orage in fi scal year 2009-10.Implementation Timeline & Budget Needed:<strong>2007</strong>- <strong>08</strong> Amount CodeForklift $ 28,430 04.9200.801.541.0229.096520<strong>08</strong>-09Total: $ 28,430Remove one-time cost fromprevious year($ 28,430) 04.9200.801.541.0229.0965Total: ($ 28,430)2009-10Forklift $ 31,000 04.9200.801.541.0229.0965Total: $ 31,000266
<strong>System</strong>wide - Fixed Asset Replacement and Capital BudgetInitiative: Annual replacement of support vehiclesCurrent Funding Formula:This requirement has been funded at $300,000 per year for the pastseveral years. Vehicles are key to the ability for support functions to respondto maintenance requests, emergencies, and school staff requirements.Any delay in maintenance or central offi ce support will impact theclassroom. Facility condition or central offi ce support has a signifi cantimpact on the classroom-learning environment. A classroom that lacksproper curriculum research, testing lighting, temperature control etc. willdegrade the teacher-student education environment. Maintaining thisenvironment at peak effi ciency as long as possible provides the bestvalue for each dollar spent by the school system by providing the bestlearning environment as long as possible.Repairs on these vehicles are nearing or exceeding the value of the vehiclesand dependability has been dramatically reduced. The criteriaused to determine the timeline for vehicle replacement is a combinationof age, mileage, condition, repair cost history and functionality. <strong>Wake</strong><strong>County</strong> Government currently replaces their vehicles on a 4-year cycle.Implementation Timeline & Budget Needed:<strong>2007</strong>-<strong>08</strong> $ 370,355 Code: 04.9300.801.551.0114.093020<strong>08</strong>-09 ($ 855)2009-10 ($ 2,200)<strong>2007</strong>- <strong>08</strong>Dept Year Miles Model EstimateB&GB>ransportationB&GEHASTransportationB&GB>ransportationB>ransportationTransportationB&GG&STechnologyTransportationE&PPTransportationPurchasingTransportationTransportation1991199219921993199419951994199419951994199719961995199519951996199619971997199919991<strong>08</strong>,84999,335126,892118,435107,531122,171149,614102,878101,412176,889142,657119,359134,338181,576162,458123,37199,798101,412117,478118,517106,132Pu1 Ton Dump TkSedan2 Ton Dump Tk1/2 ton VanSedan3/4 ton Van1 Ton Dump TkSedan1Ton Dump TkSedanSedan1/2 ton Pu1/2 Ton PUSedanBronco 4x43/4 Ton VanSedan1/2 Ton VanSedanSedan$ 15,50032,00015,00044,00016,50015,00016,50032,00015,00032,00015,00015,00015,50015,50014,00015,35516,50015,00018,00015,00015,000Subtotal $ 403,355Less one-time cost from previous year ($ 33,000)Total: $ 370,355267 FY <strong>2007</strong>-<strong>08</strong> <strong>Plan</strong> for Student Success
<strong>System</strong>wide - Fixed Asset Replacement and Capital Budget20<strong>08</strong>-09Dept Year Miles Model EstimateTechnologyTransportationB&GE&PPSecurityTransportationG&SG&SPurchasingG&SM&OE&PPG&SE&PPE&PPPurchasingG&SB>ransportationTransportation19971999199719971997199719971997199819981998199819981998199819991999199919991999101,735104,8<strong>08</strong>117,112105,76795,360118,89098,376155,629104,375144,92997,853131,042126,131121,913154,279101,526131,0421<strong>08</strong>,67389,52277,369VanSedan1/2 Ton Pu1/2 Ton PuCrown Victoria SedanJeep MP1 Ton Dump Tk1 Ton Crew Cab2 Ton Box tk1/2 Ton VanSedan1/2 Ton Van3/4 ton Utility3/4 ton Utility3/4 ton Utility2 Ton Box tk1/2 Ton Van1/2 Ton VanSedanSedan$ 16,50015,00015,50015,50018,50015,00032,00018,50044,00016,50014,00016,50020,00020,00020,00042,00016,50016,50015,00015,000Subtotal $ 402,500Less one-time cost from previous year ($ 403,355)Total: ($ 855)2009-10List TBD $ 400,000Less one-time cost from previous year ($ 402,500)Total: ($ 2,500)268
<strong>System</strong>wide - Fixed Asset Replacement and Capital BudgetInitiative: Grounds equipment replacementCurrent Funding Formula:Grounds equipment items have exceeded their life expectancy and thecurrent condition of the equipment warrants replacement. Each piece ofequipment is different and has an expected life cycle in which it operateseffi ciently and safely.Implementation Timeline & Budget Needed:<strong>2007</strong>- <strong>08</strong> AmountChipperTop DresserSkid Steer$ 40,00020,00039,000Replace old chipperReplace old top dresserReplace 1990 GehlTotal: $ 99,000 04.9200.801.541.0288.<strong>08</strong>3020<strong>08</strong>-093 MowersCompact Wheel Loader$ 24,00048,000Replace old mowersReplace old loader$ 72,000 04.9200.801.541.0298.<strong>08</strong>30Less one-time cost from previous year (99,000)Total: ($ 27,000)2009-10Mini-Excavator2 Tractors4 Mowers$ 40,00040,00032,000Work areas too small forother equipmentReplace old tractorsReplace old mowersLess one-time cost from previous year (72,000)Total: $ 40,000$ 112,000 04.9200.801.541.0288.<strong>08</strong>30269 FY <strong>2007</strong>-<strong>08</strong> <strong>Plan</strong> for Student Success
<strong>System</strong>wide - Fixed Asset Replacement and Capital BudgetInitiative: Activity Bus Service Trucks (Local Trucks)Current Funding Formula:Ensuring effective and effi cient transportation for student athletes toschool activities and fi eld trips enhances teaching and learning.Replacement criteria for all vehicles is at 100,000 miles and mechanicsworking on activity buses cannot use state-funded vehicles.20<strong>08</strong>-09 Amount CodeLess: one-time cost from ($ 37,500) 04.9300.801.551.0225.0980previous yearTotal ($37,500)The Transportation Department has two mechanics assigned to inspect,perform preventive maintenance, and repair breakdowns for 168 activitybuses in <strong>Wake</strong> <strong>County</strong>. The department has two county-owned servicetrucks for these mechanics. Both are over 12 years in age and have over120,000 miles. These vehicles are too costly to maintain and are notreliable means of transportation for them. These vehicles are not on anytype of replacement schedule.Currently, both mechanics are assigned to service trucks that are ownedby the State Board of Education. These service trucks could be assignedby the State to another county school board in North Carolina at anytime. To be consistent with the fact that the two positions are funded bylocal funds, the service trucks these mechanics are assigned should becounty owned as well.Must reimburse the State Board of Education for the use of the servicetrucks.Implementation Timeline & Budget Needed:<strong>2007</strong>-<strong>08</strong> Amount CodeTwo Service trucks (cab andchassis)Two Utility bodiesLess: one-time cost fromprevious year$ 30,5007,000$37,500($2,510)04.9300.801.551.0225.0980Total $ 34,990270
<strong>System</strong>wide - Fixed Asset Replacement and Capital BudgetInitiative: Forklift replacementImplementation Timeline & Budget Needed:<strong>2007</strong>- <strong>08</strong> Amount CodeForklift $ 33,170 04.9300.801.541.0225.0980Total: $ 33,17020<strong>08</strong>-09Less: one-time cost fromprevious year($33,170) 04.9300.801.541.0225.0980Total: ($33,170)Expected Effect on Goal 20<strong>08</strong>:Effi cient operation of parts department insures that mechanics have theneeded parts to repair buses and provide on-time service to students. Aforklift would also improve fi scal accountability with regards to ordering.Evidence or Reasoning for this Strategy:Due to growth in our bus fl eet, the Parts department has expanded insize horizontally and vertically. The current forklift is 35-years old and nolonger cost effective to repair as well as diffi cult to maneuver in tight andnarrow environment.This past summer vertical shelving (directly over head) was added toincrease storage capabilities approximately 600 square feet. We needthe ability to stock inventory with a forklift vertically, which in turn wouldimprove ordering cycles. We would have the ability to order light, highvolume inventory on pallets and store vertically. This would eliminate thefrequency of ordering, improving fi scal accountability.Legal Implications (if any):None.271 FY <strong>2007</strong>-<strong>08</strong> <strong>Plan</strong> for Student Success
<strong>System</strong>wide - Fixed Asset Replacement and Capital BudgetInitiative: Capital BudgetProvide construction, furniture and operational equipment funding for the renovation and replacement of administrative and critical needs spaces orthe construction of new or leased spaces per the long-range administrative space needs assessment and facility master plan, 2001 thru 2010, datedSeptember 2002, revised September 2004.Implementation Timeline & Budget Needed:<strong>2007</strong>-<strong>08</strong> Amount Code20<strong>08</strong>-09 Amount CodeAdministration BuildingRelocation of offi ces and newcubicles design$ 4,000Administration BuildingRelocation of offi ces and newcubicles$ 20,000ConstructionCentral Services ComplexDesign and <strong>Plan</strong>ning forrelocations in FD&C bldg16,0007,500Programming of consolidatedservices/designCentral Services ComplexM&O relocations305,2505,000Relocations to backfi ll FD&Cbldg25,000Transporation relocations/reconfi gurations10,000Noble RoadPrint Shop repairs design5,000CrossroadsPremium costs HVAC systems2,400Print Shop repairs constructionCrossroadsPremium costs HVAC systems<strong>Wake</strong> Early CollegeExpansionUpfi t of Admin space andcafeteria space20,0002,400237,500Facility Modifications at<strong>School</strong>sDesign ServicesConstruction Services12,000112,588Subtotal $ 467,23804.9100.801.526.0109.0940 $317,25004.9100.801.529.0109.0940 $149.988Facility Modifications at<strong>School</strong>sDesign ServicesConstruction Services12,000112,588Less: one-time cost from prioryear(441,988)Total: $ 25,25004.9100.801.526.0109.0940 $253,12504.9100.801.529.0109.0940 ($227,875)Subtotal $ 441,98804.9100.801.526.0109.0940 $64,12504.9100.801.529.0109.0940 $377,863Less: one-time cost from prioryear(534,000)Total: ($ 92,012)04.9100.801.526.0109.0940 $24,12504.9100.801.529.0109.0940 ($116,137)272
<strong>System</strong>wide - Fixed Asset Replacement and Capital Budget2009-10 Amount CodeAdministration BuildingRelocation of offi ces and newcubiclesDesign of consolidatedservices/designCrossroadsPremium costs HVACsystemsFacility Modifications at<strong>School</strong>sDesign ServicesConstruction ServicesLess: one-time cost fromprior year$ 20,0001,729,7502,40012,000112,588Subtotal $1,876,738(467,238)Total: $1,409,50004.9100.801.526.0109.0940 $1,741,75004.9100.801.529.0109.0940 $134,98804.9100.801.526.0109.0940 $1,424,50004.9100.801.529.0109.0940 ($227,875)The rapid increases in enrollment do not have a direct correlation to anincrease in administrative positions or space, but steady increases willresult in a continued strain of existing staff to support the goal withoutthe increase of additional human resources. The capital outlay budgetpermits modest expenditures for aligned and prioritized projects to meetthe Superintendent’s most critical needs.Status Campus Building Status TermsamesamerevisedsameAdministrativeBuildingCentral ServicesMillbrook ESNoble RoadOriginalConstructionGrossSF3600 <strong>Wake</strong>Forest Road Owned N/A 1968 98,875Rock QuarryRoad Owned N/A 1989 210,640Media Ctr.,Magnet Ctr. Owned N/A 1948, 1954 10,547Buildings 1, 2and Trailer Owned N/A 1952, 1966 21,026Heddingham1986; Renovationsame Oaks Condos Units 1-6 Leased 30YR2005 9,100revised Garner ES Building 4 Leased 1952 9,286same Crossroads Building 2 Leased 1YRsamesamenewsamesamenewnewRenovation2005 74,201Bannister WHS,Hwy 70 Building 1 Leased 1YR 2004 8,100Bus Parking Lot,Apex Area Leased 2YR 2004Building ProgramOffi ces <strong>2007</strong> 17,600Parking Lot,Moore SquareMS Capacity Leased 99YR 2001Parking Lot,<strong>Wake</strong> Forest Capacity Leased 1YR 2005Winn-Dixie,9th Grade Center Capacity Leased 10YR 2006Dubois Center,Ground Lease Capacity Leased 2YR 200550,000SFEvidence or Reasoning for this Strategy:Previous Superintendent’s leadership teams developed the overallobjectives of the space needs assessment for the 2002 Facility Master<strong>Plan</strong> with the intent to bring an intelligent and creative energy tomaximizing use of the existing facilities, providing a dynamic tool in along-term facility master plan to support annual budget development,and to ultimately establish a prioritized and aligned capital plan for the<strong>Wake</strong> <strong>County</strong> <strong>Public</strong> <strong>School</strong> <strong>System</strong> (WCPSS) Administrative Facilitiesthrough a ten-year projection.273 FY <strong>2007</strong>-<strong>08</strong> <strong>Plan</strong> for Student Success
<strong>System</strong>wide - Fixed Asset Replacement and Capital BudgetThe Facility Master <strong>Plan</strong> identifi ed a need for an additional 72,000 SFby 2010. Since 2002, additional square footage has been leased andfurnished. Major administrative capital projects are programmed andsubmitted with the Capital Building Program. Annual lease payments aremade from the Real Estate Services’ budget.Growth rates of administrative space compared to new school capacityor enrollment growth is inconsistent. Student support areas have grownwith the lease of the Crossroads Building II into 74,201 SF. The changesupported relocation of the Teacher Recruitment Center and HumanResources from <strong>Wake</strong> Forest Road to the Crossroads’ Webster Center.The relocation permitted the realignment of space in <strong>Wake</strong> Forest Roadto address growth in the Growth and <strong>Plan</strong>ning Department, TechnologyServices, and Business Services. In late 2005, the recently purchased9,100 SF office units at River Oaks were renovated for PreventionServices. This permits their relocation from Noble Road and backfi ll byTechnology Services technicians.2010 Space needs increase 72,000 SFLess CRII 2005 increase of 28,000 44,000 SFLess River Oaks Condos 9,100 34,900 SFGarner Center is leased from the Town of Garner for $1 per year. The1950 building requires extensive asbestos and lead paint abatement andmajor renovation. The lease contract from the Town of Garner requiresthe town to provide exterior maintenance, but no renovation.over the summer of <strong>2007</strong>. Design for those contracts can occur within theFY 2006-07 budget.The Long Range Capital Improvement <strong>Plan</strong> has been approved by thepassage of the 2006 General Obligation Bonds. Within the buildingprogram, program management services and employees have beenhoused at the Central Services Complex. The implementation of thelargest building program ever undertaken by the school system requiresreorganization of the offi ce space services provided. The <strong>County</strong> fi nanceoffi ce has approved the use of program management funds for thelease of building program support staff. The budget requests design andfurnishing of this 12,800 SF space and leasing an adjacent 4,800 SF ofwarehouse and loading dock space.Backfi lling part of the existing Facilities Building space vacated by thebuilding program management staff will serve the administrative growthneeds for Auxiliary Services. The 10,300 SF space will require minormodifi cations as new personnel are housed.The Crossroads II lease expires April 2011. In order to occupy or identifyleased property in 2011, programming of our space needs and designneeds to start in 20<strong>08</strong> and 2009.With <strong>2007</strong>-<strong>08</strong> conversions of traditional calendar schools in the Garnerarea to a year-round calendar, the Town has requested to utilize at leasttwo of the classrooms into track-out programs. This expansion of useby the Town and the expensive cost to renovate a leased structurerequires an adjustment to the Facility Master <strong>Plan</strong> from previous year’ssubmittal.The 2006 opening of the <strong>Wake</strong> Early College <strong>School</strong> at the <strong>Wake</strong>Technical College campus required minor renovations to the existingspace to accommodate the students and staff. Next year, the school willexpand with its next class of students. Staff is currently negotiating thelease of the property. Renovations of the space will need to take place274
Commitments by the Board of Education to Programs for Future FundingInitiative: Traditional to Year-Round Conversion - Local Literacy MonthsBoard approved 19 schools to move from a traditional to a year-roundcalendar schedule. In keeping with current practice, year-round schoolsreceive six Months of Employment (MOE) for Local Literacy Teachersto support K-2 Intervention and Coaching as opposed to fi ve MOE fortraditional. This increase refl ects a one-time adjustment in MOE.Implementation Timeline & Budget Needed:<strong>2007</strong>- <strong>08</strong> MOE Amount Code1 additional MOE for19 elementary schoolstransitioning to year-round19.00 $ 82,83610,7696,3375,9157,689441Base 02.5500.001.121.0293.0000Supp 02.5500.001.181.0293.0000SS 02.5910.001.211.0293.0000Ret 02.5910.001.221.0293.0000Hosp 02.5910.001.231.0293.0000Dental 02.5910.001.234.0293.0000Total: 19.00 $ 113,987Expected Effect on Goal 20<strong>08</strong>:Local Literacy position provides literacy interventions for at-risk studentsin K-2 grades. The coaching aspect provides best instructional practicestaff development at the school site. This has shown to improve classroominstruction for all studentsEvidence or Reasoning for this Strategy:Board approved this position 10+ years ago to assist in the instruction ofat-risk students K-2.Legal Implications (if any):None275 FY <strong>2007</strong>-<strong>08</strong> <strong>Plan</strong> for Student Success
Commitments by the Board of Education to Programs for Future FundingInitiative: Traditional to Year-Round Conversion - Media Specialists Months of Employment (MOE)Implementation Timeline & Budget Needed:Media Specialist Formula Difference150-824 students: 12 MOE YR vs. 10 MOE Traditional 2 MOE increase825-999 students: 18 MOE YR vs. 15 MOE Traditional 3 MOE increase1000-1499 students: 22 MOE YR vs. 20 MOE Traditional 2 MOE increaseat Elementary24 MOE YR vs. 20 MOE Traditional 4 MOE increaseat Middle 1,499 students: No difference in formula for YR vs. TraditionalExpected Effect on Goal 20<strong>08</strong>:Library Media Services supports the instructional programs and thefocus on Goal 20<strong>08</strong>.Evidence or Reasoning for this Strategy:The Board approved year-round conversions of 22 school sites effectiveJuly 1, <strong>2007</strong>.Legal Implications (if any):None<strong>2007</strong>- <strong>08</strong> MOE Amount Code19 Elementarytransition to YR3 Middle transitionto YR44.0010.00$ 269,73020,63419,25921,854$ 331,477 StateBase 01.5810.007.121.0170.0000SS 01.5910.007.211.0170.0000Ret 01.5910.007.221.0170.0000Hosp 01.5910.007.231.0170.0000$ 35,0652,6822,5041,253Supp 02.5810.007.181.0170.0000SS 02.5910.007.211.0170.0000Ret 02.5910.007.221.0170.0000Dental 02.5910.007.234.0170.0000$ 41,504 LocalReduction to baseadjustment: 45 MOEdue to previous overallocationsto magnetschools in 2006-07(45.00) ($224,775)(17,195)(16,049)(18,212)($276,231) StateBase 01.5810.007.121.0170.0000SS 01.5910.007.211.0170.0000Ret 01.5910.007.221.0170.0000Hosp 01.5910.007.231.0170.0000($ 29,221)(2,235)(2,<strong>08</strong>6)(1,044)02.5810.007.181.0170.000002.5910.007.211.0170.000002.5910.007.221.0170.000002.5910.007.234.0170.0000($ 34,586) LocalTotal: 9.00 $ 62,164276
Commitments by the Board of Education to Programs for Future FundingInitiative: Traditional to Year-Round Conversions - In-<strong>School</strong> Suspension Teacher Months of Employment (MOE)Implementation Timeline & Budget Needed:<strong>2007</strong>- <strong>08</strong> MOE Amount CodeAdditional MOE forTraditional CalendarMiddle <strong>School</strong>s,converting to Year-Round(change from 10 to 12MOE)(Total: 3 schools x 2additional MOE)East <strong>Wake</strong> MiddleNorth Garner MiddleSalem Middle6.00 $ 27,6362,1141,9736.00 $ 31,723 State$ 3,5932752570.00 $ 4,125 LocalBase 01.5500.069.121.0147.0000SS 01.5910.069.211.0147.0000Ret 01.5910.069.221.0147.0000Supp 02.5500.069.181.0147.0000SS 02.5910.069.211.0147.0000Ret 02.5910.069.221.0147.0000No Change in Hospital orDentalMatching (10 MOEpositionreceives the same as a12 MOE)Total: 6.00 $ 35, 848Expected Effect on Goal 20<strong>08</strong>:Evidence or Reasoning for this Strategy:Legal Implications (if any):277 FY <strong>2007</strong>-<strong>08</strong> <strong>Plan</strong> for Student Success
Commitments by the Board of Education to Programs for Future FundingInitiative: Traditional to Year-Round Conversion of Social Worker monthsCurrent Funding Formula:Year-round schools are allotted one additional social work MOE.Implementation Timeline & Budget Needed:<strong>2007</strong>- <strong>08</strong> MOE Amount Code<strong>School</strong> Social WorkMOE (recurring)22.00 $ $97,284$7,442$6,946$8,902Base 01.5820.007.139.0202.<strong>08</strong>20SS 01.5910.007.211.0202.<strong>08</strong>20Ret 01.5910.007.221.0202.<strong>08</strong>20Hosp 01.5910.007.231.0202.092022.00 $120,574 State$ 16,2531,2431,160510Supp 02.5820.007.181.0202.<strong>08</strong>20SS 02.5910.007.211.0202.<strong>08</strong>20Ret 02.5910.007.221.0202.<strong>08</strong>20Dental 02.5910.007.234.0202.<strong>08</strong>200.00 $ 19,166 LocalTotal: 22.00 $139,740*NOTE: Salary grade is based on $126 added per month for advanced certifi cation and 10years of experience, since position requires Master of Social Work degree.Expected Effect on Goal 20<strong>08</strong>:Evidence or Reasoning for this Strategy:Legal Implications (if any):None278
Commitments by the Board of Education to Programs for Future FundingInitiative: Traditional to Year-Round Conversion of Psychologist monthsImplementation Timeline & Budget Needed:<strong>2007</strong>- <strong>08</strong> MOE Amount CodePsychologist MOE 22.00 $ 99,0007,5747,0698,902Base 01.5850.007.139.0202.<strong>08</strong>20SS 01.5910.007.211.0202.<strong>08</strong>20Ret 01.5910.007.221.0202.<strong>08</strong>20Hosp 01.5910.007.231.0202.<strong>08</strong>2022.00 $122,545 State$ 18,2481,3961,303510Supp 02.5850.007.181.0202.<strong>08</strong>20SS 02.5910.007.211.0202.<strong>08</strong>20Ret 02.5910.007.221.0202.<strong>08</strong>20Dental 02.5910.007.234.0202.<strong>08</strong>200.00 $ 21,457 LocalTotal: 22.00 $144,002*NOTE: Salary grade is based on $126 added per month for advanced certifi cation and 5years of experience.Expected Effect on Goal 20<strong>08</strong>:Psychologists help schools to meet the needs of struggling studentsby consulting with teachers, and assisting in the development ofintervention strategies.Evidence or Reasoning for this Strategy:As schools are converted from traditional to year round, enrollmentsincrease and students are in session during all 12 months. Thisallows one additional month of school psychologist time for each of theconverted schools.Legal Implications (if any):Compliance with NC Procedures for Exceptional Students that requireno more than 90-days between referral and placement is facilitated byhaving psychologists available while year-round schools are in session.279 FY <strong>2007</strong>-<strong>08</strong> <strong>Plan</strong> for Student Success
Commitments by the Board of Education to Programs for Future FundingInitiative: Traditional to Year-Round Conversion of <strong>School</strong> Counselor monthsCurrent Funding Formula:Counselors are allotted according to school enrollment as follows:Elementary <strong>School</strong>s• Under 824 students: 10 MOE per traditional-calendar /12 MOE peryear-round school• 824 – 999 students: 15 MOE per school• 1000 students: 20 MOE per schoolAllotment based on student planning allotment. Year-round allocation isbased on ¾ of the student planning allotment.Evidence or Reasoning for this Strategy:Middle <strong>School</strong>s• 1-400 students: 10 MOE• 401-849 students: 20 MOE• 850-1249 students: 10 MOE per grade level• 1250-1549 students: 10 additional MOE• 1550-1850 students: 10 additional MOEYear-Round allocation is based on ¾ of the student planning allotmentplus 2 additional MOE.Implementation Timeline & Budget Needed:<strong>2007</strong>- <strong>08</strong> MOE Amount CodeCounselor MOE(5 Positions)Salary projection basedon 5 years experience50.00 $ 230,36617,62316,44820,235Base 01.5830.007.121.0146.<strong>08</strong>20SS 01.5910.007.211.0146.<strong>08</strong>20Ret 01.5910.007.221.0146.<strong>08</strong>20Hosp 01.5910.007.231.0146.<strong>08</strong>2050.00 $ 284,672 State$ 36,8592,8202,6321,160Supp 02.5830.007.181.0146.<strong>08</strong>20SS 02.5910.007.211.0146.<strong>08</strong>20Ret 02.5910.007.221.0146.<strong>08</strong>20Dental 02.5910.007.234.0146.<strong>08</strong>200.00 $ 43,471 LocalTotal: 50.00 $ 328,143Expected Effect on Goal 20<strong>08</strong>:280
Commitments by the Board of Education to Programs for Future FundingInitiative: Salary Increases for Employees at <strong>School</strong>s Converting to a Year-Round Calendar in <strong>2007</strong>-<strong>08</strong><strong>Wake</strong> <strong>County</strong> <strong>Public</strong> <strong>School</strong> <strong>System</strong> salary schedules provide highersalaries for the following positions when located at a year-round school:principal, assistant principal, lead school secretary and NC Wise datamanager. The <strong>2007</strong>-<strong>08</strong> conversion of 22 schools from traditional calendarto year-round calendar will provide salary increases for employees atthese four positions in each of the schools.Implementation Timeline & Budget Needed:Expected Effect on Goal 20<strong>08</strong>:Required by <strong>Wake</strong> <strong>County</strong> <strong>School</strong> Board action for year-round schoolconversion.Evidence or Reasoning for this Strategy:Required by <strong>Wake</strong> <strong>County</strong> <strong>School</strong> Board action for year-round schoolconversion.Assumptions Used:1) Principals, assistant principals employed on January 8, <strong>2007</strong> inschools to be converted.2) A 4 percent local supplement increase for principals and assistantprincipals whose schools are converted from traditional, nonmagnetstatus to a multi-track year-round schedule.3) A 2 percent local supplement increase for principals and assistantprincipals whose schools are converted from magnet status to amulti-track year-round schedule.4) A two-step salary increase for NC Wise data managers and leadsecretaries whose schools are converted to a multi-track year-round schedule.<strong>2007</strong>- <strong>08</strong> Amount CodeSupplement increases forprincipals and assistantprincipalsSalary increases for leadsecretariesSalary increases for NC Wisedata managers$ 148,45211,35710,59916,2541,2431,16115,3791,1761,098Base 02.6410.005.181.0109.0000SS 02.6910.005.211.0109.0000Ret 02.6910.005.221.0109.0000Base 02.6410.003.151.0109.0000SS 02.6910.003.211.0109.0000Ret 02.6910.003.221.0109.0000Supp 02.6410.003.151.0231.0000SS 02.6910.003.211.0231.0000Ret 02.6910.003.221.0231.0000Total: $ 206,719281 FY <strong>2007</strong>-<strong>08</strong> <strong>Plan</strong> for Student Success
Commitments by the Board of Education to Programs for Future FundingInitiative: Increase 11-month assistant principals to 12-month assistant principals at schools converting to a year-round calendarAdd an additional month of employment for 11-month assistant principalsat schools converting from traditional calendar to year-round calendar forthe <strong>2007</strong>-<strong>08</strong> school year.Implementation Timeline & Budget Needed:Assumption: Eleven-month assistant principals employed on January8, <strong>2007</strong> in schools to be converted, and their 2006-07 salaries are thebasis for the costing.<strong>2007</strong>- <strong>08</strong> MOE Amount CodeAssistant Principals 21.00 $ 99,81919,<strong>08</strong>39,0968,490Base 02.6410.005.116.0109.0000Supp 02.6410.005.181.0109.0000SS 02.6910.005.211.0109.0000Ret 02.6910.005.221.0109.0000Total: 21.00 $ 136,488Expected Effect on Goal 20<strong>08</strong>:Required by <strong>Wake</strong> <strong>County</strong> <strong>School</strong> Board action for year-round schoolconversion.Evidence or Reasoning for this Strategy:Required by <strong>Wake</strong> <strong>County</strong> <strong>School</strong> Board action for year-round schoolconversion.Legal Implications (if any):None282
Commitments by the Board of Education to Programs for Future FundingInitiative: Traditional to Year-Round Conversion - Utility budget increaseUtility budget increase for year-round conversion of almost two millionsquare feet.Implementation Timeline & Budget Needed:<strong>2007</strong>- <strong>08</strong>Year-RoundConversionSFUtility CostDifferenceYear-RoundConversionCostElectric02.6540.802.321.0203.0980Natural Gas02.6540.802.322.0203.0980Other (W/Sew/Storm)02.6540.802.323.0203.0980LP/Oil02.6540.802.413.0203.0980Solid Waste02.6580.802.323.0297.<strong>08</strong>301,986,579 $ 0.182 $ 361,5571,986,579 0.052 103,3021,986,579 0.024 47,6781,986,579 0.002 3,9731,986,579 0.010 19,866Total: $ 536,376Expected Effect on Goal 20<strong>08</strong>:Facility operation has a signifi cant impact on the classroom learningenvironment. A classroom must have utilities in order to operate.Evidence or Reasoning for this Strategy:The Board of Education has decided to convert almost two millionsquare feet of schools from traditional to year round to meet capacityrequirements. Year-round schools tend to use more utilities due tofacilities being occupied full time during the summer months.Legal Implications (if any):None283 FY <strong>2007</strong>-<strong>08</strong> <strong>Plan</strong> for Student Success
Commitments by the Board of Education to Programs for Future FundingInitiative: Traditional to Year-Round Conversion - Maintenance dollars to maintain year-round conversion square footage (SF)Implementation Timeline & Budget Needed:<strong>2007</strong>- <strong>08</strong>Year-RoundConversionSFMaintenanceCostDifferenceYear-RoundConversionCostContracted Services02.6580.802.311.0296.<strong>08</strong>3002.6580.802.311.0295.<strong>08</strong>301,986,579 $ 0.16 $ 190,712127,141Total: $ 317,853Expected Effect on Goal 20<strong>08</strong>:Facility operation has a signifi cant impact on the classroom-learningenvironment.Evidence or Reasoning for this Strategy:The Board of Education has decided to convert almost two millionsquare feet of schools from traditional to year round to meet capacityrequirements. Year-round schools tend to require more maintenancedue to facilities being occupied full time during the summer months.Maintenance functions include preventive maintenance on all facilities’systems, emergency response, and some minor repairs.Legal Implications (if any):None284
Commitments by the Board of Education to Programs for Future FundingInitiative: Traditional to Year-Round Conversion - Increase custodial dollars to include housekeeping of year-round conversion square footage (SF)Implementation Timeline & Budget Needed:1,986,579 SF at $0.02 per square foot<strong>2007</strong>- <strong>08</strong>Year-RoundConversionSFCustodialCostDifferenceYear-RoundConversionCostContracted Services02.6540.003.311.0264.<strong>08</strong>301,986,579 $ 0.02 $ 39,732Total: $ 39,732Expected Effect on Goal 20<strong>08</strong>:Facility operation has a signifi cant impact on the classroom-learningenvironment.Evidence or Reasoning for this Strategy:The Board of Education has decided to convert almost two millionsquare feet of schools from traditional to year round to meet capacityrequirements. Year-round schools tend to require more housekeepingdue to facilities being occupied full time during the summer months.Housekeeping functions include vacuuming carpet, cleaning fl oors,dusting, cleaning bathrooms, etc.Legal Implications (if any):None285 FY <strong>2007</strong>-<strong>08</strong> <strong>Plan</strong> for Student Success
Commitments by the Board of Education to Programs for Future FundingInitiative: Intersession teachers and teacher assistants for new and converted year-round elementary schoolsImplementation Timeline & Budget Needed:<strong>2007</strong>- <strong>08</strong> MOE Amount Code10-month teachers(@$50,000) for 19elementary schoolsbeing converted to multitrackyear round190.00$ 822,511127,48972,67567,83076,8934,4<strong>08</strong>Base 02.5100.001.121.0105.0000Supp 02.5100.001.181.0105.0000SS 02.5910.001.211.0105.0000Ret 02.5910.001.221.0105.0000Hosp 02.5910.001.231.0105.0000Dental 02.5910.001.234.0105.000010-month teacherassistants (@$25,000)for 19 elementaryschools being convertedto multi-track year round190.00$ 475,00036,33833,91576,8934,4<strong>08</strong>Base 02.5100.027.142.0105.0000SS 02.5910.027.211.0105.0000Ret 02.5910.027.231.0105.0000Hosp 02.5910.027.231.0105.0000Dental 02.5910.027.234.0105.0000Total: 380.00 $ 1,798,360Expected Effect on Goal 20<strong>08</strong>:Evidence or Reasoning for this Strategy:Many students who attend year-round elementary schools do not enrolluntil after the school year has started. Intersession teachers work withstudents during the intersession period to “catch them up” and to provideremediation to other students who are behind in their academic work.The target population, in many cases, tends to be students with lowachievement and/or low income and who are in need of an enhancedlearning model.Legal Implications (if any):None286
Commitments by the Board of Education to Programs for Future FundingInitiative: Substitutes for 12 Months of Employment (MOE) staff for planning days at Year-Round <strong>School</strong>sImplementation Timeline & Budget Needed:<strong>2007</strong>- <strong>08</strong> Amount Code$1,800 for each of 19 elementaryschools being converted to amulti-track year-round calendar$3,600 for each of 3 middleschools being converted to amulti-track year-round calendar$ 34,2002,61615,6001,193Base 02.5100.801.182.0105.<strong>08</strong>05SS 02.5910.801.211.0105.<strong>08</strong>05Base 02.5100.801.182.0105.<strong>08</strong>05SS 02.5910.801.211.0105.<strong>08</strong>05Total: $ 53,60920<strong>08</strong>-09$1,800 for one elementary schoolbeing converted to a multi-trackyear -round calendar$3,600 for one middle schoolbeing converted to a multi-trackyear-round calendar$ 1,8001383,600275Base 02.5100.801.182.0105.<strong>08</strong>05SS 02.5910.801.211.0105.<strong>08</strong>05Base 02.5100.801.182.0105.<strong>08</strong>05SS 02.5910.801.211.0105.<strong>08</strong>05Total: $ 5,813Expected Effect on Goal 20<strong>08</strong>:Evidence or Reasoning for this Strategy:To meet the needs of all students on all tracks and equitably teach theNorth Carolina Standard Course of Study, multi-track year-round schoolsmust have some 11- and 12-month teachers. These teachers mustbe able to have planning days during the school year. Since schoolsare dependent on special classes for planning periods for classroomteachers, substitutes must be provided for year-round schools.Legal Implications (if any):None287 FY <strong>2007</strong>-<strong>08</strong> <strong>Plan</strong> for Student Success
Commitments by the Board of Education to Programs for Future FundingInitiative: This initiative is a whole school conversion of East <strong>Wake</strong> High <strong>School</strong> to create four autonomous high schools (Grades 9-12)averaging 400 students each, and emphasizing rigor, relevance, and relationships.Implementation Timeline & Budget Needed:The first of the high schools, the East <strong>Wake</strong> High <strong>School</strong> of HealthScience opened in the 2005-06 school year. The second of the highschools, the East <strong>Wake</strong> High <strong>School</strong> of Integrated Technology, openedin the 2006-07 school year. The last two high schools, <strong>School</strong> of Arts,Education and Global Studies and <strong>School</strong> of Engineering <strong>System</strong>s, arescheduled to open in the <strong>2007</strong>-<strong>08</strong> school year.<strong>2007</strong>- <strong>08</strong> MOE Amount CodePrincipal - CSchedule, 6thYear Degree, 15years (+5%)Assistant Principal- 15 years, +4%(+5%)12.00$ 58,6804,4894,1904,04712.00 $ 71,406 State$ 34,9452,6732,4952320.00 $ 40,345 Local12.00 $ 111,7516.00 $ 29,1566,2692,7102,5292,024116Base 01.6410.005.114.0109.0000SS 01.6910.005.211.0109.0000Ret 01.6910.005.221.0109.0000Hosp 01.6910.005.231.0109.0000Supp 02.6410.005.181.0109.0000SS 02.6910.005.211.0109.0000Ret 02.6910.005.221.0109.0000Dental 02.6910.005.234.0109.0000Base 02.6410.005.116.0109.0000Supp 02.6410.005.181.0109.0000SS 02.6910.005.211.0109.0000Ret 02.6910.005.221.0109.0000Hosp 02.6910.005.231.0109.0000Dental 02.6910.005.234.0109.0000<strong>2007</strong>- <strong>08</strong> MOE Amount CodeLead Secretary- PG23, 15 years(+2.5%)Registrar - PG20,15 years (+2.5%)NC Wise DataManager - PG22,15 years (+2.5%)Counselor - 15years, Masters(+5%)12.00 $ 34,7902,6612,4844,04723212.00 $ 44,214 Local6.00 $ 14,4751,1071,0342,0241166.00 $ 18,756 Local6.00 $ 16,3551,2511,1682,0241166.00 $ 20,914 Local10.00 $ 46,2637,9874,1503,8734,04723210.00 $ 66,552 LocalBase 02.6410.003.151.0109.0000SS 02.6910.003.211.0109.0000Ret 02.6910.003.221.0109.0000Hosp 02.6910.003.231.0109.0000Dental 02.6910.003.234.0109.0000Base 02.6410.003.151.0109.0000SS 02.6910.003.211.0109.0000Ret 02.6910.003.221.0109.0000Hosp 02.6910.003.231.0109.0000Dental 02.6910.003.234.0109.0000Base 02.6410.003.151.0109.0000SS 02.6910.003.211.0109.0000Ret 02.6910.003.221.0109.0000Hosp 02.6910.003.231.0109.0000Dental 02.6910.003.234.0109.0000Base 02.5830.007.121.0146.0000Supp 02.5830.007.181.0146.0000SS 02.5910.007.211.0146.0000Ret 02.5910.007.221.0146.0000Hosp 02.5910.007.231.0146.0000Dental 02.5910.007.234.0146.00006.00 $ 42,804 Local288
Commitments by the Board of Education to Programs for Future Funding<strong>2007</strong>- <strong>08</strong> MOE Amount Code<strong>2007</strong>- <strong>08</strong> MOE Amount CodeCounselor Dean -15 years, Masters(+5%)3.00 $ 13,8782,3961,2451,1621,214703.00 $ 19,965 LocalBase 02.5830.007.121.0146.0000Supp 02.5830.007.181.0146.0000SS 02.5910.007.211.0146.0000Ret 02.5910.007.221.0146.0000Hosp 02.5910.007.231.0146.0000Dental 02.5910.007.234.0146.0000Assistant Principal- 15 years, +4%(+5%)12.00 $111,7516.00 $ 29,1566,2692,7102,5292,024116Base 02.6410.005.116.0109.0000Supp 02.6410.005.181.0109.0000SS 02.6910.005.211.0109.0000Ret 02.6910.005.231.0109.0000Hosp 02.6910.005.231.0109.0000Dental 02.6910.005.234.0109.0000Clerical Assistant- PG18, 15 years(+2.5%)6.00 $ 12,7759779122,0241166.00 $ 16,804 LocalBase 02.6410.003.151.0109.0000SS 02.6910.003.211.0109.0000Ret 02.6910.003.221.0109.0000Hosp 02.6910.003.231.0109.0000Dental 02.6910.003.234.0109.0000Lead Secretary- PG23, 15 years(+2.5%)6.00 $ 42,804 Local12.00 $ 34,7902,6612,4844,047232Base 02.6410.003.151.0109.0000SS 02.6910.003.211.0109.0000Ret 02.6910.003.221.0109.0000Hosp 02.6910.003.231.0109.0000Dental 02.6910.003.234.0109.0000Secretary - PG19,15 years (+2.5%)2.75 $ 6,3154834511,113642.75 $ 8,426Base 02.6410.003.151.0109.0000SS 02.6910.003.211.0109.0000Ret 02.6910.003.221.0109.0000Hosp 02.6910.003.231.0109.0000Dental 02.6910.003.234.0109.0000Registrar - PG20,15 years (+2.5%)12.00 $ 44,214 Local6.00 $ 14,4751,1071,0342,024116Base 02.6410.003.151.0109.0000SS 02.6910.003.211.0109.0000Ret 02.6910.003.221.0109.0000Hosp 02.6910.003.231.0109.0000Dental 02.6910.003.234.0109.0000Bookkeeper -PG22, 15 years(+2.5%)3.00 $ 8,1806265841,214703.00 $ 10,674 LocalBase 02.6410.003.151.0109.0000SS 02.6910.003.211.0109.0000Ret 02.6910.003.221.0109.0000Hosp 02.6910.003.231.0109.0000Dental 02.6910.003.234.0109.0000NC Wise DataManager - PG22,15 years (+2.5%)6.00 $ 18,756 Local6.00 $ 16,3551,2511,1682,024116Base 02.6410.003.151.0109.0000SS 02.6910.003.211.0109.0000Ret 02.6910.003.221.0109.0000Hosp 02.6910.003.231.0109.0000Dental 02.6910.003.234.0109.0000Subtotal forEWHS ofEngineeringPrincipal - CSchedule, 6thYear Degree, 15years (+5%)66.75 $360,86012.00 $ 58,6804,4894,1904,047Base 01.6410.005.114.0109.0000SS 01.6910.005.211.0109.0000Ret 01.6910.005.221.0109.0000Hosp 01.6910.005.231.0109.0000Counselor - 15years, Masters(+5%)6.00 $ 20,914 Local10.00 $ 46,2637,9874,1503,8734,04723210.00 $ 66,552 LocalBase 02.5830.007.121.0146.0000Supp 02.5830.007.181.0146.0000SS 02.5910.007.211.0146.0000Ret 02.5910.007.221.0146.0000Hosp 02.5910.007.231.0146.0000Dental 02.5910.007.234.0146.0000$ 71,406 State$ 34,9452,6732,495232Supp 02.6410.005.181.0109.0000SS 02.6910.005.211.0109.0000Ret 02.6910.005.221.0109.0000Dental 02.6910.005.234.0109.0000Counselor Dean -15 years, Masters(+5%)3.00 $ 13,8782,3961,2451,1621,21470Base 02.5830.007.121.0146.0000Supp 02.5830.007.181.0146.0000SS 02.5910.007.211.0146.0000Ret 02.5910.007.221.0146.0000Hosp 02.5910.007.231.0146.0000Dental 02.5910.007.234.0146.0000$ 40,345 Local3.00 $ 19,965289 FY <strong>2007</strong>-<strong>08</strong> <strong>Plan</strong> for Student Success
Commitments by the Board of Education to Programs for Future Funding<strong>2007</strong>- <strong>08</strong> MOE Amount Code<strong>2007</strong>- <strong>08</strong> MOE Amount CodeClerical Assistant- PG18, 15 years(+2.5%)6.00 $ 12,7759779122,024116Base 02.6410.003.151.0109.0000SS 02.6910.003.211.0109.0000Ret 02.6910.003.221.0109.0000Hosp 02.6910.003.231.0109.0000Dental 02.6910.003.234.0109.0000Bookkeeper -PG22, 15 years(+2.5%)3.00 $ 8,1806265841,21470Base 02.6410.003.151.0109.0000SS 02.6910.003.211.0109.0000Ret 02.6910.003.221.0109.0000Hosp 02.6910.003.231.0109.0000Dental 02.6910.003.234.0109.00006.00 $ 16,804 Local3.00 $ 10,674 LocalSecretary - PG19,15 years (+2.5%)Bookkeeper -PG22, 15 years(+2.5%)2.75 $ 6,3154834511,113642.75 $ 8,4263.00 $ 8,1806265841,21470Base 02.6410.003.151.0109.0000SS 02.6910.003.211.0109.0000Ret 02.6910.003.221.0109.0000Hosp 02.6910.003.231.0109.0000Dental 02.6910.003.234.0109.0000Base 02.6410.003.151.0109.0000SS 02.6910.003.211.0109.0000Ret 02.6910.003.221.0109.0000Hosp 02.6910.003.231.0109.0000Dental 02.6910.003.234.0109.0000Counselor Dean -15 years, Masters(+5%)Subtotal forEWHS ofIntegratedTechnology3.00 $ 13,8782,3961,2451,1621,214703.00 $ 19,965 Local14.75 $ 55,869Base 02.5830.007.121.0146.0000Supp 02.5830.007.181.0146.0000SS 02.5910.007.211.0146.0000Ret 02.5910.007.221.0146.0000Hosp 02.5910.007.231.0146.0000Dental 02.5910.007.234.0146.00003.00 $ 10,674 LocalSubtotal forEWHS of Arts,Education andGlobal Studies66.75 $360,860Clerical Assistant- PG18, 15 years(+2.5%)6.00 $ 12,7759779122,024116Base 02.6410.003.151.0109.0000SS 02.6910.003.211.0109.0000Ret 02.6910.003.221.0109.0000Hosp 02.6910.003.231.0109.0000Dental 02.6910.003.234.0109.0000Clerical Assistant- PG18, 15 years(+2.5%)Secretary - PG19,15 years (+2.5%)6.00 $ 12,7759779122,0241166.00 $ 16,804 Local2.75 $ 6,3154834511,113642.75 $ 8,426 LocalBase 02.6410.003.151.0109.0000SS 02.6910.003.211.0109.0000Ret 02.6910.003.221.0109.0000Hosp 02.6910.003.231.0109.0000Dental 02.6910.003.234.0109.0000Base 02.6410.003.151.0109.0000SS 02.6910.003.211.0109.0000Ret 02.6910.003.221.0109.0000Hosp 02.6910.003.231.0109.0000Dental 02.6910.003.234.0109.0000Secretary - PG19,15 years (+2.5%)Bookkeeper -PG22, 15 years(+2.5%)6.00 $ 16,804 Local2.75 $ 6,3154834511,113642.75 $ 8,4263.00 $ 8,1806265841,214703.00 $ 10,674 LocalBase 02.6410.003.151.0109.0000SS 02.6910.003.211.0109.0000Ret 02.6910.003.221.0109.0000Hosp 02.6910.003.231.0109.0000Dental 02.6910.003.234.0109.0000Base 02.6410.003.151.0109.0000SS 02.6910.003.211.0109.0000Ret 02.6910.003.221.0109.0000Hosp 02.6910.003.231.0109.0000Dental 02.6910.003.234.0109.0000290
Commitments by the Board of Education to Programs for Future Funding<strong>2007</strong>- <strong>08</strong> MOE Amount Code<strong>2007</strong>- <strong>08</strong> MOE Amount CodeCounselor Dean -15 years, Masters(+5%)Subtotal forEWHS of Healthand Science3.00 $ 13,8782,3961,2451,1621,214703.00 $ 19,965 Local14.75 $ 55,869Base 02.5830.007.121.0146.0000Supp 02.5830.007.181.0146.0000SS 02.5910.007.211.0146.0000Ret 02.5910.007.221.0146.0000Hosp 02.5910.007.231.0146.0000Dental 02.5910.007.234.0146.0000Registrar - PG20,16 yearsNC Wise DataManager - PG22,17 years(12.00) ($ 28,551)(2,184)(2,039)(3,854)(232)(12.00) ($ 36,860) Local(12.00) ($ 33,371)(2,553)(2,383)(3,854)(232)Base 02.6410.003.151.0109.0000SS 02.6910.003.211.0109.0000Ret 02.6910.003.221.0109.0000Hosp 02.6910.003.231.0109.0000Dental 02.6910.003.234.0109.0000Base 02.6410.003.151.0109.0000SS 02.6910.003.211.0109.0000Ret 02.6910.003.221.0109.0000Hosp 02.6910.003.231.0109.0000Dental 02.6910.003.234.0109.0000Principal VII - 20yearsAssistant Principal- 11 and 26 yearsLead Secretary- PG23, 6 years(12.00) ($ 63,216)(4,836)(4,514)(3,854)($ 76,420) State($ 39,001)(2,984)(2,785)(232)($ 45,002) Local(12.00) ($ 121,422)(24.00) ($ 112,920)(25,<strong>08</strong>0)(10,509)(9,8<strong>08</strong>)(7,7<strong>08</strong>)(464)(24.00) ($ 166,489) Local(12.00) ($ 31,386)(2,401)(2,241)(3,854)(232)(12.00) ($ 40,114) LocalBase 01.6410.005.114.0109.0000SS 01.6910.005.211.0109.0000Ret 01.6910.005.221.0109.0000Hosp 01.6910.005.231.0109.0000Supp 02.6410.005.181.0109.0000SS 02.6910.005.211.0109.0000Ret 02.6910.005.221.0109.0000Dental 02.6910.005.234.0109.0000Base 02.6410.005.116.0109.0000Supp 02.6410.005.181.0109.0000SS 02.6910.005.211.0109.0000Ret 02.6910.005.231.0109.0000Hosp 02.6910.005.231.0109.0000Dental 02.6910.005.234.0109.0000Base 02.6410.003.151.0109.0000SS 02.6910.003.211.0109.0000Ret 02.6910.003.221.0109.0000Hosp 02.6910.003.231.0109.0000Dental 02.6910.003.234.0109.0000Counselor - 5, 10and 15 yearsClerical Assistant- PG18, 0, 2, 4,and 27 yearsSecretary - PG19,4 yearsBookkeeper -PG22, 6 years(12.00) ($ 42,393) Local(32.00) ($ 133,336)(20,905)(11,799)(11,013)(11,562)(696)(32.00) ($ 189,311) Local(24.00) ($ 68,533)(5,243)(4,893)(13,104)(789)(24.00) ($ 92,562) Local(11.00) ($ 21,837)(1,671)(1,559)(3,854)(232)(11.00) ($ 29,153) Local(12.00) ($ 28,875)(2,209)(2,062)(3,854)(232)(12.00) ($ 37,232) LocalBase 02.5830.007.121.0146.0000Supp 02.5830.007.181.0146.0000SS 02.5910.007.211.0146.0000Ret 02.5910.007.221.0146.0000Hosp 02.5910.007.231.0146.0000Dental 02.5910.007.234.0146.0000Base 02.6410.003.151.0109.0000SS 02.6910.003.211.0109.0000Ret 02.6910.003.221.0109.0000Hosp 02.6910.003.231.0109.0000Dental 02.6910.003.234.0109.0000Base 02.6410.003.151.0109.0000SS 02.6910.003.211.0109.0000Ret 02.6910.003.221.0109.0000Hosp 02.6910.003.231.0109.0000Dental 02.6910.003.234.0109.0000Base 02.6410.003.151.0109.0000SS 02.6910.003.211.0109.0000Ret 02.6910.003.221.0109.0000Hosp 02.6910.003.231.0109.0000Dental 02.6910.003.234.0109.0000291 FY <strong>2007</strong>-<strong>08</strong> <strong>Plan</strong> for Student Success
Commitments by the Board of Education to Programs for Future Funding<strong>2007</strong>- <strong>08</strong> MOE Amount CodeSubtotal forEast <strong>Wake</strong> High<strong>School</strong>(151.00) ($755,536)college high schools.…[At these schools] early results show promisein student attendance, an increase in the Early College High <strong>School</strong>college course pass rates, decrease in discipline referrals, higher ABCtest results and an increase in teacher satisfaction.”Campus Managerbased on Principal12 MOE - GSchedule, 20 yrs(+5%) - Additionalfunds for one East<strong>Wake</strong> Principal toprovide oversitefor campuswide activitiesand coordinatreprograms andscheduling toensure studentsequal access toprograms andfacilities.12.00 $ 10,023767716Base 02.6410.005.181.0109.0000SS 02.6910.005.211.0109.0000Ret 02.6910.005.221.0109.0000Legal Implications (if any):NoneSubtotal forEast <strong>Wake</strong> High<strong>School</strong> Campus12.00 $11,506Total: 24.00 $ 89,428Expected Effect on Goal 20<strong>08</strong>:This initiative directly supports the school district’s efforts to reach Goal20<strong>08</strong> at the high school level through improving the likelihood of academicsuccess for all students.Evidence or Reasoning for this Strategy:In a recent report to the Joint Legislative Education Oversight Committee,Geoff Coltrane, Research and Communications Director, NorthCarolina New <strong>School</strong>s Project noted that, “…three compelling needsdrive high school redesign in North Carolina 1) student achievementand performance; 2) teacher professionalism and satisfaction; and 3)economic restructuring. The high school innovation projects involve achange in instruction, rigor for all students, and enhanced accountabilityby creating two types of schools: redesigned high schools and early292
Commitments by the Board of Education to Programs for Future FundingInitiative: Make two additional payments for High <strong>School</strong> Band and Strings teachers at their current extra-duty pay gradeImplementation Timeline & Budget Needed:<strong>2007</strong>- <strong>08</strong> Amount CodeProvide $215,000 for additionalextra-duty pay for High <strong>School</strong>Band and Strings20<strong>08</strong>-09Additional funds to bedetermined based on acomprehensive review ofthe extra-duty roster by acommittee of teachers andstaff.2009-10$ 215,00016,44815,351Total: $ 246,799Total:Heritage High <strong>School</strong>Band Director $11,628Strings/Orchestra $ 2,907$ 14,5351,1121,038Base 02.5100.853.199.0241.0000SS 02.5910.853.211.0241.0000Ret 02.5910.853.221.0241.0000Base 02.5100.853.199.0241.0000SS 02.5910.853.211.0241.0000Ret 02.5910.853.221.0241.0000Base 02.5100.853.199.0241.0000SS 02.5910.853.211.0241.0000Ret 02.5910.853.221.0241.0000Expected Effect on Goal 20<strong>08</strong>:The efficient and effective deliveries of educational programs that supportGoal 20<strong>08</strong> are critical to reaching the goal. A thriving arts programsupports all areas of the academic program by helping students achieveacademic and artistic excellence, developing self-discipline and criticalthinking skills and understand the links across the curriculum throughcollaboration.Evidence or Reasoning for this Strategy:A comprehensive review of the data regarding activities, time investedand consideration of compensation packages of other similar schooldistricts will begin to address the inequities of the current extra-dutycompensation schedule.Number and Kinds of Students that would be helped:Approximately 5000 high school students (approximately 260 perschool).Legal Implications (if any):NoneTotal: $ 16,685293 FY <strong>2007</strong>-<strong>08</strong> <strong>Plan</strong> for Student Success
Notes294
New Programs and Increases to Existing ProgramsInitiative: Noncertifi ed SalariesAdjust pay scales for noncertifi ed employees.Implementation Timeline & Budget Needed:Salary Step Percent Increase0-4 1.23%5-9 1.23%10-14 1.23%15-19 1.23%20-24 1.23%25+ 1.23%Employees Affected:Teacher assistants, trades workers, offi ce support personnel, technologyworkers, central offi ce administrators, transliterators/interpreters,occupational therapists, physical therapists, bus drivers, lead drivers,and cafeteria workers.Number of Employees Affected: 5,712<strong>2007</strong>- <strong>08</strong> Amount CodeNoncertifi ed $ 447,177278,642216,271186,674176,549124,31780,78345,58532,31629,64825,78125,29524,14222,00220,932$1,736,114Base 02.5100.027.142.0101.0000Base 02.6550.056.171.0225.0000Base 02.6540.003.173.0264.0000Base 02.5200.032.142.0136.0000Base 02.6410.003.151.0109.0000Base 02.6410.003.151.0109.0000Base 02.6410.003.151.0231.0000Base 02.6550.056.165.0225.0980Base 02.5200.027.142.0136.0000Base 02.6640.002.113.0109.0935Base 02.6670.801.148.0231.<strong>08</strong>10Base 02.6580.802.169.0296.<strong>08</strong>30Base 02.5890.032.145.0136.<strong>08</strong>20Base 02.6670.002.113.0231.0910Base 02.5200.032.142.0136.0000<strong>2007</strong>- <strong>08</strong> Amount Code20<strong>08</strong>-09$ 34,21021,31616,54514,28113,5069,5106,1803,4872,4722,2681,9721,9351,8471,6831,601$ 132,813$ 31,92719,89515,44213,32912,6068,8765,7683,2552,3072,1171,8411,8061,7241,5711,495$ 123,959Total: $ 1,992,886SS 02.5910.027.211.0101.0000SS 02.6910.056.211.0225.0000SS 02.6910.003.211.0264.0000SS 02.5910.032.211.0136.0000SS 02.6910.003.211.0109.0000SS 02.6910.003.211.0109.0000SS 02.6910.003.211.0231.0000SS 02.6910.056.211.0225.0980SS 02.5910.027.211.0136.0000SS 02.6910.002.211.0109.0935SS 02.6910.801.211.0231.<strong>08</strong>10SS 02.6910.802.211.0296.<strong>08</strong>30SS 02.5910.032.211.0136.<strong>08</strong>20SS 02.6910.002.211.0231.0910SS 02.5910.032.211.0136.0000Ret 02.5910.027.221.0101.0000Ret 02.6910.056.221.0225.0000Ret 02.6910.003.221.0264.0000Ret 02.5910.032.221.0136.0000Ret 02.6910.003.221.0106.0000Ret 02.6910.003.221.0106.0000Ret 02.6910.003.221.0231.0000Ret 02.6910.056.221.0225.0980Ret 02.5910.027.221.0136.0000Ret 02.6910.002.221.0109.0935Ret 02.6910.801.221.0231.<strong>08</strong>10Ret 02.6910.802.221.0296.<strong>08</strong>30Ret 02.5910.032.221.0136.<strong>08</strong>20Ret 02.6910.002.211.0231.0910Ret 02.5910.032.211.0136.0000Noncertifi ed No Cost N/A2009-10Noncertifi ed No Cost N/A295 FY <strong>2007</strong>-<strong>08</strong> <strong>Plan</strong> for Student Success
New Programs and Increases to Existing ProgramsNote: Actual distribution will be adjusted across all noncertifi ed pay accounts in fund 2 oncepay increases are applied to employees. This is an estimated distribution.Expected Effect on Goal 20<strong>08</strong>:Increasing noncertifi ed salaries will directly assist in retaining andrecruiting a highly qualifi ed workforce to support teaching and learning.Strategic Directive:Evidence or Reasoning for this Strategy:Competitive salaries and benefi ts are a necessary component in recruitingand retaining quality employees.Legal Implications (if any):None.296
New Programs and Increases to Existing ProgramsInitiative: Increase salary schedules for 12-month noncertifi ed employees to the amounts received by 10-month noncertifi ed employees in the samepositionImplementation Timeline & Budget Needed:<strong>2007</strong>- <strong>08</strong> Amount CodeAssumptions Used:1) Employees paid on noncertifi ed salary schedules and employed for 12months per year are moved to the 10/11 month salary schedule used byWCPSS for the 2006-07 school year.<strong>2007</strong>- <strong>08</strong> Base FICA Retirement TotalHourly $ 36,256 $ 2,774 $ 2,589 $ 41,618Salary $ 582,410 $ 44,554 $ 41,584 $ 668,549Total $ 618,666 $ 47,328 $ 44,173 $ 710,167CNS $ 43,696 $ 3,343 $ 3,120 $ 50,159Non-CNS $ 574,970 $ 43,985 $ 41,053 $ 660,0<strong>08</strong>Total $ 618,666 $ 47,328 $ 44,173 $ 710,167Fund 1 $ 359,245 $ 27,482 $ 25,650 $ 412,377Fund 2 $ 2<strong>08</strong>,637 $ 15,961 $ 14,897 $ 239,495Fund 3 $ 3,556 $ 272 $ 254 $ 4,<strong>08</strong>2Fund 5 $ 46,406 $ 3,550 $ 3,313 $ 53,269Fund 7 $ 822 $ 63 $ 59 $ 944Total $ 618,666 $ 47,328 $ 44,173 $ 710,16712-Month Noncertifi ed $ 150,75793,93872,91162,93359,52041,91127,23415,36810,8958,6918,5288,1397,057$ 567,88212-Month Noncertifi ed $ 11,5327,1865,5784,8144,5533,2062,<strong>08</strong>31,176833665652623540$ 43,441Base 02.5100.027.142.0101.0000Base 02.6550.056.171.0225.0000Base 02.6540.003.173.0264.0000Base 02.5200.032.142.0136.0000Base 02.6410.003.151.0109.0000Base 02.6410.003.151.0109.0000Base 02.6410.003.151.0231.0000Base 02.6550.056.165.0225.0980Base 02.5200.027.142.0136.0000Base 02.6670.801.148.0231.<strong>08</strong>10Base 02.6580.802.169.0296.<strong>08</strong>30Base 02.5890.032.145.0136.<strong>08</strong>20Base 02.5200.032.142.0136.0000SS 02.5910.027.211.0101.0000SS 02.6910.056.211.0225.0000SS 02.6910.003.211.0264.0000SS 02.5910.032.211.0136.0000SS 02.6910.003.211.0109.0000SS 02.6910.003.211.0109.0000SS 02.6910.003.211.0231.0000SS 02.6910.056.211.0225.0980SS 02.5910.027.211.0136.0000SS 02.6910.801.211.0231.<strong>08</strong>10SS 02.6910.802.211.0296.<strong>08</strong>30SS 02.5910.032.211.0136.<strong>08</strong>20SS 02.5910.032.211.0136.0000Estimated cost distribution to cover state and local employees.297 FY <strong>2007</strong>-<strong>08</strong> <strong>Plan</strong> for Student Success
New Programs and Increases to Existing Programs<strong>2007</strong>- <strong>08</strong> Amount Code12-Month Noncertifi ed $ 10,7656,7075,2064,4934,2502,9921,9451,097778621609581504Ret 02.5910.027.221.0101.0000Ret 02.6910.056.221.0225.0000Ret 02.6910.003.221.0264.0000Ret 02.5910.032.221.0136.0000Ret 02.6910.003.221.0109.0000Ret 02.6910.003.221.0109.0000Ret 02.6910.003.221.0231.0000Ret 02.6910.056.221.0225.0980Ret 02.5910.027.221.0136.0000Ret 02.6910.801.221.0231.<strong>08</strong>10Ret 02.6910.802.221.0296.<strong>08</strong>30Ret 02.5910.032.221.0136.<strong>08</strong>20Ret 02.5910.032.221.0136.0000$ 40,548Total: $ 651,871Expected Effect on Goal 20<strong>08</strong>:Improve the retention and recruitment of noncertifi ed employees.Strategic Directive:Evidence or Reasoning for this Strategy:Legislation enacted during the 2004 and 2005 sessions North CarolinaGeneral Assembly provided fi xed annual increases to noncertifi edemployees regardless of months of employment. As a result of theselegislated changes, WCPSS provided higher raises (and higher monthlyand hourly salary schedules) for 10-month noncertifi ed employees thanit provided for their 12-month counterparts.This initiative restores internal salary equity among noncertifi ed employeesin the same position, regardless of months of employment.Legal Implications (if any):None298
New Programs and Increases to Existing ProgramsInitiative: English as a Second Language (ESL) Teacher Months of Employment (MOE)Implementation Timeline & Budget Needed:<strong>2007</strong>-<strong>08</strong> MOE Amount CodeAdditional 84 MOEbased on ESL at allsitesCurrent ESL sites: 101Additional ESL sites:51(Including new schoolsopening at EastGarner North ForestPines Drive, SanfordCreek, East Cary andWendell)34.00 $ 148,24019,27112,81511,96013,76078934.00 $ 206,835 Federal50.00 $ 218,00028,34018,84517,58920,2351,160Base 03.5500.104.121.0132.0000Supp 03.5920.104.181.0132.0000SS 03.5910.104.211.0132.0000Ret 03.5910.104.221.0132.0000Hosp 03.5910.104.231.0132.0000Dental 03.5910.104.234.0132.0000Base 03.5500.111.121.0132.0000Supp 03.5920.111.181.0132.0000SS 03.5910.111.211.0132.0000Ret 03.5910.111.221.0132.0000Hosp 03.5910.111.231.0132.0000Dental 03.5910.111.234.0132.0000Evidence or Reasoning for this Strategy:LEP students live in the base of nearly every school in the <strong>Wake</strong> <strong>County</strong><strong>Public</strong> <strong>School</strong> <strong>System</strong>. Many parents of LEP/ESL students desire theirstudents to remain at the base school, even though ESL services maybe indicated through scores received on the IPT, the state test of Englishlanguage ability. When a school does not offer ESL services, parentsoften decline the service at the ESL base school.All LEP/ESL students by law require English language support toaccess the North Carolina Standard Course of Study at a level they canunderstand.Legal Implications (if any):Under No Child Left Behind (NCLB) LEP students are required to receivethe Standard Course of Study at the same time they are learning English.In order to meet this standard, every school must be involved in theeducation of limited English profi cient students.Total ESL sites: 15250.00 $304,169 FederalTotal: 84.00 $511,004Expected Effect on Goal 20<strong>08</strong>:• Improve test scores for Limited English Profi ciency (LEP) students -both Adequate Yearly Progress (AYP) for LEPs and Annual Measureof Achievement Objectives (AMAO) for LEPs• Provide for the needs of linguistically diverse learners at base schools,K-12• Better management of IPT (the state test of English language ability)assessment and documentation of limited English profi cient (LEP)students required under No Child Left Behind (NCLB)• Increase LEP parent participation as required by NCLB• Decrease time on bus for LEP/ESL students and potential decrease intransportation costs299 FY <strong>2007</strong>-<strong>08</strong> <strong>Plan</strong> for Student Success
New Programs and Increases to Existing ProgramsInitiative: <strong>School</strong> Psychologist for Academically Gifted Program (AG)Implementation Timeline & Budget Needed:<strong>2007</strong>- <strong>08</strong> MOE Amount Code<strong>School</strong> Psychologistfor AG Program6.00 $ 36,9022,8232,6352,024$ 44,384 State$ 7,657586547116Total 6.00 $53,290$ 8,906 LocalBase 01.5850.034.139.0143.<strong>08</strong>25SS 01.5910.034.211.0143.<strong>08</strong>25Ret 01.5910.034.221.0143.<strong>08</strong>25Hosp 01.5910.034.231.0143.<strong>08</strong>25Supp 02.5850.034.181.0143.<strong>08</strong>25SS 02.5910.034.211.0143.<strong>08</strong>25Ret 02.5910.034.221.0143.<strong>08</strong>25Dental 02.5910.034.234.0143.<strong>08</strong>25Note: A veteran psychologist who has vast experience in the AG population will be neededfor this position. Thus, the figures above are based on the 25-year step of the psychologistsalary schedule.Expected Effect on Goal 20<strong>08</strong>:The Academically Gifted Program supports to increase the number of AGidentifi ed students from underrepresented populations and to increasehigh growth for all students. A full-time AG Psychologist will strengthenthese efforts.Evidence or Reasoning for this Strategy:The AG department is requesting funding for this position to provideindividual evaluations of students for the AG program, attend parentmeetings, assist schools in completing the Iowa Acceleration scale,participate in trainings and inservices for AG teachers, train new AGteachers in administering individual achievement tests, assist in makingdecisions on additional and alternative assessments to be used withstudents, writing procedures for group test administrations, and trainingschool administrators and counselors on the CogAT and interpretation ofdata, participate on the AG Record Review team, and provide ongoingconsultation and support.Legal Implications:The Academically Gifted Program adheres to regulations required bythe state for identifying and serving Academically Intellectually Giftedstudents. Academically gifted students are under the category ofexceptional children. We maintain confi dential records for every identifi edstudent at the school level and at the district level. The AG Psychologistis needed full time to ensure that testing is conducted and interpretedwith maximum expertise and that the identifi cation procedures at eachschool are complete and reliable.Strategic Directive:300
New Programs and Increases to Existing ProgramsInitiative: Lacrosse coaches for varsity boys and girls teams at 19 high schools• Extra Duty Compensation• Level 6 for VarsityImplementation Timeline & Budget Needed:<strong>2007</strong>- <strong>08</strong> Amount Code$ 87,1166,6646,220Base 02.5100.853.199.0241.0000SS 02.5910.853.211.0241.0000Ret 02.5910.853.221.0241.0000Total: $ 100,00020<strong>08</strong>-09$ 0Total: $ 02009-10$ 0Total: $ 0Expected Effect on Goal 20<strong>08</strong>:Evidence or Reasoning for this Strategy:Legal Implications (if any):301 FY <strong>2007</strong>-<strong>08</strong> <strong>Plan</strong> for Student Success
New Programs and Increases to Existing ProgramsInitiative: High LiftPurchase a high lift to service lighting, Heating, Ventilation, and Air Conditioning(HVAC), and fi re dampers in our newer schools. Most of ourhigh schools have very high ceilings in their gyms and auditoriumsLegal Implications (if any):NoneImplementation Timeline & Budget Needed:<strong>2007</strong>-<strong>08</strong> Amount Code$ 020<strong>08</strong>-09$ 55,000(non-recurring)04.9200.801.541.0296.<strong>08</strong>302009-10Remove one-time cost fromprevious year($ 55,000)Expected Effect on Goal 20<strong>08</strong>:Facility condition has a signifi cant impact on the learning environment. Aclassroom that is properly lit, temperature controlled and walls/fl oors fi n-ished will enhance the teacher-student educational environment. Maintainingthis environment at a peak effi ciency provides the best value foreach dollar spent on new construction and provides the best learningenvironment.Strategic Directive:Evidence or Reasoning for this Strategy:The school system has developed a replacement schedule for boilers,cooling towers, and chillers. This schedule has been coordinated withthe existing bond project list and only refl ects replacements currentlynot included in a funded project. Classroom distractions are a detrimentto the learning environment. If maintenance is not accomplished on newconstruction, distractions will increase faster than necessary, instructionaltime will decrease, and student achievement will suffer. If propermaintenance is provided, the teacher and student will be able to profi tfrom full use of the facility to further their efforts to focus on instructionand achievement.302
New Programs and Increases to Existing ProgramsInitiative: Custodial Focus Team for regional Custodial ServicesImplement initiatives recommended by the Custodial Focus Team forregional Custodial Services.Implementation Timeline & Budget Needed:<strong>2007</strong>- <strong>08</strong> MOE Amount Code20<strong>08</strong>-090.00 $ 0Total: 0.00 $ 0120.00 $ 288,27522,05320,58342,4902,3202,40014,40044,30075,000Personnel 02.6540.003.176.0264.<strong>08</strong>30SS 02.6540.003.211.0264.<strong>08</strong>30Ret 02.6540.003.221.0264.<strong>08</strong>30Hosp 02.6540.003.231.0264.<strong>08</strong>30Dental 02.6540.003.234.0264.<strong>08</strong>30Telephone 02.6540.003.341.0264.<strong>08</strong>30Supplies 02.6540.003.412.0264.<strong>08</strong>30Supplies 02.6540.003.412.0264.<strong>08</strong>30Equip 04.9300.801.551.0114.09302009-10Total: 120.00 $ 511,821192.00 $ 459,56835,15732,81371,3762,3203,36027,00079,500105,000Personnel 02.6540.003.176.0264.<strong>08</strong>30SS 02.6910.003.211.0264.<strong>08</strong>30Ret 02.6910.003.221.0264.<strong>08</strong>30Hosp 02.6910.003.231.0264.<strong>08</strong>30Dental 02.6910.003.234.0264.<strong>08</strong>30Telephone 02.6540.003.341.0264.<strong>08</strong>30Supplies 02.6540.003.412.0264.<strong>08</strong>30Supplies 02.6540.003.412.0264.<strong>08</strong>30Vehicles 04.9300.801.551.0114.0930Less: onetimecost fromprevious year(119,300)Total: 192.00 $ 696,794303 FY <strong>2007</strong>-<strong>08</strong> <strong>Plan</strong> for Student Success
New Programs and Increases to Existing Programs<strong>2007</strong>-<strong>08</strong>: Zero costs20<strong>08</strong>-09: Region 1 InitiatedPersonnel:QuantityPositionGradeBaseSalarySocialSecurityDETAILED COSTRetirement Hospitalization Dental Total145272618$ 37,769141,9951<strong>08</strong>,510$ 2,88910,8638,301$ 2,69710,1397,748$ 4,04716,18820,235$ 2329281,160$ 47,634180.113145,954$ 373,701Equipment:Quantity Equipment Code Amount145161 year supply per burnisher52009-10: Regions 2 and 3 InitiatedPersonnel:QuantityPositionGradeBaseSalaryCarVanPhone/RadioBurnisherPropaneComputerSocialSecurity04.9300.801.551.0264.<strong>08</strong>3004.9300.801.551.0264.<strong>08</strong>3002.6540.003.341.0264.<strong>08</strong>3002.6540.003.412.0264.<strong>08</strong>3002.6540.003.412.0264.<strong>08</strong>3002.6450.003.412.0264.<strong>08</strong>30$ 15,00060,0002,40036,80014,4007,500$ 136,100Total: $ 509,801Retirement Hospitalization Dental Total259272618$ 77,429181,935200,205$ 5,92313,91815,316$ 5,52812,99014,295$ 8,49821,24538,241$ 2329281,160$ 97,610231,016269,216$ 597,842Equipment:Quantity Equipment Code Amount257301 year supply per burnisher7CarVanPhone/RadioBurnisherPropaneComputerRemove one-time cost from previous year04.9300.801.551.0264.803004.9300.801.551.0264.<strong>08</strong>3002.6540.003.341.0264.<strong>08</strong>3002.6540.003.412.0264.<strong>08</strong>3002.6540.003.412.0264.<strong>08</strong>3002.6540.003.412.0214.<strong>08</strong>30$ 30,00075,0003,36069,00027,00010,500$ 214,860(119,300)Total: $ 693,402304
New Programs and Increases to Existing ProgramsExpected Effect on Goal 20<strong>08</strong>:The school/classroom environment has a signifi cant impact on thesuccessful education of the student. Effi cient custodial services set forthby the regional structure will keep the focus of a properly cleaned andwell-maintained school/classroom explicitly in the custodial servicesdepartment, and allow the principals and teachers to focus on meetingthe educational demands of Goal 20<strong>08</strong>.Strategic Directive:Evidence or Reasoning for this Strategy:The custodial department currently employs over 500 in-house custodianswith an additional 300 plus custodians employed by contract companies.The management is comprised of one custodial administrator, onecustodial manager, nine fi eld supervisors, and over 130 principals. Thedepartmental staff handles most operational issues while the principalshandle most personnel issues.continuous custodial vacancy problem. The urgency a custodial vacancycauses at a school leads to rushed and improper training. This trainingshortfall almost inevitably leads to turnover within the fi rst few monthsof employment; once again creating the imperative need for custodialhelp.A floater system will hire custodians prior to a vacancy need. Suffi cienttime is given to properly train the employee meanwhile temporarily fi llinga vacancy and minimizing the impact of turnover. Once standardizedtraining is satisfactorily completed, and the probationary period iscleared, the custodian is permanently assigned to a school. This relievesthe school custodial staff from training duties and provides them with aproperly trained, ready to work, addition to their team.Legal Implications (if any):NoneIn recent surveys, the principals have expressed their frustrations with theprocess of handling custodial concerns; operational or personnel related.Custodial management is a distraction and takes their focus away fromtheir appointed educational goals.A focus team, made up of several different <strong>Wake</strong> <strong>County</strong> <strong>Public</strong><strong>School</strong> <strong>System</strong> (WCPSS) positions, has suggested the realignmentof custodial functions into a regional structure that would mirror thecurrent in maintenance regional structure. The regional custodialservices department would consist of one director, one secretary, oneadministrator, five regional custodial managers, and twenty-three areacustodial managers. This structure would not only manage the custodialoperational issues, but also take on all personnel processes, such asinterviewing, hiring, evaluations, employee management, and scheduling.In addition, quality control of contracted services would be handled at theregional or area level.While the regional custodial services structure will promote standardizationin housekeeping, preserve the personal interaction between schooland custodial staff, and return the principals’ focus to the education ofthe students, it can also be a deterrent to the high turnover rate and305 FY <strong>2007</strong>-<strong>08</strong> <strong>Plan</strong> for Student Success
New Programs and Increases to Existing ProgramsInitiative: Upgrade Craftsman Building and Grounds, Multi-task Employees, and Master Craftsman PlumbersImplement initiatives to improve retention and recruitment of Craftsman-Buildings and Grounds, Multi-Task Employees and Master CraftsmanPlumbers.Implementation Timeline & Budget Needed:GradeStep 5BaseSalary$Diff.<strong>2007</strong>-<strong>08</strong># ofPositionsPositionDescriptionBaseBudgetIncreaseBenefi tsBudgetIncreaseN/A N/A N/A N/A N/A N/A N/AGradeStep 5BaseSalary21 $ 26,900$Diff.20<strong>08</strong>-09# ofPositionsPositionDescriptionBaseBudgetIncreaseBenefi tsBudgetIncrease22 28,600 1,700 9CraftsmanTrades$ 15,300 $ 2,26423 30,400 1,800 75 MTE 135,000 19,98024 32,300 1,90025 34,400 2,100 5MasterCraftsmanPlumber10,500 1,554Expected Effect on Goal 20<strong>08</strong>:Facility condition has a signifi cant impact on the campus-learningenvironment. Any distractions that impact the learning environmentcreate unnecessary hurdles to the success of Goal 20<strong>08</strong>.Strategic Directive:This aligns specifi cally with the system goal of Retention andRecuitment.Evidence or Reasoning for this Strategy:Retention and recruitment must be successful to maintain an effi cientwork force to support the schools. It has taken as much as a year to getapplicants with a commercial driver’s license to apply for the craftsmantrades position. In two years, we have had a 30 percent turnover in ourMulti-task Employee (MTE) positions. The current Master CraftsmanPlumber vacancy has been vacant more than 90 days and not a singleeligible licensed plumber has applied. All other skills requiring craftlicensing are grade 25 or higher. This initiative would move all threeposition descriptions up one grade. Some of the current incumbents arepaid off scale and would not receive an increase.Legal Implications:The state requires plumbers to be licensed before accomplishing sometasks.Subtotals $ 160,800 23,798Total: $ 184,5982009-10GradeStep 5BaseSalary$Diff.# ofPositionsPositionDescriptionBaseBudgetIncreaseBenefi tsBudgetIncreaseN/A N/A N/A N/A N/A N/A N/A306
New Programs and Increases to Existing ProgramsInitiative: Heating, Ventilation, and Air Conditioning (HVAC) fi lter upgrade to support Indoor Air Quality (IAQ) improvementsImplementation Timeline & Budget Needed:<strong>2007</strong>-<strong>08</strong> Amount Code$ 020<strong>08</strong>-09$ 100,000 (recurring) 02.6580.802.412.0296.<strong>08</strong>302009-10$ 0 02.6580.802.412.0296.<strong>08</strong>30Even with an increased cost in fi lters, the <strong>Wake</strong> <strong>County</strong> <strong>Public</strong> <strong>School</strong><strong>System</strong> (WCPSS) should see a net decrease in costs due to the reductionin IAQ cleanup and repairs.Legal Implications (if any):Industry and EPA are working hard to fi nd a way to publish guidelines onair quality. The lack of guidelines has resulted in an ever-growing legalenvironment. Best practice, at this time, is a documented and aggressiveair quality control program.Expected Effect on Goal 20<strong>08</strong>:Over 92,000 teacher work days were lost due to sick leave in 2003-04. If any percentage of the absences was due to poor IAQ then thecosts can easily be justifi ed. This is to help improve the IAQ in ourbuildings improving the learning environment and reducing missed daysby both students and staff. Facility condition has a signifi cant impact onthe classroom-learning environment. A classroom that has the propertemperature and air quality controlled will enhance the teacher-studenteducational environment. Maintaining this environment at peak effi ciencyprovides the best value for each dollar spent on construction. Classroomdistractions are a detriment to the learning environment. If maintenanceis not accomplished, distractions will increase faster than necessary,instructional time will decrease, and student achievement will suffer.Strategic Directive:Evidence or Reasoning for this Strategy:Currently, we are using a low effi ciency fi lter in all of our HVAC equipmentat a yearly cost of $140,000. The cost to move to an EnvironmentalProtection Ageny (EPA) recommended high effi ciency fi lter will increasethe cost for our filter material to $440,000. Higher effi ciency fi lters willreduce the amount of airborne particles. This reduction will result incleaner mechanical systems, reduced “triggers” of individual allergicreactions, reduced organic matter that feeds mold growth, and reducedmoisture holding particles which would improve IAQ.307 FY <strong>2007</strong>-<strong>08</strong> <strong>Plan</strong> for Student Success
New Programs and Increases to Existing ProgramsInitiative: Asphalt ReplacementAsphalt replacement, or seal coating, where asphalt is in poor condition.Implementation Timeline & Budget Needed:<strong>2007</strong>- <strong>08</strong> Amount Code$ 020<strong>08</strong>-09$ 500,000 02.6580.802.311.0288.<strong>08</strong>302009-10$ 0Expected Effect on Goal 20<strong>08</strong>:Facility condition has a signifi cant impact on the campus-learningenvironment. Any distractions that impact the learning environmentcreate unnecessary hurdles to the success of Goal 20<strong>08</strong>.Strategic Directive:Evidence or Reasoning for this Strategy:This three-year period is part of a ten-year asphalt repair schedule. Theplan calls for asphalt overlay every ten years, while the seal coatingof asphalt surfaces occurs every fi ve years. In addition to the aboveamounts, $1,000,000 per year will be funded by the new bond.Without a replacement plan in place, temporary patches are the onlyoptions. Deterioration of asphalt would be accelerated and the potentialfor unsafe and unsightly conditions would increase.Legal Implications (if any):Claims could be submitted to the school system for vehicular damage,due to rough asphalt conditions, if action is not taken.3<strong>08</strong>
New Programs and Increases to Existing ProgramsInitiative: Rubber Track SurfacesRe-coat existing rubber track surfaces.Implementation Timeline & Budget Needed:<strong>2007</strong>- <strong>08</strong> Amount Code$ 020<strong>08</strong>-09$ 75,000 02.6580.802.311.0288.<strong>08</strong>302009-10$ 75,000 02.6580.802.311.0288.<strong>08</strong>30Expected Effect on Goal 20<strong>08</strong>:The athletic programs are a key part of a complete educational program.Safe environments for school athletics will greatly contribute to thesuccess of Goal 20<strong>08</strong>.Strategic Directive:Evidence or Reasoning for this Strategy:Athletic program standard is rubberized tracks. These are used forincreased safety they provide. A re-coating schedule is necessary tomaintain the integrity and safety of the rubber surface. Four high schooltracks require re-coating during the <strong>2007</strong>-<strong>08</strong> school year (one is fundedby the new bond). In 20<strong>08</strong>-09, six tracks will require re-coating (one isfunded by the new bond). In 2009-10, four tracks will need to be recoated(one is funded by the new bond).Legal Implications:Claims could be submitted to the school system for injuries due to neededrepairs. Risk of injuries would be signifi cantly reduced by a re-coatingschedule.309 FY <strong>2007</strong>-<strong>08</strong> <strong>Plan</strong> for Student Success
New Programs and Increases to Existing ProgramsInitiative: Indoor Air Quality (IAQ)Add additional humidity and CO 2monitoring to support Indoor AirQuality control of our buildings.Implementation Timeline & Budget Needed:<strong>2007</strong>- <strong>08</strong> Amount Code20<strong>08</strong>-092009-10$ 0$ 100,000(recurring)$ 002.6580.802.311.0296.<strong>08</strong>30Expected Effect on Goal 20<strong>08</strong>:This is to improve the Indoor Air Quality (IAQ) in our buildings, whichimproves the learning environment and reduces missed days byboth students and staff. Facility condition has a signifi cant impact onthe classroom-learning environment. The classroom temperatureand air quality control will enhance the teacher-student educationalenvironment. Maintaining this environment at peak effi ciency providesthe best value for each dollar spent on construction and provides thebest learning environment. Classroom distractions are a detriment to thelearning environment. If maintenance is not accomplished, distractionswill increase faster than necessary, instructional time will decrease, andstudent achievement will suffer.and make adjustments to the operation of the Heating, Venting, and AirConditioning (HVAC) systems. In order to do this we require additionalmonitoring points to our Energy Management <strong>System</strong>. This request willhelp address some of the problematic schools and initiate an effort toupgrade building controls. This will also allow us to add approximately1,000 monitoring points. This could also potentially prevent more IAQissues. The bond will cover the 13 major renovations but will not addressall the other schools that do not have air monitoring for IAQ.Legal Implications:Industry and the Environmental Protection Agency (EPA) are workinghard to fi nd a way to publish guidelines on air quality. The lack of theseguidelines has resulted in an ever-growing legal environment. Bestpractice, at this time, is a documented and aggressive air quality controlprogram.Strategic Directive:Evidence or Reasoning for this Strategy:IAQ is becoming a bigger issue within our buildings. A stronger proactive/predictive approach is required to fi nd heating, ventilation and airconditioning problems before mold develops and IAQ issues. In orderto understand problem areas and control the environment, a monitoringprogram needs to be started to assess the condition of our buildings310
New Programs and Increases to Existing ProgramsInitiative: Magnetic Ballast in Florescent LightingStart the replacement of magnetic ballast in fl uorescent lightingthroughout the system that has T-12 fl uorescent lighting.Implementation Timeline & Budget Needed:<strong>2007</strong>- <strong>08</strong> Amount Code$ 020<strong>08</strong>-09$100,000 02.6580.802.311.0296.<strong>08</strong>302009-10$100,000 02.6580.802.311.0296.<strong>08</strong>30Expected Effect on Goal 20<strong>08</strong>:Facility condition has a signifi cant impact on the classroom-learningenvironment. A classroom that is properly lit, temperature controlledand walls/fl oors finished will enhance the teacher-student educationalenvironment. Maintaining this environment at peak effi ciency providesthe best value for each dollar spent on new construction and provides thebest learning environment.Strategic Directive:Evidence or Reasoning for this Strategy:Starting in 2006, the federal government will no longer allow the useof magnetic ballast to be installed in new fl orescent lighting. By 2010,magnetic ballast will not be sold as a replacement part, thus requiring ourlighting to be upgraded to the more effi cient T-8 with electronic ballast.We have over 66,000 fi xtures in the system that will need to be upgradedto the new electronic ballast.Legal Implications:Federal law is requiring magnetic ballast to be phased out over the nextfour years. It will not be possible to purchase replacement parts.311 FY <strong>2007</strong>-<strong>08</strong> <strong>Plan</strong> for Student Success
Notes312
SavingsThe Savings Section is a combination of cost savings and reductions in funding.Savings - Budget ReductionsBudget reductions are the reduction or elimination of items in the base budget.These are costs budgeted in 2006-07 that will not be needed in the budget in <strong>2007</strong>-<strong>08</strong>.Savings - Shift Local Costs to State ResourcesThis category is a proposal to shift costs that were previously paid with local dollars to state funding.Savings - One-Time Costs from Previous YearThese cases identify one-time costs that do not recur the subsequent year.There is a savings as the one-time cost is removed from the base budget.Savings - Grants EndingThese cases are reductions in funding.State or federal grants are reaching the end of the funding cycle, and we do not expect additional funding.313 FY <strong>2007</strong>-<strong>08</strong> <strong>Plan</strong> for Student Success
Savings - Budget ReductionsInitiative: Reduce the baseline operating budget for <strong>Wake</strong> <strong>County</strong> <strong>Public</strong> <strong>School</strong> <strong>System</strong> (WCPSS) for Middle <strong>School</strong> <strong>School</strong> Resource Offi cers(SROs)To remove one-time costs for equipment for a security investigatorand security technician from 2006-07Reduction Timeline and Savings:<strong>2007</strong>-<strong>08</strong> Amount CodeOver/Under ($ 188,000) 02.6420.801.311.0210.<strong>08</strong>05Total: ($ 188,000)Evidence or Reasoning for this Strategy:WCPSS has had a contract with the <strong>Wake</strong> <strong>County</strong> Sherriff’s Offi ce(WCSO) to provide SROs in 17 middle schools. This arrangementwas originally funded through a federal grant followed by anagreement to retain the positions for one year. The agreement toretain the positions involved WCPSS providing 25 percent of thefunding. In order to streamline resources and to cut overhead(invoicing, contracts, etc.) it is proposed that <strong>Wake</strong> <strong>County</strong> Boardof Commissioners continue to provide this funding; however, thefunding should be provided directly to the WCSO.Legal Implications (if any):None314
Savings - Budget ReductionsInitiative: Balance in over/underReduction Timeline and Savings:<strong>2007</strong>-<strong>08</strong> Amount CodeOver/Under ($ 116,684) 02.8990.801.699.0109.0000Total: ($ 116,684)Evidence or Reasoning for this Strategy:The fi scal year for the school system begins July 1 of each year.There is a budget resolution approved for funding by the board ofeducation as of July 1. Many budget adjustments occur throughoutthe year. State budgets are adjusted for decisions made by theGeneral Assembly. Grants and contracts are adjusted based onfunding awards. Carryover balances are recorded for categoricalprograms that cross fi scal years. Building program projects arerecorded and adjusted based on funding resolutions approved by<strong>Wake</strong> <strong>County</strong> Commissioners and <strong>Wake</strong> <strong>County</strong> Board of Education.Budgets are adjusted for position and dollar conversions at theschool level. All changes to the budget are reported to the board ofeducation on a quarterly basis.for 2006-07, but will not be needed in the base budget for <strong>2007</strong>-<strong>08</strong>.Therefore, it shows as a savings in this document from one year tothe next.Legal Implications (if any):NoneThere may also be changes to the local budget due to changes invariables that were in place when the budget was created. When thisoccurs, costs may come in higher or lower than originally anticipated.If there are savings that occur in the local noncategorical budget, thedollars are transferred from the budgeted account to an “over/under”account. In the “over/under” account, no dollars can be spent. Thefunds are sequestered and will become fund balance at yearend. Ifcosts are higher than anticipated in the local noncategorical budget,funds are transferred out of the “over/under” account into the budgetline item needed. All savings and costs are reported to the board ona quarterly basis. If there were a time that cost variances exceedsavings, a reallocation of costs from another line item, or a fundbalance appropriation would need to be approved by the board ofeducation.At the time this document was prepared, there was a net savings inthe over/under of $116,684. These dollars are in the base budget315 FY <strong>2007</strong>-<strong>08</strong> <strong>Plan</strong> for Student Success
Savings - Budget ReductionsInitiative: Remove local funding for facilities planning and constructionReduction Timeline and Savings:<strong>2007</strong>-<strong>08</strong> Amount CodeRemove local funding forFacilities <strong>Plan</strong>ning andConstruction($57,703)(9,580)(22,715)(600)(350)(26,505)(560)(1,000)(4,575)Total: ($ 123,588)Contract Svcs. 02.6530.801.311.0198.0940Travel 02.6530.801.332.0198.0940Telephone 02.6530.801.341.0198.0940Advertising 02.6530.801.351.0198.0940Reprod. Costs 02.6530.801.362.0198.0940Supplies 02.6530.801.412.0198.0940Food 02.6530.801.451.0198.0940Memberships 02.6530.801.611.0198.0940Workshops 02.6930.801.312.0198.0940316
Savings - Budget ReductionsInitiative: Summer Testing and ReviewThis budget provides funds to support the required retesting andWaiver Review Committee activities that occur outside of staffcontract days. The following activities are conducted during thesummer months.Strategic Directive:Expand fi scal accountability.Objective 3: Assess spending and impact on learning.• Waiver Review Committee• Summer End of Course (EOC) testing in conjunction with summerschoolChanges in the scheduling of summer testing and Waiver ReviewCommittee reviews have resulted in decreased costs in this budget.The allotment for Waiver Review Committee is $600 for elementaryschools and $800 for middle schools.Reduction Timeline and Savings:<strong>2007</strong>-<strong>08</strong> Amount Code20<strong>08</strong>-09($ 46,339)(3,545)(3,309)Total: ($ 53,193)Base 02.5500.072.199.0219.<strong>08</strong>20SS 02.5910.072.211.0219.<strong>08</strong>20Ret 02.5910.072.221.0219.<strong>08</strong>20$ 1,800138129Total: $ 2,067Base 02.5500.072.199.0219.<strong>08</strong>20SS 02.5910.072.211.0219.<strong>08</strong>20Ret 02.5910.072.221.0219.<strong>08</strong>202009-10$ 4,000306286Total: $ 4,592Base 02.5500.072.199.0219.<strong>08</strong>20SS 02.5910.072.211.0219.<strong>08</strong>20Ret 02.5910.072.221.0219.<strong>08</strong>20Note: It is recommended that we decrease this budget from $150,305to $97,112. This is a savings of $53,193.317 FY <strong>2007</strong>-<strong>08</strong> <strong>Plan</strong> for Student Success
Savings - Budget ReductionsInitiative: Reduction of the Summer Help for the Bus GarageThis savings is only projected for one year. Additional analysis willbe done during the summer of <strong>2007</strong> to determine the affects of thisreduction.Reduction Timeline and Savings:<strong>2007</strong>-<strong>08</strong> Amount CodeSummer Help for BusGarage($ 41,000)(3,137)(2,927)Total: ($ 47,064)Base 02.6550.706.165.0225.0980SS 02.6910.706.211.0225.0980Ret 02.6910.706.221.0225.0980318
Savings - Budget ReductionsInitiative: Eliminate payment for new bus drivers for initial trainingOne-time savings.Reduction Timeline and Savings:<strong>2007</strong>-<strong>08</strong> Amount Code($ 20,000)(1,530)(1,428)Total: ($ 22,958)Base 02.6550.706.183.0225.<strong>08</strong>80SS 02.6550.706.211.0225.<strong>08</strong>80Ret 02.6550.706.221.0225.<strong>08</strong>80319 FY <strong>2007</strong>-<strong>08</strong> <strong>Plan</strong> for Student Success
Savings - Shift Local Costs to State ResourcesInitiative: Realign Technology Costs to State budget<strong>Wake</strong> <strong>County</strong> <strong>Public</strong> <strong>School</strong> <strong>System</strong> (WCPSS) receives an allotmentfrom North Carolina Department of <strong>Public</strong> Instruction (NCDPI) eachyear for <strong>School</strong> Technology Fund. These dollars have been usedas a matching amount to replace outdated computers at the schoollevel. PC Refresh funds are now included in the building program.Effective July 1, <strong>2007</strong>, locally funded technology expenditures forschool technology costs will be shifted from local funding to the stateallotment. This will save local resources.Reduction Timeline and Savings:2006-07 Amount CodeContracted Services ($2,014,535) 02.6670.801.311.0231.<strong>08</strong>10Total: ($2,014,535)320
Savings - One-Time Costs from 2006-07Initiative: One-Time Technology Costs from 2006-07Remove one-time costs as identifi ed on page 324 of 2006-07Approved <strong>Plan</strong> for Student Success for Data Retrieval.Remove one-time costs during 2006-07 for equipment purchases.Reduction Timeline and Savings:2006-07 Amount CodeData Retrieval($ 391,700) 02.6660.801.311.0231.0910Equipment($330,503)Total: ($722,203)04.9200.801.541.0231.0910321 FY <strong>2007</strong>-<strong>08</strong> <strong>Plan</strong> for Student Success
Savings - One-Time Costs from 2006-07Initiative: Remove one-time allotments from 2006-07 for leave, class size, and scheduling issuesCentral6 months teacher assistant at Wiley Elementary.1-month teacher assistant at Brentwood Elementary.6 months teacher at River Bend Elementary.1.5 month principal at Brentwood Elementary due to a leavesituation.2 months teacher assistant at Brentwood Elementary due to specialsituation.Eastern Area2 months teacher and 1 month clerical assistant at Harris Creek.Elementary due to the move from the modular site to the permanentlocation.7 months assistant principal at Zebulon Middle due to a specialsituation.4 months teacher at Knightdale High to address leave situation.10 months teacher at <strong>Wake</strong>lon Elementary due to growth since 10thday in school with high needs.7 months principal at Knightdale Elementary due to leave situation.1 month teacher at Knightdale High due to special situation.Southern Area1-month principal at Garner High due to transition in the principalposition.2 months teacher at North Garner Middle due to math teachervacancy.1.25-month teacher at Holly Springs High to address leavesituation.5 months teacher at Garner High to address leave situation.5 months teacher at Garner High to address leave situation.Western Area4 months teacher at Briarcliff Elementary to address leave situation.1-month assistant principal at Highcroft Elementary to address leavesituation.1-month assistant principal at Highcroft Elementary to help with yearroundconversion.5 months teacher assistant at Davis Drive Elementary due toenrollment increases.1.5 months teacher and 1.5 months assistant principal at CaryHigh.Northern Area7 months teacher at Lead Mine Elementary to address leavesituation.5 months teacher at Durant Elementary to address leave situation.9 months teacher at North Ridge Elementary due to a specialsituation.3 months interim principal at <strong>Wake</strong>fi eld Elementary to address leavesituation.3 months principal at York Elementary to address leave situation.South Central Area7 months teacher at Lufkin Middle to address scheduling issues.10 months teacher at Athens Drive High to address leave situation.3 months principal at Dillard Drive Elementary due to a vacancy.322
Savings - One-Time Costs from 2006-07Reduction Timeline and Savings:<strong>2007</strong>-<strong>08</strong> Amount CodeOne-time allotments forleave, class size, andscheduling issues($ 18,813)(1,439)(1,343)(5,396)(325)(88,057)(11,888)(7,646)(7,136)(5,942)(358)(42,412)(5,726)(3,683)(3,437)(3,372)(203)(1,787)(137)(128)(385)(23)(165,223)(22,306)(14,346)(13,390)(17,536)(1,056)(123,923)(16,730)(10,760)(10,043)(13,200)(795)Total: ($ 618,944)Base 02.5100.027.142.0101.0000SS 02.5910.027.211.0101.0000Ret 02.5910.027.221.0101.0000Hosp 02.5910.027.231.0101.0000Dental 02.5910.027.234.0101.0000Base 02.6410.005.114.0109.0000Supp 02.6410.005.181.0109.0000SS 02.6910.005.211.0109.0000Ret 02.6910.005.221.0109.0000Hosp 02.6910.005.231.0109.0000Dental 02.6910.005.234.0109.0000Base 02.6410.005.116.0109.0000Supp 02.6410.005.181.0109.0000SS 02.6910.005.211.0109.0000Ret 02.6910.005.221.0109.0000Hosp 02.6910.005.231.0109.0000Dental 02.6910.005.234.0109.0000Base 02.6410.003.151.0109.0000SS 02.6910.003.211.0109.0000Ret 02.6910.003.221.0109.0000Hosp 02.6910.003.231.0109.0000Dental 02.6910.003.234.0109.0000Base 02.5100.001.121.0101.0000Supp 02.5100.001.181.0101.0000SS 02.5910.001.211.0101.0000Ret 02.5910.001.221.0101.0000Hosp 02.5910.001.231.0101.0000Dental 02.5910.001.234.0101.0000Base 02.5100.001.121.0102.0000Supp 02.5100.001.181.0102.0000SS 02.5910.001.211.0102.0000Ret 02.5910.001.221.0102.0000Hosp 02.5910.001.231.0102.0000Dental 02.5910.001.234.0102.0000323 FY <strong>2007</strong>-<strong>08</strong> <strong>Plan</strong> for Student Success
Savings - One-Time Costs from 2006-07Initiative: Remove one-time allotments in 2006-07 for tenth-day overagesEastern Area4.2 months teacher at Knightdale Elementary6 months teacher at Zebulon ElementaryNorthern Area5.5 months teacher and 3 months clerical at Durant MiddleSouth Central Area17 months teacher at Southeast Raleigh HighSouthern Area10 months teacher at Ballentine Elementary1.37 months teacher at Middle Creek Elementary5.5 months teacher at Vance Elementary18 months teacher at Garner High9 months teacher at Holly Springs HighWestern Area6.5 months teacher at Adams Elementary10 months teacher at Carpenter ElementaryReduction Timeline and Savings:<strong>2007</strong>-<strong>08</strong> Amount CodeOne-time allotments fortenth day overages($5,361)(100)(383)(1,156)(70)(139,075)(18,455)(12,051)(11,248)(16,792)(1,011)(156,489)(20,759)(13,559)(12,656)(19,077)(1,148)Total: ($ 429,390)Base 02.6410.003.151.0109.0000SS 02.6910.003.211.0109.0000Ret 02.6910.003.221.0109.0000Hosp 02.6910.003.231.0109.0000Dental 02.6910.003.234.0109.0000Base 02.5100.001.121.0101.0000Supp 02.5100.001.181.0101.0000SS 02.5910.001.211.0101.0000Ret 02.5910.001.221.0101.0000Hosp 02.5910.001.231.0101.0000Dental 02.5910.001.234.0101.0000Base 02.5100.001.121.0102.0000Supp 02.5100.001.181.0102.0000SS 02.5910.001.211.0102.0000Ret 02.5910.001.221.0102.0000Hosp 02.5910.001.231.0102.0000Dental 02.5910.001.234.0102.0000324
Savings - One-Time Costs from 2006-07Initiative: Remove one-time costs from 2006-07 for capital outlay itemsThe following are reductions of one-time expenditures for capitaloutlay items that are not included as offsets on other growth orsystemwide cases.Reduction Timeline and Savings:<strong>2007</strong>-<strong>08</strong> Amount CodeFacilities(6,000) 04.9200.801.541.0109.0940Special Education(35,322)Total: ($ 41,322)04.9200.801.541.0136.<strong>08</strong>20325 FY <strong>2007</strong>-<strong>08</strong> <strong>Plan</strong> for Student Success
Savings - One-Time Costs from 2006-07Initiative: Salary AuditThe state allots resources to the school system in terms of months ofemployment for classroom teachers, school-based administrators, instructionalsupport positions, and career and technical education teachers.The state allots dollars to the school system for other categoricalprograms. If either type of allotment is overspent as of June 30 of a fi scalyear, the overage must be repaid in the subsequent year budget.Dollar allotments are not diffi cult to close out. The months of employmentcategories are more complicated. In June, <strong>Wake</strong> <strong>County</strong> <strong>Public</strong><strong>School</strong> <strong>System</strong> (WCPSS) must close our fi scal year in order to complywith reporting requirements for end-of year fi nancial data to North CarolinaDepartment of <strong>Public</strong> Instruction (NCDPI). The June payroll will typicallypost on a Friday in mid-June. The budget department then has twoto three days to request changes to any transactions in order to makesure we have fully maximized our state programs. We must do theseadjustments using the projection of the impact of the June payroll. Theactual usage does not post to the state website until after the fi scal yearis closed, and it is too late to then correct.Our goal is to zero out state dollars and months of employment. If we err,it is best to “over” use the resources rather than leave a balance. If we“under” use the resources, we leave state dollars unspent, and we uselocal dollars to pay for things that could have been paid from the statebudget. That is a double-cost to the system. If we “over” use the stateallotments, the penalty is that we must pay back NCDPI from our localfunds for the amount of the overage. This is a single-cost to the systemfor something that we would have paid from the local budget.In 2006-07, WCPSS appropriated $537,680 from fund balance as a onetimecost for this type of overage. This was reported in the ComprehensiveAnnual Financial Report. These funds are not included in the<strong>2007</strong>-<strong>08</strong> budget as a fund balance appropriation or as an expenditureline item.was prepared, there was a net cost of $152,591 for mid-year salary auditissues. Funds were transferred from other savings in the over/under tocover the cost. It was reported to the board of education. These dollarswill not carry forward into the base budget for <strong>2007</strong>-<strong>08</strong> and are shown asa savings.<strong>2007</strong>-<strong>08</strong> Amount CodePrincipalTeacherTeacherTeacherTeacherTeacherTeacherTeacher - Speech/PathologyRetired TeacherOther ProfessionalOther ProfessionalOther ProfessionalTeacher AssistantEmployer’s Social Security CostEmployer’s Social Security CostEmployer’s Social Security CostEmployer’s Retirement CostEmployer’s Retirement CostEmployer’s Retirement CostEmployer’s Hospitalization Insurance CostLess: One-time appropriation from fundbalance in 2006-07Total Equals: Funds transferred fromover/under audit to salary audit for onetimecosts in 2006-07($3,384)($318,991)($13,927)($43,631)($13,916)($128,470)($1,629)($2,263)($3,171)($1,254)($282)($3,003)($748)($40,189)($3,401)($51)($38,725)($3,044)($677)($69,515)$537,680($152,591)02.6410.850.114.0250.000002.5100.850.121.0250.000002.5200.850.121.0250.000002.5200.850.121.0250.<strong>08</strong>2002.5500.850.121.0250.000002.5830.850.121.0250.000002.5880.850.121.0250.000002.5860.850.124.0250.000002.5100.850.128.0250.000002.5850.850.139.0250.000002.5890.850.139.0250.<strong>08</strong>2002.6210.850.139.0250.000002.5200.850.142.0250.000002.5910.850.211.0250.000002.5910.850.211.0250.<strong>08</strong>2002.6910.850.211.0250.000002.5910.850.221.0250.000002.5910.850.221.0250.<strong>08</strong>2002.6910.850.221.0250.000002.5910.850.231.0250.0000There are other salary audit items that are identifi ed and reconciled ona monthly basis. These are over- or under-payments that may occur toemployees due to licensure issues, years of experience placement issues,or start and end date calendar issues. As of the time this document326
Savings - One-Time Costs from 2006-07Initiative: Remove one-time cost from 2006-07 for Credit checking contract for employees and associated help desk costs.Reduction Timeline and Savings:<strong>2007</strong>-<strong>08</strong> Amount CodeRemove one-time cost:Credit Check Contract($ 103,000) Contract Svcs 02.6320.801.311.0109.0965Total: ($103,000)327 FY <strong>2007</strong>-<strong>08</strong> <strong>Plan</strong> for Student Success
Savings - One-Time Costs from 2006-07Initiative: Remove one-time allotment from 2006-07 for central services due to a leave situationReduction Timeline and Savings:<strong>2007</strong>-<strong>08</strong> Amount CodeRemove one-time cost:Leave Situation($ 25,189)(1,927)(1,799)(1,927)(116)Total: ($ 30,958)Base 02.6520.801.148.0195.965SS 02.6910.801.211.0195.965Ret 02.6910.801.221.0195.965Hosp 02.6910.801.231.0195.965Dental 02.6910.801.234.0195.965328
Savings - One-Time Costs from 2006-07Initiative: SecurityTo remove one-time costs for equipment for a security investigatorand security technician from 2006-07.Reduction Timeline and Savings:<strong>2007</strong>-<strong>08</strong> Amount CodeEquipment ($8,000) 02.6330.801.412.0210.0905Total: ($ 8,000)329 FY <strong>2007</strong>-<strong>08</strong> <strong>Plan</strong> for Student Success
Savings - One-Time Costs from 2006-07Initiative: Internal Audit- One-time costs from previous yearTo remove one-time costs for supplies for internal auditors from2006-07.Reduction Timeline and Savings:<strong>2007</strong>-<strong>08</strong> Amount CodeRemove prior-year supplycosts for internal auditors($ 7,138) Supplies 02.6320.801.412.0148.0905Total: ($ 7,138)330
Savings - Grants EndingInitiative: Smaller Learning Communities ProgramCurrent Funding Formula:Implementation Timeline & Budget Needed:This grant ends effective August 31, <strong>2007</strong>. All budget codes assigned tothis grant should have a zero balance in <strong>2007</strong>-<strong>08</strong>.Account Name / Account Code MOE <strong>2007</strong>-<strong>08</strong>Project Director07.6210.330.113.0153.0925.000(12.00) ($ 77,000)SLC Site Coordinators07.6210.330.129.0153.0000.000(49.50) ($ 274,036)Teacher Assistant as Substitute07.5930.330.146.0153.<strong>08</strong>25.000($ 756)Longevity Pay07.6920.330.179.0153.0000.000($ 13,426)Longevity Pay07.6920.330.179.0153.0925.000($ 2,503)Supplementary Pay07.6210.330.181.0153.0000.000($ 41,877)Substitute Pay07.5930.330.182.0153.<strong>08</strong>25.000($ 35,000)Bonus Pay07.6210.330.183.0153.0000.000($ 6,750)Workshop Participant07.5930.330.186.0153.<strong>08</strong>25.000($ 1,529)Annual Leave07.6920.330.188.0153.0000.000($ 22,500)Other Assignments07.5500.330.199.0154.0436.000($ 416)Other Assignments07.5890.330.199.0153.<strong>08</strong>25.000($ 1,200)Other Assignments07.5930.330.199.0153.<strong>08</strong>25.000($ 91,194)Employer’s Social Security Cost07.5910.330.211.0153.<strong>08</strong>25.000($ 9,920)Employer’s Social Security Cost07.5910.330.211.0154.0436.000($ 32)Employer’s Social Security Cost07.6910.330.211.0153.0000.000($ 27,432)Employer’s Social Security Cost07.6910.330.211.0153.0925.000($ 6,<strong>08</strong>2)Account Name / Account Code MOE <strong>2007</strong>-<strong>08</strong>Employer’s Retirement Cost07.5910.330.221.0153.<strong>08</strong>25.000Employer’s Retirement Cost07.5910.330.221.0154.0436.000Employer’s Retirement Cost07.6910.330.221.0153.0000.000Employer’s Retirement Cost07.6910.330.221.0153.0925.000Employer’s Hospitalization Insurance07.6910.330.231.0153.0000.000Employer’s Hospitalization Insurance07.6910.330.231.0153.0925.000Employer’s Workers’Compensation Cost07.5910.330.232.0153.<strong>08</strong>25.000Employer’s Workers’Compensation Cost07.5910.330.232.0154.0436.000Employer’s Workers’Compensation Cost07.6910.330.232.0153.<strong>08</strong>25.000Employer’s Workers’Compensation Cost07.6910.330.232.0153.0925.000Employer’s DentalInsurance Cost07.6910.330.234.0153.0000.000Employer’s DentalInsurance Cost07.6910.330.234.0153.0925.000Contracted Services07.5890.330.311.0154.0436.000Contracted Services07.6210.330.311.0153.<strong>08</strong>25.000Contracted Services07.6210.330.311.0153.0925.000Workshop Expense07.5930.330.312.0153.<strong>08</strong>25.000Workshop Expense07.6930.330.312.0153.0925.000($ 6,760)($ 30)($ 25,603)($ 5,677)($ 34,686)($ 3,854)($ 389)($ 1)($ 1,076)($ 239)($ 2,<strong>08</strong>8)($ 232)($ 1,031)($ 4,000)($ 47,500)($ 95,<strong>08</strong>0)($ 8,317)331 FY <strong>2007</strong>-<strong>08</strong> <strong>Plan</strong> for Student Success
Savings - Grants EndingAccount Name / Account Code MOE <strong>2007</strong>-<strong>08</strong>Travel07.5890.330.332.0153.<strong>08</strong>25.000Travel07.5890.330.332.0153.0925.000Reproduction Costs07.5890.330.362.0153.<strong>08</strong>25.000Instructional Supplies07.5500.330.411.0154.0436.000Instructional Supplies07.5890.330.411.0153.<strong>08</strong>25.000Indirect Cost07.8100.330.692.0153.0925.000Indirect Cost07.8100.330.692.0154.0436.000($ 13,000)($ 1,652)($ 4,537)($ 2,966)($ 12,299)($ 38,948)( $198)Total (61.50) ($ 921,816)332
Savings - Grants EndingInitiative: Education Technology GrantGrant funds will be exhausted by June 30, <strong>2007</strong>.Implementation Timeline & Budget Needed:<strong>2007</strong>-<strong>08</strong> MOE Amount CodeTechnologyAssistant(12.00) ($ 40,699)(610)(15,000)(1,148)(3,160)(1,071)(2,949)(3,854)(45)(124)(232)(60,000)(3,000)(2,978)(10,000)(5,981)(161,499)Total (12.00) ($ 312,350)Base 03.6660.107.147.0267.0925Longevity 03.6920.107.179.0267.0925Other Asgmt 03.5910.107.199.0267.<strong>08</strong>25SS 03.5910.107.211.0267.<strong>08</strong>25SS 03.6910.107.211.0267.0925Ret 03.5910.107.221.0267.<strong>08</strong>25Ret 03.6910.107.221.0267.0925Hosp 03.6910.107.231.0267.0925Workers‘ Comp 03.5910.107.232.0267.<strong>08</strong>25Workers’ Comp 03.6910.107.232.0267.0925Dental 03.6910.107.234.0267.0925Contracted Svc 03.5930.107.311.0267.<strong>08</strong>25Travel 03.6660.107.332.0267.0925Supplies 03.5100.107.411.0267.<strong>08</strong>25Equip 03.6210.107.541.0267.<strong>08</strong>25Indirect Costs 03.8100.107.692.0267.0925Unbudgeted 03.8200.107.699.0267.0925333 FY <strong>2007</strong>-<strong>08</strong> <strong>Plan</strong> for Student Success
Savings - Grants EndingInitiative: Title V - Innovative Education Program StrategiesGrant funds will be exhausted by June 30, <strong>2007</strong>.Implementation Timeline & Budget Needed:<strong>2007</strong>-<strong>08</strong> MOE Amount CodeTitle V-Teacher (33.00) ($107,494)(14,614)(3,913)(2,475)(9,531)(299)(8,895)(13,939)(385)(8<strong>08</strong>)(2,000)(7,289)Total (33.00) ($ 171,642)Base 03.5200.059.121.0164.0000Supp 03.5920.059.181.0164.0000Substitute 03.5200.059.182.0276.0000Bonus 03.5200.059.183.0164.0000SS 03.5910.059.211.0164.0000SS 03.5910.059.211.0276.0000Ret 03.5910.059.221.0164.0000Hosp 03.5910.059.231.0164.0000Workers’ Comp 03.5910.059.232.0164.<strong>08</strong>25Dental 03.5910.059.234.0164.0000SS 03.5200.059.411.0164.<strong>08</strong>25Indirect Costs 03.8100.059.692.0164.0925334
Savings - Grants EndingInitiative: ESEA Title I <strong>School</strong> ImprovementFederal funding ends September 30, <strong>2007</strong> for the 2005-06 award.Implementation Timeline & Budget Needed:<strong>2007</strong>-<strong>08</strong> MOE Amount Code($22,320)(3,281)(8,000)(8,884)(924)(1,000)(22,426)(17,681)(19,524)(184)(3,568)(1,426)(2,991)(665)(2,666)(56)(117)(9,750)(5,000)(11,341)(750)(12,498)(350)(3,285)(3’607)Total ($ 162,294)Teacher 03.5200.105.121.0324.0488Teacher Asst 03.5200.105.142.0324.0488Tutor 03.5200.105.143.0324.0488Substitute 03.5200.105.182.0324.0446Substitute 03.5200.105.182.0324.0488Other 03.5200.105.199.0324.0488Supplies 03.5200.105.411.0324.0446Supplies 03.5200.105.411.0324.0488Supplies 03.5200.105.412.0324.0446Supplies 03.5200.105.412.0324.0488Supplement 03.5910.105.181.0324.0488SS 03.5910.105.211.0324.0446SS 03.5910.105.211.0324.0488Ret 03.5910.105.221.0324.0446Ret 03.5910.105.221.0324.0488Workers’ Comp 03.5910.105.232.0324.0446Workers’ Comp 03.5910.105.232.0324.0488Other 03.5930.105.199.0324.0446Contracted Svcs 03.5930.105.311.0324.0488Workshop 03.5930.105.312.0324.0446Workshop 03.5930.105.312.0324.0488Transportation 03.6550.105.331.0324.0488Workshop 03.6930.105.312.0324.0488Indirect Costs 03.8100.105.692.0324.0446Indirect Costs 03.8100.105.692.0324.0488335 FY <strong>2007</strong>-<strong>08</strong> <strong>Plan</strong> for Student Success
Savings - Grants EndingInitiative: Project Enlightenment Legislative AppropriationState grant is expected to end in 2006-07.<strong>2007</strong>-<strong>08</strong> Amount CodeOther AssignmentContracted ServicesTravelReproduction CostsInstructional SuppliesEmployer’s Social Security CostEmployer’s Retirement CostEmployer’s Hospitalization Insurance CostEmployer’s Workers’ Compensation CostEmployer’s Dental Insurance CostPostageReproduction CostsSupplies and MaterialsIndirect Cost($3,000)($1,000)($297)($1,411)($23,250)($230)($214)($111)($9)($7)($1,000)($12,877)($6,000)($2,191)Total: ($51,597)02.5890.460.199.0123.<strong>08</strong>2502.5890.460.311.0123.<strong>08</strong>2502.5890.460.332.0123.<strong>08</strong>2502.5890.460.362.0123.<strong>08</strong>2502.5890.460.411.0123.<strong>08</strong>2502.5910.460.211.0123.<strong>08</strong>2502.5910.460.221.0123.<strong>08</strong>2502.5910.460.231.0123.82502.5910.460.232.0123.<strong>08</strong>2502.5910.460.234.0123.<strong>08</strong>2502.6210.460.342.0123.<strong>08</strong>2502.6210.460.362.0123.<strong>08</strong>2502.6210.460.412.0123.<strong>08</strong>2502.8100.460.692.0123.<strong>08</strong>25336
Membership TrendsThe <strong>Wake</strong> <strong>County</strong> <strong>Public</strong> <strong>School</strong> <strong>System</strong>’s long-standing tradition ofexcellence began as a result of a trend that affected many U.S. citiesthree decades ago. As Raleigh’s urban area declined in the early 1970s,families migrated to the area’s increasingly affl uent suburbs resulting inthe closing of several downtown schools. The community was divided,and leaders sought long-term solutions to educational and economicchallenges that inhibited <strong>Wake</strong> <strong>County</strong>’s progress.The merger of the city and county school systems was not an ideaeasily accepted by many <strong>Wake</strong> <strong>County</strong> residents; however, county andschool leaders pushed forward with this courageous vision of a unitedcommunity, full of educational opportunity, economic vitality, and anattractive quality of life.As a result of visionary and bold leadership, the <strong>Wake</strong> <strong>County</strong> <strong>Public</strong><strong>School</strong> <strong>System</strong> grew into one of the nation’s fi nest large school districts inless than a generation, establishing a tradition of superior performance.For a student to be successful in our schools, the single most importantfactor is a quality teacher. <strong>Wake</strong> <strong>County</strong> has launched a bold effort torecruit the world’s best teachers and ensure that they remain in <strong>Wake</strong>schools. Our community expects it, and our children deserve it.The tireless work of North Carolina’s fi nest teachers has made us thehighest-performing large urban district in the state, while our principalsand administrators have made us the most effi cient. <strong>Wake</strong> <strong>County</strong>’sbusiness community has partnered with us to create new opportunitiesfor career growth and exploration.There is no “one-size-fi ts-all” in our school system. Just as children areunique individuals, our school system offers a wide variety of choices.Our nationally renowned magnet schools feature an exciting menu ofoptions for families who prefer something outside the traditional. Multitrackyear-round schools are providing extra space for students in acrowded district and offer extra instructional time for targeted studentsduring the school year.Our entire community can look forward to an equally bright and progressivefuture, driven by our traditions of bold leadership, quality teaching,academic excellence, parental choice and community involvement.The official Fall 2006 20th Day Membership for WCPSS was 128,072,including 62,395 elementary students, 29,031 middle school students,and 36,646 high school students. Annual growth increased to 7,582students, the largest one-year gain in the district’s history and more thantwice the amount of growth recorded in 2002-03.Student membership projections were developed in the Fall of <strong>2007</strong>-<strong>08</strong> by DeJong Inc. through a contract with the <strong>Wake</strong> <strong>County</strong> <strong>Plan</strong>ningDepartment. The projections extend twenty years and were presentedto <strong>Wake</strong> <strong>County</strong> and WCPSS staff in December 2006. The net increasefor <strong>2007</strong>-<strong>08</strong> is projected to be 8,014 students or 6.3 percent. Thiscontinues a trend of steadily increasing annual net gains that began in2003 when the current building program was created. Due to highergrowth than was projected four years ago, WCPSS will add at least 103mobile or modular classrooms for <strong>2007</strong>-<strong>08</strong> in addition to opening threenew elementary schools, two new middle schools, and two ninth-gradecenters. Three elementary schools will move from temporary locationsinto new permanent facilities.The DeJong projections estimate that the school system should expectan enrollment of 259,195 in the 2026-27 school year. Projections areprovided by grade level for long-term facility and budget planning.Projected enrollment was correlated with housing density projections todevelop enrollment projections by area within the county. Growth in thenext fi ve years will occur throughout the county with the heaviest growthin the western and southern areas, the US-1 and US-401 corridors in thenorthern area, and areas near the I-540 outer beltline in the eastern areaof the county.Projections developed by DeJong Inc. in Fall2006, show projected enrollment for WCPSS tobe:<strong>2007</strong>-<strong>08</strong> 136,<strong>08</strong>6 students20<strong>08</strong>-09 144,035 students2009-10 152,206 students337 FY <strong>2007</strong>-<strong>08</strong> <strong>Plan</strong> for Student Success
Membership TrendsWAKE COUNTY PUBLIC SCHOOL SYSTEMHISTORICAL AND PROJECTEDENROLLMENT 1996-2016<strong>School</strong> Year HistoricalProjectedEnrollment1996-1997 85,4111997-1998 89,4411998-1999 91,9111999-2000 94,8502000-2001 97,5832001-2002 101,3972002-2003 104,3732003-2004 1<strong>08</strong>,9702004-2005 114,0682005-2006 120,5042006-<strong>2007</strong> 128,072<strong>2007</strong>-20<strong>08</strong> 136,<strong>08</strong>620<strong>08</strong>-2009 144,0352009-2010 152,2062010-2011 160,6052011-2012 168,7362012-2013 173,0102013-2014 182,3172014-2015 192,1992015-2016 201,854Students250,000200,000150,000100,00050,00001985-861987-881989-90Historical and Projected Enrollment1985-20161991-921993-941995-961997-981999-002001-02Years2003-042005-06<strong>2007</strong>-<strong>08</strong>2009-102011-122013-142015-16<strong>Wake</strong> <strong>County</strong> continues to grow at an explosive pace. While growth fuels the economy and opportunities for graduating students, it can put pressureon school system resources.Membership Growth FY 2001-20<strong>08</strong>GradeLevel2001-2002Actual2002-2003Actual2003-2004Actual2004-2005Actual2005-2006Actual2006-<strong>2007</strong>Actual<strong>2007</strong>-20<strong>08</strong>EstimatedIncrease/Decrease %K – 5 49,635 50,455 52,241 54,756 58,249 62,395 67,094 4,699 7.5%6 – 8 24,484 25,296 26,019 26,712 27,759 29,031 30,213 1,182 4.1%9 – 12 27,278 28,622 30,710 32,600 34,496 36,646 38,779 2,133 5.8%Total * 101,397 104,373 1<strong>08</strong>,970 114,068 120,504 128,072 136,<strong>08</strong>6 8,014 6.3%*The membership total growths do not include charter schools.338
Budgetary AssumptionsState SourcesIn order to project state sources of revenue, we applied the state planningallotment formulas to our projected student membership fi gures. Thelegislative liaison for the school district consulted with legislative fi scalstaff and staff at the NC Department of <strong>Public</strong> Instruction to gatherinformation about projected salary increases and employer matchingbenefi t rates. Actual state funding levels are not available until thelegislature concludes its session. This can be as late as the fall.State allotments are funded on a formula basis. The State funds schoolswith three basic types of allotments.Position Allotments:The State allots positions to a local school system for a specifi cpurpose. The local school system pays whatever is required to hirecertifi ed teachers and other educators, based on the State SalarySchedule, without being limited to a specifi c dollar amount. Each localschool system will have a different average salary based on the certifi edpersonnel’s experience and education. Examples of position allotmentsare teachers, school building administration and instructional supportpersonnel.Dollar Allotments:Local school systems can hire employees or purchase goods for aspecifi c purpose, but the local school system must operate within theallotted dollar amount. Examples of dollar allotments are teacherassistants, textbooks, central offi ce administration and classroommaterials/supplies/equipment.Categorical Allotments:Local school systems may use this funding to purchase all servicesnecessary to address the needs of a specifi c population or service.The local school system must operate within the allotted funds. Thesefunds may be used to hire personnel such as teachers, teacherassistants, and instructional support personnel or to provide a servicesuch as transportation, staff development, or to purchase supplies andmaterials.Examples of categorical funding are: at risk student services, childrenwith disabilities, noninstructional support personnel, and transportation.Local SourcesFines and forfeitures were projected based on historical experience.Fines and forfeiture collections have been $3.0 million in FY 03,$4.0 million in FY 04, $3.9 million in FY 05, and $6.6 million in FY 06.Interest earned was projected based on the current interest rate andan estimated amount of funds available for investment using historicalexperience. We invest local dollars in the State Treasurer’s InvestmentFund (STIF) account, North Carolina Capital Management Trust(NCCMT) and Wachovia Jumbo Money Market account. In fi scal year2006 we earned an average of 4.03 percent. Indirect cost is projectedbased on the indirect cost rate applied to our estimated level of grantand enterprise funding. Parking fee projections are projected based onthe annual fee times the number of available parking spaces. Otherrevenues are included at known levels based on agreements in place.Fund balance appropriation levels are arrived upon based on a greatdeal of analysis regarding the level of unappropriated fund balancenecessary to maintain a sound fi nancial condition for the school system.Appropriated fund balance is considered a nonrecurring revenue sourcesince the availability of fund balance cannot be guaranteed from year toyear. Analysis of fund balance levels occurs throughout the year.Federal GrantsFederal grants are projected using historical information, state planningallotments, formulas, and consultation with the grants area with <strong>Wake</strong><strong>County</strong> <strong>Public</strong> <strong>School</strong> <strong>System</strong>. Actual levels of grant funding are typicallynot awarded until the fall.Enterprise FundsEnterprise revenues are projected by applying tuition fees and mealfees to projected student participation. These budgets can be adjustedlater in the year if participation rates come in signifi cantly different.Enterprise programs must generate enough revenue to cover the costsof the program.EnrollmentStudent membership projections for <strong>Wake</strong> <strong>County</strong> used to preparethe <strong>Plan</strong> for Student Success total 136,<strong>08</strong>6 students (excluding 4,694students projected to be enrolled in charter schools). The net increasein students for 2006-07 from 2005-06 tenth day is projected to be 7,185students or six percent.339 FY <strong>2007</strong>-<strong>08</strong> <strong>Plan</strong> for Student Success
Budgetary AssumptionsStudent membershipWCPSS2006-07 <strong>2007</strong>-<strong>08</strong> Increase %128,072 136,<strong>08</strong>6 8,014 6%Charter <strong>School</strong>s 4,304 4,694 390 9%132,376 140,780 8,404 6%Full-time or parttime(20 hours ormore) employeesLongevityFRINGE BENEFITS10 but less than 15 years15 but less than 20 years20 but less than 25 years25 or more years1.50% current annual pay rate2.25% current annual pay rate3.25% current annual pay rate4.50% current annual pay rateSalary IncreasesSalary increases for certifi ed employees are estimated at seven percentaverage increase. Salary increases for central offi ce administrative staffand noncertifi ed employees are estimated at three percent increase.Salary increases for the Board of Education member fees are estimatedat fi ve percent.Non-personnelitemsIndirect Cost (computedon all grant expendituresexcept equipment andunbudgeted amounts)4.435% Restricted 2006-0713.995% Nonrestricted 2006-07Fringe BenefitsMatching employer benefi t costs should be calculated in addition tosalary data. A chart of the most current rates are shown below.FRINGE BENEFITSFull & Part-timeemployeesFull-timeemployees (75%or more)Social SecurityWorkers’ CompensationRetirementHospitalizationUnemployment Ins.Dental7.65% of gross salary$0.30 per $100 professional$1.62 per $100 nonprofessional7.14% of gross salary$3,854/year 2006-07$4,047/year <strong>2007</strong>-<strong>08</strong>$4,249/year 20<strong>08</strong>-09$4,461/year 2009-100.012% of the fi rst $15,500salary$19.33/mo. or $232/year340
Budgetary AssumptionsSTATE/LOCAL ALLOTMENT FORMULASProgram Category Basis of AllotmentPRC 001Classroom TeachersGrades Kindergarten –3Grades 4-6Grades 7-8Grade 9Grades 10-121 per 18 ADM (LEA Class Size Avg is 21)1 per 22 ADM (LEA Class Size Avg is 26)1 per 21 ADM (LEA Class Size Avg is 26)1 per 24.5 ADM (LEA Class Size Avg is 26)1 per 26.64 ADM (LEA Class Size Avg is 29)Math/Science/ComputerTeachers----------------------------------WCPSS Formula:ADM Teacher1 per county or based on subagreements-------------------------------------------------------------------------------Calculations based on 10th day student membership. All students in kindergarten through Grade 12 are reported. Pre-schoolstudents are not included. Distributed through self-allotment until the day prior to Day 1 for Traditional Calendar <strong>School</strong>s. MOEunearned on 10th day removed from payroll or charged to individual school Fund 6.Formulas:Elementary: Integer((Kindergarten+Grade1+Grade2+Grade3)/20.5+(Grade4+Grade5)25.5))*10Middle<strong>School</strong>: Integer ((Grade6+Grade7+Grade8)/22.5)*10High <strong>School</strong>: Integer ((Grade9+Grade10+Grade11+Grade12)/2.4)Elementary Dance and TheaterArtsElementary Foreign Language(Spanish)Elementary K-2 LiteracyTeachersElementary Music (band and/orstringsDance/Theatre Arts teachers are a part of the C&I allocation formula. Dance/Theatre Arts teachers should be scheduled towork with 4th and 5th grade students for 45-minute periods with 10 minutes between classes for materials preparation. Theoptimum number of classes per week for an arts teacher is 27. This provides room in the schedule for curriculum integrationand school-wide projects (e.g., performances). The maximum number of classes per week for an arts teacher should be nomore than 30.Elementary foreign language teachers are a part of C&I allocation formula. These positions are only converted when no one iscurrently in the position or a Spanish teacher unable to be procured.All traditional schools receive 5 MOEs. Year-round schools receive 6 MOEs.Music teachers are a part of the C&I allocation formula. Music teachers should be scheduled for 45-minute periods with 10minutes between classes for materials preparation. Classes may be shortened to 40 minutes for kindergarten and may belengthened to 50 minutes for 5th grade students. The optimum number of classes per week for an arts teacher is 27. Thisprovides room in the schedule for curriculum integration and school-wide projects (e.g. performances). The maximum numberof classes per week for an arts teacher should be no more than 30.341 FY <strong>2007</strong>-<strong>08</strong> <strong>Plan</strong> for Student Success
Budgetary AssumptionsSTATE/LOCAL ALLOTMENT FORMULASProgram Category Basis of Allotment----------------------------------Elementary Physical EducationElementary Visual ArtInstructional Resource Teachers-------------------------------------------------------------------------------Physical education teachers are a part of the C&I allocation formula. PE teachers should be scheduled for 45-minuteperiods with 10 minutes between classes for materials preparation. Classes may be shortened to 40 minutes forkindergarten and may be lengthened to 50 minutes for grade 5 students. The optimum number of classes per week fora PE teacher is 27. This provides room in the schedule for curriculum integration and school-wide projects (e.g., fi tnesstesting). The maximum number of classes per week for a PE teacher should be no more than 30.Visual Art teachers are a part of the C&I allocation formula. Visual Art teachers should be scheduled for 45-minuteperiods with 10 minutes between classes for materials preparation. Classes may be shortened to 40 minutes forkindergarten and may be lengthened to 50 minutes for 5th grade students. The optimum number of classes per weekfor an arts teacher is 27. This provides room in the schedule for curriculum integration and school-wide projects (e.g.,displays). The maximum number of classes per week for an arts teacher should be no more than 30.Elementary <strong>School</strong>sInstructional resource teachers are a part of the C&I allocation. Those schools whose ADM is greater than 650 areallotted 10 MOE. Those schools whose ADM is fewer than 650 are allotted 5 MOE.Middle <strong>School</strong>sProject Achieve schools do not receive this allotment. Year round schools’ allotment is 6 MOE. Traditional calendarschools’ allotment is 5 MOE.Middle <strong>School</strong> Instrumental Music(band and/or strings)Middle <strong>School</strong> TeamingScheduling Assistance/ AthleticDirector/Athletic TrainerYear Round<strong>School</strong>s should hire a full time band director from ADM allotments to meet the needs of the elective middle schoolband program. <strong>School</strong>s with total band enrollment that exceeds 200 students may request an additional allotment toassist with appropriate class size. This additional allotment comes from the C&I allocation and is subject to availabilityof personnel and scheduling. Strings positions are allocated from C&I based on student enrollment. Recommendedpairings of itinerant teachers is completed by the Arts Education offi ce to use most effi ciently the personnel and travelbudget available.Fixed allotment: 10 MOE to middle schools 12 MOE to year round middle schools.Fixed allotment of 21 MOE to each high school, (10 month athletic director, 10 month scheduling assistance, and 1month trainer).Year round elementary schools receive 10 months for an intersession teacher and 10 MOEs for an intersession teacherassistant. It will probably be necessary for these staff members to follow a calendar developed by the school similar totrack 5 or to follow the traditional calendar.PRC 002 Central Office Administration FY <strong>2007</strong>-<strong>08</strong> <strong>Plan</strong>ning Allotment is 0.46% higher than FY 2006-07 Initial Allotment.PRC 003Noninstructional SupportPersonnel$251.31 per ADM. $6,000 per Textbook Commission member for Clerical Assistants.342
Budgetary AssumptionsSTATE/LOCAL ALLOTMENT FORMULASProgram Category Basis of Allotment----------------------------------WCPSS Formula:Clerical-------------------------------------------------------------------------------Base allotmentsElementary: 44 MOE (12 MOE Lead Secretary, 12 MOE NCWise Data Manager, 10 MOE Media Assistant, 10 MOEClerical)Middle: 68 MOE (12 MOE Lead Secretary, 12 MOE NCWise Data Manager, 12 MOE Bookkeeper, 12 MOE GuidanceAssistant, 10 MOE Media Assistant, 10 MOE Receptionist)High: 99 MOE (12 MOE Lead Secretary, 12 MOE NCWise Data Manager, 12 MOE Bookkeeper, 12 MOE Registrar, 11MOE Secretary, 40 MOE Clerical Assistant)10th Day K-12 Student Membership Adjustments to Base (only if positive):Elementary: Integer(((K+Grade 1 + Grade 2 + Grade 3 + Grade 4 + Grade 5)-500)/35)Middle: Integer(((Grade 6 + Grade 7 + Grade 8)-800)/35)High: Integer(((Grade 9 + Grade 10 + Grade 11 + Grade 12)-1200)/35)Other:Year round schools adjusted four MOEDue to small size, Longview, Redirection , River Oaks, East <strong>Wake</strong> <strong>School</strong> of Health Science, East <strong>Wake</strong> <strong>School</strong> ofIntegrated Technology, and <strong>Wake</strong> Early College have total allotment of 24 MOE, and Phillips has a base of 30 MOE.Custodian ServicesElementary: 16,000 net cleanable square feet per custodianMiddle: 18,000 net cleanable square feet per custodianHigh: 19,000 net cleanable square feet per custodianPRC 005<strong>School</strong> Building AdministrationPrincipalsAssistant Principals1 per school with at least 100 ADM or at least 7 state paid teachers1 month per 80 in ADM343 FY <strong>2007</strong>-<strong>08</strong> <strong>Plan</strong> for Student Success
Budgetary AssumptionsSTATE/LOCAL ALLOTMENT FORMULASProgram Category Basis of Allotment----------------------------------WCPSS Formula:-------------------------------------------------------------------------------Not calculated by formula. Allotment determined by broad bands at each level, contingent on available months andother conditions. The formula below has been proposed but not implemented pending funding.If your projectedstudent count is:000-899900-10991100+ElementaryThen your APallotment is:12 MOE18 MOE24 MOEProposed FormulaIf your projectedstudent count is:000-449450-799800-11991200-19992000-22992300+SecondaryThen your APallotment is:12 MOE24 MOE36 MOE48 MOE60 MOE72 MOEThe 2006-07 allotments were calculated using the following bands. This is a phase-in until funding is approved for theproposed formula.Elementary <strong>School</strong>s:Middle <strong>School</strong>s:If your projected student Then your AP allotment is:count is:000-899 11 MOE Traditional/12MOE Year Round900-1099 16.5 MOE Traditional/18 MOE Year Round1100+ 22 MOE Traditional/24 MOE Year RoundIf your projected student Then your AP allotment is:count is:000-699 12 MOE700-949 24 MOE950-1399 29 MOE Traditional/30 MOE Year Round1400+ 36 MOE344
Budgetary AssumptionsSTATE/LOCAL ALLOTMENT FORMULASProgram Category Basis of AllotmentHigh <strong>School</strong>s:If your projected student Then your AP allotment is:count is:Base Allotment18 MOE1650-2399 48 MOE2400+ 60 MOEPRC 007Instructional Support--------------------------------WCPSS Formula:Media SpecialistCounselors1 per 200.10 ADM----------------------------------------------------------------------------------Media Specialists are allotted based on fi nal projected ADM. (Allotment may change pending fi nalization of projectedADM)<strong>School</strong>s with less than 150 students: 5 MOE150-824 students: 10 MOE; 12 MOE YR825-999 students: 15 MOE; 18 MOE YR1000-1499 students: 20 MOE; 22 MOE YR Elementary, 24 MOE YR Middle1500-1999 students: 25 MOE2000-2499 students: 30 MOEOver 2500 students: 35 MOECertain original magnet schools receive an additional 5 MOE.The distribution process is based on projected enrollment using the following guidelines:Elementary <strong>School</strong>sTraditional/Modified Calendar Year Round Calendar• 0-823 students: 10 MOE • 0-1098 students: 12 MOE• 823-1000 students: 15 MOE • 1099-1333 students: 17 MOE• Over 1000 students: 20 MOE • Over 1333 students: 22 MOEYear-round allocation is based on ¾ of the student planning allotment for traditional/modifi ed calendar schools.Middle <strong>School</strong>sTraditional/Modified Calendar Year Round Calendar• 1-400 students: 10 MOE • 0-533 students: 12 MOE• 401-849 students: 20 MOE • 534-1132 students: 22 MOE• 850-1249 students: 30 MOE • 1133-1666 students: 34 MOE• 1250-1549 students: 40 MOE • 1667-2065 students: 42 MOE• Over 1549 students: 50 MOE • Over 2065 students: 52 MOEYear-round allocation is based on ¾ of the student planning allotment for traditional/modifi ed calendar schools.High <strong>School</strong>s• 1-1849 students: 10 MOE per grade level (plus 2 additional MOE for the Dean of Student Services)• 1850-2249 students: 10 additional MOE• 2250-2649 students: 10 additional MOE345 FY <strong>2007</strong>-<strong>08</strong> <strong>Plan</strong> for Student Success
Budgetary AssumptionsSTATE/LOCAL ALLOTMENT FORMULASProgram Category Basis of AllotmentPsychologistsOne new school psychologist MOE for every 158 new students.Elementary and middle schools are assigned a number of school psychologist months of employment based on a formuladriven by student enrollment, school calendar and the school rank by Overall Risk Factor Score (Identifi cation Criteria forPES <strong>School</strong>s, 2006). High schools are assigned psychologist MOE based on student enrollment. Determined by thisformula, psychologists are assigned to two or three schools.Elementary <strong>School</strong> FormulaCalendar Risk Factor Rank SizeTraditional = 1Year-Round = 3Total Score Range = 3-9 Points1-30 = 331-62 = 263-93 = 1900 = 3Total Score/AssignedMOE3 Points = 4 MOE4-6 Points = 5 MOE7-9 Points = 6 MOEMiddle <strong>School</strong> FormulaCalendar Risk Factor Rank SizeTraditional = 1Year-Round = 3Total Score Range = 3-9 Points1-12 = 313-22 = 223+ = 1900 = 3Total Score/AssignedMOE3 Points = 1 MOE4-5 Points = 4 MOE6-7 Points = 5 MOE8-9 Points = 6 MOETotal Score Range = 1-4 PointsHigh <strong>School</strong> FormulaSize2300 = 4Total Score/AssignedMOE1 Point = 1 MOE2 Points = 3 MOE3 Points = 4 MOE4 Points = 5 MOESocial WorkersThe allotment formula provides approximately one MOE per 191 students in pre-K through grade 8, although ouralternative programs have a more concentrated staffi ng pattern. All middle schools are assigned a part-time socialworker, and high needs elementary schools are assigned part-time social workers, with central offi ce “on-call” service tothe remaining elementary schools. No social workers are assigned to our high schools except for alternative programs.However, at our regular high schools SAPs fulfi ll some social work functions, and they may request assistance from ourcentral offi ce based social work staff, as needed, for court attendance situations.PRC 012 Driver Education $243.41 per 9th grade ADM. Includes private, charter, and federal schools.346
Budgetary AssumptionsSTATE/LOCAL ALLOTMENT FORMULASProgram Category Basis of AllotmentPRC 013 Career Technical Education- MOE(LIMITED FLEXIBILITY – SalaryIncrease)------------------------------------WCPSS formula:Base of 50 months of employment per LEA with remainder distributed based on ADM in grades 8-12.----------------------------------------------------------------------------------CTE months of employment are allotted by the state to WCPSS based on ADM at grades 8-12. The WCPSS formulafor determining the MOE allocation to each school is based on the total school enrollment with consideration of thenumber of students enrolled in CTE courses. Expected enrollment will range between 16 and 26 students in eachclass, depending upon the content area, level, and safety issues. CTE teachers should have a full class load plus aplanning period. Each fully enrolled middle school is allotted a Curriculum Development Coordinator (CDC) for <strong>2007</strong>-<strong>08</strong> school year. Each fully enrolled high school is allotted a Career Development Coordinator (CDC) and a SpecialPopulations Coordinator (SPC) for the <strong>2007</strong>-<strong>08</strong> school year.PRC 014Career Technical EducationProgram Support$10,000 per LEA with remainder distributed based on ADM in grades 8-12 ($32.82).------------------------------------WCPSS formula:PRC 015 <strong>School</strong> Technology $6.84 per ADM.----------------------------------------------------------------------------------CTE months of employment are allotted by the state to WCPSS based on ADM at grades 8-12. The WCPSS formulafor determining the MOE allocation to each school is based on the total school enrollment with consideration of thenumber of students enrolled in CTE courses. Expected enrollment will range between 16 and 26 students in eachclass, depending upon the content area, level, and safetly issues. CTE teachers should have a full class load plus aplanning period. Each fully enrolled middle school is allotted a Career Development Coordinator (CDC) for the <strong>2007</strong>-<strong>08</strong> school year. Each fully enrolled high school is allotted a Career Development coordinator (CDC) and a SpecialPopulations Coordinator (SPC) for the <strong>2007</strong>-<strong>08</strong> school year.PRC 027Teacher Assistants------------------------------------WCPSS formula:$992.15 per K-3 ADM.----------------------------------------------------------------------------------Formula: Integer((Kindergarten+Grade1+Grade2+Grade3)/28))*10PRC 028Year RoundStaff Development------------------------------------WCPSS formula:Year round schools receive ten months for an intersession teacher assistant.$750 per LEA, then 25% of total is allotted equally (base) and 75% allotted based on ADM.----------------------------------------------------------------------------------75% of the state allotment is distributed to schools based on the number of months of employment allotted ateach school. 25% of the state allotment is distributed to the Offi ce of Continuous Improvement and ProfessionalDevelopment.347 FY <strong>2007</strong>-<strong>08</strong> <strong>Plan</strong> for Student Success
Budgetary AssumptionsSTATE/LOCAL ALLOTMENT FORMULASProgram Category Basis of AllotmentPRC 032 Children with Disabilities<strong>School</strong> AgedPreschoolGroup HomesDevelopmental Day Care (3-20)Community Residential Centers------------------------------------WCPSS Formula:AudiologistOccupational Therapist$3,157.55 per funded child count. Child count is comprised of the lesser of the December 1 handicapped child countor 12.5% of the allotted ADM.Base of $50,530 per LEA; remainder distributed based on December 1 child count of ages 3, 4, and PreK-5,($2,568.39) per child.Approved applications.To be allotted in revision.To be allotted in revision.----------------------------------------------------------------------------------The current audiologist-to-school ratio is approximately one audiologist to every 30 schools. Assignment ofaudiologists to schools is based on needs, as determined by the total number of students with documentedhearing loss and the average number of annual school-based hearing assessments. Target caseload numbers areestablished, taking into consideration the location of hearing impaired special education programs and geographicproximity.Currently, there are 17.5 occupational therapy positions assigned across the schools. The number of schoolsassigned to any given therapist is based on the following factors:Factor Weight Points# of students requiringoccupational therapy services and3XHigh=3; Med.=2; Low=1amount of time on IEP’s# of re-evaluations requiredduring the school year1XHigh=3; Med.=2; Low=1# of initial referrals (historically) 2X Elem.=3; Mid.=2; High=1#of special education programs 2X 1 to 3 based on type of programElementary/middle/high school 1X Elem.=3; Mid.=2; High=1Year-round vs. traditional 1X Yr-Round=2; Trad.=1Therapist continuity at school 1X 1Proximity of assigned schools 1X 1348
Budgetary AssumptionsSTATE/LOCAL ALLOTMENT FORMULASProgram Category Basis of AllotmentPhysical TherapistCurrently 9.5 (FTE) physical therapists are employed in the <strong>Wake</strong> <strong>County</strong> <strong>Public</strong> <strong>School</strong> <strong>System</strong>, including a LeadPhysical Therapist who divides her time between administrative/supervisory duties and services for specifi c students.<strong>School</strong>s are assigned to PT’s by the Lead Physical Therapist based on a regional/proximity, number of students withIEP or 504 plan at school, severity of student needs as well as consideration of other factors that might impact studentsuccess.The time spent at each school is determined by the needs of the students with IEPs and 504 plans which specifyintervention by a physical therapist, evaluation and re-evaluation requests, and IEP/504 team meetings.Special Education ServicesSpeech/Language TherapyServicesPersonnel is allotted based upon ratios as outlined in Procedures Governing Programs and Services for Children withDisabilities, Exceptional Children Division, October 2004, Appendix A Pupil/Teacher Ratio. Special adjustments maybe made to assure the provision of a Free Appropriate <strong>Public</strong> Education (FAPE).The school assignments of speech/language pathologists are based on the number and severity-level of identifi edstudents. The severity-level based on evaluation scores results in a point system. The evaluation scores/points ofeach student receiving speech therapy at a school are added together for a school total. The following is the formulaused to determine the amount of time allotment to a school:PRC 033PRC 034ABC Incentive AwardAcademically or IntellectuallyGifted Students------------------------------------WCPSS formula:100% = 150 points 50% = 75 points90% = 135 points 40% = 60 points80% = 120 points 30% = 45 points70% = 105 points 20% = 30 points60% = 90 points 10% = 20 pointsThe size and number of self-contained classrooms within a school is also a determining factor since they often requireadditional time for evaluations and IEP meetings.Awards of up to $1,500 plus benefi ts for certifi ed personnel and up to $500 plus benefi ts for teacher assistants areallocated to schools that attain high growth. Awards of up to $750 plus benefi ts for certifi ed personnel and up to $375plus benefi ts for teacher assistants are allocated to schools that attain expected growth. Allocation is based on thenumber of state and local personnel in grades Pre-K through 12 assigned to eligible schools.$1,012.60 per child for 4% of ADM.----------------------------------------------------------------------------------Complete annual student identifi cation. MOE are determined and distributed according to the number of identifi ed AGstudents in a school.PRC 035 Child Nutrition Elementary: 20 meal equivalents per labor hourMiddle: 22-24 meal equivalents per labor hourHigh: 22-24 meal equivalents per labor hourA meal equivalent equals: (#breakfasts divided by 2)+(#snacks divided by 3) +(# lunches)+($amount of supplementalsales divided by $2.23) based on a daily average.PRC 050 Elementary Title I Teachers A LEA must allocate Title I funds to participating school attendance areas or schools, in rank order, on the basis of thetotal number of children from low-income families in each area or school.349 FY <strong>2007</strong>-<strong>08</strong> <strong>Plan</strong> for Student Success
Budgetary AssumptionsSTATE/LOCAL ALLOTMENT FORMULASProgram Category Basis of AllotmentPRC 054 English as a Second Language Base of a teacher assistant ($25,825); remainder based 50% on number of LEP students ($328.25) and 50% on anLEA’s concentration of LEP students ($3,838.33).WCPSS Formula:Annual review of identifi ed ESL students. Examination of WCPSS locator to identify ESL designated schools.Recommendation of additional ESL designated schools. Teacher: student ratio at ESL designated schools determinedby dividing projected ESL funding by number of ESL students on locator.PRC 056 Transportation Based on an effi ciency rated formula and local operating plans. The initial allotment is 80% of planning.PRC 061 Classroom Materials/Instructional Supplies andEquipment$52.31 per ADM plus $2.69 per ADM in grades 8 and 9 for PSAT Testing-----------------------------------WCPSS Formula:.----------------------------------------------------------------------------------The total allotment per 10th day student membership is shown below. The breakdown between fund 01 and 02 willvary annually. These fi gures include a $2.00 increase over the previous year.Grades K-3 $86.13Grades 4-5 $79.83Grades 6-8 $88.48Grades 9-12 $92.73PRC068/069AthleticCopierInstrument RepairPrincipals’/Assistant Principals’In-<strong>System</strong> TravelAt-Risk Student Services/Alternative <strong>School</strong>s------------------------------------WCPSS Formula:In <strong>School</strong>Suspension TeachersCommunities In <strong>School</strong>sEach middle school will receive $2,620 and each high school will receive $945.Each school receives $6.17 per 10th day student count.Each middle and high school will receive $1,000 to pay for the repair of school-owned band instruments.(Round trip mileage to Crossroads x 72 trips) x .445 (current mileage reimbursement rate) + (200 days x 5 miles) x.445 (current mileage reimbursement rate).Each LEA receives the dollar equivalent of one resource offi cer ($37,838) per high school. Of the remaining funds,50% is distributed based on ADM ($66.46 per ADM) and 50% is distributed based on number of poor children, perthe Federal Title I Low Income poverty data ($384.64 per poor child). Each LEA receives a minimum of the dollarequivalent of two teachers and two instructional support personnel ($214,782). The new formula is fully implementedand the hold harmless no longer applies.----------------------------------------------------------------------------------This allotment covers the teachers of in-school suspension in the middle schools. It is funded through PRC 069.This allotment provides some of the positions for coordinators of Communities in <strong>School</strong>s programs at Brentwood,Hunter, Millbrook, Wilburn, and Poe Elementary <strong>School</strong>s, and Daniels, East Millbrook, East <strong>Wake</strong>, Mt. Vernon, andZebulon Middle <strong>School</strong>s, and Garner High <strong>School</strong>. These are paid from PRC 069.350
Budgetary AssumptionsSTATE/LOCAL ALLOTMENT FORMULASProgram Category Basis of AllotmentPRC 072Minimum CompetencyAlternative High <strong>School</strong> ProgramsImproving StudentAccountability------------------------------------WCPSS Formula:Accelerated Learning ProgramThese positions are allotted based on the number of students with more than 4 academic risk factors.This allotment includes positions for alternative programs at East <strong>Wake</strong> High and Phillips High. It is funded through PRC 068.Each LEA will receive funding based on the number of students who score at Level I or Level II on either reading ormathematics end-of-grade tests in grades 3-8.----------------------------------------------------------------------------------<strong>2007</strong>-<strong>08</strong> allotments are based on the number of Level I and II students for ALP during the 06-07 school year.ALP is allotted to elementary and middle schools and alternative schools serving elementary and middle school students.Months are allotted on the basis of 1 MOE for every 13 students scoring Level I and II in grades 3-8. The maximum allotmentis 20 MOE.Additional allotments may be made based upon rerostered 06-07 EOG results after the 20th day. Months will not be takenaway.High <strong>School</strong> InterventionCoordinatorsOne ten-month position for each high school. A half-time position for alternative sites.Challenged <strong>School</strong>sAllotted to schools with 30% or more of their students on the F/R enrollment projections from Growth Management after thestudent assignment plan is fi nalized. The allotments will be revised, if needed, in October <strong>2007</strong>. No months are taken awayPRC 130 Textbooks $65.43 per ADM in grades K-12.PRC 301 ROTC ROTC MOE provided from categorical Federal funds, for each high school with a Board of Education approved program. Thenumber of months allotted is dependent upon the contractual agreement with the branch of service sponsoring the ROTCprogram.PRC 856Magnet Program - Local------------------------------------WCPSS Formula:Magnet Positions----------------------------------------------------------------------------------Program magnet schools receive positions based on theme. In most cases, magnet allotments will be the same from year-toyear.PRINCIPALS NEED TO REMEMBER THAT “ONE-YEAR ONLY” ALLOTMENTS WILL NOT BE RENEWED FOR THE 2006-07SCHOOL YEAR.351 FY <strong>2007</strong>-<strong>08</strong> <strong>Plan</strong> for Student Success
Budgetary AssumptionsFEDERAL GRANT DESCRIPTIONSPRC FEDERAL GRANT TITLE GRANT TERM TYPE BRIEF DESCRIPTION017Vocational Education– Program Improvement12 months FormulaTo assist in developing the academic, vocational and technicalskills of students who elect to enroll in vocational and technicaleducation programs that will prepare them for occupations requiringother than a baccalaureate or advanced degree. Seventy percent(70%) of available funds are allotted based on the child populationin poverty ages 5-17 ($54.26 per count). Thirty percent (30%)of available funds are allotted based on the age 5-17 population($3.78 per count).LIQUIDATIONPERIODNo026 Homeless Children27 monthsexpires 9/30FormulaFunds to help LEAs meet the special education needs of homelesschildren. Total funding to LEAs/Charter <strong>School</strong>s is negotiatedbased on available funds.90-day044IDEA VI-B Capacity BuildingImprovement (SLIVER)27 monthsexpires 9/30FormulaSpecial education programs for handicapped children ages 3 to21. Allotment is based on the December 2004, IDEA Title VI-B head count ($15.49 per count) and adjusted for a minimumallocation of $1,000.90-day048Safe and Drug-Free <strong>School</strong>sand Communities27 monthsexpires 9/30FormulaFunds to prevent violence and to implement prevention, earlyidentifi cation, intervention drug programs and safe schools. Sixtypercent (60%) of available funds are based on relative amountssuch agencies received under Part A of Title I for the precedingfi scal year. Forty percent (40%) of available funds are based onADM ($1.52 per ADM), including private schools.90-day049IDEA Title VI-B PreschoolHandicapped27 monthsexpires 9/30FormulaSpecial education programs for handicapped children ages 3-5.Base Payment – Each LEA shall receive a base amount equal to aproportional share of 75% of the FY 1997-98 IDEA VI-B PreschoolGrant as calculated using the December 1996 head count.Funds Remaining After Base – Eighty-fi ve percent (85%) isdistributed based on ADM ($1.10 per ADM), including privateschools and 15% distributed based on December 2005, free lunchcount ($0.52 per count).90-day050IASA Title I –Basic/Concentration/Targeted/EFIG/Neglected andDelinquent27 monthsexpires 9/30FormulaSupplemental funds to provide special help to educationallydeprived children, ages 5-17 reach high academic standards.Poverty based formula based on funding levels as calculated bythe U.S. Department of Education.90-day057 Abstinence Education12 monthsexpires 12/31FormulaProvide abstinence education focusing on those groups whichare most likely to bear children out-of-wedlock. LEAs will benotifi ed when additional information is received from the FederalGovernment.No352
Budgetary AssumptionsPRC FEDERAL GRANT TITLE GRANT TERM TYPE BRIEF DESCRIPTION059 Title V - Innovative060 IDEA VI-B Handicapped27 monthsexpires 9/3027 monthsexpires 9/30FormulaFormulaFunds for targeted assistance programs to enhance studentperformance. Sixty percent (60%) of available funding is basedon ADM ($.94 per ADM), including private schools. Forty percent(40%) of funding is based on the December 2005, free lunch count($1.64 per count).Special education programs for handicapped children ages 3 to21.Base Payment – Each LEA shall receive a base amount equal to aproportional share of 75% of the FY 1999-00 IDEA Title VI-B grantas calculated using the December 1998 head count.Funds Remaining After Base – Eighty-fi ve percent (85%) isdistributed based on ADM ($93.93 per ADM), including privateschools and 15% distributed based on December 2005, free lunchcount ($45.23 per count).LIQUIDATIONPERIOD90-day90-day064 Learn and Serve America27 monthsexpires 6/30CompetitiveMeet the unmet human, educational, environmental, and publicsafety needs of the United States, without displacing existingworkers; and renew the ethic of civic responsibility and the spirit ofcommunity throughout the United States.NoCombines the Eisenhower Professional Development StateGrants, Class-Size Reduction and a state administered program(Teacher Quality Enhancement) into one program that focuses onpreparing, training, and recruiting high-quality teachers.103 Improving Teacher Quality27 monthsexpires 9/30FormulaHold Harmless Base Allotment – LEAs receive the amount theywere entitled to receive in FY 2001-02 for the former EisenhowerProfessional Development and Class Size Reduction Programs.90-dayRemaining Funds Available After Hold Harmless – Eighty percent(80%) of the available funds are based on child population inpoverty ages 5-17 ($63.93 per count). Twenty percent (20%) ofthe available funds are allotted based on the age 5-17 population($2.60 per count).104Language Acquisition StateGrant27 monthsexpires 9/30FormulaAssists school districts in teaching English to limited Englishprofi cient students and in helping these students meet the samechallenging State standards required of all other students. Theavailable funds are allotted based on Limited English Profi cientStudent Head Count ($78.48 per count). A LEA’s/Charter’sallotment must be at least $10,000 to receive funding or a consortiamust be formed.90-day105 Title I - <strong>School</strong> Improvement27 monthsexpires 9/30CompetitiveNew <strong>School</strong> Improvement grant to schools identifi ed for schoolimprovement, corrective action and restructuring.90-day353 FY <strong>2007</strong>-<strong>08</strong> <strong>Plan</strong> for Student Success
Budgetary AssumptionsPRC FEDERAL GRANT TITLE GRANT TERM TYPE BRIEF DESCRIPTION107111Educational TechnologyState GrantEnglish LanguageAcquisition, Signifi cantIncrease27 monthsexpires 9/3027 monthsexpires 9/3050% FormulaFormulaConsolidates the current Technology Literacy Challenge Fund(TLCF) and Technology Innovation Challenge Grant programs intoa single State formula grant program to support the integration ofeducational technology into classrooms to improve teaching andlearning. The available funds are allotted based on each LEA’s/Charter’s proportionate share of funds under Part A of Title I for thecurrent year. This allotment is based on the FY 2006-07 planningallocation for Title I.Assists school districts in teaching English to limited Englishprofi cient students and in helping these students meet the samechallenging State standards required of all other students. Thefunds are available to any LEA/Charter receiving a PRC 104award either individually or as a member of a consortium andhaving a signifi cant increase of at least 5% in the immigrant countcompared to the average of the two previous years. The fundingfactor per 06-07 immigrant count is $97.19.LIQUIDATIONPERIOD90-day90-dayFederal allotments are funded on a formula basis. The most current allotment formulas are provided in the following chart.FEDERAL ALLOTMENT FORMULASFEDERAL GRANT TITLE017 Career Technical Education – Program ImprovementSeventy percent (70%) of available funds are allotted based on the child population inpoverty ages 5-17 ($54.26 per count). Thirty percent (30%) of available funds are allottedbased on the age 5-17 population ($3.78 per count).026 McKinney – Vento – Homeless Assistance Act Total funding to LEAs/Charter <strong>School</strong>s is negotiated based on available funds.044 IDEA Title VI-B Capacity Building and Improvement048 Safe and Drug-Free <strong>School</strong>s and Communities049 IDEA Title VI-B Preschool Handicapped050 IASA Title I – LEA Basic ProgramAllotment is based on the December 2003, IDEA Title VI-B head count ($20.11 per count)and adjusted for a minimum allocation of $1,000.Sixty percent (60%) of available funds are based on relative amounts such agenciesreceived under Part A of Title I for the preceding fi scal year. Forty percent (40%) ofavailable funds are based on ADM ($1.52 per ADM), including private schools.Base Payment – Each LEA shall receive a base amount equal to a proportional share of75% of the FY 1997-98 IDEA VI-B Preschool Grant as calculated using the December1996 head count.Funds Remaining After Base – Eighty-fi ve percent (85%) is distributed based on ADM($1.10 per ADM), including private schools and 15% distributed based on December2005, free lunch count ($0.52 per count).Poverty based formula based on funding levels as calculated by the U.S. Department ofEducation. An LEA must allocate Title I funds to participating school attendance areasor schools, in rank order, on the basis of the total number of children from low-incomefamilies in each area or school.354
Budgetary AssumptionsFEDERAL ALLOTMENT FORMULASFEDERAL GRANT TITLE057 Abstinence Until Marriage Each LEA will receive $333 for each grade served from grades 7-12.059 Title V – Innovative Programs060 IDEA Title VI-B Handicapped103Improving Teacher Quality104 Language Acquisition State Grant105 ESEA Title I – <strong>School</strong> Improvement107 Educational Technology State Grant111 Language Acquisition, Signifi cant IncreaseSixty percent (60%) of available funding is based on ADM ($.94 per ADM), includingprivate schools. Forty percent (40%) of funding is based on the December 2005, freelunch count ($1.64 per count).Base Payment – Each LEA shall receive a base amount equal to a proportional shareof 75% of the FY 1999-00 IDEA Title VI-B grant as calculated using the December 1998head count.Funds Remaining After Base – Eighty-fi ve percent (85%) is distributed based on ADM($93.93 per ADM), including private schools and 15% distributed based on December2005, free lunch count ($45.23 per count).Hold Harmless Base Allotment – LEAs receive the amount they were entitled to receivein FY 2001-02 for the former Eisenhower Professional Development and Class SizeReduction Programs.Remaining Funds Available After Hold Harmless – Eighty percent (80%) of the availablefunds are based on child population in poverty ages 5-17 ($63.93 per count). Twentypercent (20%) of the available funds are allotted based on the age 5-17 population ($2.60per count).The available funds are allotted based on Limited English Profi cient Student Head Count($78.48 per count). A LEA’s /Charter’s allotment must be at least $10,000 to receivefunding or a consortia must be formed.Allotments are made according to the average daily membership (ADM) in the school.The formula for allotting funds are as follows: 200 or less receives $20,000, 201 to 350receives up to $35,000, 351 to 500 receives up to $50,000, 501 to 650 receives up to$65,000, 651 to 900 receives up to $90,000, and above 900 receives up to $100,000.The available funds are allotted based on each LEA’s/Charter’s proportionate share offunds under Part A of Title I for the current year. This allotment is based on the FY 2006-07 planning allocation for Title I.The funds are available to any LEA/Charter receiving a PRC 104 award either individuallyor as a member of a consortium and having a signifi cant increase of at least 5% in theimmigrant count compared to the average of the two previous years. The funding factorper 06-07 immigrant count is $97.19.355 FY <strong>2007</strong>-<strong>08</strong> <strong>Plan</strong> for Student Success
Budgetary AssumptionsBudget Flexibility with State Allotments§ 115C-105.25. Budget fl exibility.(a) Consistent with improving student performance, a local boardshall provide maximum fl exibility to schools in the use of funds to enablethe schools to accomplish their goals.(b) Subject to the following limitations, local boards of education maytransfer and may approve transfers of funds between funding allotmentcategories:(1) In accordance with a school improvement plan accepted underG.S. 115C-105.27, State funds allocated for teacher assistants may betransferred only for personnel (i) to serve students only in kindergartenthrough third grade, or (ii) to serve students primarily in kindergartenthrough third grade when the personnel are assigned to an elementaryschool to serve the whole school. Funds allocated for teacher assistantsmay be transferred to reduce class size or to reduce the student-teacherratio in kindergarten through third grade so long as the affected teacherassistant positions are not fi lled when the plan is amended or approvedby the building-level staff entitled to vote on the plan or the affectedteacher assistant positions are not expected to be fi lled on the date theplan is to be implemented. Any State funds appropriated for teacherassistants that were converted to certifi cated teachers before July 1,1995, in accordance with Section 1 of Chapter 986 of the 1991 SessionLaws, as rewritten by Chapter 103 of the 1993 Session Laws, maycontinue to be used for certifi cated teachers.(2) In accordance with a school improvement plan accepted underG.S. 115C-105.27, (i) State funds allocated for classroom materials/instructional supplies/equipment may be transferred only for thepurchase of textbooks; (ii) State funds allocated for textbooks may betransferred only for the purchase of instructional supplies, instructionalequipment, or other classroom materials; and (iii) State funds allocatedfor noninstructional support personnel may be transferred only forteacher positions.(2a) Up to three percent (3%) of State funds allocated for noninstructionalsupport personnel may be transferred for staff development.(3) No funds shall be transferred into the central offi ce allotmentcategory.(4) Funds allocated for children with disabilities, for students withlimited English profi ciency, and for driver’s education shall not betransferred.(5) Funds allocated for classroom teachers may be transferredonly for teachers of exceptional children, for teachers of at-risk students,and for authorized purposes under the textbooks allotment categoryand the classroom materials/instructional supplies/equipment allotmentcategory.(5a) Positions allocated for classroom teachers may be convertedto dollar equivalents to contract for visiting international exchangeteachers. These positions shall be converted at the statewide averagesalary for classroom teachers, including benefi ts. The converted fundsshall be used only to cover the costs associated with bringing visitinginternational exchange teachers to the local school administrativeunit through a State-approved visiting international exchange teacherprogram and supporting the visiting exchange teachers.(6) Funds allocated for vocational education may be transferredonly in accordance with any rules that the State Board of Educationconsiders appropriate to ensure compliance with federal regulations.(7) Funds allocated for career development shall be used in accordancewith Section 17.3 of Chapter 324 of the 1995 Session Laws.(8) Funds allocated for academically or intellectually gifted studentsmay be used only (i) for academically or intellectually gifted students;(ii) to implement the plan developed under G.S. 115C-150.7; or (iii) inaccordance with an accepted school improvement plan, for any purposeso long as that school demonstrates it is providing appropriate servicesto academically or intellectually gifted students assigned to that schoolin accordance with the local plan developed under G.S. 115C-150.7.(9) Funds allocated in the Alternative <strong>School</strong>s/At-Risk Studentallotment shall be spent only for alternative learning programs, at-riskstudents, and school safety programs.356
Budgetary AssumptionsALLOTMENT CATEGORYABC TRANSFER POLICYALLOTMENT CATEGORYABC TRANSFER POLICYABC Incentive AwardAcademically or Intellectually GiftedStudentsAt Risk Student Services / AlternativePrograms and <strong>School</strong>sFunds are available from July 1– August 31 of the next fi scal year.Central Offi ce AdministrationChildren with DisabilitiesIncludes Behavioral SupportClassroom Materials/InstructionalSupplies/EquipmentClassroom TeachersThe state does not allot dollars to hireteachers. The State will pay the salarycost of the State paid teachers that alocal system employs.Driver’s EducationImproving Student AccountabilityFunds are available from July 1 –August 31 of the next fi scal year.Instructional Support PersonnelThe State does not allot dollars for thiscategory. The State will pay the salarycost of the State paid positions a localsystem employs.No transfers are allowed.Funds can be transferred to other categoriesif in a school’s improvement plan and if allacademically or intellectually gifted studentsare appropriately served. Funds may betransferred into this category.Funds cannot be transferred out of thiscategory.Funds can be transferred into this category.Funds cannot be transferred into thiscategory.Funds can be transferred out for any otherpurpose.Funds may not be transferred out of thiscategory.Funds may be transferred in from anycategory.Transfers to textbooks are allowed if includedin a school’s improvement plan.Funds can only be transferred for classroommaterials /instructional supplies/equipment,exceptional children teachers, at-riskteachers, or textbooks. Funds transferredare based on the statewide average salaryfor teachers including fringe benefi ts.No transfers are allowed.Funds may not be transferred out of thiscategory.Funds may be transferred in from anycategory.Funds can be transferred for any purpose.Can be used for teachers in any gradewithout a transfer. Funds are based on thestatewide average salary for instructionalsupport including fringe benefi ts.Noninstructional Support PersonnelIncludes clerical, custodians, andsubstitutes.<strong>School</strong> TechnologyFunds are available until expended.<strong>School</strong> Building AdministrationThe State does not allot dollars for thiscategory. The State will pay the salarycost of the State paid positions a localsystem employs.Staff DevelopmentFunds are available July 1 – December31 of the next fi scal year.Teacher AssistantsTextbooksTransportationCareer and Technical EducationTransfers are allowed only for teachers (anygrade) if in a school’s improvement plan.Three percent (3%) of these funds may betransferred for staff development. No othertransfers are allowed.No transfers are allowed.Funds can be transferred for any purpose.Funds transferred are based on the statewideaverage salary for principals including fringebenefi ts and assistant principals includingfringe benefi ts. Waivers for placement ofprincipals on the salary schedule for lowperformingschools must be approved by theState Board.Funds can be transferred for any purpose.LEAs must allot 75% of funds to schools.Transfers allowed only for teachers ingrades K-3 if in a school’s improvementplan. Positions must be vacant to transfer.Grade placement may be waived if in aschool’s improvement plan to serve studentsprimarily in grades K-3 when the personnelare assigned to an elementary school toserve the whole school.Transfer to Classroom Materials/ InstructionalSupplies/ Equipment are allowed if includedin a school’s improvement plan. No othertransfers are allowed. LEAs will not haveto obtain a waiver to purchase off the Stateadoptedlist.Funds can be transferred. Transfers willimpact effi ciency ratings.Funds can be transferred between vocationaleducation categories. Limited transfers forother purposes are based on promulgatedrules established by the State Board tocomply with federal regulations.Intervention/Assistance Team FundingNo transfers are allowed.Limited English Profi ciencyNo transfers are allowed.357 FY <strong>2007</strong>-<strong>08</strong> <strong>Plan</strong> for Student Success
Student AchievementSTUDENT ACHIEVEMENT INWAKE COUNTY PUBLIC SCHOOLS (WCPSS)Student achievement in the <strong>Wake</strong> <strong>County</strong> <strong>Public</strong> <strong>School</strong> <strong>System</strong> hasbeen improving for the last several years. As required by state law andpolicy, students in WCPSS in grades three through eight are tested annuallyin reading and mathematics. The chart below (Figure 1) showsthe achievement in reading for students in Grades 3-5 from Spring 2000to Spring 2006. Over this period, there has been a steady increasein the percent of students in each grade level demonstrating on-gradeperformance in reading. While there has been some year to year variation,with slight increases or losses, the overall trend for these gradeshas been up. Moreover, by tracking along the diagonal of the data table,it may be observed that cohorts of students post gains for each grade.That is, there was a larger percentage of students in Grade 4 in 2001reading at or above grade level than was true for the same cohort, whenthey were in Grade 3 in 2000.Exactly the same trends in reading for students in Grades 6-8 arepresented in Figure 2. It is interesting to note that there is a drop in thepercentage of students reading at or above grade level in Grade 6, ascompared to the same cohort of students when they were in Grade 5.However, by the end of Grade 8, this drop has been largely made up.95.0%90.0%85.0%80.0%75.0%Figure 2:EOG Reading Trends by Grade Level,Spring 2000-2006, Grades 6-8100.0%95.0%90.0%Figure 1:EOG Reading Trends by Grade Level,Spring 2000-2006, Grades 3-570.0%6th Grade 7th Grade 8th Grade2000 77.8% 84.4% 88.7%2001 80.7% 85.1% 90.6%2002 82.8% 86.7% 91.4%2003 87.7% 90.3% 92.2%2004 87.1% 90.2% 91.6%2005 87.9% 90.4% 92.0%2006 88.9% 91.6% 92.0%85.0%80.0%75.0%3rd Grade 4th Grade 5th Grade2000 83.1% 81.6% 87.7%2001 85.3% 85.9% 90.8%2002 87.6% 87.4% 92.3%2003 89.0% 90.0% 93.5%2004 88.1% 89.5% 93.5%2005 88.5% 88.6% 94.3%2006 89.5% 90.9% 93.3%In 2005-06, the State Board of Education reset the passing levels formathematics tests in Grades 3-8. Whereas in prior years, the percentageof WCPSS students scoring at or above grade level in mathematics wassimilar to the outcomes seen for reading, in 2005-06, the percentageof students passing the mathematics tests fell substantially. As Figure3 shows, the percentage of students by grade level passing themathematics tests was lower than percentages passing reading tests.358
Student AchievementFigure 3:Mathematics Performance,Grades 3-8, 2005-06Figure 4:EOC Composite, 1998-200680.00%78.00%76.00%74.00%72.00%70.00%68.00%3rd Grade 4th Grade 5th Grade 6th Grade 7th Grade 8th Grade2005-06100.0%95.0%90.0%85.0%80.0%75.0%70.0%65.0%60.0%55.0%50.0%1998-991999-002000-012001-022002-032003-042004-052005-068 EOCs 73.5% 75.2% 79.0% 82.9% 83.1% 83.2% 83.2% 83.8%10 EOCs 80.7%8 EOCs10 EOCs2005-06 78.10% 76.10% 73.60% 73.80% 73.10% 72%In high schools, students do not take End of Grade (EOG) tests, butstudents in selected courses take End of Course (EOC) tests. Thesetests have traditionally been given at the end of courses in algebra 1,English 1, biology, chemistry, physical science, physics, algebra 2, andgeometry. In 2005-06, in addition to these eight tests, EOC tests werealso given in civics and economics courses and in U.S. history. Figure 4presents an historic view of performance of WCPSS high school studentswhen the percentage of students passing all of these tests are combinedinto a single composite number. As can be seen, there was a markedimprovement in the percent of students passing all of these tests from1998-99 to 2003-04. In 2003-04 through 2005-06, the percentage ofstudents passing has remained quite stable, increasing by about onepercentage point. The addition of the two new tests in 2005-06, however,had a depressing effect on the composite score, reducing the compositeby about three percentage points.Most of the tests used in WCPSS were designed for North Carolinaschools and, therefore, comparison to national norms is not possible.One test, however, taken by a large number of WCPSS students doesallow comparison with a national student population. The SAT is takenby more than 75 percent of WCPSS students and is primarily used bycolleges and universities in the admissions process. While the SATis not infl uenced by any specifi c curriculum, as is the case with bothEOG and EOC tests, which are based on the North Carolina StandardCourse of Study, the SAT does allow comparison with other students inthe state and nation who are considering going on to college. Figure 5below shows the performance over a long period of time of students inWCPSS, North Carolina and the United States. It will be observed thatthe average WCPSS student has always outscored the average NorthCarolina student and except for one year (1990), has outscored theaverage student in the nation.359 FY <strong>2007</strong>-<strong>08</strong> <strong>Plan</strong> for Student Success
Student AchievementFigure 5:SAT Performance Over Time110010501000950900WCPSSNCUSA8501990 1991 1992 1993 1994 1995 1996 1997 1998 1999 2000 2001 2002 2003 2004 2005 2006WCPSS 999 1007 1025 1031 1030 1039 1042 1047 1052 1059 1061 1054 1067 1067 1063 1075 1066NC 948 952 961 964 964 970 976 978 982 986 988 992 998 1001 1006 1010 10<strong>08</strong>USA 1001 999 1001 1003 1003 1010 1013 1016 1017 1016 1019 1020 1020 1026 1026 1028 1021360
Changes in Standards/ExpectationsSTATE INITIATIVESPre ABC's 1995-96 1996-97 1997-98 1998-99 1999-00 2000-01 2001-02General Assembly passes ABCs implementation High <strong>School</strong>s ABCs model Continued modification of MAY 2000 SBE approves EOC prediction formulas for SBE approved newABC's legislation. 10 school begins for schools w/K-8. implemented. Incentive high school model. Some using prediction formulas for 10 EOCs implemented, achievement levels insystems pilot the ABC's Model includes growth and bonuses paid to teachers in alternative schools added to 10 end-of-course tests bringing the highmathematics.performance. Assistance Expected or Exemplary ABCs.(bringing the K-8 and 9-12 school/elem-middle schoolteams formed. 1st ABCs Growth schools.models into alignment). An models into alignment.report submitted to Generalalternative AssessmentAssembly in August 1997.Portfolio for students withdisabilities was added.Prior to 1992, schools hadparticipated in CAT testingin selected grades.1992-1993 - First use ofEnd of Grade Tests inGrades 3-8.APRIL 1999 SBE approvesStudent AccountabilityStandards requiring thatstudents demonstrateproficiency at Grades 3, 5,8. Alternative <strong>School</strong>s wereadded to the model.Computer skills test atGrade 8 added toperformance composite.<strong>School</strong>s of Distinction wererequired to make at leastexpected growth.A course of study isrequired for entering 9thgraders.FEDERAL INITIATIVESJANUARY 2002 PresidentBush signs NCLB legislationinto law.WCPSS INITIATIVESThe PLC root - Serge's(1990) work on learningorganization in thecorporate world.1998 Summit: AchievingNew HorizonsGOAL 2003 95% ofstudents in 3-8 will be at orabove grade level.1998 <strong>Wake</strong> <strong>County</strong> Board of 2000 Summit: 2001 Summit: 2002 Summit:Education adopts Goal 2003 Getting It Right from the Taking Off the Mask - Investing in the GoalStartQuality, Confidence and Resources, Resolve andResults in <strong>Public</strong> Education. Quality <strong>Public</strong> <strong>School</strong>s1999 Summit: Readers toAchieversContinual Improvement anduse of data Demings PDSA(<strong>Plan</strong>, Do, Study, Act) CycleHord, Dufour, and Eaker(1998) used the termProfessional LearningCommunity361 FY <strong>2007</strong>-<strong>08</strong> <strong>Plan</strong> for Student Success
Changes in Standards/ExpectationsSTATE INITIATIVES2002-03 2003-04 2004-05 2005-06 2006-07 07-<strong>08</strong> to 09-10 10-11 to 12-13 2013-2014<strong>2007</strong> - 20<strong>08</strong> New standardsfor readingABCs 91-day rule waschanged to 90-days. 98%participated for elem/midschools was changed to95%. Provisions of NCLBwere added to the ABC'smodel. AYP became the"closing the gap"component. Honor <strong>School</strong>of Excellence category wasadded. US History waswithdrawn from the model.ELP used only for studentstransferring into a NC highschool.The SBE approvedincreasing the weight of thedropout component for 04-05. New rules were appliedfor alternative schools.Writing results in Grades 4,7, 10 were not included inABCs.Proficiency targets for AYP(under NCLB) increased.SBE approved new growthstandards and formulas forimplementation in 05-06.Reading results for 6thgrade were not included ingrowth calculations.Formulas for calculatinggrowth (expected and high)are new this year. Newstandards for math. USHistory and Civics andEconomics are againincluded along with 4th, 7th,and 10th grade. The MostSPRING <strong>2007</strong> Scienceassessments will be pilottested.End-of-GradeScience Assessments forGrades 5 & 8 must beimplemented to meet NCLBrequirements. (Scores willnot be part of AYPImproved <strong>School</strong> category is calculations.) New Coreremoved.Curriculum for HS isapproved.SPRING 2006 Scienceassessments were fieldtestedstate-wide.BEGINNING IN 06-07, newexit standards for 9thgraders. New standards inmath.AUGUST 2006 SBEapproves Guiding Missionand Five Goals New exitstandards for entering 9thgraders.20<strong>08</strong> - 2009 New CoreCourse of Study for High<strong>School</strong>s for entering 9thgraders.FEDERAL INITIATIVESSEPTEMBER <strong>2007</strong> NCLBwill be reauthorized.TARGETS TARGETS TARGETS TARGETS TARGETS(3-8) (3-8) (3-8) (3-8) (3-8)R- 76.7% R- 76.7% R- 84.4% R- 92.2% R-100%M- 65.8% M- 65.8% M-77.2% M- 88.6% M-100%TARGETS TARGETS TARGETS TARGETS TARGETS(10) (10) (10) (10) (10)R- 35.4% R- 35.4% R- 56.9% R - 78.4% R-100%M-70.8% M-70.8% M-80.5% M-90.2% M-100%June 2014 According toNCLB, every child inAmerica is proficient.WCPSS INITIATIVESNov. 5, 20032003 Summit:Many Voices, SmartBoard of Educationapproves Goal 20<strong>08</strong>JULY 2006Supt. Burns' 4 StrategicHigh Five Goal20<strong>08</strong> - 09Choices - Charting the2005 Summit:DirectivesFuture of the <strong>Public</strong> <strong>School</strong>sGOAL 20<strong>08</strong>95% of students (3-12) willbe at or above grade leveland demonstrate highgrowth.2001-06 NWREL andSERVE develop theprofessional learning teammodel.2004 Summit:<strong>Plan</strong>ning, Processes, andPossibilitiesAPRIL 20045 school systems and 5corporate sponsors createHIGH FIVE. Goal=100%Graduation by 2013Journey to 20<strong>08</strong> SuccessfulTeachers, SuccessfulStudentsPLCs become cornerstoneof 5 - year mission of HighFive to improve highschools.#1 Teaching and Learning#2 Retain, Recruit, andTrain#3 <strong>System</strong>s and Structures#4 Fiscal AccountabilitySpring <strong>2007</strong>:Science assessments willbe pilot tested.90% completing college,tech prep or collegeuniversity prep course ofstudy.80% meeting courserequirements for UNCsystem admission.2013High FiveGoal - 100% graduating.362
Historical Comparison of Revenues and Expenditures - Total BudgetREVENUES2002-2003 2003-2004 2004-2005 2005-2006 2006-<strong>2007</strong>State Sources $ 457,756,770 $ 487,442,493 $ 519,959,701 $ 574,011,181 $ 643,800,882Federal Sources 54,444,309 69,746,364 72,383,995 75,678,023 75,889,665Local Sources 704,181,785 721,977,521 860,804,112 879,859,273 1,201,909,902Total Operating Revenues 1,216,382,864 1,279,166,378 1,453,147,8<strong>08</strong> 1,529,548,477 1,921,600,449Fund Balance Appropriated 16,249,737 14,183,203 23,107,174 15,951,591 22,307,206Total Revenues $ 1,232,632,601 $ 1,293,349,581 $ 1,476,254,982 $ 1,545,500,068 $ 1,943,907,655EXPENDITURESInstructional ProgramsRegular Instructional $ 288,772,350 $ 311,880,919 $ 331,058,2<strong>08</strong> $ 354,075,768 $ 396,220,877Special Instructional 60,348,479 70,546,6<strong>08</strong> 78,725,452 84,770,270 94,054,947Adult Education Instructional 59,313Co-Curricular Instructional 243,930 248,572 296,255 326,769 374,729Remediation 27,139,737 17,210,305 18,059,562 18,309,054 20,411,958Voc Ed <strong>School</strong> Technology 750Student Services 44,471,377 50,911,121 53,238,356 56,647,829 63,414,434Other Instructional Programs 86,430,600 97,781,451 114,233,261 129,021,480 146,253,677$ 507,406,473 $ 548,578,976 $ 595,611,094 $ 643,151,170 $ 720,790,685Supporting ServicesPupil Support $ 1,025,697 $ 2,749,688 $ 2,475,361 $ 2,448,046 $ 2,270,531Instructional Staff Support 8,662,597 11,168,983 11,936,692 10,816,961 12,203,775Administrative Support 7,989,388 9,659,028 9,517,202 10,110,236 10,854,771<strong>School</strong> Administration Support 41,676,028 43,653,853 46,777,457 48,957,691 54,914,466Business Support 115,917,596 124,514,882 134,764,005 146,905,004 162,597,806Central Support 24,941,043 26,385,735 25,972,897 25,257,234 27,391,706Other Supporting Services 25,976,566 30,482,739 35,989,295 38,981,534 43,415,993$ 226,188,915 $ 248,614,9<strong>08</strong> $ 267,432,909 $ 283,476,706 $ 313,649,048Community ServicesRegular Community Services $ 9,929,359 $ 9,460,885 $ 10,028,111 $ 10,446,757 $ 9,856,<strong>08</strong>4Other Community Services 867,072 483,060 509,200 634,619 710,918$ 10,796,431 $ 9,943,945 $ 10,537,311 $ 11,<strong>08</strong>1,376 $ 10,567,002363 FY <strong>2007</strong>-<strong>08</strong> <strong>Plan</strong> for Student Success
Historical Comparison of Revenues and Expenditures - Total BudgetEXPENDITURES2002-2003 2003-2004 2004-2005 2005-2006 2006-<strong>2007</strong>Non-Programmed ChargesPay to Other Govtl. Units/Trans. $ 15,838,501 $ 20,738,<strong>08</strong>2 $ 19,233,901 $ 27,523,427 $ 21,760,2<strong>08</strong>Unbudgeted Funds 5,415,438 2,830,561 5,819,217 719,264 461,888Contingency Funds 2,238,862 0Sub-Total Non-Programmed Chgs. 21,253,939 23,568,643 25,053,118 30,481,553 22,222,096Total Operating Expenditures $ 765,645,758 $ 830,706,472 $ 898,634,432 $ 968,190,805 $ 1,067,228,831Capital OutlayCategory I Projects $ 435,515,494 $ 413,877,336 $ 512,561,976 $ 512,841,346 $ 770,465,907Category II Projects 29,828,734 41,948,996 52,287,050 51,816,891 96,183,494Category III Projects 1,642,615 6,816,777 5,689,051 10,513,649 5,738,700Contingency 7,<strong>08</strong>2,473 2,137,377 4,290,723Total Capital Outlay $ 466,986,843 $ 462,643,109 $ 577,620,550 $ 577,309,263 $ 876,678,824Total Expenditures $ 1,232,632,601 $ 1,293,349,581 $ 1,476,254,982 $ 1,545,500,068 $ 1,943,907,655364
Revenue by Source History - Operating Budget$800,000,000$700,000,000$600,000,000$500,000,000$400,000,000$300,000,000$200,000,000$100,000,000$002-03 03-04 04-05 05-06 06-07 07-<strong>08</strong>State <strong>County</strong> Appropriation Federal Local * Fund BalanceOperating BudgetRevenue by Source History2002-03 2003-04 2004-05 2005-06 2006-07 <strong>2007</strong>-<strong>08</strong>State $447,239,819 $476,507,999 $519,959,701 $574,011,181 $643,800,882 $699,263,727<strong>County</strong> Appropriation 203,000,000 223,700,000 236,405,000 254,376,000 275,827,000 300,744,100Federal 54,444,309 69,746,364 72,383,995 75,678,023 75,889,665 75,814,184Local* 49,398,809 55,756,661 56,005,006 70,940,105 58,291,358 63,291,498Fund Balance 16,249,737 14,183,203 23,107,174 15,951,591 22,307,206 17,730,668Total $770,332,674 $839,894,227 $907,860,876 $990,956,900 $1,076,116,111 $1,156,844,177*Local revenues include fi nes and forfeitures, indirect cost, interest earned on investments, E Rate, tuition and parking fees, print shop, systemwidevending contract, cellular lease, and categorical programs.365 FY <strong>2007</strong>-<strong>08</strong> <strong>Plan</strong> for Student Success
Budget by Object Code - Operating Budget HistoryObject means the service or commodity obtained as a result of a specifi c expenditure. Seven major object categories are used inour Chart of Accounts: (1) Salaries, (2) Employee Benefi ts, (3) Purchased Services, (4) Supplies and Materials, (5) Capital Outlay,(6) Other Objects, and (7) Transfers. These broad categories are subdivided to obtain more detailed information about objects ofexpenditure. the Uniform Chart of Accounts structure, in accordance with state law, determines which object codes are availablefor use.FY 2003-04 FY 2004-05 FY 2005-06 FY 2006-07Object Code Total Total Total TotalSalariesBoard Member Fees $114,618 $116,407 $120,778 $125,6<strong>08</strong>Superintendent $113,988 $117,4<strong>08</strong> $119,394 $128,214Chief Officer $344,004 $344,004 $271,252 $549,394Director and/or Supervisor $15,170,879 $16,445,154 $16,844,382 $18,711,669Classified Principal $8,915,468 $9,380,715 $9,669,837 $10,830,616Finance Officer $88,050 $88,693 $88,728 $93,612Assistant Principal $11,142,370 $12,055,481 $12,258,230 $13,841,848Asst. and Area Superintendents $1,016,495 $1,019,687 $1,055,037 $1,013,976Other Admin. Assignment $902,687 $586,367 $896,262 $758,504Supplementary Pay $5,829,138 $6,029,784 $7,<strong>08</strong>0,432 $7,135,730Bonus Pay $1,027,<strong>08</strong>7 $439,006 $469,588 $336,492Salary Differential $0 $194,600 $0 $0Administration $44,664,784 $46,817,306 $48,873,920 $53,525,6635% 5% 5% 5%Teacher $281,441,141 $297,885,915 $324,122,649 $365,091,448Teacher - Other $359,364 $341,798 $378,247 $399,403Speech Pathology/Speech andLanguage Services Teacher $4,698,093 $4,974,570 $5,240,503 $5,995,536New Teacher Orientation $143,347 $113,212 $207,720 $188,761Extended Contract Days $0 $652,813 $128,967 $294,761Interim Teacher - Non Certified $185,<strong>08</strong>4 $156,220 $50,294 $210,580Retired Teacher - Not Earnings Cap $1,838,467 $3,987,232 $4,098,461 $4,842,864Other Prof. Educator Assignments $3,849,254 $3,404,057 $2,203,841 $2,049,098Supplementary Pay $44,277,124 $47,166,195 $49,858,564 $58,749,098Substitute Pay $5,573,213 $6,154,716 $6,828,109 $7,841,227Bonus Pay $12,217,636 $9,188,157 $10,183,500 $8,246,240Workshop Participant $624,102 $471,548 $205,005 $225,361Mentor Pay $684,910 $744,621 $862,609 $891,781Other Assignments $4,816,760 $4,075,735 $5,254,506 $7,176,033Professional Educator $360,7<strong>08</strong>,495 $379,316,789 $409,622,975 $462,202,19143% 38% 41% 43%Other Professional Assignments $16,059,937 $15,705,313 $16,488,966 $18,451,841Bonus Pay $105,3<strong>08</strong> $167,462 $176,460 $75,800Professional - Other $16,165,245 $15,872,775 $16,665,426 $18,527,6412% 2% 2% 2%366
Budget by Object Code - Operating Budget HistoryFY 2003-04 FY 2004-05 FY 2005-06 FY 2006-07Object Code Total Total Total TotalSalariesAudiovisual Materials Coordinator $150,109 $160,870 $139,079 $150,451Teacher Assistant $31,571,219 $34,906,540 $37,854,277 $42,126,648Tutor $1,121,075 $1,321,190 $1,611,107 $1,652,117Therapist $1,439,<strong>08</strong>6 $1,887,135 $2,1<strong>08</strong>,598 $2,313,236Teacher Asst. Sal. when Subst. $310,612 $656,864 $778,400 $1,415,838Technology Assistant $2,254,909 $2,420,878 $1,005,900 $1,126,386Other Prof. Assign. - Noncert. $1,877,735 $1,851,193 $3,286,400 $3,735,686Other Technical Assignment $3,009,548 $2,939,429 $4,064,113 $4,299,443Technical $41,734,293 $46,144,099 $50,847,874 $56,819,8055% 5% 5% 5%Office Personnel $22,272,563 $24,163,431 $24,779,574 $27,686,506Other Office/Clerical Assignment $255,910 $252,415 $244,754 $288,707Office/Clerical $22,528,473 $24,415,846 $25,024,328 $27,975,2133% 2% 3% 3%Transportation Personnel $2,303,945 $2,411,916 $3,377,425 $3,778,605Other Crafts & Trade Assignments $5,1<strong>08</strong>,665 $5,597,509 $5,865,219 $6,836,454Crafts/Trades $7,412,610 $8,009,425 $9,242,644 $10,615,0591% 1% 1% 1%Driver $12,809,117 $14,090,480 $13,824,256 $16,165,650Substitute Driver $1,446,664 $1,593,216 $1,679,344 $1,041,230Custodian $9,735,985 $10,492,232 $11,0<strong>08</strong>,024 $11,748,456Child Nutrition Employees $5,560,630 $5,358,287 $5,205,922 $5,799,688Warehouse Person $253,237 $270,567 $278,452 $286,116Manager $4,561,134 $5,519,040 $5,921,360 $6,272,740Work Study Student $47,001 $20,632 $4,685 $10,252Cashier $175,936 $96,802 $76,231 $81,445Longevity Pay $7,324,757 $7,410,333 $8,033,325 $10,248,005Overtime Pay $2,259,728 $2,411,947 $2,182,321 $2,609,015Bonus Pay $1,221,030 $19,102 $77,842 $218,373Bonus Leave $440,850 $471,222 $576,694 $491,349Workshop Participant $197,022 $253,129 $245,827 $171,326Salary Differential $0 $780,000 $1,014,704 $982,474367 FY <strong>2007</strong>-<strong>08</strong> <strong>Plan</strong> for Student Success
Budget by Object Code - Operating Budget HistoryFY 2003-04 FY 2004-05 FY 2005-06 FY 2006-07Object Code Total Total Total TotalSalariesAnnual Leave $2,169,384 $2,575,459 $2,385,<strong>08</strong>8 $3,329,280Short Term Disability $446,724 $343,907 $314,924 $394,278Short Term Dis. Beyond 6 Mos. $74,969 $71,223 $211,438 $105,273Other Assignments $1,328,533 $2,736,902 $1,630,418 $1,848,213Other $50,052,701 $54,514,480 $54,670,855 $61,803,1636% 6% 5% 6%Salaries $543,266,601 $575,090,720 $614,948,022 $691,468,73565% 58% 62% 64%Employee BenefitsEmployer's Social Security $41,282,177 $43,648,981 $46,452,748 $52,174,646Employer's Retirement $17,998,014 $32,513,978 $40,598,078 $47,851,129Retired - Reemployed $0 $439,659 $443,944 $552,350Employer's Hospitalization Ins. $44,752,094 $48,238,363 $54,355,634 $57,474,575Employer's Workers' Comp. Ins. $900,795 $1,797,423 $1,394,675 $1,640,795Employer's Unemployment Ins. $128,378 $180,377 $174,355 $176,397Employer's Dental Insurance $3,299,792 $3,219,377 $3,233,170 $3,396,072Employee Benefits $1<strong>08</strong>,361,250 $130,038,158 $146,652,604 $163,265,96413% 13% 15% 15%Salaries and Employee BenefitsSalaries and Employee Benefits $651,627,851 $705,128,878 $761,600,626 $854,734,69978% 71% 77% 79%Nonpersonnel CostsContracted Services $48,824,847 $50,326,127 $51,350,656 $57,879,714Other Professional and $0 $0 $0 $41,098Technical ServicesWorkshop Exp./Allowable Travel $3,978,773 $3,612,916 $4,198,910 $5,342,954<strong>Public</strong> Utilities - Electric $13,282,891 $14,543,443 $15,880,882 $17,186,471<strong>Public</strong> Utilities - Natural Gas $2,592,696 $3,074,198 $3,465,668 $3,997,070<strong>Public</strong> Utilities - Other $2,334,191 $2,904,451 $2,879,441 $3,163,950368
Budget by Object Code - Operating Budget HistoryFY 2003-04 FY 2004-05 FY 2005-06 FY 2006-07Object Code Total Total Total TotalNonpersonnel CostsTravel $1,718,559 $1,554,118 $1,213,513 $1,179,652Telephone $1,672,235 $1,620,620 $1,810,455 $2,346,682Postage $300,197 $294,296 $181,739 $290,891Advertising Fees $125,397 $175,990 $87,209 $123,933Reproduction Costs $1,434,485 $1,150,186 $1,155,678 $1,373,262Tuition Fees $92,696 $122,500 $67,628 $69,868Employee Ed. Reimbursement $279,900 $372,425 $282,882 $278,271Field Trips $178,807 $134,745 $144,624 $251,991Special Pymts to Eckerd Camps $0 $164,519 $60,000 $0Purchased Services $85,370,170 $90,846,633 $95,516,845 $106,694,83510% 9% 10% 10%Instructional Supplies $26,061,852 $28,323,454 $26,045,603 $26,701,532Supplies and Materials $17,372,519 $15,773,928 $14,870,229 $13,066,510Fuel for Facilities $1<strong>08</strong>,753 $102,511 $182,0<strong>08</strong> $174,272Oil $66,903 $82,162 $95,269 $146,741Tires and Tubes $743,945 $551,196 $660,883 $738,659Repair Parts, Materials and Related $310,184 $1,732,300Labor, Grease and Anti-FreezeGas/Diesel Fuel $2,325,386 $3,400,450 $5,109,121 $5,748,064Other Supplies $950,000 $1,431,622 $2,157,664 $2,145,394State Textbooks $8,795,438 $12,910,879 $14,129,079 $14,038,355Other Textbooks $21,454 $28,635 $86,660 $50,769On-line Materials/Subscriptions $0 $0 $226,489 $278,974Food Purchase $10,006,277 $11,988,095 $13,484,271 $14,866,559Other Food Purchases $18,467 $16,200 $11,649 $21,300Lease/Purchase of Non- $0 $0 $0 $42,278Capitalized EquipmentSupplies and Materials $66,470,994 $74,609,132 $77,369,109 $79,751,7078% 8% 8% 7%Purchase of New Sites $16,250 $0 $0 $0General Contract $3,711,442 $5,<strong>08</strong>2,182 $13,891,<strong>08</strong>8 $4,419,713Electrical Contract $251,293 $111,672 $5,000 $5,000Architects Fees $440,061 $996,049 $528,378 $806,734Misc. Contracts & Other Charges $3<strong>08</strong>,290 $411,257 $1,306,525 $1,749,798Purchase of Equipment $2,139,149 $1,092,880 $3,697,221 $2,207,388Purchase of Vehicles $7,101,991 $5,993,592 $8,787,015 $5,9<strong>08</strong>,176Capital Outlay $13,968,476 $13,687,632 $28,215,227 $15,096,8092% 1% 3% 2%369 FY <strong>2007</strong>-<strong>08</strong> <strong>Plan</strong> for Student Success
Budget by Object Code - Operating Budget HistoryFY 2003-04 FY 2004-05 FY 2005-06 FY 2006-07Object Code Total Total Total TotalNonpersonnel CostsMembership Dues and Fees $109,917 $103,403 $149,958 $187,168Bank Service Fees $0 $36,988 $36,488 $37,388Liability Insurance $788,333 $866,241 $937,863 $860,539Vehicle Liability Insurance $220,500 $295,291 $262,743 $267,159Property Insurance $657,650 $844,739 $924,848 $925,074Fidelity Bond Premium $6,000 $3,100 $2,661 $2,794Scholastic Accident Insurance $68,800 $77,600 $86,875 $95,725Other Insurance and Judgements $1,250 $0 $13,521 $16,510License and Title Fees $117,263 $73,6<strong>08</strong> $29,831 $97,982Indirect Cost $6,190,000 $7,039,875 $6,976,929 $6,790,290Miscellaneous $2,692,154 $5,819,217 $2,958,094 $461,887Other $10,851,867 $15,160,062 $12,379,812 $9,742,5161% 2% 1% 1%Transfer to Local Current Expense $321,292 $264,568 $0 $13,455Transfer to Capital Outlay Fund $3,881,076 $289,429 $6,837,615 $375,699Transfers to the Trust and AgencyFunds $0 $0 $20,000 $73,747Transfers to Charter <strong>School</strong>s $7,402,503 $7,874,538 $9,017,666 $9,632,644Fund Transfers $11,604,871 $8,428,535 $15,875,281 $10,095,5451% 1% 2% 1%TOTAL $839,894,229 $907,860,872 $990,956,900 $1,076,116,111100% 100% 100% 100%370
Staff HistoryThe Staff History shows months of employment that are budgeted. Position control and allotments are managed in terms of months rather than positions. <strong>Wake</strong><strong>County</strong> <strong>Public</strong> <strong>School</strong> <strong>System</strong> has employees on 9, 10, 11, and 12 month contract basis. <strong>School</strong>s may process conversions from one type of position to anotherwithin ABC Transfer Policies. These conversions are for a one-year period only. The effects of the conversions have been removed from the data in this chart. Toget a rough estimate of full-time equivalent (FTE) positions divide total month of employment by 10. This will not be completely accurate because our employeeshave different contract lenghts of 9, 10, 11, or 12 months.2003-04 2004-2005 2005-2006 2006-<strong>2007</strong> <strong>2007</strong>-20<strong>08</strong>Total Total Total Total TotalAdministrationSuperintendent 12.00 12.00 12.00 12.00 12.00Chief Officer 48.00 48.00 36.00 72.00 72.00Director/Supervisor 2,852.05 3,018.60 3,<strong>08</strong>4.60 3,276.60 3,288.60Principals 1,510.50 1,590.00 1,656.00 1,782.50 1,851.00Finance Officer 12.00 12.00 12.00 12.00 12.00Assistant Principals 2,441.00 2,577.70 2,567.50 2,744.80 2,949.80Assistant Superintendent 144.00 144.00 144.00 132.00 132.00Other Administrative Assign. 200.00 198.00 279.00 201.00 201.007,219.55 7,600.30 7,791.10 8,232.90 8,518.40Professional EducatorTeachers 72,789.70 77,606.70 81,889.87 87,277.71 93,411.39Media Specialists 1,9<strong>08</strong>.00 1,959.00 2,073.00 2,115.00 2,192.00Counselors 2,619.50 2,792.50 2,928.00 3,114.96 3,356.96Teacher - ROTC/Lead Summer 42.50 42.50 42.50 42.50 42.50Teacher - Speech/Pathology 1,041.50 1,164.20 1,215.50 1,326.40 1,470.40Extended Contract Days 1.00 2.50 2.50Interim Teacher - Noncert. 40.00 96.00 96.00Retired Teacher - Not Earning Cap 331.50 675.50 658.75 811.00 811.00Other Professional Ed. Assign. 988.50 877.50 618.50 544.50 495.0079,721.20 85,117.90 89,467.12 95,330.57 101,877.75Professional - OtherOther Professional Assign. 2,131.20 2,166.00 2,3<strong>08</strong>.70 2,285.87 2,290.87Psychologists 729.55 794.70 845.30 890.90 969.90Social Workers 541.50 569.50 618.00 634.00 697.663,402.25 3,530.20 3,772.00 3,810.77 3,958.43TechnicalAV (Audiovisual) Mat. Coord. 72.00 84.00 72.00 72.00 72.00Teacher Assistants 19,877.00 21,561.00 23,190.00 24,662.30 26,414.30Therapists 310.00 444.75 500.75 522.75 570.75371 FY <strong>2007</strong>-<strong>08</strong> <strong>Plan</strong> for Student Success
Staff History2003-04 2004-2005 2005-2006 2006-<strong>2007</strong> <strong>2007</strong>-20<strong>08</strong>Total Total Total Total TotalTechnology Assistants 524.<strong>08</strong> 534.50 515.00 167.04 155.00Other Prof. Assign. Noncert. 663.00 654.00 638.00 1,032.00 1,056.00Other Technical Assignment 804.40 848.20 1,063.20 1,216.20 1,216.2022,250.48 24,126.45 25,978.95 27,672.29 29,484.25Office/ClericalOffice Personnel 10,459.76 10,978.76 11,305.76 11,916.26 12,482.26Other Office/Clerical Assign. 66.00 66.00 66.00 82.00 82.0010,525.76 11,044.76 11,371.76 11,998.26 12,564.26Crafts/TradesTransportation Personnel 972.00 972.00 1,440.00 1,428.00 1,536.00Other Crafts and Trade Assign. 2,648.00 2,654.00 2,766.00 2,882.00 2,950.003,620.00 3,626.00 4,206.00 4,310.00 4,486.00OthersDrivers 8,210.50 8,602.50 8,072.70 8,567.26 9,313.26Subsitute Drivers 1,107.10 1,107.10 859.76 465.80 765.80Custodians 5,754.00 6,028.00 6,1<strong>08</strong>.00 6,132.00 6,132.00Child Nutrition Employees 4,384.60 4,205.40 4,381.90 4,645.20 4,799.20Warehouse Personnel 114.00 114.00 1<strong>08</strong>.00 126.00 126.00Managers 1,909.00 2,<strong>08</strong>9.00 2,137.00 2,133.00 2,301.00Cashiers 63.80 38.80 38.80 33.80 33.80Other Assignments 814.09 914.59 1,006.49 1,127.49 1,257.4922,357.09 23,099.39 22,712.65 23,230.55 24,728.55Total 149,096.33 158,145.00 165,299.58 174,585.34 185,617.64<strong>School</strong> - Based Months<strong>School</strong>-Based Allocations 133,802.98 142,068.65 148,367.18 157,106.32 167,661.62Centrally Allocated Positions Based in <strong>School</strong>sStudent Support 2,776.25 3,119.00 3,485.75 2,967.15 3,104.15Maintenance and Operations 2,352.00 2,424.00 2,496.00 2,544.00 2,544.00Operational Services 721.09 793.59 977.22 983.22Curriculum and Instruction 469.50 436.60 631.00 384.00 384.00Technology 395.00 384.00 384.00 72.00 72.00372
Staff History2003-04 2004-2005 2005-2006 2006-<strong>2007</strong> <strong>2007</strong>-20<strong>08</strong>Total Total Total Total Total<strong>School</strong> - Based MonthsAuxiliary Services 232.00 222.00 1,124.49 1,278.49 1,432.49Human Resources 34.00 46.00 48.00 58.00 58.00Instructional Services 14.00 96.00 66.006,993.84 7,521.19 8,235.24 8,280.86 8,577.86140,796.82 149,589.84 156,602.42 165,387.18 176,239.4894% 95% 95% 95% 95%Centrally Located MonthsGrowth and <strong>Plan</strong>ning 228.00 264.00 264.00Operational Services 1,545.00 1,593.00Administrative Services 1,159.56 1,171.56 1,363.56 1,285.56 1,309.56Human Resources 894.00 902.00 868.00 887.00 911.00Student Services 891.00 9<strong>08</strong>.00 889.00 879.00 879.00Curriculum and Instruction 671.20 728.60 791.00 1,112.60 1,<strong>08</strong>8.60Facilities 576.00 600.00 588.00 660.00 660.00Technology 624.00 624.00 672.00 684.00 684.00Auxiliary Services 468.00 504.00 1,542.00 1,650.00 1,782.00Maintenance & Operations 414.00 420.00 432.00 444.00 456.00Area Superintendents 156.00 204.00 204.00Instructional Services 252.00 264.00 273.60Communications 474.00 486.00Superintendent's Office 354.00 552.00 774.00 354.00 354.00Evaluation and Research 294.75 288.00 276.00 300.00 300.00Positions to be determined8,299.51 8,555.16 8,697.16 9,198.16 9,378.166% 5% 5% 5% 5%Total Months149,096.33 158,145.00 165,299.58 174,585.34 185,617.64373 FY <strong>2007</strong>-<strong>08</strong> <strong>Plan</strong> for Student Success
Historical Comparison of Expenditures Per Pupil (excluding Child Nutrition)The data in the following tables comes from the Statistical Profi lepublished annually by the NC Department of <strong>Public</strong> Instruction.The total expenditures for a school year are grouped into two majorcategories:Current expense expenditures are all expenditures connected withthe daily operation of the more than two thousand schools of thestate.Capital expense expenditures consist of all disbursements madefor the construction of new building and grounds, reconstructionor repair of old buildings, and the acquisition of equipment with alifetime greater than a year.The amount of capital expense expenditures fl uctuates considerablyfrom year to year. The current expense expenditures on the other hand,being closely tied to the number of students, are more stable. All derivedstatistics are computed for current expense expenditures only. This isespecially true for statistics that can be meaningfully compared overseveral years.The Annual Financial Report <strong>System</strong> contains the current expenseexpenditures obtained from fi nancial records submitted during theyear, and electronic records obtained from the Local Education Agency(LEA) fi les at the close of each fi scal year. Although the contents of thelatter transmission are not audited, they are an accurate accounting ofrevenues and expenditures by each LEA for the preceding fi scal year.By legislative mandate, long-term debts of school systems (debt service)are a part of the county budget and controlled by the commissioners ofthe 100 counties and, therefore, not reported on the Annual FinancialReport <strong>System</strong>. The report contains all current expenditures for publickindergartens, elementary and secondary schools, and special schools forexceptional children. However, expenditures for the Governor Morehead<strong>School</strong> for the Blind, the North Carolina <strong>School</strong>s for the Deaf, the FortBragg and Camp Lejeune military base schools, and the Cherokee Indianreservation schools are not included.by using fi nal average daily membership (ADM). Other publications,especially those from national sources, use average daily attendance(ADA) in computing this statistic. Since average daily membership isgreater than average daily attendance, the latter method yields a higherfi gure for the per pupil expenditures. The average daily attendancefi gures in other sections of the Profi le can be used to convert per pupilexpenditure fi gures contained in this section to ones based on averagedaily attendance.The expenditure data contained in this section has three distinct fundingsources. The fi rst two, state and federal, are the amounts spent foreducation from the budgets of state and federal governments respectively.The local expenditures, on the other hand, are not synonymous withthe amounts expended by local county governments. All expendituresnot funded by the state or the federal governments are regarded aslocal expenditures. As such, they include all funds supplied from localgovernments and other local sources.Both tables exclude all expenditures connected with child nutritionactivities. Since the expenditures students make in purchasing theirlunches are not funded by the state or federal governments, they areregarded as part of the local expenditures. In some contexts, however,there is a need to bring the local expenditures as close to the amountsspent by local governments as possible. These tables are designed torespond to that need.One derived statistic, per pupil expenditure, is of special interest sinceit is quoted and compared most often. In the tables of this section, it iscomputed only for current expense expenditures (excluding communityservices, Head Start, adult education, and inter/intra fund transfers)374
Historical Comparison of Expenditures Per Pupil (excluding Child Nutrition)NC<strong>Wake</strong> <strong>County</strong> <strong>Public</strong> <strong>School</strong> <strong>System</strong>YearAverage DailyMembershipNumberNumberofof ADMDistrictsPer Pupil Expenditures (excluding child nutrition)State Federal Local Total Capital OutlayCurrent Expense <strong>County</strong>Appropriation and Suppl. TaxesRank Amt Rank Amt Rank Amt Rank Amt Rank Amt Rank Amt PPA Rank2005-06 115 120,367 2 4,574 109 414 101 2,119 16 7,1<strong>08</strong> 70 1,574 6 242,329,212 2,013 122004-05 115 113,547 2 4,411 106 386 101 2,179 12 6,976 67 1,401 8 225,888,602 1,989 112003-04 117 1<strong>08</strong>,396 2 4,249 114 367 105 2,106 12 6,722 63 1,480 9 211,743,544 1,953 112002-03 117 103,921 2 4,217 111 313 106 2,018 11 6,548 55 1,561 11 192,951,139 1,857 112001-02 117 100,373 2 4,220 1<strong>08</strong> 309 90 2,053 10 6,582 52 1,539 7 190,046,984 1,893 102000-01 117 97,348 2 4,312 106 261 98 1,905 11 6,478 57 1,542 4 175,765,293 1,806 91999-00 117 94,295 2 4,079 111 219 106 1,685 12 5,983 60 1,544 5 143,583,772 1,523 151998-99 117 91,121 2 3,894 1<strong>08</strong> 173 109 1,567 13 5,634 59 1,419 6 131,358,036 1,442 151997-98 117 88,511 2 3,533 115 167 107 1,384 14 5,<strong>08</strong>4 73 1,153 5 115,242,792 1,302 151996-97 117 84,856 2 3,307 114 144 110 1,259 15 4,710 79 911 7 103,589,477 1,221 151995-96 119 80,646 2 3,166 118 138 114 1,217 14 4,521 78 810 12 99,491,130 1,234 131994-95 119 76,273 2 3,125 118 133 117 1,220 12 4,478 75 781 14 95,019,404 1,246 101993-94 121 72,643 2 2,944 119 155 115 1,274 10 4,373 63 742 19 87,228,319 1,201 101992-93 129 69,547 2 2,828 127 131 127 1,321 13 4,280 56 838 12 82,344,300 1,184 101991-92 133 66,343 2 2,748 132 119 128 1,249 11 4,116 49 873 7 77,963,448 1,175 13<strong>Wake</strong> <strong>County</strong> <strong>Public</strong> <strong>School</strong> <strong>System</strong> fell below the state average in state and federal expenditures:2005-06 EXPENDITURE PER PUPILSource of funds: WCPSSStateAverageDifferenceState 4,574 4,900 (326)Federal 414 579 (165)Local 2,119 1,693 426Total 6,976 7,172 (196)<strong>Wake</strong> <strong>County</strong> <strong>Public</strong> <strong>School</strong>s (WCPSS) average daily membership(ADM) for 2006-07 is 128,072; a gain of 7,705 students from the2005-06 year.There are 115 school districts in North Carolina. Our one-year gainwas more than 66 of those districts.375 FY <strong>2007</strong>-<strong>08</strong> <strong>Plan</strong> for Student Success
Historical Comparison of Expenditures Per Pupil (excluding Child Nutrition)2005-2006 DATAPer Pupil Expenditures (excluding child nutrition)UnitAverage DailyMembershipState Federal Local Total Capital OutlayNumber of ADM Rank Amt Rank Amt Rank Amt Rank Amt Rank Amt RankMecklenburg 122,261 1 4,615 106 485 89 2,392 8 7,492 59 1,309 9WAKE 120,367 2 4,574 109 414 101 2,119 16 7,1<strong>08</strong> 70 1,574 6Guilford 68,118 3 4,616 105 532 81 2,294 12 7,443 61 1,112 12Cumberland 51,886 4 4,739 99 788 35 1,333 60 6860 87 324 75Forsyth 49,237 5 4,813 91 489 88 2,257 13 7,560 53 744 25Gaston 31,793 6 4,564 110 468 93 1,253 75 6,258 111 333 73Union 31,330 7 4,320 115 344 110 1,695 31 6,359 1<strong>08</strong> 1,793 3Durham 30,883 8 4,883 85 621 54 2,747 5 8,251 26 586 41Johnston 27,433 9 4,746 96 400 104 1,6<strong>08</strong> 35 6,754 95 1,402 7Buncombe 25,236 10 4,800 93 529 82 1,741 29 7,070 74 718 31Hyde 627 114 10,565 1 1,095 14 2,630 6 14,290 1 898 17Tyrrell 616 115 10,263 2 994 23 1,173 82 12,431 2 201 102Jones 1,317 109 7,622 3 1,217 7 945 101 9,838 5 362 70Pamlico 1,574 107 7,159 4 770 37 1,317 63 9,247 7 488 55Alleghany 1,520 1<strong>08</strong> 7,091 5 706 45 1,281 69 9,079 10 470 58Graham 1,216 112 7,017 6 1,230 10 664 115 8,912 12 542 49Clay 1,314 110 6,803 7 582 66 973 99 8,358 23 483 56Washington 2,140 101 6,799 8 1,563 2 1,422 50 9,785 6 159 110Swain 1,816 103 6,566 9 1,239 9 993 97 8,798 15 556 44Gates 2,003 102 6,522 10 431 99 1,282 67 8,236 28 307 80State Total 1,363,695 763Total Number of Units = 115NOTE: The latest information released by the North Carolina Department of <strong>Public</strong> Instruction on the per pupil expenditures for all districts is as of FY 2004-05376
Tax DataAs reported in The North Carolina Association of <strong>County</strong> Commissioners web site www.ncacc.org/taxrate.htmCounties with the Largest <strong>School</strong> Districts in North CarolinaCounties in North Carolina that Surround <strong>Wake</strong> <strong>County</strong><strong>County</strong>Tax Rate2006-<strong>2007</strong>Tax Rate2005-2006Tax Rate2004-2005Tax Rate2003-2004<strong>County</strong>Tax Rate2006-<strong>2007</strong>Tax Rate2005-2006Tax Rate2004-2005Tax Rate2003-2004Cumberland $0.8800 $0.8800 $0.8800 $0.8800Mecklenburg $0.8189 $0.8368 $0.7567 $0.7364Forsyth $0.6660 $0.6660 $0.7<strong>08</strong>0 $0.6920Guilford $0.6615 $0.6428 $0.6184 $0.7135<strong>Wake</strong> $0.6340 $0.6040 $0.6040 $0.6040Durham $0.8090 $0.8090 $0.7900 $0.7630Franklin $0.7900 $0.7900 $0.7900 $0.9995Johnston $0.7800 $0.7800 $0.7800 $0.7800Chatham $0.5970 $0.5970 $0.6464 $0.6464Vance $0.9200 $0.9200 $0.9000 $0.9000Granville $0.7000 $0.7000 $0.6350 $0.6350Harnett $0.7350 $0.7350 $0.7350 $0.7350<strong>Wake</strong> $0.6340 $0.6040 $0.6040 $0.6040As reported in the <strong>Wake</strong> <strong>County</strong>, North Carolina, Comprehensive Annual Financial Report for the year ended June 30, 2006.WAKE COUNTYHistorical Comparison of Assessed Value of Taxable PropertyFiscal Year Ended June 30 Real Property Personal Property<strong>Public</strong> ServiceCompaniesTotal AssessedValue (1)<strong>County</strong>-wide TaxRate (3)Special TaxDistricts TaxRate (3)Average <strong>County</strong>Tax Rate (3)2006 $59,677,957,346 $12,<strong>08</strong>4,539,414 $3,405,223,801 $75,134,720,561 $0.604 $0.10 $0.7342005 56,733,3<strong>08</strong>,581 10,954,988,975 3,436,614,540 71,124,912,096 0.604 0.10 0.7042004 54,347,709,322 10,601,740,204 3,477,604,369 68,427,053,895 0.604 0.10 0.704Note:(1)All taxable property is subject to the county-wide tax. Most property in unincorporated areas is subject to special district taxes. The <strong>County</strong>’s property tax is levied each July 1 onthe assessed value listed as of the prior January 1 for all real and personal property located in the <strong>County</strong> except for certain registered motor vehicles which are assessed anc collectedthroughout the year. Assessed valuations are established by the Board of <strong>County</strong> Commissioners at 100% of estimated market value for real property and 100% of actual value forpersonal property. <strong>Public</strong> service company property is certified by the State of North Carolina at 100% of actual value, with no distinction between real and personal property values.(2)A revaluation of real property is required by N.C. General Statutes at least every eight years. The last revaluation was completed for the tax year 2000.(3)Per $1,000 of value.377 FY <strong>2007</strong>-<strong>08</strong> <strong>Plan</strong> for Student Success
Tax DataWAKE COUNTYHistorical Comparison of Property Tax Levies and CollectionsCollected within the Fiscal Yearof the LevyTotal Collections to DateFiscal Year Ended June 30Taxes Levied forthe Fiscal Year(Original Levy)AdjustmentsTotal AdjustedLevyAmountPercentage ofOriginal LevyCollections inSubsequentYearsAmountPercentage ofAdjusted Levy2006 $471,423,336 ($4,606,253) $466,817,<strong>08</strong>3 $461,233,986 98.80% $ 0 $461,233,986 98.80%2005 447,296,073 (2,915,368) 444,380,705 439,305,034 98.86% 3,613,538 442,918,572 99.67%2004 429,1<strong>08</strong>,412 (2,841,221) 426,267,191 421,511,979 98.88% 3,693,636 425,205,615 99.75%378
Tax DataWAKE COUNTYHistorical Comparison of Property Tax Rates - All OverlappingGovernments(4)Includes countywide and City of Raleigh tax rates.(5)Includes countywide and special district tax, which is considered to berepresentative of unincorporated areas.(Per $100 of Assessed Value)Taxes Levied by <strong>Wake</strong> <strong>County</strong> (1)Year Ended June 30 2006 2005 2004 2003<strong>County</strong>-Wide Rate .634 $.604 $.604 $.604Various Special Taxes .100 .100 .100 .100Average <strong>County</strong> Rate .734 .704 .704 .704Direct and Overlapping Taxes Levided by Municipalities (2)Town of Apex .400 .400 .400 .400Town of Cary .420 .420 .420 .420Town of Fuquay-Varina .520 .520 .520 .520Town of Garner .575 .560 .560 .560Town of Holly Springs .530 .530 .530 .530Town of Knightdale .500 .500 .500 .480Town of Morrisville .468 .468 .470 .470City of Raleigh .435 .395 .395 .385Town of Rolesville .485 .485 .485 .485Town of <strong>Wake</strong> Forest .540 .540 .540 .530Town of Wendell .540 .540 .540 .540Town of Zebulon .500 .490 .480 .480Typical Combined Tax RatesTown of Apex (3) 1.034 1.004 1.004 1.004City of Raleigh (4) 1.069 .999 .999 .989Unicorporated Areas of <strong>Wake</strong><strong>County</strong> (5)Note:.734 .704 .704 .704(1)All tangible property is subject to the county-wide tax. Most property inunincorporated areas is also subject to one of twenty-two special district taxes.(2)Overlapping debt does not include the debt of the Special Airport District ofDurham and <strong>Wake</strong> Counties and <strong>Wake</strong> <strong>County</strong> Hospital system, as these bonds arepaid from these units using airport/hospital revenues.(3)Includes countywide and Town of Apex tax rates.379 FY <strong>2007</strong>-<strong>08</strong> <strong>Plan</strong> for Student Success
Tax DataTen Principal Taxpayers for <strong>Wake</strong> <strong>County</strong>(Year Ended June 30, 2005)FIRMTYPE OFENTERPRISE2006 ASSESSEDVALUATIONPERCENTAGEOF TOTALASSESSEDVALUATION*TAX LEVYProgress EnergyCarolinas, Inc.Utility $2,077,332,906 2.76% $12,547,091Cisco <strong>System</strong>s, Inc. Software 395,<strong>08</strong>2,096 .53 2,386,296SAS Institute, Inc. Software 365,<strong>08</strong>2,380 .49 2,205,098Bellsouth Tel Co Utility 325,2<strong>08</strong>,533 .43 1,964,260NC EasternMunicipal PowerAgencyUtility 299,213,133 .40 1,807,247Weeks Realty LP Real Estate 268,665,884 .36 1,622,742Highwood RealtyLimited PartnershipReal Estate 185,964,692 .25 1,123,227CVM Holdings LLC Real Estate 173,<strong>08</strong>5,658 .23 1,045,437<strong>Public</strong> Service Co ofNC Inc.Summit PropertiesPartnership LPUtility 158,859,070 .21 959,509Real Estate 144,168,044 .19 870,775$4,392,662,396 5.85% $26,531,682* Includes county property tax and late list penalty only; it does not include fi re andspecial districts.BONDED DEBTFiscal Year Ended June 30 Principal Principal and Interest<strong>2007</strong> $62,987,848 $103,910,45720<strong>08</strong> 62,856,970 100,924,2302009 62,966,559 98,051,8802010 62,905,920 95,036,465Source: <strong>Wake</strong> <strong>County</strong>, North Carolina, Comprehensive Annual Financial Report for theyear ended June 30, 2006.380
<strong>Wake</strong> <strong>County</strong> Demographics<strong>Wake</strong> <strong>County</strong> is consistently ranked as one of the best places in theUnited States in which to live, work and raise a family. Home to theinternationally-acclaimed Research Triangle Park, the area provides aworld-class combination of economic vitality, educational opportunity,environmental quality and community quality-of-life. This area is amongthe fastest growing counties in the nation. A well-rounded combination ofbusiness and industry, higher education, historic preservation, arts andculture, and trees, greenways and lakes offers <strong>Wake</strong> <strong>County</strong> residents aquality lifestyle with excellent job and educational opportunites.<strong>Wake</strong> <strong>County</strong>’s twelve municipalities include Apex, Cary, Fuguay-Varina,Garner, Holly Springs, Knightdale, Morrisville, Raleigh, Rolesville, <strong>Wake</strong>Forest, Wendell, and Zebulon. Raleigh is the state capital and countyseat. The county is governed by the seven-member <strong>Wake</strong> <strong>County</strong> Boardof Commissioners, who are elected for four-year terms.Raleigh’s proximity to both the Blue Ridge Mountains and Atlantic Coastoffer an abundance of recreation options. In less than 3.5 hours, skiersand snowboarders can enjoy a day on the slopes, or bask in the warmsun along the coast. Raleigh’s temperate climate also offers golfersyear-round opportunities to improve their swing.Hiking, biking, and fi shing are popular activities in the metro areasas well. Raleigh has been called the “park with a city in it” thanks toits award-winning parks, greenways system, and open space spreadthroughout the city and <strong>Wake</strong> <strong>County</strong>.Raleigh and the Triangle area also actively support the arts and arehome to a full-range of cultural attractions including some of the mostrenowned museums in the Southeast. The BTI Center for the PerformingArts is one of the best in the country and has a venue for national touringcompanies, in addition to locally produced plays and attractions. Theconcert hall is home to the North Carolina Symphony and features worldcassperformers in both classical and popular productions. Raleigh andits surrounding communities host many smaller community centers,which offer endless cultural opportunities as well. During the summer,the Triangle takes advantage of North Carolina’s moderate weather andhosts performances in outdoor theater, parks, and gardens.Population<strong>Wake</strong> <strong>County</strong>, according to the US Census, is the second largest countyin the State of North Carolina. It boasts total population of 755,034 (2005NC State Demographers <strong>Wake</strong> <strong>County</strong> population), with a forecastedpopulation of 817,429 in <strong>2007</strong>. The increase from 1990, when the totaladjusted population was 423,380, is 78 percent. The median age of <strong>Wake</strong><strong>County</strong> residents is 34.3, according to the 2004 American CommunitySurvey. Data retrieved from the US Census Bureau, 2000 Census,provides the following profi le of general demographic characteristics of<strong>Wake</strong> <strong>County</strong>.Population projections suggest that this trend is likely to continue. <strong>Wake</strong><strong>County</strong> is expected to pass one million residents in 2013, and by 2030<strong>Wake</strong> <strong>County</strong> is expected to have nearly doubled its current population,reaching 1,384,019.Subject No. % Subject No. %Total Population2000627,846 100 Race and EthnicitySexMaleFemale311,436316,41049.650.4WhiteBlack or AfricanAmerican454,54472.4123,820 19.7Age American Indian 2,152 0.3Under 5 year 45,142 7.2 Asian 21,249 3.45-9 years 46,090 7.3 *Hispanic/Latino 33,985 5.410-14 years 43,320 6.915-19 years 41,020 6.520-24 years 48,939 7.825-34 years 113,409 18.135-44 years 115,663 18.445-54 years 84,206 13.455-59 years 25,886 4.160-64 years 17,799 2.865-74 years 25.978 4.175-84 years 15,421 2.585 years+ 4.973 0.8*According to the US Census Bureau, “Hispanic” is not a race, but an ethnicity or origin.The <strong>Wake</strong> <strong>County</strong> demographics information in this section was obtained from the Offi cial Site of <strong>Wake</strong> <strong>County</strong> Government and from the US Census Bureau.381 FY <strong>2007</strong>-<strong>08</strong> <strong>Plan</strong> for Student Success
<strong>Wake</strong> <strong>County</strong> DemographicsThe population increase from 1990 to 2000 (when the last census wastaken) in <strong>Wake</strong> <strong>County</strong> is more than double the population increase inNorth Carolina as a whole. For the total population, there was a 21.4percent increase in North Carolina, while <strong>Wake</strong> <strong>County</strong> experienced a48.3 percent increase. This rate of increase seems to hold true for allraces in <strong>Wake</strong> <strong>County</strong> compared to the state. For instance, the whitepopulation in <strong>Wake</strong> <strong>County</strong> increased by 40.1 percent from 1990 to 2000,while the white population in North Carolina increased by 15.8 percent.Additionally, the black, or African American population increased by 40.9percent in <strong>Wake</strong> <strong>County</strong>, while the state’s African American populationonly increased 19.4 percent.HouseholdsIn 2000, there were 242,040 total households in <strong>Wake</strong> <strong>County</strong>. Thisfi gure increased to 293,580 in 2003. The median household income was$50,582 in 2003. According to the American Community Survey, by 2005the median household income was $57,284. The average householdsize has remained fairly consistent with 2.51 persons per household in2000, while the average family size was 3.06 persons. Families madeup 64 percent of the households in <strong>Wake</strong> <strong>County</strong>. Of the total numberof households, 65.6 percent were families (158,765), while 34.4 percentwere nonfamilies, or households where the householder is living alone(83,275). There were 127,114 married couple families, 23,755 femaleheaded families, and 3,677 male headed families with children, accordingto the 2000 US Census).Income and PovertyAccording to the 2000 Census Data, the average annual wage in <strong>Wake</strong><strong>County</strong> was $35,366 compared to the average annual wage in NorthCarolina of $31,072. The per capital income, which is defi ned as theaverage gross income per household, per 1,000 people, was $27,004in <strong>Wake</strong> <strong>County</strong> in 2000, but increased to $28,256 in 2003. In 2000,<strong>Wake</strong> <strong>County</strong> had 47,685 people living in poverty and a poverty rateof 7.8 percent. The child poverty rate in <strong>Wake</strong> <strong>County</strong> is 8.6 percent,while the elderly poverty rate is 9.9 percent. By 2005, the AmericanCommunity Survey estimated that 75,430, 10.3 percent, <strong>Wake</strong> <strong>County</strong>residents were in poverty.Housing and Housing CharacteristicsJust as <strong>Wake</strong> <strong>County</strong>’s population has grown tremendously over thelast 24 years, so has its housing supply. Between 1980 and 2000, theU.S. Census Bureau estimates that <strong>Wake</strong> <strong>County</strong> added more than145,000 housing units to its housing stock. In 2004, <strong>Wake</strong> <strong>County</strong> hadan estimated 303,473 units. As in the case of population growth, muchof this increase in the housing stock was driven by municipal growth.The biggest urban areas, Raleigh and Cary, added the most new units,but many of the smaller towns grew faster, particularly Holly Springs,Morrisville, Knightdale, and Apex.Between 1980 and 2005, <strong>Wake</strong> <strong>County</strong> added nearly 2,750 newsubdivisions covering more than 1<strong>08</strong>,000 acres of land. In fast growthyears, nearly 7,000 acres a year have been converted to new subdivisiondevelopment. Even in slow growth years, approximately 4,000 acres ayear have been used for new subdivisions.<strong>Wake</strong> <strong>County</strong> saw an increase in all three main categories of housing:single-family detached, multiple unit and manufactured housing.Between 1990 and 2004, <strong>Wake</strong> <strong>County</strong> added nearly 84,000 singlefamilydetached housing units to its housing stock. By 2004, 60 percentof all housing units were single-family detached compared to 56 percentin 1990. The greatest mix in housing types was in <strong>Wake</strong> <strong>County</strong>’s urbancore, and in several of these townships the housing stock was less than50 percent single-family detached units.Housing values in <strong>Wake</strong> county have been steadily increasing since theearly 1990s. From 1996-2005, average housing values in <strong>Wake</strong> <strong>County</strong>increased by approximately $53,000 and average sales prices by over$29,000. By 2005, the highest average residential property values werein Cary, Morrisville and in unincorporated <strong>Wake</strong> <strong>County</strong>. The lowest werein Wendell and Zebulon.The Housing Affordability Task Force Report indicates that between 1990and 1998 median household income in <strong>Wake</strong> <strong>County</strong> rose by 34 percent,apartment rents rose by 57 percent, and home prices rose by 52 percent.This disparity in the rate of growth between incomes and home pricesand rental costs confi rms that housing is becoming less affordable formany residents of <strong>Wake</strong> <strong>County</strong>.382
<strong>Wake</strong> <strong>County</strong> DemographicsIncrease in Median Home PricesPercentage Increase from 1990 and 1998$194,98060%57%52%$200,000$180,000$150,00050%$160,00040%34%$140,000$120,000$98,50030%$100,000$80,00020%$60,000$40,00010%$20,0000%Household Income Apartment Rents Housing PricesSignifi cantly more people in 2000 were living in housing thatrequired more than 30 percent of their income than in 1990.In 2004, high rates of low and moderate income renters werepaying more than 30 percent of their income in rent: 87 percentof households earning less than $10,000 per year, 89 percentof households earning $10,000-$19,999, and 44 percent ofhouseholds earning $20,000-$34,999. A similar picture occursfor homeowners. Even higher rates of homeowners than renterswere paying more than 30 percent of their income on housing in2000: 70 percent of households earning less than $20,000 peryear, 56 percent of households earning $20,000-$34,999, and 44percent of households earning $35,000-$49,999.The median price of a home sold in <strong>Wake</strong> <strong>County</strong> climbed from$98,500 in 1990 and $150,000 in 1998 to $194,980 in 2005.$-1990 1998 2005EmploymentThe Raleigh-Durham area provides employment for over 94percent of its citizens who seek work. Over the past decade, theMSAs unemployment rate has been below the state and nationalrates. Since 1997, the Raleigh-Durham area has had the lowestunemployment rate of all North Carolina MSAs. The stableemployment base, anchored by universities, medical centersand government, has resulted in unemployment trends that havesmoother peaks and valleys than the state and national rates.With the infl ux of new residents and rising incomes, employmenthas changed signifi cantly since 1990. These changes are not onlyin rising levels of employment, but also structural changes in theemployment industries and occupations of <strong>Wake</strong> <strong>County</strong> residentsand in the industries and occupations of workers employed in<strong>Wake</strong> <strong>County</strong>.Agriculture, retail trade, and wholesale trade all declined in totalemployment numbers between 1990 and 2000. The biggestincreases were in professional services, health care, andconstruction.383 FY <strong>2007</strong>-<strong>08</strong> <strong>Plan</strong> for Student Success
<strong>Wake</strong> <strong>County</strong> Demographics<strong>Wake</strong> <strong>County</strong> Industry Base ComparisonTransportation80,00070,00060,00050,00040,00030,00019902005By the end of 2005, nearly 649,000 vehicles were registered in <strong>Wake</strong><strong>County</strong>. This has led to more traffic and longer commutes for <strong>Wake</strong><strong>County</strong> residents. The mean travel time to work in <strong>Wake</strong> <strong>County</strong> in2000 was 24.7 minutes. This is an increase in travel time of 23.5 percentfrom 1990, when it took only 20 minutes to travel to work in <strong>Wake</strong><strong>County</strong>. However, between 2000 and 2004, average commute timesfell slightly from 24.7 to 23.2 minutes.20,00010,000-GovernmentNatural Resources and MiningConstructionManufacturingTrade Transportation and UtilitiesInformationFinancial ActivitiesEducation and Health ServicesProfessional and Business ServicesEducationLeisure and HospitalityOther ServicesUnclassified<strong>School</strong> enrollments for Grades K-12 have increased signifi cantly for the<strong>Wake</strong> <strong>County</strong> <strong>Public</strong> <strong>School</strong> <strong>System</strong> (WCPSS). Between 1990 and 2005,WCPSS saw enrollment increase by more than 66,000 students. The rapidgrowth in school enrollments is expected to continue into 2020. <strong>Wake</strong><strong>County</strong> has also witnessed increasing enrollment in charter schools andor residents in college or graduate school.Approximately 86 percent of <strong>Wake</strong> <strong>County</strong> residents indicated that theycommute alone to work. The second most popular mode was carpooling,which accounted for 10 percent of residents in 2004.In 2004, only 1.6 percent of commuters in <strong>Wake</strong> <strong>County</strong> took publictransportation to work. The national average is 4.9 percent. A similarpercentage (1.8%) indicated they walked or biked to work.At peak hours of travel, a signifi cant number of major travel corridorshave travel speeds below their posted limit. The <strong>Wake</strong> <strong>County</strong> Transportation<strong>Plan</strong> examined road corridors in <strong>Wake</strong> <strong>County</strong>’s planning jurisdictionand concluded that even with improvements by 2025, 25 ofthese road corridors willl be at or above capacity.Since 1990, the level of educational attainment among <strong>Wake</strong> <strong>County</strong> residentshas risen substantially. The number of residents with less than ahigh school degree or a high school degree remained fairly stable between1990 and 2004. The fastest rates of increase were in residents with abachelor’s degree (128%), a graduate or professional degree (156%), orsome college but no degree (55%). By 2004, 49 percent of <strong>Wake</strong> <strong>County</strong>residents had a bachelor’s or high degree, up from 35 percent in 1990.This is much higher than the 2004 percent of North Carolina residentswith a bachelor’s or higher degree (25%) or the national rate (27%).384
Notes385 FY <strong>2007</strong>-<strong>08</strong> <strong>Plan</strong> for Student Success
Notes386
GlossaryAccrual BasisA basis of accounting in which transactions are recognized at the timethey are incurred, as opposed to when cash is received or spent.ABC FlexibilityIn 1996, the General Assembly approved a law to give the State Board ofEducation the authority to implement the ABCs. The ABCs assign moreresponsibility at the school building level and allow schools fl exibility touse funds as they are most needed at the school.ABC Incentive AwardTo provide funding in the form of bonuses to teachers and teacherassistants that meet or exceed the expected levels of performance inaccordance with the ABCs of <strong>Public</strong> Education Program.ABCs of <strong>Public</strong> EducationThe ABCs of <strong>Public</strong> Education is a program created by the NC Departmentof Education to ensure that local school districts are providing a good,basic education to all students. The ABCs has been developing since1995, and was fi rst implemented in schools K-8. A high school modelwas introduced in the next year. Some features of the program havealways been present although there have been modifi cations to theprogram virtually every year.The ABCs measures two different standards:The Growth StandardThe Performance StandardAcademically Gifted (AG)The Academically Gifted program provides an appropriately challengingeducational program for students who perform, or show potential forperforming, at remarkably high levels of accomplishment when comparedto others of their age, experience or environment.Accelerated Learning Program (ALP)This program includes the development of an individualized learningplan for each student and extended learning time. The ALP will useNorth Carolina Standard Course of Study in English Language Arts andMathematics as the basis for its curriculum.Ad Valorem TaxesCommonly referred to as property taxes, are levied on both real andproperty according to the property’s valuation and the tax rate.AEDAutomatic External Defi brillatorsAIMAutomotive Information ModuleAllotTo divide an appropriation into amounts which may be encumbered orexpended during an allotment period.Allotted ADMAllotted ADM for each LEA is the higher of the fi rst two months totalprojected ADM for the current year or the higher of the fi rst two monthstotal prior year ADM.AllotmentAllocation of state and federal funds to Local Education Agencies.AMAOAnnual Measure of Achievement ObjectivesAPAdvanced PlacementAppropriated Fund BalanceAppropriated fund balance in any fund shall not exceed the sum ofcash and investments minus the sum of liabilities, encumbrances, anddeferred revenues, as those fi gures stated at the close of the fi scal yearnext preceding the budget year.AppropriationA legal authorization to incur obligations and to make expenditures for387 FY <strong>2007</strong>-<strong>08</strong> <strong>Plan</strong> for Student Success
Glossaryspecifi c purposes. An appropriation is usually limited in amount and asto the time when it may be expended.ASHAAmerican Speech and Hearing AssociationAssessed RatioThe ratio at which the tax rate is applied to the tax base.the fi rst two months total prior year ADM.AVIDAdvancement Via Individual DeterminationAYPAdequate Yearly ProgressAssessed ValuationThe valuation set upon real estate and certain personal property by theassessor as a basis for levying property taxes.AssetResources owned or held by a government, which have monetaryvalue.AttritionA method of achieving a reduction in personnel by not refi lling thepositions vacated through resignation, reassignment, transfer, retirement,or means other than layoffs.Available (Undesignated) Fund BalanceFunds remaining from the prior year which are available for appropriationand expenditure in the current year.Average Daily Attendance (ADA)Attendance is the presence of a student on days when school is insession. A student is counted as present only when he/she is actuallyat school, present at another activity sponsored by the school as partof the school’s program, or personally supervised by a member of staff.The total number of days of attendance for all students divided by thetotal number of school days in a given period gives the average dailyattendance.Average Daily Membership (ADM)The sum of the number of days in membership for all students inindividual school units, divided by the number of school days in the term.Allotments for each LEA will be made on the basis of the higher of thefi rst two months total projected ADM for the current year or the higher ofBASBuilding Automation <strong>System</strong>Base BudgetCost of continuing existing levels of service in the current budget year.Behavioral SupportA service provided to a special group of students with a variety ofproblems and circumstances. To be certifi ed as a Behavioral Supportclass member, each student must fi t all of the following criteria: be under18, have been diagnosed as emotionally, mentally, or neurologicallyhandicapped, have a history of violent or assaultive behavior against selfor others, not already be receiving services appropriate to the child’sneeds, and have been involved with juvenile court, or institutionalized.BELCBusiness Education Leadership CouncilBMPBest Management PracticesBOEBoard of EducationBondA long-term I.O.U. or promise to pay. It is a promise to repay a specifi edamount of money (the face amount of the bond) on a particular date (the388
Glossarymaturity date). Bonds are primarily used to fi nance capital projects.Bond RefinancingThe payoff and re-issuance of bonds, to obtain better interest rates and/or bond conditions.Budgetary ControlThe control or management of a government in accordance with theapproved budget for the purpose of keeping expenditures within thelimitations of available appropriations and resources.BSNBridges to Success NetworkBTUBritish Thermal UnitBudgetA plan proposed by a board of education for raising and spending moneyfor specifi ed school programs, functions, activities, or objectives duringa fi scal year.Budget AmendmentThe primary budget manager would submit a budget amendment whennew funds need to be added to the budget or if funds need to be removedfrom the budget.Budget ResolutionA resolution adopted by a board of education that appropriates revenuesfor specifi ed school programs, functions, activities, or objectives duringa fi scal year.Budget TransferThe primary budget manager would submit a budget transfer whenfunds are transferred between level codes within program.Budget YearThe fi scal year for which a budget is proposed and a budget resolutionis adopted.Budgetary BasisThis refers to the basis of accounting used to estimate fi nancing sourcesand uses in the budget. This generally takes one of three forms: GAAP,cash, or modifi ed accrual.C&ICurriculum and InstructionCACCitizen Advisory CommitteeCAFRComprehensive Annual Financial Report.Capital AssetsAssets of signifi cant value and having a useful life of several years.Capital assets are also called fi xed assets.Capital BudgetThe appropriation of bonds or operating revenue for improvements tofacilities, and other infrastructure.Capital ImprovementExpenditures related to the acquisition, expansion or rehabilitation of anelement of the government’s physical plant; sometimes referred to asinfrastructure.Capital OutlayFixed assets, which have a value of $5,000 or more and have a usefuleconomic lifetime of more than one year.Capital Outlay FundAppropriations for:a. The acquisition of real property for school purposes, including butnot limited to school sites, playgrounds, athletic fi elds, administrative389 FY <strong>2007</strong>-<strong>08</strong> <strong>Plan</strong> for Student Success
Glossaryheadquarters, and garages.b. The acquisition, construction, reconstruction, enlargement,renovations, or replacement of buildings and other structures,including but not limited to buildings for classrooms andlaboratories, physical and vocational educational purposes,libraries, auditoriums, gymnasiums, administrative offi ces, storage,and vehicle maintenance.c. The acquisition or replacement of furniture and furnishings,instructional apparatus, data-processing equipment, businessmachines, and similar items of furnishings and equipment.d. The acquisition of school buses as additions to the fl eet.e. The acquisition of activity buses and other motor vehicles.f. Such other objects of expenditure as may be assigned to thecapital outlay fund by the uniform budget format.The cost of acquiring or constructing a new building, or reconstructing,enlarging or renovation of existing building, shall include the cost ofall real property and interests in real property, and all plants, works,appurtenances, structures, facilities, furnishings, machinery, andequipment necessary or useful in connection therewith; fi nance charges,the cost of plans, specifi cations, studies, reports, and surveys, legalexpenses, and all other costs necessary or incidental to the construction,reconstruction, enlargement or renovation.Capital ProjectMajor construction, acquisition, or renovation activities, which add valueto a government’s physical assets or signifi cantly increase their usefullife. Also called capital improvements.CarryoverFunds appropriated but unspent in the fi rst fi scal year which are broughtforward for expenditure in the succeeding fi scal year(s).Cash BasisA basis of accounting in which a transaction is recognized only whencash is increased or decreased.Categorical AllotmentsLocal school systems may use this funding to purchase all servicesnecessary to address the needs of a specifi c population or service. Thelocal school system must operate within the allotted funds. These fundsmay be used to hire personnel such as teachers, teacher assistants,and instructional support personnel or to provide a service such astransportation, staff development, or to purchase supplies and materials.Examples: At Risk Student Services, Transportation, Children withDisabilities.Categorical FundsA dollar allotment which may be used to fund positions and/or othersupport such as supplies, materials, etc. for that particular program.Categorical GrantsA grant received from another governmental unit to be used or expendedon specifi c programs.Category I ProjectAcquisition of real property and acquisition, construction, reconstruction,enlargement, renovations, or replacement of buildings and otherstructures for school system purposes.Category II ProjectAcquisition or replacement of furniture, furnishings, and equipment.Category III ProjectAcquisition of school buses, activity buses, and other motor vehicles.CCTVClosed Circuit TelevisionCDCompact DiskCDCCareer Development CoordinatorCFDA#A number that is assigned to each federal program for which a grantis awarded. The Catalog of Federal Domestic Assistance containsinformation for all federal grant programs such as grant authorization,who is eligible to apply, etc.390
GlossaryCharter <strong>School</strong>sA public school operated by a group of parents, teachers, and/orcommunity members as a semi-autonomous school of choice withina school district operating under a “charter” with the State Board ofEducation. The fi nal approval on all charters is granted by the StateBoard of Education. In addition, the charter school must sign a contractwith the local board of education laying out the relationship between thecharter school and the local board of education. Charter schools aredesigned to give signifi cant autonomy to individual schools and in turnhold these schools accountable for results.CICCurriculum Integration CoordinatorCIPCapital Improvement ProgramCNSChild Nutrition ServicesCo-Curricular Instructional ProgramsExperiences comprised of a group of school-sponsored activities, underthe guidance or supervision of qualifi ed adults, designed to provideopportunities for pupils to participate in such experiences on an individualbasis, in small groups, or in large groups at school events, public eventsor a combination of these for such purposes as motivation, enjoyment,and improvement of skills. In practice, participation usually is not requiredand credit is not given.CogATCognitive Aptitude TestsCommunity ServicesActivities that are not directly related to the provision of education forpupils. These include such services as community recreation programs,civic activities, public libraries, programs of custody and care ofchildren, and community welfare activities provided by the local schooladministrative unit for the community as a whole or some segment of thecommunity.ContingencyA budgetary reserve set aside for emergencies or unforeseen expendituresnot otherwise budgeted.Contractual ServicesServices rendered to a government by private fi rms, individuals, or othergovernmental agencies. Examples include utilities, rent, maintenanceagreements, and professional consulting services.Cost Center CodeThe cost center code consists of four numerical digits and specifi es theschool, central offi ce department, or central offi ce division of the schoolsystem at which the expenditure is to be incurred.CPRCardiopulmonary ResuscitationCSPChallenged <strong>School</strong>s ProgramCSRComprehensive <strong>School</strong> ReformCTECareer-Technical EducationCurrent ExpenseThose expenditures of a recurring nature covering services, supplies,equipment, and payments to individuals or other agencies.Debt ServiceThe cost of paying principal and interest on borrowed money accordingto a predetermined payment schedule.391 FY <strong>2007</strong>-<strong>08</strong> <strong>Plan</strong> for Student Success
GlossaryDedicated TaxA tax levied to support a specifi c government program or purpose.DeficitThe excess of an entity’s liabilities over its assets or the excess ofexpenditures or expenses over revenues during a single accountingperiod.DepartmentThe basis organizational unit of government which is functionally uniquein its delivery of services.Development-related FeesThose fees and charges generated by building, development and growthin a community. Included are building and street permits, developmentreview fees, and zoning, platting and subdivision fees.DisbursementThe expenditures of monies from an account.Discretionary GrantsGrants awarding funds following a competitive review process on anational level. Proposals are reviewed and scored by knowledgeableindividuals outside the federal government. Awards are then made tothe highest-scoring proposals. There are eligibility requirements fordiscretionary grant competitions which limit who may compete for agrant.Dollar per ADMLEA’s Initial Allotment divided by the allotted ADM for that LEA. Charter<strong>School</strong>s receive an amount equal to the state funded dollars per ADM forthe LEA in which the school is located or (for new charters) in which thestudent was previously enrolled.Dollars per HeadcountFunds generated for school-aged children with special needs divided bythe LEA’s April 1 total headcount (not capped). Charter <strong>School</strong>s receivean amount equal to the LEA’s state funded dollars per headcount for theLEA in which the child was identifi ed.DPIDepartment of <strong>Public</strong> InstructionDropoutA student who leaves school before graduation or completion of aprogram of study for any reason except death or transfer to anotherschool. Students drop out of school for many reasons - academic failure,discipline problems, employment, illness, marriage, family instability,and/or dislike of school.DRDisaster RecoveryDRSDisaster Recovery ServicesDistinguished Budget Presentation Awards ProgramA voluntary awards program administered by the Government FinanceOffi cers Association to encourage governments to prepare effectivebudget documents.Dollar AllotmentsLocal school systems can hire employees or purchase goods for a specifi cpurpose, but the local school system must operate within the allotteddollar amount. Examples: Textbooks, Central Offi ce Administration,Teacher Assistants.ECExceptional ChildrenEHAEducation of the Handicapped Act392
GlossaryEHASEnvironmental Health and SafetyELLEnglish Language LearnersELPEconomics, Law, and PoliticseMARCElectronic management of assessments, resources, and curriculum. Itis an instructional management software application developed by theCurriculum and Instruction Department and the Technology ServicesDivision of the WCPSS. The tool is designed to assist teachers in recordingand using assessment information to make instructional decisions anddifferentiate instruction for students. Presently it is used in 36 elementaryschools. The software includes a data collection component, webbasedelementary report card and links to a variety of resources thatassist teachers in the development of lesson plans and assessments.It is to be made available to all elementary school teachers in 2006-07.This software was developed as a result of a recommendation of thePaperwork Reduction Committee.EMCElertromagnetic CompatibilityEmployee (or Fringe) BenefitsContributions made by a government to meet commitments or obligationsfor employee fringe benefi ts. Included are the government’s shareof costs for Social Security and the various pension, medical, and lifeinsurance plans.EncumbranceThe commitment of appropriated funds to purchase an item or service.To encumber funds means to set aside or commit funds for a specifi edfuture expenditure.End-of-Course (EOC)The End-of-Course tests are designed to measure students’ knowledgeand skills in 10 high school courses in terms of the NC Standard Courseof Study, and to determine the extent to which the students are preparedfor coursework at the next higher level of study in that subject.End-of-Grade (EOG)The End-of-Grade tests are designed to measure student achievementof the knowledge and skills of the North Carolina Course of Study forstudents in grades three through eight.EnrollmentRepresents the number of pupils registered in the state’s public schools.Once a pupil is initially counted in the enrollment fi gure, he/she remainsin that count throughout the school year. Students transferring to theNorth Carolina public school system from another state or from nonpublicschools are added to enrollment. Enrollment is not reduced bytransfers, withdrawals, deaths, or midyear graduations. The end of theyear enrollment thus shows a higher count than the actual number ofstudents in school. Final enrollment, therefore, should not be comparedto fi rst month enrollment.EntitlementPayments to which local governmental units are entitled, pursuant toan allocation formula determined by the agency providing the monies,usually the state or the federal government.Entitlement GrantsState grants made in accordance with a formula based on the numberof children or students to be served, or on the amount of federal or statemoney available.EPAEnvironmental Protection AgencyERPEnterprise Resource <strong>Plan</strong>ningE&REvaluation and ResearchESEAElementary and Secondary Education Act of 1965. This Act was amendedby the Improving America <strong>School</strong>s Act 1994.393 FY <strong>2007</strong>-<strong>08</strong> <strong>Plan</strong> for Student Success
GlossaryESLEnglish as a Second LanguageExpenditureThe payment of cash on the transfer of property or services for thepurpose of acquiring an asset, service, or settling a loss.ExpenseCharges incurred (whether paid immediately or unpaid) for operations,maintenance, interest, or other charges.Fixed AssetsAssets of long-term character that are intended to continue to beheld or used, such as land, buildings, machinery, furniture, and otherequipment.FLSAFair Labor Standards ActFMSFuel Management <strong>System</strong>Formula GrantsState grants made in accordance with a formula based on the numberof children or students to be served, or on the amount of federal or statemoney available.FCCFederal Communications CommissionF and RFree and ReducedFederal Grant FundAppropriations for the expenditure of federal categorical grants made bythe Department of <strong>Public</strong> Instruction and other federal grants allocateddirectly to the local school administrative unit. These appropriationsare categorical in nature; i.e., programs and services for children of lowincome families, programs and services designed to eliminate the effectsof previous discriminatory practices, etc.Fiscal PolicyA government’s policy with respect to revenues, spending, and debtmanagement as these relate to government services, programs,and capital investment. Fiscal policy provides an agreed-upon set ofprinciples for the planning and programming of government budgets andtheir funding.Fiscal YearThe annual period for the compilation of fi scal operations. The fi scal yearbegins on July 1 and ends on June 30.FP and CFacilities <strong>Plan</strong>ning and ConstructionFull-Time EmployeeFull-time employee is one whose regular workweek is thirty or morehours.Full-Time Equivalent (FTE)Sum of part-time positions employed when added together equate to afull-time position used within classifi cation. Example: Two one-half timepositions equate to one full-time equivalent position.FunctionA group of related activities aimed at accomplishing a major service orregulatory program for which a government is responsible.Function CodeThe function code consists of four numeric digits and describesthe purpose for which the activity exists or the type of balance sheetaccount.FundAn independent fi scal and accounting entity consisting of cash and otherresources together with all related liabilities, obligations, reserves, and394
Glossaryequities which are segregated by appropriate accounting techniquesfor the purpose of carrying on specifi c activities or attaining certainobjectives in accordance with established legal regulations, restrictions,or limitations.Fund BalanceThe excess of the assets of a fund over its liabilities and reserves at thebeginning or ending of a fi scal year.Fund CodeThe fund consists of two numeric digits. The fund is an independentfi scal and accounting entity with a self-balancing set of accounts. Thefunding code indicates whether state, federal, or local monies areinvolved.Future Use CodeThe future use code consists of three numerical digits for futureexpansion.GAAPGenerally Accepted Accounting Principles. Uniform minimum standardsfor fi nancial accounting and recording, encompassing the conventions,rules, and procedures that defi ne accepted accounting principles.GASBGovernmental Accounting Standards BoardGeneral Obligation (G.O.) BondThis type of bond is backed only by the full faith, credit and taxing powerof the government.GoalA statement of broad direction, purpose or intent based on the needs ofthe community. A goal is general and timeless.Goal 20<strong>08</strong>On November 5, 2003, the <strong>Wake</strong> <strong>County</strong> Board of Education adoptedGoal 20<strong>08</strong> aligning its efforts towards achieving the goal and carryingout its mission:“WCPSS is committed to academic excellence. By 20<strong>08</strong>, 95 percentof students in grades 3 through 12 will be at or above grade level asmeasured by the State of North Carolina End-of-Grade or Course tests,and all student groups will demonstrate high growth.In pursuit of this goal, we will:• Increase challenging educational opportunities for all students.• Increase student participation and success in advanced classes atthe high school level.• Increase the percent of 9th grade students graduating from highschool, within four years.• Recruit, develop, support and retain a highly qualifi ed workforce toensure student success.• Identify and seek resources necessary to support student success.• Build a consensus of support through community collaboration.”MissionThe <strong>Wake</strong> <strong>County</strong> <strong>Public</strong> <strong>School</strong> <strong>System</strong> will educate each student to bea responsible and productive citizen who can effectively manage futurechallenges.BackgroundAn eighteen-month community effort led to the development of Goal20<strong>08</strong>. More than 1,850 citizens offered priorities, changes and goals forthe future through the Voices and Choices community meetings across<strong>Wake</strong> <strong>County</strong>. Orage Quarles, the publisher of the News and Observer,and Lynne Garrison, vice-president of corporate communications forBlue Cross and Blue Shield of North Carolina, co-chaired the Voicesand Choices project. The results were announced and synthesizedduring the 2003 <strong>Wake</strong> Education Summit, attended by more than 850community, business and parent leaders.The <strong>Wake</strong> <strong>County</strong> Board of Education, working with the schoolsystem administration and consulting with the <strong>Wake</strong> <strong>County</strong> Board ofCommissioners and county staff, worked for six months to fi nalize Goal20<strong>08</strong>.395 FY <strong>2007</strong>-<strong>08</strong> <strong>Plan</strong> for Student Success
GlossaryThe new goal includes grades three through twelve. High academicgrowth is expected among all groups of students. Advanced andstruggling students alike are expected to receive the quality of instructionand resources they deserve in order to make the most of their opportunityfor success.Central to all of WCPSS’s strategies is community partnership andcollaboration. It was noted when the goal was set that it will take a highlevel of community involvement, openness, and support for the <strong>Wake</strong><strong>County</strong> <strong>Public</strong> <strong>School</strong> <strong>System</strong> to meet the challenge it has embraced.GPAGrade Point AverageGrade Level ProficiencyPerformance standards, called achievement levels, are one way thatscores on the North Carolina End-of-Course Tests are reported. Studentsthat score at or above level III are considered to be grade level profi cient.Listed below are the four achievement levels:Level I: Student performing at this level do not have suffi cient mastery ofknowledge and skills of the course to be successful at a more advancedlevel in the content area.Level II: Students performing at this level demonstrate inconsistentmastery of knowledge and skills of the course and are minimally preparedto be successful at a more advanced level in the content area.Level III: Students performing at this level consistently demonstratemastery of the course subject matter and skills and are well preparedfor a more advanced level in the content area.Level IV: Students performing at this level consistently perform in asuperior manner clearly beyond that required to be profi cient in thecourse subject matter and skills and are very well prepared for a moreadvanced level in the content area.GrantA contribution by a government or other organization to support aparticular function. Grants may be classifi ed as either operational orcapital, depending upon the grantee.Growth StandardStudents should achieve at least a year of academic gain for every yearof school attendance. The Growth Standard measures the degree towhich this happens. Various formulas and measurements have beenused to calculate growth and, over the course of the ABCs, these havebeen modifi ed. Essentially, however, here’s how the process works: Agrowth prediction is made at the beginning of the school year based onthe prior year’s test scores in reading and mathematics. This predictionis then compared with the actual growth by subtracting predicted fromactual. If the difference is 0 or greater than the growth standard is met.If the difference is a minus number, then the school has failed to achievethe growth target.Teachers, teacher assistants and principals receive bonus payments ifthe school in which they work meet the growth standard. A larger bonusis awarded to those who work in schools that meet the high growthstandard.GTGifted and TalentedHandicapped (Children with Disabilities)Mentally retarded, hearing impaired, deaf, speech/language impaired,visually handicapped, autistic, behaviorally/emotionally disturbed,orthopedically impaired, other health impaired, traumatic brain injury,deaf-blind, multi-handicapped, or specifi c learning disabled students whoneed special education and related services.HeadcountThis term refers to the process of actually counting the number of pupilswho are defi ned as Children with Special Needs or Limited EnglishProfi cient. For federal purposes, children with special needs includeonly the handicapped. For state purposes, children with special needsinclude handicapped and pregnant students.The federal government requires headcounts of children with special396
Glossaryneeds who have been properly identifi ed, are receiving special educationand related services on the headcount day, and have an individualeducation plan (IEP) or an individualized family service plan (IFSP). TheDecember 1 IDEA Title VI-B Handicapped headcount includes thosechildren ages 3-21 who are being served by LEAs, Charter <strong>School</strong>s, orstate-operated programs. State law requires an adjusted headcount onApril 1 of children ages 5-20 who are being served by LEAs or Charter<strong>School</strong>s and ages 3 to Pre-K 5 for Preschool handicapped funds. TheApril headcount includes additions or deletions to the December 1headcounts and is used for state funding purposes.Highly Qualified TeachersElementary school teachers must hold at least a bachelor’s degree, befully certifi ed/licensed, and demonstrate academic competence in eachcore area taught (i.e., pass PRAXIS II) by June 30, 2006.Middle and high school teachers must hold at least a bachelor’s degree,be fully certifi ed/licensed, and demonstrate academic competence ineach core area taught. To be academically competent, teachers mustachieve one of the following: hold undergraduate major or equivalent (24semester hours), pass licensing exam, hold advanced degree or licensurein subject, hold National Board of Professional Teaching StandardsCertifi cation in subject, or complete a competency assessment (optionfor currently employed teachers only) by June 30, 2006.employees provide contingency staffi ng for government operationsduring peak workloads, or to address temporary staffi ng needs. Hourlyemployees are paid on a per-hour basis, and receive limited benefi ts.Hours WorkedThe time for which an employee is entitled to compensation under theFLSA. Compensation is required for the time an employee is requiredto be on duty, on the employer’s premises or at a prescribed workplace,and for the time the employee is “suffered or permitted” to work, whetheror not the employee is requested to do so. Hours worked can includeidle time and time spent in incidental activities, as well as in productivelabor. For example, if an employer permits an employee to continueworking after the end of a shift, the additional hours would be part ofhours worked.HRHuman ResourcesHVACHeating, Ventilation and Air ConditioningTeacher assistants paid with Title I funds, hired on or after January 2002,must hold an associate degree, have completed two years of college orhave completed a formal academic assessment.NOTE: According to the NC Department of <strong>Public</strong> Instruction (NCDPI),federal offi cials have given each state the opportunity to request anextension of the June 30, 2006 deadline. NCDPI has requested theextension. Our information at the time of this publication is that we willnot be informed about the status of the extension request until earlyAugust 2006.HILLAHigh Intensity Language Learning AcademyHourlyAn employee who fi lls a temporary or short-term position. SuchI.A.S.A.Improving America <strong>School</strong>s Act of 1994 which reauthorizes the Elementaryand Secondary Education Act of 1965.IAQIndoor Air QualityIBInternational Baccalaureate ProgrammeIBSNCInternational Baccalaureate <strong>School</strong>s of North Carolina397 FY <strong>2007</strong>-<strong>08</strong> <strong>Plan</strong> for Student Success
GlossaryI.D.E.AIndividuals with Disabilities Education Act replaced the EHA Educationof Handicapped Act for Title VI-B. Includes Title VI-B and Title VI-BPreschool Handicapped.IEPIndividual Education <strong>Plan</strong>IHEInstitute of Higher EducationIndirect CostA cost necessary for the functioning of the organization as a whole, butwhich cannot be directly assigned to one service.InfrastructureThe physical assets of a government.Initial AllotmentsThe allocation of state and federal funds to LEAs occurring afteradjournment of the General Assembly.Instructional PersonnelInstructional personnel means all classroom teachers, librarians, andalso instructional assistants. Counselors who regularly teach any part ofthe day will be judged to be full-time instructional personnel.Instructional ProgramsActivities dealing directly with the teaching of pupils, or the interactionbetween teacher and pupils. Teaching may be provided for pupils inschool classroom, in another location such as a home or hospital, and inother learning situations such as those involving co-curricular activities.It may also be provided through some other approved medium such astelevision, radio, telephone, and correspondence. Included here are theactivities of aides or assistants of any type (clerks, graders, teachingmachines, etc.) which directly assist in the instructional process.Instructional SupportCertifi ed personnel who implement locally designed initiatives whichprovide services to students who are at risk of school failure as well asthe students’ families. It is the intent of the General Assembly that thepositions must be used fi rst for counselors, then for social workers andother personnel which have a direct instructional relationship to studentsor teachers to help reduce violence in the public schools.Interfund TransfersThe movement of monies between funds of the same governmentalentity.Intergovernmental RevenueFunds received from federal, state and other local government sourcesin the form of grants, shared revenues, and payments in lieu of taxes.Interim BudgetIn case the adoption of the budget resolution is delayed until after July1, the board of education shall make interim appropriations for thepurpose of paying salaries and the usual ordinary expenses of the schooladministrative unit for the interval between the beginning of the fi scalyear and the adoption of the budget resolution.Internal Service ChargesThe charges to user departments for internal services provided byanother government agency, such as processing, or insurance fundedfrom a central pool.IPMIntegrated Pest ManagementIPTIdea Profi ciency TestsIRTInstructional Resource TeacherISDInstructional Services DivisionISTInstructional Support Technician398
Glossaryoperating expenses of the public school system.LRLong RangeLapsing AppropriationAn appropriation made for a certain period of time, generally for thebudget year. At the end of the specifi ed period, any unexpected orunencumbered balance lapses or ends, unless otherwise provided bylaw.LEALocal Education AgencyLEPLimited English Profi ciencyLevel CodeThe level code consists of four numerical digits. For schools andinstructional programs, the level code specifi es the grade or subjectarea in the school for which an expenditure is proposed.LevyTo impose taxes for the support of government activities.Line-item BudgetA budget prepared along departmental lines that focuses on what is tobe bought.Local Current Expense FundAppropriations for the current operating expenses of the local schooladministrative unit other than appropriations included in the state publicschool fund and the federal grant fund. These appropriations shall befunded by moneys made available to the local school administrative unitby the board of county commissioners, supplemental taxes levied by oron behalf of the local school administrative unit, state money disburseddirectly to the local school administrative unit, and other monies madeavailable or accruing to the local school administrative unit for currentLPLiquifi ed PropaneMATVMaster Antenna TVM&OMaintenance and OperationsMaterials and SuppliesExpendable materials and operating supplies necessary to conductdepartmental operations.Medicaid – Administrative OutreachAdministrative and outreach services provide an infrastructure in supportand the provision of direct services.Medicaid – Direct ServicesDefi ned in N.C. as evaluation and therapy services in the areas of:occupational therapy, physical therapy, speech therapy, psychologicalservices and audiological services. These are provided directly tostudents and are documented on their IEP’s.Modified AccrualThe basis of budgeting for the school system. Expenditures arerecognized when encumbered and revenues are recognized whencollected.399 FY <strong>2007</strong>-<strong>08</strong> <strong>Plan</strong> for Student Success
GlossaryModified Zero-Based BudgetingA technique that enables management to identify and analyze what isgoing to be done, set goals and objectives, make operating decisions,and evaluate work loads and responsibilities during the budgetingprocess. In zero-base budgeting the entire budget request (current andexpansion) can be viewed as a series of supplemental requests to a zerobase. The process starts with consideration of impacts, consequences,and levels of service desired. Priorities are fi xed among programs andactivities.Months of EmploymentA unit of employment corresponding to a calendar month. The state allotsa certain number of months of employment which can be assigned to aposition, or a portion of a position, at the discretion of the LEA. Monthsof employment pertain to all position allotments which include VocationalEducation and <strong>School</strong> Building Administration. Example: If an LEA isallotted 100 months of employment, that LEA can hire 10 VocationalEducation teachers for 10 months; or 8 teachers for 12 months and 1teacher for 4 months; or any other combination which equals 100 months.Each allotment category must be reviewed for any special restrictions.MSDSMaterial Safety Data SheetsMTACMedia Technology Advisory CommitteeMTEMulti-task EmployeeMultiple Enterprise FundThe enterprise fund accounts for the operations of the Board’s childnutrition services program, tuition programs, and print shop. The intentis that the costs, including depreciation, of providing food services, tuitionprograms, and print shop services to the individual schools be partiallyrecovered by user charges.MYPMiddle Years ProgrammeNASSPNational Association of Secondary <strong>School</strong> PrincipalsNBPTSNational Board for Professional Teaching StandardsNCAENorth Carolina Association of EducatorsNCCMTNorth Carolina Capital Management TrustNCDCDNorth Carolina Division of Child DevelopmentNCDPINorth Carolina Department of <strong>Public</strong> InstructionNC EOGNorth Carolina End-of-Grade TestNCHSAANorth Carolina High <strong>School</strong> Athletic AssociationNo Child Left BehindThe federal government instituted the No Child Left Behind legislation,which was signed into law by President Bush in January 2002. Thelegislation’s primary goal is to insure that ALL students are profi cientin reading, mathematics, and science by 2014. The law holds states,school districts, and schools accountable for the education of all studentsand has a variety of different accountability measures.For StudentsStudent achievement is analyzed by sub-group. There are 10 sub-400
Glossarygroups, or targets, that are expected to move incrementally toward the100% goal. The scores of students in these sub-groups, based on raceor ethnicity and risk conditions (limited English profi ciency, disabilities,and poverty) are analyzed separately for reading, mathematics and oneother academic indicator (typically, graduation rates for high schools andattendance for elementary and middle schools). If any one sub-group ina school fails to attain the appropriate percentage of members profi cient,then the school has failed to achieve Adequate Yearly Progress (AYP)toward the 100% goal.Each state has the opportunity to establish such conditions as thenumber of days a student must be enrolled in order for his/her scores tobe included, or the size of the sub-group. Thus, comparison from stateto state is not possible. <strong>School</strong>s that receive federal funds through TitleI, the largest federal program for support of students from poor families,may be sanctioned if they fail to achieve AYP. If, however, a school isnot a Title I school, then the sanctions do not apply. Districts can also besanctioned if the district, as a whole, fails to achieve AYP.A primary difference between NCLB and the state’s ABCs program isthat NCLB does not calculate growth, focusing only on performance. Inaddition, NCLB does not use average student scores, as ABCs does, indetermining the progress of sub-populations. In addition, NCLB does notoffer any rewards or incentives for meeting AYP.For TeachersNCLB also requires that districts report the number of teachers who failto achieve Highly Qualifi ed Status. This is in addition to regular statelicensure standards and essentially requires that teachers spend themajority of their time teaching in areas/subjects for which they are fullylicensed.North Carolina Course of Study Graduation RequirementsFour Courses of Study2000-2001One of the 4 graduation courses of study was required of each studententering the ninth grade:• Career Preparation• College Technical Preparation• College University Preparation• Occupational Course of StudyNew Exit Standards2006-<strong>2007</strong>Students (entering the ninth grade) who are following the CareerPreparation, College Technical Preparation, or College/UniversityPreparation Course of Study shall meet the following exit standards:• Graduation Project• Scoring at profi ciency (level III or above) on 5 End-of-CourseAssessments:English IU. S. HistoryBiologyCivics and EconomicsAlgebra IState Board Approves Framework for Core Course of Study(December 8, 2006)20<strong>08</strong>-2009Students (entering the ninth grade) will follow the proposed core courseof study framework. This change will replace the current course of study.Graduates in the Class of 2011 would be the last class to follow the oldframework. The new core framework requires a 21 unit core course ofstudy that will include a four-unit endorsement in a specialty area of theirchoice.The new core course of study will require:• 4 units of English• 4 units of mathematics• 3 units of science• 3 units of social studies• 2 units of a second language• 1 unit of health/physical education• an endorsement of at least four units in one of the following areas:Career-Technical Education, Arts Education, JROTC, AdvancedPlacement/IB, Second Language or other (The endorsement is inaddition to the 17 specifi ed core courses.)NCWiseThe North Carolina Windows of Information for Students Education is thenew student information system being implemented by the Department401 FY <strong>2007</strong>-<strong>08</strong> <strong>Plan</strong> for Student Success
Glossaryof <strong>Public</strong> Instruction across the State.NEEDNational Energy Education Development ProjectNIMSNational Incident Management <strong>System</strong>Noninstructional SupportSupport positions and nonpersonnel dollars that do not have a directinstructional relationship, such as clerical assistants and custodians.Non-Programmed ChargesConduit-type (outgoing transfers) payments to other local schooladministrative units or other administrative units in the state or in anotherstate, and transfers from one fund to another fund in the local schooladministrative unit.OBDOn Board DiagnosticsObject CodesThe object code indicates the service or commodity obtained as a resultof a specifi c expenditure. Seven major object categories are used in theChart of Accounts:100 Salaries200 Employee Benefi ts300 Purchased Services400 Supplies and Materials500 Capital Outlay600 Other Objects700 TransfersThese broad categories are subdivided to obtain more detailed informationabout objects of expenditures. A three-digit serial number is used toprovide detailed information.Object of ExpenditureAn expenditure classifi cation, referring to the lowest and most detailedlevel of classifi cation, such as electricity, offi ce supplies, asphalt, andfurniture.ObjectiveSomething to be accomplished in specifi c, well-defi ned, and measurableterms and that is achievable within a specifi c time frame.ObligationsAmounts which a government may be legally required to meet. Theyinclude not only actual liabilities, but also encumbrances not yet paid.Operating ExpensesThe cost for personnel, materials, and equipment required for adepartment to function.Operating RevenueFunds that the government receives as income to pay for ongoingoperations. It includes such items as taxes, fees from specifi c services,interest earnings, and grant revenues. Operating revenues are used topay for day-to-day services.OSHAOccupational Safety and Health AdministrationOTOccupational Therapists402
Glossarycalendar months. The fi rst pay period for the fi scal year is designated as“01” which refers to July, with the designation of “12” for June. The payperiod designation correlates to the calendar month in which paymentis made.P & CPurchasing and Contract - State agency that controls purchasingsupplies and equipment.Parent NotificationWCPSS must provide annual report cards on school performanceand teacher quality, as well as information about public school choiceoptions, to parents and the public – giving parents more informationthan they’ve ever had before.The report card merges NCLB info with the NC <strong>School</strong>’s Report Card,and will be available at www.ncreportcards.org.PARSPersonnel Activity Reporting <strong>System</strong>Part-time EmployeePart-time employee means an employee who works at least one-half ofthe hours worked by full-time employees in that class of work providedthat it is not less than twenty hours per week.Pay-as-you-go BasisA term used to describe a fi nancial policy by which capital outlays arefi nanced from current revenues rather than through borrowing.Pay LevelA level between 4-52 found in the NC <strong>Public</strong> <strong>School</strong> Personnel StateSalary Schedule which corresponds to the actual monthly or annual salary(not including salary supplements) based on the individual’s positionand classifi cation. For each position and within each administratorclassifi cation, there are several levels.Pay PeriodThere are twelve pay periods per fi scal year corresponding to the twelvePerformance IndicatorsSpecifi c quantitative and qualitative measures of work performed as anobjective of specifi c departments or programs.Performance MeasureData collected to determine how effectively or effi ciently a program is atachieving its objectives.Performance StandardThe performance standard is a calculation of the percent of all teststaken in the school that are at or above grade level. Since every testscore is considered to be either at or below “grade level” or “profi cient”,it is relatively easy to count all of the tests with profi cient-level scoresand then fi gure out what percent of tests these represent.<strong>School</strong>s that attain specifi c levels of profi ciency may be awarded honortitles. For example, a <strong>School</strong> of Excellence is a school that reached itsgrowth target AND in which 90 percent of tests were at the profi cientlevel. Similarly, a <strong>School</strong> of Distinction is one which reached its growthgoal AND has at least 80 percent of tests at the profi cient level.Since fi rst implementation, the ABCs program has been altered andmodifi ed to include alternative schools, as well as being changed to fi tbetter with the federal No Child Left Behind accountability program.Permanent EmployeePermanent employee means an employee who is either: (a) employedwith the expectation of permanent employment, to fi ll a position that isto be permanent if present needs and funds continue; or (b) employed,for at least six full consecutive monthly pay periods within one contract,to replace one or more employees who are on leave of absence withoutpay. Permanent employees may be employed in a full-time or part-timestatus.Per Pupil AllotmentAn allocation based on a per student basis as determined by the board403 FY <strong>2007</strong>-<strong>08</strong> <strong>Plan</strong> for Student Success
Glossaryof education. All dollar amounts are established by grade level and arebased on the current year twentieth-day enrollment fi gures.Per Pupil ExpenditureThe annual current expenditures divided by the fi nal average dailymembership for the year.PESPartnership for Educational SuccessPIAProgram Integrity Assurance<strong>Plan</strong>ning AllotmentsThe tentative allocation of state and federal funds to LEAs to provideinformation for budgeting purposes. These allotments occur during Marchpreceding the fi scal year for which the initial allotment will be made.PMPreventive MaintenancePositionPositions equate to the full-time equivalent individuals that can be assignedfor the employment period represented by the allotment category. Forexample, a position in the classroom teacher allotment represents anemployment period of 10 months, and in the principal allotment category12 months. The number of full-time equivalent individuals that can beemployed is limited to the number of months associated with the positionsallotted by the state.Position AllotmentsThe State allots positions to a local school system for a specifi c purpose.The local school system pays whatever is required to hire certifi edteachers and other educators, based on the State Salary Schedule,without being limited to a specifi c dollar amount. Each local schoolsystem will have a different average salary based on the certifi edpersonnel’s experience and education. Example: Teachers, <strong>School</strong>Building Administration, Instructional Support Personnel.PRCProgram Report CodePrimary Budget ManagerThe primary budget managers are all principals and cabinet members.Cabinet members may choose to establish central offi ce administratorsas primary budget manager.Prior-Year EncumbrancesObligations from previous fi scal years in the form of purchase orders,contracts or salary commitments which are chargeable to an appropriation,and for which a part of the appropriation is reserved. They cease to beencumbrances when the obligations are paid or otherwise terminated.ProgramA group of related activities performed by one or more organizational unitsfor the purpose of accomplishing a function for which the government isresponsible.Program BudgetA budget which allocates money to the functions or activities ofa government rather than to specifi c items of cost or to specifi cdepartments.Program CodeThe program code consists of three numeric digits. The programdescribes a plan of activity or a funding for a particular activity. This codeallows the unit a framework for classifying expenditures by program todetermine cost. For a complete listing of the program codes, please referto the NC <strong>Public</strong> <strong>School</strong>s Uniform Chart of Accounts.Program EnhancementPositions allotted for art, music, physical education, dance, drama, andforeign language. Also used to reduce class size.Program Performance BudgetA method of budgeting whereby the services provided are broken downin identifi able service programs or performance units. A unit can be adepartment, a division, or a workgroup. Each program has an identifi ableservice or output and objectives to effectively provide the service. The404
Glossaryeffectiveness and effi ciency of providing the service by the programreport is measured by performance indicators.Program Revenue (Income)Revenues earned by a program, including fees for services, license andpermit fees, and fi nes.Projected Average Daily MembershipThe process of comparing prior year and current year best continuousthree of fi rst four months Average Daily Membership for the comingyear. This is the basis of state allotment for many items.Purpose CodePurpose means the reason for which something exists or is used.Purpose includes the activities or actions that are performed toaccomplish the objectives of a local school administrative unit. Thepurpose code consists of four numerical digits and is broken down intoa function level at the second digit and, where appropriate, into a subfunctionlevel at the third digit. The fourth digit of the purpose code isnot in use at this time expect in rare cases and will be indicated in thechart of accounts.PSB<strong>Public</strong> Sector BudgetingPSATPreliminary Scholastic Aptitude TestPTPhysical TherapistsPTSAParent Teacher Student Association<strong>Public</strong> <strong>School</strong> ChoiceA Title I school that doesn’t make AYP for two years in a row is identifi edfor school improvement (SI). The following year, the school must offertransfer options to all parents of students in that school, and continueoffering choices until it makes AYP two years in a row. The district can’tuse crowding as a reason for not offering school choice.WCPSS may designate the schools of choice, but the receiving schools:1) must not be identifi ed for school improvement, 2) must not be identifi edas persistently dangerous, 3) must have higher academic performancethan the sending school, and 4) may not be new schools.PurposeA broad statement of the goals, in terms of meeting public service needs,that a department is organized to meet.Reading FirstProgram focuses on implementing proven method of early readinginstruction in classrooms. States and districts receive support to applyscientifi cally based reading research and the proven instructional andassessment tools consistent with this research to ensure that all childrenlearn to read well by the end of third grade.RESACentral Carolina Regional Education Service AllianceReserveAn account used either to set aside budgeted revenues that are notrequired for expenditure in the current budget year or to earmarkrevenues for a specifi c future purpose.ReservesReserves are credit balances which record the segregation of assetsfor some future use and which are, therefore, not available for furtherappropriation or expenditure.ResolutionA special or temporary order of a legislative body; an order of a legislativebody requiring less legal formality than an ordinance or statute.405 FY <strong>2007</strong>-<strong>08</strong> <strong>Plan</strong> for Student Success
GlossaryResourcesTotal amounts available for appropriation including estimated revenues,fund transfers, and beginning balances.RevenueSources of income fi nancing the operations of government.Revenue BondThis type of bond is backed only by the revenues from a specifi c enterpriseor project, such as a hospital or toll road.Revenue CodesRevenues received by a local education agency are classifi ed by sourceof revenue by category and/or purpose within each source. The majorsources of revenue are:1. State2. Federal3. <strong>County</strong> Appropriation4. Supplemental Taxes5. Other revenuesRollup BalancesThe fi nancial computer system will check available balances at theprogram code level rather that at the individual account level whenpayments are processed. Expenditures will be allowed as long as fundsare available overall in the program. Rollups can be at the level code.Salary AuditA verifi cation by the Department of <strong>Public</strong> Instruction that the amountpaid to the individual is in accordance with the certifi ed salary schedule.SAPStudent Assistant ProgramSATThe SAT is a national exam designed to measure a student’s chance ofsuccess at the college level.S/CHHMP<strong>School</strong>/Community Helping Hands Mentoring Program<strong>School</strong>An organizational subdivision of a school system consisting of a groupof pupils composed of one or more grade groups, organized as one unitwith an assigned principal, or person acting in the capacity of principal, togive instruction of the type defi ned in the NC Standard Course of Study,and housed in a school plant of one or more buildings.<strong>School</strong> Improvement <strong>Plan</strong>All LEAs must delineate a set of student performance goals aimed atincreasing student achievement. These goals shall address specifi c,measurable goals for all student performance indicators adopted bythe state board. Locally developed student performance goals must bestated in terms of three-to fi ve-year student performance goals, includingannual milestones to measure progress in meeting those goals.SCOSStandard Course of StudySalaryAn employee’s salary includes: (1) the amount of compensation to whichthe employee is entitled during the year from the salary schedule, (2) theamount of longevity pay, if any, to which the employee is entitled duringthe year, and (3) the amount of local supplement, if applicable, to whichthe employee is entitled during the school year.SDPStudent Due ProcessSecondary Budget ManagerSecondary budget managers are assistant principals or a cabinetmember may establish central offi ce administrators as secondary budgetmanager.406
GlossarySelf-Contained Classroom - Exceptional ChildA separate class for exceptional children receiving special education formore than 60 percent of the school day.Self-Contained - Exceptional ChildA self-contained student refers to an exceptional student who is taught ina separate class by exceptional children teachers for at least 60 percentof his or her instructional day.Service LeaseA lease under which the lessor maintains and services the asset.Service LevelServices or products which comprise actual or expected output of a givenprogram. Focus is on results, not measures of workload.SESSocio-Economic StatusSFSquare FootageShort Term DisabilityThe length of short-term disability includes two months waiting periodand 12 months of benefi ts for a total of 14 months.SIP<strong>School</strong> Improvement <strong>Plan</strong>SIQStudent Information QuestionnaireSISStudent Information <strong>System</strong>Site-based BudgetingA decentralized budget process whereby budget preparation anddevelopment are based on individual school (and department) sites.Source of RevenueRevenues are classifi ed according to their source or point of origin.SRO<strong>School</strong> Resource Offi cerSSL/VPNSecure Sockets Layer/Virtual Private NetworkSSTSupport Services TeacherState Allotted Positions/Months of EmploymentPositions or months of employment allotted and paid from the State<strong>Public</strong> <strong>School</strong> Fund.State FormulaThe calculations used by the state to fund various allotments to thelocal education agency. Formulas can be based on number of positionscalculated on average daily membership (ADM), months of employment(MOE), or fl at dollar amounts.State <strong>Public</strong> <strong>School</strong> FundAppropriations for the current operating expenses of the public schoolsystem from monies made available to the local school administrativeunit by the State Board of Education.STIFState Treasurer’s Investment FundStudent AccountingThe data collection system regarding student enrollment, membership,attendance, and withdrawal from membership in the public schools.The Student Information Management <strong>System</strong> (SIMS), or other UniformEducation Reporting <strong>System</strong> (UERS) compliant systems, are the offi cialmeans by which this data is reported to the Department of <strong>Public</strong>Instruction.407 FY <strong>2007</strong>-<strong>08</strong> <strong>Plan</strong> for Student Success
GlossarySubsistenceSubsistence is an allowance related to lodging, meal costs, andgratuities.Substitute TeacherSubstitute teacher is a person whose credentials have been evaluatedby the local superintendent, who has been determined to be capable ofperforming substitute teaching duties, and who has been approved bythe local board of education.Supplemental AppropriationAn additional appropriation made by the governing body after the budgetyear or biennium has started.Supplemental RequestPrograms and services which departments would like to have added (inpriority order) over their target budget, or if revenue received is greaterthan anticipated.Supporting ServicesSupporting services are those services that provide administrative,technical, personal, and logistical support to facilitate and enhanceinstruction. Supporting services exist to sustain and enhance instruction,rather than add entities within themselves.SWDStudents With DisabilitiesTBITraumatic Brain InjuryTELSTeacher Enhancement and Leadership <strong>System</strong>TIMSTransportation Information Management <strong>System</strong>Tax LevyThe resultant product when the tax rate per one hundred dollars ismultiplied by the tax base.TaxesCompulsory charges levied by a government for the purpose of fi nancingservices performed for the common benefi t of the people. This term doesnot include specifi c charges made against particular persons or propertyfor current or permanent benefi t, such as special assessments.Teacher CertificationArea in which a teacher is qualifi ed and certifi ed to teach.Tenth Day AdjustmentsAdjustments to specifi c allotments following receipt of actual membershipdata for the tenth day of school.TextbooksThe textbook allocation is a state source of funds. The textbook accountis a credit balance from the state.Title IA federally-funded categorical and supplementary program whichprovides federal assistance to state and local school systems throughthe Elementary and Secondary Education Act of 1965 (ESEA). Theprogram was reauthorized in 1994, by the Improving America’s <strong>School</strong>sAct. Its goals are to help low-achieving children succeed in theclassroom, attain grade level profi ciency, and acquire the higher levelskills that all children are expected to master.Title I <strong>School</strong>A Title I school is one that receives federal Title I funds, which are usedto support instructional programs (such as K-5 literacy and preschool),professional development and parental involvement. In <strong>Wake</strong> <strong>County</strong>,a school must have 35 percent or more children eligible for free orreduced-price lunch to qualify.4<strong>08</strong>
GlossaryTitle VIThe purpose of Title VI is to provide formula grants to assist states indeveloping the assessments required under the No Child Left BehindESEA legislation, and competitive grants to states to support collaborativeefforts with Institutions of Higher Education.TMACThreat Management Through Assessment and CounselingTOWSRFTest of Silent Word Reading FluencyTPCTeacher Parent ConsultantTrainable Mentally HandicappedTrainable mentally handicapped (TMH) refers to a student who issignifi cantly below general cognitive functioning and who has a reducedrate of learning which adversely affects that student’s educationalperformance.Transfers In/OutAmounts transferred from one fund to another to assist in fi nancing theservices for the recipient fund.TRATechnology Resource Associates, Inc.Triangle High FiveBusiness leaders and educators create unique regional consortium tosupport high schoolsFive major Triangle business leaders and fi ve public school systemscreated a unique public/private sector high school reform initiativedesigned to increase the number of graduates, reduce the dropout rate,and better prepare students for successful lives after high school. Entitled“High Five: Regional Partnership for High <strong>School</strong> Excellence,” the fi veyear,$2.5 million project represents the fi rst collaborative venture for thefi ve major area public school systems.The partnership, created in April, 2004, is designed to support andenhance public high school performance by developing a regionalapproach in sharing best practices; facilitating collaboration betweenschool districts, colleges and universities; identifying alternative deliverysystems to reach at-risk students and broadening community support.The regional partnership’s funding comes from The News & ObserverPublishing Company, Blue Cross and Blue Shield of North CarolinaFoundation, SAS, Progress Energy and Capitol Broadcasting Company.The fi ve Triangle public school systems participating in the program are:Chapel Hill-Carrboro, Durham <strong>County</strong>, Johnston <strong>County</strong>, Orange <strong>County</strong>and <strong>Wake</strong> <strong>County</strong>.VisionAll students graduating with high school diplomas will be well prepared topursue higher education and careers of their choice.Goals• 100 percent graduating high school by 2013• 90 percent completing college tech prep or college university prepcourse of study by 2009• 80 percent meeting course requirements for UNC system admissionby 2009Initiatives• Facilitate collaboration between the school districts.• Identify best practices in high school reform and collaborate on thosepractices.• Identify alternative learning environments and course deliverysystems and develop standards for them.• Promote partnership with families, communities, businesses, theState Board of Education, and local higher education institutions.• Promote state policy review and modifi cations to support studentsuccess.• Identify and obtain fi nancial resources to support reform.TRTTechnology Resource Teacher409 FY <strong>2007</strong>-<strong>08</strong> <strong>Plan</strong> for Student Success
GlossaryTrust and Agency FundRevenues and expenditures for trust and agency funds as needed by thelocal education agency to account for trust and agency arrangementssuch as endowments, funds of individuals held by the <strong>School</strong> FinanceOffi cer, and special funds of individual schools.TSDTechnology Services DivisionTTFTransition Training FacilitatorTydings AmendmentFederal law provides that certain federal funds not obligated during thefi rst year of allotment shall remain available for obligation and expenditurefor one additional year. Federal grant periods vary. Therefore, eachgrant must be reviewed to determine if the Tydings Amendment willapply. Since the federal fi scal year begins October 1 and the state fi scalyear begins July 1, many grant periods can be active up to 27 monthswhen provisions of the Tydings Amendment are applicable.It is essentially the amount of money still available for future purposes.Uniform Budget FormatThe State Board of Education, in cooperation with the Local GovernmentCommission, shall cause to be prepared and promulgated a standardbudget format for use by local school administrative units throughout thestate. The format shall be organized to enable the board of educationand the board of county commissioners to accomplish the local fi scalpolicies embodied in the uniform budget format, facilitate the control andfi scal management of the local school administrative unit, and facilitatethe gathering of accurate and reliable fi scal data on the operation of thepublic school system.Uniform Chart of AccountsIn 1975, the General Assembly enacted a law requiring a uniformaccounting system for all local education agencies effective July 1, 1976.The NC <strong>Public</strong> <strong>School</strong>s Uniform Chart of Accounts is a complete listingof account codes for recording public school expenditures by differentdimensions available for LEAs. It classifi es the individual accounts byfund, function, program report code, and object.Unreserved Fund BalanceThe portion of a fund’s balance that is not restricted for a specifi c purposeand is available for general appropriation.UERSUniform Education Reporting <strong>System</strong>. The comprehensive systemby which LEAs and Charter <strong>School</strong>s report data electronically to theDepartment of <strong>Public</strong> Instruction. Some components of UERS includeSIMS (Student Information Management <strong>System</strong>), and expenditurereporting in compliance with the Uniform Chart of Accounts.Undesignated Fund BalancePortion of the total fund balance available for appropriation which isuncommitted at year end.UPSUninterruptible Power SupplyUSDAUnited States Department of AgricultureUser ChargesThe payment of a fee for direct receipt of a public service by the partywho benefi ts from the service.Unencumbered BalanceThe amount of an appropriation that is neither expended nor encumbered.410
GlossaryVariable CostA cost that increases/decreases with increases/decreases in the amountof service provided such as the payment of a salary.WorkweekFor overtime purposes, according to the Fair Labor Standards Act, theworkweek is a fi xed and regularly recurring period of 168 hours - sevenconsecutive 24-hour periods. A nonexempt employee is entitled toovertime at time and one-half for all hours worked over 40 in a workweek.It may begin on any day of the week and any hour of the day establishedby the employer.WADEWilson Assessment of Decoding and EncodingWaiver for Unavailable CategoriesProvides a separate account into which LEAs may transfer funds to coverthe purchases of items (not personnel) not found in the Chart of Accountsfor other categories.Year-round EducationReorganization of the school calendar into instructional blocks withvacations distributed across the calendar year so that learning iscontinuous throughout the year.Year-round PayAnnual salary distributed in twelve payments for personnel employedless than twelve months in a year-round school.WANWide Area NetworkWCPSS<strong>Wake</strong> <strong>County</strong> <strong>Public</strong> <strong>School</strong> <strong>System</strong>WCSO<strong>Wake</strong> <strong>County</strong> Sherriff’s Offi ceWEP<strong>Wake</strong> Education PartnershipWISTWord Identifi cation and Spelling Test411 FY <strong>2007</strong>-<strong>08</strong> <strong>Plan</strong> for Student Success
Notes412
IndexAcademically Gifted Teacher Positions, 172Accelerated Learning Program, 192Activity Buses, 228Activity Bus Service Trucks (Local Trucks), 270Advancement VIA Individual Determination (AVID), 175Analysis of Increase (Decrease) in Months of Employment, 121-127Anticipated Revenue, 94-1<strong>08</strong>State <strong>Public</strong> <strong>School</strong> Fund, 94-96Local Current Expense Fund, 97-102Federal Grant Fund, 102-105Capital Outlay Fund, 106-107Multiple Enterprise Fund, 107-1<strong>08</strong>All Funds, 1<strong>08</strong>Asphalt Replacement, 3<strong>08</strong>Assignments for Area Assistant Superintendents, 58-64Eastern, 59Central, 60Northern, 61South Central, 62Southern, 63Western, 64Assistant Principals, 142-143, 282Audiologists, 197Benefi ts Technician, 207Blueprint for Excellence 2006 Capital Improvement <strong>Plan</strong>, 136-137What Will the Capital <strong>Plan</strong> Provide, 136-137Board of Education and Administrative Cabinet, 25-30Board of Education - Workshop/Allowable Travel, 246Bookkeeping Staff (Transportation), 256Budget Activities During FY 2005-06 to Prepare FY 2006-07 Budget,79-80Budget Administration and Management Process, 81-82Organization, 81Expenditure Control and Approvals, 81Encumberance Control, 81Transfers, 82Amendments, 82Funds Checking, 82Management Information and Reporting, 82Quarterly Financial Reviews, 82Fraud Hotline, 82Budgetary Assumptions, 339-357State Sources, 339Local Sources, 339Federal Sources, 339Enterprise Funds, 339Enrollment, 339Salary Increases, 340Fringe Benefi ts, 340State and Local Allotment Formulas, 341-351Federal Grants Descriptions, 352-354Federal Allotment Formulas, 354-355Budget Flexibility with State Allotments, 356ABC Financial Flexibility, 357Budgetary Assumptions for Anticipated Revenue, 93Budget and Financial Policies, 68-71Reporting Entity, 68<strong>Public</strong> <strong>School</strong> Financing, 68Budget Basis, 68-69Budget (Board) Policies, 70-71Cash Management Policies and Practices, 71Fund Balance, 71Interfund Transactions, 71Budget at a Glance, 4-5Budget Highlights, 11-24Total Budget, 11Where are Funds Spent?, 12State <strong>Public</strong> <strong>School</strong> Fund, 12<strong>County</strong> Appropriation, 13Local Current Expense Fund, 18Federal Grants Fund, 20Multiple Enterprise Fund, 20Capital Outlay, 21Financial Reporting Recognition, 22Fiscal Accountability, 23Budget by Object Code – Operating Budget, 109-115Budget by Object Code History - Operating Budget, 366Budget Process (Introduction), 10Budget Process (Organization), 72-77Operating Budget, 72Budget Cycle, 72413 FY <strong>2007</strong>-<strong>08</strong> <strong>Plan</strong> for Student Success
IndexGoal 20<strong>08</strong>, 73Budget Guidelines, 74Budget Process, 75Capital Budget, 76-77Impact of Capital Budget on the Operating Budget, 77Budget Reductions, 314-319Middle <strong>School</strong> Resource Offi cers, 314Balance in over/under, 315Facilities <strong>Plan</strong>ning and Construction, 316Summer Testing and Review, 317Reduction of the Summer Help for the Bus Garage, 318Eliminate Payment - New Bus Drivers, Initial Training, 319Budget Resolution, 89-92Bus Drivers, 222-223Bus Drivers - Substitutes, 225Bus Mechanics, 230Bus Parts and Supplies, 226-227Bus Safety Assistants, 229Capital Budget, 272-274Career-Technical Education Months, 170Challenged <strong>School</strong>s Program, 194Charter <strong>School</strong>s, 241-243Changes in Standards/Expectations, 361-362Child Nutrition Services, 211-212Citizen Involvement, 78What You Can Do, 78Classroom Materials, Instructional Supplies and Equipment, 146Classroom Teacher, 139Communications Department Advertising, 210Computer and Diagnostic Software for Mechanics, 265Contract Services, 151Conversions, Traditional to Year-Round, 275-288Costs to Administer Tests, 182Counselors, 187-188, 280<strong>County</strong> Appropriation and Fund Balance History, 86Courier, 202Craftsman, Multi-Task Employees, and Master Craftsman Plumbers,306Criminal Record Checks, 203-204Curriculum and Instruction Months (K-5), 171Custodial Dollars, 285Custodial Focus Team, 303-305Custodial - New Square Feet, 215Director of Communications, 209District Financial Structure, 83-85District Legal Authority, 83Finance Structure, 83Basis of Presentation – Fund Accounting, 83-84Purpose Codes, 84Program Codes, 84Object Codes, 84-85Level Codes, 85Cost Center Codes, 85Debt Obligation, 85Drivers - Budget, 6Early Hires, Purchased Services and Staff Development forNew <strong>School</strong>s, 155-157Eastern Area <strong>School</strong>s, 158-159East <strong>Wake</strong> High Whole <strong>School</strong> Conversion, 288-292English as a Second Language (ESL), 174, 299Exceptional Children - Cars and Buses, 234Exceptional Children - Parent Contract, 237Exceptional Children - Pupil Contract, 224Extra Duty Budget for New <strong>School</strong>s, 199-200Extra Duty Pay - High <strong>School</strong> Band and Strings Teachers, 293Facility Leases, 260-262Fixed Asset Replacement and Capital Budget, 266-272Forklift (Replacement), 271Fund Balance, 87Questions and Answers about Fund Balance, 87History of Appropriated Fund Balance, 88History of Undesignated (not appropriated) Fund Balance, 88Fiscal Accountability, 251-256Fuel, 226-227Fuel Management <strong>System</strong> (FMS), 253Fuel Truck, 233Government Finance Offi cers Association Award, 31Graduation and Rehearsal Facilities, 167Grants Ending, 331-336Smaller Learning Communities Grant, 331-332414
IndexEducational Technology Grant, 333Title V Innovative Education Learning Strategies, 334ESEA Title I <strong>School</strong> Improvement, 335Project Enlightenment Legislative Appropriation, 336Grounds Equipment Replacement, 269High Lift, 302High <strong>School</strong> Intervention Coordinators, 198Historical Comparison of Expenditures Per Pupil(excluding child nutrition), 374-376Historical Comparison of Revenues and Expenditures, 363-364Human Resources Personnel, 201HVAC Filter Upgrades, 307Indoor Air Quality, 307, 310In-<strong>School</strong> Suspension Teacher Months, 177, 277Instrument Repair, 154Insurance, 251-252Integrated Pest Managment Staffi ng, 219-221Internal Audit, 248, 330Intersession Teachers and Teacher Assistants, 244, 286Lacrosse Coaches for High <strong>School</strong>s, 301Leases - Real Estate Services, 261-262Liquifi ed Propane (LP) Forklift, 266Local Literacy Months, 176, 275Magnetic Ballast in Flourescent Lighting, 311Maintenance Dollars, 284Maintenance – New Square Feet, 216Maintenance – Landscape of New Acreage, 217Media Specialists, 173, 276Membership Trends, 337-338Historical and Projected Enrollment 1996-2016, 338Membership Growth FY 2001-20<strong>08</strong>, 338Message from the Superintendent, 1-3Minimum Competency Teachers, 180Mobile Units, 260Ninth Grade Centers, 166Noncertifi ed Salaries, 295-296NovaNet Teachers, 181Oil, 226-227Occupational Therapists, 193One-time costs from 2006-07, 321-330Technology, 321One-time allotments to schools in 2006-07 only, 322-323Tenth Day Overages, 324Capital Outlay, 325Salary Audit, 326Special Project - Credit Checking Contract, 327One-time allotment Central Services leave situation, 328Security, 329Internal Audit, 330Online Resources for New <strong>School</strong>s, 178Operations Staff, 254Organization Charts, 51-57<strong>Wake</strong> <strong>County</strong> <strong>Public</strong> <strong>School</strong> <strong>System</strong>, 51Chief of Staff, 52Administrative Services, 53Facilities and Operations, 54Instructional Services, 55Technology Services, 56Communications, 57OSHA Nurse, 205Over/Under, Balance, 315Parent Contracts - Exception Children, 239Payroll Technicians, 2<strong>08</strong>Perfect Attendance - Incentive for Transportation, 238Performance Pay, 295Physical Therapists, 195Principals, 147Processing Technician, 218Psychologists, 190, 279Rate Increases, 257-258Real-Time Inventory for Parts Department, 255Reporting Entity and It’s Services, The, 65-67The <strong>School</strong> <strong>System</strong>, 65Reporting Entity, 66Economic Condition and Outlook, 66-67Resolution, Budget, 89-92Revenue by Source History-Operating Budget, 365Rubber Track Surfaces, 307Safety and Security, 263-265Safety/Recruitment Offi cer for Transportation, 264Salary Schedules, 281, 297-298<strong>School</strong>-Based Clerical Allotment, 144-145415 FY <strong>2007</strong>-<strong>08</strong> <strong>Plan</strong> for Student Success
Index<strong>School</strong> Buses, 240<strong>School</strong> Resource Offi cer (SRO), 245, 314<strong>School</strong> Psychologists (AG), 300<strong>School</strong> Technology, 249Senior Budget Analyst, 206Service Trucks, 235Shift local costs to state resources, 320Technology, 320Sick Leave Substitutes, 149Social Workers, 191, 278South Central Area <strong>School</strong>s, 160-161Southern Area <strong>School</strong>s, 162-163Special Education Teacher Assistants, 185-186Special Education Teachers, 183-184Speech Therapists, 189Staff Allotments, 116-117Months of Employment, 116Allotment Process, 116-117Flexibility, 117Conversions, 117Effi cient and Effective Use of Resources, 117Staff Budget, 118-120Staff Development, 152Staff Development - Bus Drivers, Bus Substitutes and Bus SafetyAssistants, 236Staff History, 371-373Strategic <strong>Plan</strong>s, 33-50<strong>Wake</strong> <strong>County</strong> <strong>Public</strong> <strong>School</strong> <strong>System</strong>, 34-35Administrative Services Division, 36-38Auxiliary Services Division, 38-39Communications Division, 40-41Instructional Services Division, 42-47Technology Services Division, 48-50Statement of Revenues, Expenditures, and Changes in FundBalance, 135Student Achievement, 358-360Student Due Process and Policy, 168-169Substitutes - 12 MOE staff planning, YR <strong>School</strong>s, 247, 287Swimming Pool Rental for High <strong>School</strong>s, 179, 257Tax Data, 377-380Counties with the Largest <strong>School</strong> District in NorthCarolina, 377Counties in North Carolina that Surround <strong>Wake</strong><strong>County</strong>, 377Historical Comparison of Assessed Value of TaxableProperty, 377Historical Comparison of Property Tax Levies andCollections, 378Historical Comparison of Property Tax Rates – AllOverlapping Governments, 379Ten Principal Taxpayers for <strong>Wake</strong> <strong>County</strong>, 380Bonded Debt, 380Teacher Assisants, 140-141Teacher Assistants as Substitutes, 150Textbooks, 158Tires, 226-227Traditional to Year-Round Conversion, 275-288Transfer Security functions to M&O, 263Transitional Counselors, 196Transportation - Knightdale District, 232Travel, 153Trends/Events/Initiatives, 7-9Uniform Format, 128-134Uniform Budget Format, 128-129Summary of Revenues and Expenditures, 130-131Revenues from State & Federal Sources, 132-133Capital Outlay, 134Utilities - New Square Feet, 213-214Utility Rate Increase, 258-259, 283Vehicles (Replacement), 267<strong>Wake</strong> <strong>County</strong> Demographics, 381-384Population, 381Households, 382Income and Poverty, 382Housing and Housing Characteristics, 382-383Employment, 383Education, 384Transportation, 384Western Area <strong>School</strong>s, 164-165416