- Page 2 and 3: Letter to County Commissioners3600
- Page 4 and 5: Table of ContentsManagement Informa
- Page 6 and 7: Table of ContentsSwimming Pool Rent
- Page 9 and 10: Message from the Superintendentcent
- Page 11 and 12: Budget at a GlanceDaily Operations
- Page 13: DriversThe changes in funding inclu
- Page 17 and 18: Budget ProcessBudget ProcessBudget
- Page 19 and 20: Budget HighlightsWhere are Funds Sp
- Page 21 and 22: Budget HighlightsGrowth-Related Inc
- Page 23 and 24: Budget HighlightsSystemwide IssuesR
- Page 25 and 26: Budget HighlightsEach year there ar
- Page 27 and 28: Budget HighlightsFederal Grants Fun
- Page 29 and 30: Budget Highlightsmeans that more sc
- Page 31 and 32: Budget HighlightsSeptember2001 toCi
- Page 33 and 34: Board of Education and Administrati
- Page 35 and 36: Board of Education and Administrati
- Page 37 and 38: Board of Education and Administrati
- Page 39 and 40: Notes32
- Page 41 and 42: Wake County Public School System St
- Page 43 and 44: Wake County Public School System St
- Page 45 and 46: Wake County Public School System St
- Page 47 and 48: Wake County Public School System St
- Page 49 and 50: Wake County Public School System St
- Page 51 and 52: Wake County Public School System St
- Page 53 and 54: Wake County Public School System St
- Page 55 and 56: Wake County Public School System St
- Page 57 and 58: Wake County Public School System St
- Page 59 and 60: Organization ChartsChief of StaffTe
- Page 61 and 62: Organization ChartsFacilities and O
- Page 63 and 64: Organization ChartsTechnology Servi
- Page 65 and 66:
Assignments for Area Superintendent
- Page 67:
Assignments for Area Superintendent
- Page 70 and 71:
Assignments for Area Superintendent
- Page 72 and 73:
The Reporting Entity and Its Servic
- Page 74 and 75:
The Reporting Entity and Its Servic
- Page 76 and 77:
Budget and Financial Policiesthroug
- Page 78 and 79:
Budget and Financial Policies8170.2
- Page 80 and 81:
Budget ProcessGoal 2008WCPSS is com
- Page 82 and 83:
Budget ProcessBudget ProcessSep Oct
- Page 84 and 85:
Budget ProcessApril 2006: Staff pre
- Page 86 and 87:
Budget Activities During FY 2006-07
- Page 88 and 89:
Budget Administration and Managemen
- Page 90 and 91:
District Financial StructureDistric
- Page 92 and 93:
District Financial StructureLevel C
- Page 94 and 95:
Fund BalanceQuestions and Answers a
- Page 96 and 97:
Budget ResolutionWAKE COUNTY PUBLIC
- Page 98 and 99:
Budget ResolutionEducational Media
- Page 100 and 101:
Budgetary Assumptions for Anticipat
- Page 102 and 103:
Anticipated RevenuesSource of Incom
- Page 104 and 105:
Anticipated RevenuesSource of Incom
- Page 106 and 107:
Anticipated RevenuesSource of Incom
- Page 108 and 109:
Anticipated RevenuesSource of Incom
- Page 110 and 111:
Anticipated RevenuesSource of Incom
- Page 112 and 113:
Anticipated RevenuesSource of Incom
- Page 114 and 115:
Anticipated RevenuesSource of Incom
- Page 116 and 117:
Budget by Object Code - Operating B
- Page 118 and 119:
Budget by Object Code - Operating B
- Page 120 and 121:
Budget by Object Code - Operating B
- Page 122 and 123:
Budget by Object Code - Operating B
- Page 124 and 125:
Staff Allotmentsassistants. These i
- Page 126 and 127:
Staff BudgetIncrease/(Decrease)2006
- Page 128 and 129:
Analysis of Increase (Decrease) in
- Page 130 and 131:
Analysis of Increase (Decrease) in
- Page 132 and 133:
Analysis of Increase (Decrease) in
- Page 134 and 135:
Analysis of Increase (Decrease) in
- Page 136 and 137:
Uniform Format115C-431 shall, insof
- Page 138 and 139:
Uniform FormatCountyAppropriationLo
- Page 140 and 141:
Uniform FormatRevenues from Local a
- Page 142 and 143:
Statement of Revenues, Expenditures
- Page 144 and 145:
Blueprint for Excellence 2006 Capit
- Page 146 and 147:
Growth RequestsInitiative: Classroo
- Page 148 and 149:
Growth Requests2009-10 MOE Amount C
- Page 150 and 151:
Growth Requests2008-09AdditionalAP
- Page 152 and 153:
Growth Requests2008-09 MOE Cost Cod
- Page 154 and 155:
Growth RequestsInitiative: Principa
- Page 156 and 157:
Growth RequestsInitiative: Sick Lea
- Page 158 and 159:
Growth RequestsInitiative: Contract
- Page 160 and 161:
Growth RequestsInitiative: Travel f
- Page 162 and 163:
Growth RequestsInitiative: Early hi
- Page 164 and 165:
Growth Requests2009-10 MOE Amount C
- Page 166 and 167:
Growth RequestsIncrease Requested 2
- Page 168 and 169:
Growth RequestsIncrease Requested 2
- Page 170 and 171:
Growth RequestsIncrease Requested 2
- Page 172 and 173:
Growth RequestsIncrease Requested 2
- Page 174 and 175:
Growth RequestsInitiative: Graduati
- Page 176 and 177:
Growth RequestsKeep same monitors o
- Page 178 and 179:
Growth RequestsInitiative: K-5 Curr
- Page 180 and 181:
Growth RequestsInitiative: Media Sp
- Page 182 and 183:
Growth RequestsInitiative: Advancem
- Page 184 and 185:
Growth RequestsInitiative: In-Schoo
- Page 186 and 187:
Growth RequestsInitiative: Swimming
- Page 188 and 189:
Growth RequestsInitiative: NovaNet
- Page 190 and 191:
Growth RequestsInitiative: Special
- Page 192 and 193:
Growth RequestsInitiative: Special
- Page 194 and 195:
Growth RequestsInitiative: School c
- Page 196 and 197:
Growth RequestsInitiative: Speech T
- Page 198 and 199:
Growth RequestsInitiative: Social w
- Page 200 and 201:
Growth RequestsInitiative: Occupati
- Page 202 and 203:
Growth RequestsInitiative: Physical
- Page 204 and 205:
Growth RequestsInitiative: Audiolog
- Page 206 and 207:
Growth RequestsInitiative: Increase
- Page 208 and 209:
Growth RequestsInitiative: Human Re
- Page 210 and 211:
Growth RequestsInitiative: Criminal
- Page 212 and 213:
Growth RequestsInitiative: Occupati
- Page 214 and 215:
Growth RequestsInitiative: Benefi t
- Page 216 and 217:
Growth RequestsInitiative: Director
- Page 218 and 219:
Growth RequestsInitiative: Child Nu
- Page 220 and 221:
Growth RequestsInitiative: Utility
- Page 222 and 223:
Growth RequestsInitiative: Custodia
- Page 224 and 225:
Growth RequestsInitiative: Maintena
- Page 226 and 227:
Growth RequestsInitiative: Integrat
- Page 228 and 229:
Growth RequestsThe effects created
- Page 230 and 231:
Growth RequestsImplementation Timel
- Page 232 and 233:
Growth RequestsInitiative: Bus Driv
- Page 234 and 235:
Growth Requests2009-1011,13910,9147
- Page 236 and 237:
Growth RequestsInitiative: Bus Safe
- Page 238 and 239:
Growth RequestsInitiative: Salary d
- Page 240 and 241:
Growth RequestsInitiative: Fuel Tru
- Page 242 and 243:
Growth RequestsInitiative: Service
- Page 244 and 245:
Growth RequestsInitiative: Exceptio
- Page 246 and 247:
Growth RequestsInitiative: Parent C
- Page 248 and 249:
Growth RequestsInitiative: Charter
- Page 250 and 251:
Growth RequestsCHARTER SCHOOL VERIF
- Page 252 and 253:
Growth RequestsInitiative: School R
- Page 254 and 255:
Growth RequestsInitiative: Substitu
- Page 256 and 257:
Growth RequestsInitiative: School T
- Page 258 and 259:
Systemwide - Fiscal AccountabilityI
- Page 260 and 261:
Systemwide - Fiscal AccountabilityI
- Page 262 and 263:
Systemwide - Fiscal AccountabilityI
- Page 264 and 265:
Systemwide - Rate IncreaseInitiativ
- Page 266 and 267:
Systemwide - Rate Increase2009-10Pr
- Page 268 and 269:
Systemwide - Facility LeasesInitiat
- Page 270 and 271:
Systemwide - Safety and SecurityIni
- Page 272 and 273:
Systemwide - Safety and SecurityIni
- Page 274 and 275:
Systemwide - Fixed Asset Replacemen
- Page 276 and 277:
Systemwide - Fixed Asset Replacemen
- Page 278 and 279:
Systemwide - Fixed Asset Replacemen
- Page 280 and 281:
Systemwide - Fixed Asset Replacemen
- Page 282 and 283:
Commitments by the Board of Educati
- Page 284 and 285:
Commitments by the Board of Educati
- Page 286 and 287:
Commitments by the Board of Educati
- Page 288 and 289:
Commitments by the Board of Educati
- Page 290 and 291:
Commitments by the Board of Educati
- Page 292 and 293:
Commitments by the Board of Educati
- Page 294 and 295:
Commitments by the Board of Educati
- Page 296 and 297:
Commitments by the Board of Educati
- Page 298 and 299:
Commitments by the Board of Educati
- Page 300 and 301:
Commitments by the Board of Educati
- Page 302 and 303:
New Programs and Increases to Exist
- Page 304 and 305:
New Programs and Increases to Exist
- Page 306 and 307:
New Programs and Increases to Exist
- Page 308 and 309:
New Programs and Increases to Exist
- Page 310 and 311:
New Programs and Increases to Exist
- Page 312 and 313:
New Programs and Increases to Exist
- Page 314 and 315:
New Programs and Increases to Exist
- Page 316 and 317:
New Programs and Increases to Exist
- Page 318 and 319:
New Programs and Increases to Exist
- Page 320 and 321:
SavingsThe Savings Section is a com
- Page 322 and 323:
Savings - Budget ReductionsInitiati
- Page 324 and 325:
Savings - Budget ReductionsInitiati
- Page 326 and 327:
Savings - Budget ReductionsInitiati
- Page 328 and 329:
Savings - One-Time Costs from 2006-
- Page 330 and 331:
Savings - One-Time Costs from 2006-
- Page 332 and 333:
Savings - One-Time Costs from 2006-
- Page 334 and 335:
Savings - One-Time Costs from 2006-
- Page 336 and 337:
Savings - One-Time Costs from 2006-
- Page 338 and 339:
Savings - Grants EndingInitiative:
- Page 340 and 341:
Savings - Grants EndingInitiative:
- Page 342 and 343:
Savings - Grants EndingInitiative:
- Page 344 and 345:
Membership TrendsThe Wake County Pu
- Page 346 and 347:
Budgetary AssumptionsState SourcesI
- Page 348 and 349:
Budgetary AssumptionsSTATE/LOCAL AL
- Page 350 and 351:
Budgetary AssumptionsSTATE/LOCAL AL
- Page 352 and 353:
Budgetary AssumptionsSTATE/LOCAL AL
- Page 354 and 355:
Budgetary AssumptionsSTATE/LOCAL AL
- Page 356 and 357:
Budgetary AssumptionsSTATE/LOCAL AL
- Page 358 and 359:
Budgetary AssumptionsSTATE/LOCAL AL
- Page 360 and 361:
Budgetary AssumptionsPRC FEDERAL GR
- Page 362 and 363:
Budgetary AssumptionsFEDERAL ALLOTM
- Page 364 and 365:
Budgetary AssumptionsALLOTMENT CATE
- Page 366 and 367:
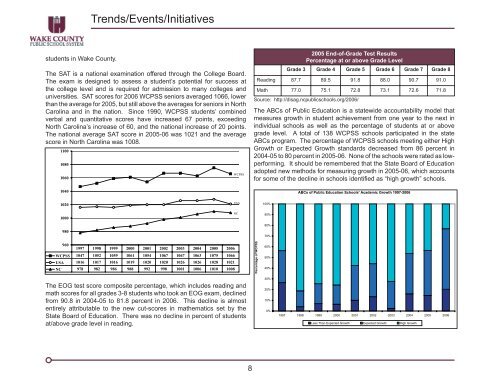
Student AchievementFigure 3:Mathema
- Page 368 and 369:
Changes in Standards/ExpectationsST
- Page 370 and 371:
Historical Comparison of Revenues a
- Page 372 and 373:
Revenue by Source History - Operati
- Page 374 and 375:
Budget by Object Code - Operating B
- Page 376 and 377:
Budget by Object Code - Operating B
- Page 378 and 379:
Staff HistoryThe Staff History show
- Page 380 and 381:
Staff History2003-04 2004-2005 2005
- Page 382 and 383:
Historical Comparison of Expenditur
- Page 384 and 385:
Tax DataAs reported in The North Ca
- Page 386 and 387:
Tax DataWAKE COUNTYHistorical Compa
- Page 388 and 389:
Wake County DemographicsWake County
- Page 390 and 391:
Wake County DemographicsIncrease in
- Page 392 and 393:
Notes385 FY 2007-08 Plan for Studen
- Page 394 and 395:
GlossaryAccrual BasisA basis of acc
- Page 396 and 397:
Glossarymaturity date). Bonds are p
- Page 398 and 399:
GlossaryCharter SchoolsA public sch
- Page 400 and 401:
GlossaryEHASEnvironmental Health an
- Page 402 and 403:
Glossaryequities which are segregat
- Page 404 and 405:
Glossaryneeds who have been properl
- Page 406 and 407:
Glossaryoperating expenses of the p
- Page 408 and 409:
Glossarygroups, or targets, that ar
- Page 410 and 411:
Glossarycalendar months. The fi rst
- Page 412 and 413:
Glossaryeffectiveness and effi cien
- Page 414 and 415:
GlossarySelf-Contained Classroom -
- Page 416 and 417:
GlossaryTitle VIThe purpose of Titl
- Page 418 and 419:
GlossaryVariable CostA cost that in
- Page 420 and 421:
IndexAcademically Gifted Teacher Po
- Page 422 and 423:
IndexEducational Technology Grant,