Using JCP format - Université de Mons
Using JCP format - Université de Mons
Using JCP format - Université de Mons

Create successful ePaper yourself
Turn your PDF publications into a flip-book with our unique Google optimized e-Paper software.
J. Chem. Phys., Vol. 112, No. 19, 15 May 2000 Hexa-functionalized C 60 <strong>de</strong>rivatives<br />
8561<br />
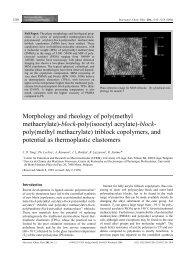
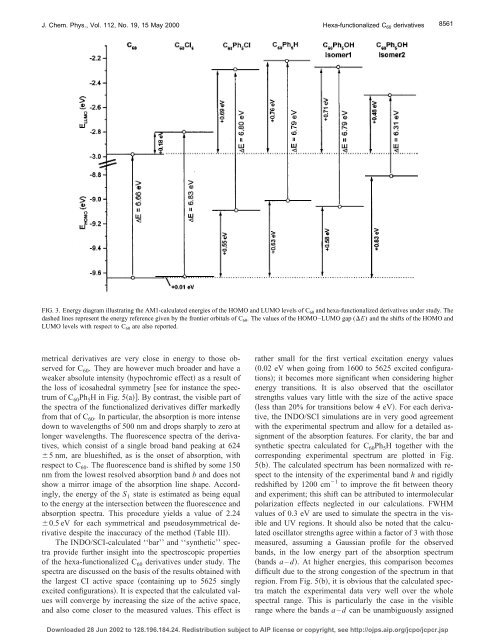
FIG. 3. Energy diagram illustrating the AM1-calculated energies of the HOMO and LUMO levels of C 60 and hexa-functionalized <strong>de</strong>rivatives un<strong>de</strong>r study. The<br />
dashed lines represent the energy reference given by the frontier orbitals of C 60 . The values of the HOMO–LUMO gap (E) and the shifts of the HOMO and<br />
LUMO levels with respect to C 60 are also reported.<br />
metrical <strong>de</strong>rivatives are very close in energy to those observed<br />
for C 60 . They are however much broa<strong>de</strong>r and have a<br />
weaker absolute intensity hypochromic effect as a result of<br />
the loss of icosahedral symmetry see for instance the spectrum<br />
of C 60 Ph 5 H in Fig. 5a. By contrast, the visible part of<br />
the spectra of the functionalized <strong>de</strong>rivatives differ markedly<br />
from that of C 60 . In particular, the absorption is more intense<br />
down to wavelengths of 500 nm and drops sharply to zero at<br />
longer wavelengths. The fluorescence spectra of the <strong>de</strong>rivatives,<br />
which consist of a single broad band peaking at 624<br />
5 nm, are blueshifted, as is the onset of absorption, with<br />
respect to C 60 . The fluorescence band is shifted by some 150<br />
nm from the lowest resolved absorption band b and does not<br />
show a mirror image of the absorption line shape. Accordingly,<br />
the energy of the S 1 state is estimated as being equal<br />
to the energy at the intersection between the fluorescence and<br />
absorption spectra. This procedure yields a value of 2.24<br />
0.5 eV for each symmetrical and pseudosymmetrical <strong>de</strong>rivative<br />
<strong>de</strong>spite the inaccuracy of the method Table III.<br />
The INDO/SCI-calculated ‘‘bar’’ and ‘‘synthetic’’ spectra<br />
provi<strong>de</strong> further insight into the spectroscopic properties<br />
of the hexa-functionalized C 60 <strong>de</strong>rivatives un<strong>de</strong>r study. The<br />
spectra are discussed on the basis of the results obtained with<br />
the largest CI active space containing up to 5625 singly<br />
excited configurations. It is expected that the calculated values<br />
will converge by increasing the size of the active space,<br />
and also come closer to the measured values. This effect is<br />
rather small for the first vertical excitation energy values<br />
0.02 eV when going from 1600 to 5625 excited configurations;<br />
it becomes more significant when consi<strong>de</strong>ring higher<br />
energy transitions. It is also observed that the oscillator<br />
strengths values vary little with the size of the active space<br />
less than 20% for transitions below 4 eV. For each <strong>de</strong>rivative,<br />
the INDO/SCI simulations are in very good agreement<br />
with the experimental spectrum and allow for a <strong>de</strong>tailed assignment<br />
of the absorption features. For clarity, the bar and<br />
synthetic spectra calculated for C 60 Ph 5 H together with the<br />
corresponding experimental spectrum are plotted in Fig.<br />
5b. The calculated spectrum has been normalized with respect<br />
to the intensity of the experimental band h and rigidly<br />
redshifted by 1200 cm 1 to improve the fit between theory<br />
and experiment; this shift can be attributed to intermolecular<br />
polarization effects neglected in our calculations. FWHM<br />
values of 0.3 eV are used to simulate the spectra in the visible<br />
and UV regions. It should also be noted that the calculated<br />
oscillator strengths agree within a factor of 3 with those<br />
measured, assuming a Gaussian profile for the observed<br />
bands, in the low energy part of the absorption spectrum<br />
bands a – d. At higher energies, this comparison becomes<br />
difficult due to the strong congestion of the spectrum in that<br />
region. From Fig. 5b, it is obvious that the calculated spectra<br />
match the experimental data very well over the whole<br />
spectral range. This is particularly the case in the visible<br />
range where the bands a – d can be unambiguously assigned<br />
Downloa<strong>de</strong>d 28 Jun 2002 to 128.196.184.24. Redistribution subject to AIP license or copyright, see http://ojps.aip.org/jcpo/jcpcr.jsp