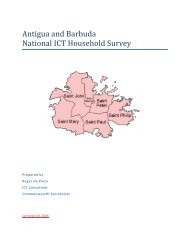
Here - Antigua & Barbuda
Here - Antigua & Barbuda
Here - Antigua & Barbuda

Create successful ePaper yourself
Turn your PDF publications into a flip-book with our unique Google optimized e-Paper software.
Sustainable Island Resource Management Zoning<br />
Plan for <strong>Antigua</strong><br />
and <strong>Barbuda</strong> (including Redonda)<br />
List of Figures<br />
Figure 3.10 Critical Environmental Areas (<strong>Barbuda</strong>)<br />
Figure 3.11 Environmental Risk and Vulnerability (<strong>Antigua</strong>)<br />
Figure 1.1<br />
Figure 1.2<br />
Figure 1.3<br />
Figure 2.1<br />
Figure 3.1<br />
Figure 3.2<br />
Figure 3.3<br />
Figure 3.4<br />
Figure 3.5<br />
Figure 3.6<br />
Figure 3.7<br />
Figure 3.8<br />
Figure 3.9<br />
Maps of <strong>Antigua</strong> and <strong>Barbuda</strong><br />
Map of the Caribbean<br />
Planning Approach<br />
The Goals of the SIRMZP<br />
Geology Map of <strong>Antigua</strong><br />
Elevation Map using a TIN (<strong>Antigua</strong>)<br />
Elevation Map using Contours (<strong>Barbuda</strong>)<br />
Topographic Map<br />
of Redonda<br />
Wooded Areas (<strong>Antigua</strong>)<br />
Vegetation Communities for Codrington Lagoon<br />
National Park<br />
Wooded Areas /Forest (<strong>Barbuda</strong>)<br />
Major Watersheds (<strong>Antigua</strong>)<br />
Critical Environmental Areas (<strong>Antigua</strong>)<br />
Figure 3.12 Archaeological Sites (<strong>Barbuda</strong>)<br />
Figure 4.1 Built Form (<strong>Antigua</strong>)<br />
Figure 4.2 Land Use Map (<strong>Antigua</strong>)<br />
Figure 4.3 Parcels less than 1 ha with buildings in All Saints<br />
Figure 4.4 Built Form and Land Use<br />
(<strong>Barbuda</strong>)<br />
Figure 4.5 UN Population Projections (1950‐2050)<br />
Figure 4.6 Personss Per Household (<strong>Antigua</strong> and <strong>Barbuda</strong>)<br />
Figure 4.7 St. John’s Parcels less than 1Ha with Buildings<br />
Figure 4.8 Squatting Hotspots (<strong>Antigua</strong>)<br />
Figure 4.9 GDP for<br />
selected countries 1969‐2009<br />
Figure 4.10 GDP per<br />
capita, PPP: <strong>Antigua</strong> and <strong>Barbuda</strong> 1980‐<br />
2008 Constant 2005 International Dollars<br />
Figure 4.11 GDP Annual Growth Rate<br />
(%) <strong>Antigua</strong> and<br />
<strong>Barbuda</strong><br />
1978‐2008<br />
v | Page<br />
December 2011