9m & 3Q 2010 - Talaat Moustafa Group
9m & 3Q 2010 - Talaat Moustafa Group
9m & 3Q 2010 - Talaat Moustafa Group

You also want an ePaper? Increase the reach of your titles
YUMPU automatically turns print PDFs into web optimized ePapers that Google loves.
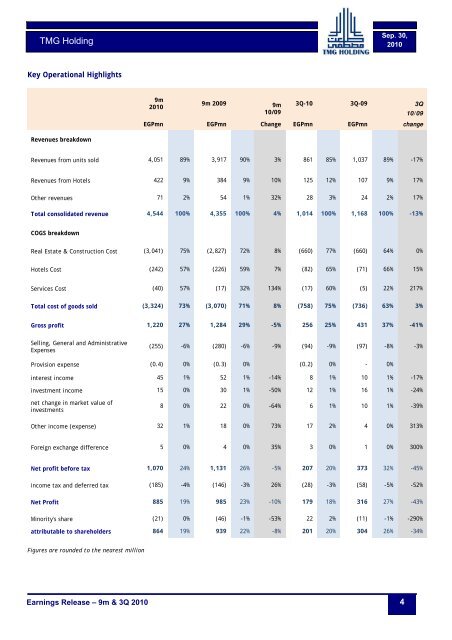
TMG Holding<br />
Sep. 30,<br />
<strong>2010</strong><br />
Key Operational Highlights<br />
<strong>9m</strong><br />
<strong>2010</strong><br />
<strong>9m</strong> 2009 <strong>9m</strong> <strong>3Q</strong>-10 <strong>3Q</strong>-09<br />
10/09<br />
<strong>3Q</strong><br />
10/09<br />
EGPmn EGPmn Change EGPmn EGPmn change<br />
Revenues breakdown<br />
Revenues from units sold 4,051 89% 3,917 90% 3% 861 85% 1,037 89% -17%<br />
Revenues from Hotels 422 9% 384 9% 10% 125 12% 107 9% 17%<br />
Other revenues 71 2% 54 1% 32% 28 3% 24 2% 17%<br />
Total consolidated revenue 4,544 100% 4,355 100% 4% 1,014 100% 1,168 100% -13%<br />
COGS breakdown<br />
Real Estate & Construction Cost (3,041) 75% (2,827) 72% 8% (660) 77% (660) 64% 0%<br />
Hotels Cost (242) 57% (226) 59% 7% (82) 65% (71) 66% 15%<br />
Services Cost (40) 57% (17) 32% 134% (17) 60% (5) 22% 217%<br />
Total cost of goods sold (3,324) 73% (3,070) 71% 8% (758) 75% (736) 63% 3%<br />
Gross profit 1,220 27% 1,284 29% -5% 256 25% 431 37% -41%<br />
Selling, General and Administrative<br />
Expenses<br />
(255) -6% (280) -6% -9% (94) -9% (97) -8% -3%<br />
Provision expense (0.4) 0% (0.3) 0% (0.2) 0% - 0%<br />
interest income 45 1% 52 1% -14% 8 1% 10 1% -17%<br />
investment income 15 0% 30 1% -50% 12 1% 16 1% -24%<br />
net change in market value of<br />
investments<br />
8 0% 22 0% -64% 6 1% 10 1% -39%<br />
Other income (expense) 32 1% 18 0% 73% 17 2% 4 0% 313%<br />
Foreign exchange difference 5 0% 4 0% 35% 3 0% 1 0% 300%<br />
Net profit before tax 1,070 24% 1,131 26% -5% 207 20% 373 32% -45%<br />
income tax and deferred tax (185) -4% (146) -3% 26% (28) -3% (58) -5% -52%<br />
Net Profit 885 19% 985 23% -10% 179 18% 316 27% -43%<br />
Minority's share (21) 0% (46) -1% -53% 22 2% (11) -1% -290%<br />
attributable to shareholders 864 19% 939 22% -8% 201 20% 304 26% -34%<br />
Figures are rounded to the nearest million<br />
Earnings Release – <strong>9m</strong> & <strong>3Q</strong> <strong>2010</strong><br />
4