Deutsche Bank - Egypt Real Estate - (6th of July 2010) - SODIC
Deutsche Bank - Egypt Real Estate - (6th of July 2010) - SODIC
Deutsche Bank - Egypt Real Estate - (6th of July 2010) - SODIC

You also want an ePaper? Increase the reach of your titles
YUMPU automatically turns print PDFs into web optimized ePapers that Google loves.
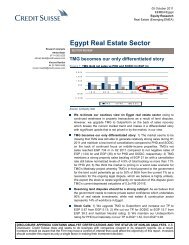
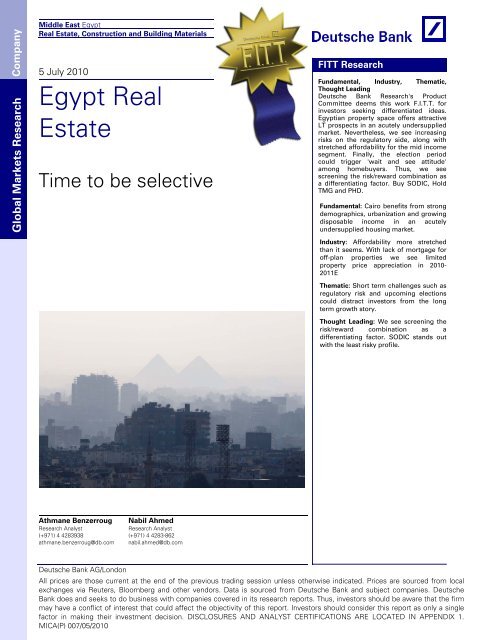
CompanyGlobal Markets ResearchMiddle East <strong>Egypt</strong><strong>Real</strong> <strong>Estate</strong>, Construction and Building Materials5 <strong>July</strong> <strong>2010</strong><strong>Egypt</strong> <strong>Real</strong><strong>Estate</strong>Time to be selectiveFITT ResearchFundamental, Industry, Thematic,Thought Leading<strong>Deutsche</strong> <strong>Bank</strong> Research's ProductCommittee deems this work F.I.T.T. forinvestors seeking differentiated ideas.<strong>Egypt</strong>ian property space <strong>of</strong>fers attractiveLT prospects in an acutely undersuppliedmarket. Nevertheless, we see increasingrisks on the regulatory side, along withstretched affordability for the mid incomesegment. Finally, the election periodcould trigger 'wait and see attitude'among homebuyers. Thus, we seescreening the risk/reward combination asa differentiating factor. Buy <strong>SODIC</strong>, HoldTMG and PHD.Fundamental: Cairo benefits from strongdemographics, urbanization and growingdisposable income in an acutelyundersupplied housing market.Industry: Affordability more stretchedthan it seems. With lack <strong>of</strong> mortgage for<strong>of</strong>f-plan properties we see limitedproperty price appreciation in <strong>2010</strong>-2011EThematic: Short term challenges such asregulatory risk and upcoming electionscould distract investors from the longterm growth story.Thought Leading: We see screening therisk/reward combination as adifferentiating factor. <strong>SODIC</strong> stands outwith the least risky pr<strong>of</strong>ile.Athmane BenzerrougResearch Analyst(+971) 4 4283938athmane.benzerroug@db.comNabil AhmedResearch Analyst(+971) 4 4283-862nabil.ahmed@db.com<strong>Deutsche</strong> <strong>Bank</strong> AG/LondonAll prices are those current at the end <strong>of</strong> the previous trading session unless otherwise indicated. Prices are sourced from localexchanges via Reuters, Bloomberg and other vendors. Data is sourced from <strong>Deutsche</strong> <strong>Bank</strong> and subject companies. <strong>Deutsche</strong><strong>Bank</strong> does and seeks to do business with companies covered in its research reports. Thus, investors should be aware that the firmmay have a conflict <strong>of</strong> interest that could affect the objectivity <strong>of</strong> this report. Investors should consider this report as only a singlefactor in making their investment decision. DISCLOSURES AND ANALYST CERTIFICATIONS ARE LOCATED IN APPENDIX 1.MICA(P) 007/05/<strong>2010</strong>
5 <strong>July</strong> <strong>2010</strong> <strong>Real</strong> <strong>Estate</strong>, Construction and Building Materials <strong>Egypt</strong> <strong>Real</strong> <strong>Estate</strong>Table <strong>of</strong> ContentsExecutive summary ........................................................................... 3Outlook .....................................................................................................................................3Valuation ...................................................................................................................................3Risks .........................................................................................................................................3Investment strategy .......................................................................... 4<strong>Egypt</strong>ian developers outperformed the CASE index in 2009 ....................................................4International comparison: <strong>Egypt</strong>ian developers cheap against EM...........................................6Stay risk averse: Buy <strong>SODIC</strong> ................................................................................................... 10Valuation .......................................................................................... 13Valuation methodology ...........................................................................................................13Company snapshot ................................................................................................................. 16Putting regulatory risk into perspective........................................ 17Ambiguous legal framework has heightened regulatory risk .................................................. 17Madinaty judgement to set the benchmark ............................................................................ 17Key themes....................................................................................... 19Supportive demographics lead to strong domestic demand .................................................. 19Demand supply analysis: shortfall to widen, especially in the low- to mid-income segment . 21Affordability held back by lack <strong>of</strong> mortgage availability........................................................... 22Screening for risk…<strong>SODIC</strong> the least risky............................................................................... 25Market mispricing quality........................................................................................................ 28Commercial space undersupplied and quality below par........................................................ 30Retail market – Cairo has lowest retail GLA per capita ........................................................... 31Hospitality – low Euro/Dollar exchange rate is a threat........................................................... 32Company pr<strong>of</strong>iles............................................................................. 34<strong>SODIC</strong> ............................................................................................... 35Palm Hills Developments ................................................................ 55TMG Holding.................................................................................... 80Page 2<strong>Deutsche</strong> <strong>Bank</strong> AG/London
5 <strong>July</strong> <strong>2010</strong> <strong>Real</strong> <strong>Estate</strong>, Construction and Building Materials <strong>Egypt</strong> <strong>Real</strong> <strong>Estate</strong>Executive summaryOutlookThe <strong>Egypt</strong>ian real estate market <strong>of</strong>fers attractive long-term prospects in an acutelyundersupply environment, supported by solid fundamentals such as a large and growingpopulation (the largest in MENA), a high proportion <strong>of</strong> young people and increasingdisposable income. The capital, Cairo, is benefiting immensely from the urbanization anddevelopment <strong>of</strong> satellites (East/West Cairo), where the population density is lower and quality<strong>of</strong> life higher. Our analysis suggests that Cairo’s residential market will witness a widershortfall from 264k units (5% <strong>of</strong> demand) in 2009E to 730k (11%) by 2014E, <strong>of</strong> which c.35%stems from the mid to high income segments where our developers under coverageoperate.At first glance, by comparing price to income ratios for select cities in the world, it seemsthat a mid income apartment is still affordable. However, <strong>Egypt</strong>’s case is unique as it isprimarily a cash market with no access to mortgage for <strong>of</strong>f plan properties. Our analysissuggests stretched affordability for the mid-income segment after sharp property priceincreases (c.50-60% between 2007-Q1 <strong>2010</strong>). As a result we only see limited property priceappreciation in <strong>2010</strong>-11. Furthermore, we see short-term challenges for <strong>Egypt</strong>ian developerswith increasing risks, especially on the regulatory side. We believe the sector is exposed topotential negative outcome/news flow on the land acquisition process which could affectinvestor confidence on the <strong>Egypt</strong>ian story. While we do not expect major cancellations <strong>of</strong>land agreements as such a scenario would negatively impact the government’s credibility andput <strong>of</strong>f foreign investors, we see uncertainties dominating the <strong>Egypt</strong>ian story. Investorsshould closely monitor the upcoming events, especially the hearing <strong>of</strong> the Madinaty case on<strong>July</strong> 17 th <strong>2010</strong>. The election period could also trigger a ‘wait and see attitude’ among futurehomebuyers in their purchasing decisions. Overall we see a risk that ST challenges distractinvestors from the LT growth story.Our analysis shows that investors are valuing <strong>Egypt</strong>ian developers without differentiatingrisks and quality/location <strong>of</strong> the landbank. With minimal land liabilities, differentiated/flexibledevelopment model, strongest balance sheet (EGP1.2bn net cash,40% <strong>of</strong> market cap.) and aquality/cheap landbank highly discounted by the market, <strong>SODIC</strong> is our best play. PHD is themost leveraged play on the property market with the highest outstanding land liabilities (1.2x2009 equity) and limited potential for property price increases, in our view. TMG <strong>of</strong>fers thebest exposure to the mid income segment. However, the potential outcome <strong>of</strong> litigation onits Madinaty land remains difficult to predict and adds risk to the investment case. We initiatewith a Buy on <strong>SODIC</strong>, Hold on TMG and PHD.ValuationWe value <strong>Egypt</strong>ian developers on a SOTP basis. We value development properties usingDCF, while we limit our presales to 2012E. Investment properties are taken at 2009 BV whenthe property is immature; otherwise, we use comparative industry multiples to gross pr<strong>of</strong>it.Landbank is valued by benchmarking to 2007 auction prices in Cairo or taking appropriatediscounts (based on the quality/location <strong>of</strong> landbank) on our estimated NAV.Risks<strong>Egypt</strong>ian developers are exposed to: (1) regulatory risk on land agreements; (2) executionrisk; (3) availability <strong>of</strong> financing; (4) backlog cancellation/presales slowdown; (5) stretchedaffordability; (6) economic conditions; and (7) consumer confidence.<strong>Deutsche</strong> <strong>Bank</strong> AG/London Page 3
5 <strong>July</strong> <strong>2010</strong> <strong>Real</strong> <strong>Estate</strong>, Construction and Building Materials <strong>Egypt</strong> <strong>Real</strong> <strong>Estate</strong>Investment strategy<strong>Egypt</strong>ian developers outperformed the CASE index in 2009Since their peaks in 2008, <strong>Egypt</strong>ian developers’ share prices have plunged significantly in linewith global trends and have underperformed the respective stock indices. However, since2009, the trend has reversed and the real estate index has outperformed the CASE. This isprimarily due to the resilient pr<strong>of</strong>ile <strong>of</strong> the real estate developers (solid backlog, low customerdefaults and low gearing), as physical demand for real estate remained strong on the back <strong>of</strong>a growing economy and acute undersupply.Figure 1: <strong>Egypt</strong>ian real estate vs. CASE, beginning 2008(base 100)Figure 2: <strong>Egypt</strong>ian real estate vs. CASE, beginning 2009(base 100)1<strong>2010</strong>080604020-30025020015010050-Jan-08Apr-08Jul-08Oct-08Jan-09Apr-09Jul-09Oct-09Jan-10Apr-10Jan-09Apr-09Jul-09Oct-09Jan-10Apr-10RE IndexCASERE IndexCASESource: Reuters, <strong>Deutsche</strong> <strong>Bank</strong>Source: Reuters, <strong>Deutsche</strong> <strong>Bank</strong>After selling <strong>of</strong>f the sector as a whole in 2008, investors have been selective in their stockpicking in 2009, with TMG outperforming the sector. We believe TMG’s outperformance canbe attributed to 2 factors: (1) its positioning in the right segment (mid- to mid-upper income)where demand remains solid; and (2) its strong financial pr<strong>of</strong>ile, coupled with no outstandingliabilities (payment for Madinaty land to be made in kind, which is currently under litigation).PHD’s underperformance can be attributed to its outstanding land liabilities (1.2x 2009equity). <strong>SODIC</strong>’s underperformance can be attributed to the immature nature <strong>of</strong> its assets(mostly prime land) and high-end positioning (despite strong sales momentum and minimumcancellations in 2009).Figure 3: <strong>Egypt</strong> real estate equity performances, sinceMay 2008 (base 100)Figure 4: <strong>Egypt</strong> real estate equity performances,beginning 2009 (base 100)120300100250802006015040200May-08 Jul-08 Sep-08 Nov-08PHD TMG OCDI CASESource: Reuters, <strong>Deutsche</strong> <strong>Bank</strong>100500Jan-09 Apr-09 Jul-09 Oct-09 Jan-10 Apr-10PHD TMG OCDI CASESource: Reuters, <strong>Deutsche</strong> <strong>Bank</strong>Page 4<strong>Deutsche</strong> <strong>Bank</strong> AG/London
5 <strong>July</strong> <strong>2010</strong> <strong>Real</strong> <strong>Estate</strong>, Construction and Building Materials <strong>Egypt</strong> <strong>Real</strong> <strong>Estate</strong>Figure 5: Stock and index price performances, 2009 andYTDFigure 6: Stock and index price performances, 3M and6M-5% CASE-11% Heliopolis7%35%-25%-14%-11%-5%CASEHeliopolis-38% Cairo H. & Dev.83%-38%-22%Cairo H. & Dev.-15% Orasc. Dev.0%-24%-15%Orasc. Dev.Sixth <strong>of</strong> Oct.0%95%-17%Sixth <strong>of</strong> Oct.0%TMG-14% PHD2%84%125%-27%-14%-10%TMGPHD2%-60% -40% -20% 0% 20% 40% 60% 80% 100% 120% 140%-45% -40% -35% -30% -25% -20% -15% -10% -5% 0% 5%YTD 20093M6MSource: Reuters, <strong>Deutsche</strong> <strong>Bank</strong>Source: Reuters, <strong>Deutsche</strong> <strong>Bank</strong>Recent underperformance compared to global and emerging market peersWe explain this trend by the fact that the <strong>Egypt</strong>ian sector has been the best performer acrossMENA markets since 1 year while we believe investors start to integrate increasing risksregarding affordability levels/regulatory framework.Figure 7: Performance <strong>of</strong> <strong>Egypt</strong>ian developers’ stocks vs. global peers1Month 3Month 6Month 1Year<strong>Egypt</strong> -8.5 -18.2 -23.2 +2.7Emerging Markets -1.3 -13.7 -9.8 +9.0World -5.0 -16.7 -12.5 +4.7UAE -9.6 -31.6 -18.7 -37.6KSA +0.0 -7.5 -6.0 -9.4Asia +1.7 -8.5 -5.2 +12.7Russia & Emerging Europe -9.1 -30.7 -25.6 +47.0US -15.2 -26.2 -25.4 +7.3Europe -9.6 -22.4 -17.1 +5.3Australia -5.4 -8.8 -4.2 +24.8Japan -11.0 -20.8 -13.9 -23.0Source: Reuters, <strong>Deutsche</strong> <strong>Bank</strong><strong>Deutsche</strong> <strong>Bank</strong> AG/London Page 5
5 <strong>July</strong> <strong>2010</strong> <strong>Real</strong> <strong>Estate</strong>, Construction and Building Materials <strong>Egypt</strong> <strong>Real</strong> <strong>Estate</strong>International comparison: <strong>Egypt</strong>ian developers cheap against EMWe have attempted to put <strong>Egypt</strong>ian developers’ valuation into a wider context and haveleveraged the <strong>Deutsche</strong> <strong>Bank</strong> global real estate coverage universe, which is wide in terms <strong>of</strong>regions and broad in terms <strong>of</strong> sub-sectors. In our sample, we have only included developersor business models essentially geared towards development properties to avoid biastowards REITs or other business models. Our sample includes 92 companies with acombined market cap <strong>of</strong> USD329bn, <strong>of</strong> which 66% is within the emerging market space(40% in China/Hong Kong alone), while 24% is in Japan, and the remainder is split betweenEurope, the US and Australia.Figure 8: Summary <strong>of</strong> developers’ multiples by regionMkt Cap P/BV P/E Div yield % ROE GearingUSD m 2009 <strong>2010</strong>E 2011E 2009 <strong>2010</strong>E 2011E 2009 <strong>2010</strong>E 2011E 2009 <strong>2010</strong>E 2011E 2009 <strong>2010</strong>E 2011EAverage UAE 11,112 0.6 0.4 0.4 11.1 5.3 11.4 0.2 0.3 0.4 5.7 8.8 7.0 43.2 29.1 37.8Average Saudi Arabia 7,808 1.0 0.9 0.9 18.9 15.5 14.4 1.5 1.6 1.1 5.5 3.7 2.4 -1.3 2.5 27.2Average <strong>Egypt</strong> 3,878 1.2 1.0 0.8 10.2 11.4 7.3 0.0 0.0 0.0 4.9 10.1 13.7 0.9 -0.1 5.7Average Asia 187,800 1.5 1.5 1.3 21.6 16.7 17.6 2.6 2.3 2.5 11.5 10.4 11.1 38.6 34.5 29.0Average Russia & Emerging Europe 6,173 1.6 1.3 1.4 5.9 14.1 8.4 - - - -64.6 5.1 1.0 94.1 86.2 107.8Average Emerging Markets 216,912 1.3 1.3 1.2 19.3 15.0 15.5 1.9 1.6 1.8 2.1 9.3 9.5 39.2 34.4 35.7Average United States 14,650 1.2 1.1 1.2 NM NM NM 1.0 1.0 1.0 -18.8 -0.6 1.7 42.0 50.9 49.4Average Europe 11,839 1.2 1.0 0.9 57.7 19.7 15.4 1.0 1.0 1.6 -5.2 5.0 8.2 20.3 7.3 7.4Average Australia 5,524 0.8 0.9 0.9 8.3 11.2 10.6 9.2 6.1 6.3 8.3 6.6 7.5 48.0 24.3 25.4Average Japan 79,714 0.9 1.1 0.9 68.3 40.4 18.9 2.0 2.0 2.3 4.8 -2.1 4.8 89.1 93.4 75.9Average World 328,639 1.2 1.2 1.1 31.2 19.4 18.4 1.9 1.7 1.9 0.0 6.3 7.9 44.4 40.4 39.3Source: <strong>Deutsche</strong> <strong>Bank</strong> estimatesPage 6<strong>Deutsche</strong> <strong>Bank</strong> AG/London
Page 8 <strong>Deutsche</strong> <strong>Bank</strong> AG/LondonFigure 10: <strong>Deutsche</strong> <strong>Bank</strong> global developers universe (prices as <strong>of</strong> 4 <strong>July</strong> <strong>2010</strong>) – emerging markets (continued)Currency Rating Current Target Mkt Cap P/BV P/E Div yield %ROE GearingPrice Price USD m 2009 <strong>2010</strong>E 2011E 2009 <strong>2010</strong>E 2011E 2009 <strong>2010</strong>E 2011E 2009 <strong>2010</strong>E 2011E 2009 <strong>2010</strong>E 2011EIndonesiaBAKRIELAND DEVELOPMENT IDR Hold 142.0 NA 440 0.8 0.6 0.6 34.5 27.1 135.5 - - - 2.9 2.2 0.4 48.8 53.4 50.8JABABEKA IDR Hold 93.0 NA 129 1.0 0.8 0.7 82.1 NM 16.6 - - - 1.0 - 0.4 4.6 79.2 58.9 35.1SUMMARECON IDR Buy 850.0 1000.0 244 2.2 2.8 2.5 15.1 22.9 17.0 0.7 0.6 0.9 10.2 13.1 15.6 20.4 6.2 - 22.8Average Indonesia 813 1.4 1.4 1.3 43.9 25.0 56.4 0.2 0.2 0.3 4.7 5.0 6.9 49.5 39.5 21.1PhilippinesAYALA LAND PHP Hold 13.3 11.0 2,398 2.9 3.2 2.9 28.3 37.6 33.0 0.7 0.4 0.4 8.2 8.7 9.2 16.6 20.1 30.9FILINVEST LAND PHP Sell 0.9 0.6 496 0.6 0.6 0.6 14.1 16.0 15.7 2.1 2.1 - 4.2 3.6 3.6 18.2 20.0 21.5MEGAWORLD PHP Sell 1.3 0.4 735 0.7 0.7 0.7 10.5 13.4 15.4 1.5 1.5 - 7.6 5.3 4.4 - 10.3 - 5.8 6.3ROBINSONS LAND CORP PHP Buy 14.0 14.3 370 1.1 1.4 1.4 5.4 11.5 10.5 3.9 3.3 5.2 13.5 13.1 13.3 24.2 30.3 32.6SM INVESTMENTS CORPORATION PHP Hold 417.5 325.0 5,246 2.1 2.5 2.0 15.8 14.1 12.4 1.4 1.6 - 13.8 15.9 17.7 18.3 44.2 30.0SM PRIME HOLDINGS PHP Hold 10.3 8.8 2,507 2.8 2.7 2.5 17.0 18.6 16.8 2.7 2.5 2.7 14.9 15.3 15.6 57.8 59.0 60.2Average Philippines 11,751 1.7 1.8 1.7 15.2 18.5 17.3 2.0 1.9 1.4 10.4 10.3 10.7 20.8 28.0 30.3SingaporeALLGREEN PROPERTIES SGD Buy 1.1 1.4 964 0.8 0.7 0.6 8.3 8.6 6.9 4.5 3.8 3.8 7.1 8.0 9.4 33.6 28.1 18.6CAPITALAND LTD SGD Buy 3.6 4.3 9,134 1.3 1.1 1.1 20.7 23.2 21.6 2.5 1.4 1.4 8.7 4.8 5.0 9.2 26.5 29.4CITY DEVELOPMENTS SGD Hold 11.0 11.5 5,221 1.8 1.5 1.4 13.2 15.2 13.6 1.0 1.2 1.2 10.6 11.0 11.1 39.2 33.2 26.0KEPPEL LAND SGD Buy 4.0 4.4 2,045 1.5 1.5 1.4 8.8 17.9 13.9 3.8 2.1 2.1 9.6 8.8 10.6 22.0 34.9 36.1WING TAI HLDGS SGD Hold 1.6 1.9 547 0.7 0.7 0.7 7.4 7.9 6.2 4.0 2.6 2.6 1.3 9.6 11.1 47.0 31.5 18.3Average Singapore 17,911 1.2 1.1 1.0 11.7 14.6 12.4 3.1 2.2 2.2 7.5 8.4 9.5 30.2 30.8 25.7ThailandLAND AND HOUSES THB Buy 5.5 7.3 1,448 2.4 2.0 1.9 12.7 12.6 11.4 6.2 6.3 6.9 15.0 15.8 16.9 53.5 45.4 37.0LPN THB Buy 8.9 9.1 208 2.0 2.1 1.8 5.3 8.6 7.5 10.3 6.5 7.3 27.9 26.4 26.3 - 5.6 - 20.4 - 28.1PREUKSA REAL ESTATE PCL THB Buy 18.1 21.3 588 3.0 2.5 2.1 5.6 9.7 8.8 6.0 3.4 3.7 31.3 28.5 25.9 - 8.1 - 14.8 - 19.8QUALITY HOUSES PCL. THB Buy 2.0 2.6 408 1.8 1.5 1.4 9.5 10.9 9.0 7.3 5.4 6.6 14.3 14.3 16.3 94.0 94.7 91.2Average Thailand 2,652 2.3 2.0 1.8 8.3 10.5 9.2 7.4 5.4 6.1 22.1 21.2 21.3 33.4 26.2 20.1Other Asian countriesSP SETIA MYR Buy 4.2 4.5 1,035 1.9 1.9 1.8 24.9 23.4 20.1 3.6 3.2 3.2 8.5 9.8 10.7 27.2 38.2 41.2Average other Asian countries 1,035 1.9 1.9 1.8 24.9 23.4 20.1 3.6 3.2 3.2 8.5 9.8 10.7 27.2 38.2 41.2Average Asia 187,800 1.5 1.5 1.3 21.6 16.7 17.6 2.6 2.3 2.5 11.5 10.4 11.1 38.6 34.5 29.0Russia & Emerging EuropeAFI DEVELOPMENT USD Buy 1.6 3.4 807 0.4 0.4 0.4 3.8 18.9 12.3 - - - 11.5 2.2 3.2 11.4 10.1 8.6GTC EUR Buy 22.5 27.0 1,449 1.4 1.1 0.9 NM 10.4 5.9 - - - - 12.4 11.3 16.9 109.6 111.0 119.2LSR USD Buy 7.3 12.8 1,755 3.3 2.0 1.7 8.0 23.4 11.2 - - - 11.7 9.9 16.2 92.5 53.7 45.2PIK USD Buy 3.0 7.5 1,578 2.6 2.7 3.8 NM NM NM - - - - 7.4 - 2.0 - 35.1 249.5 253.1 368.2SISTEMA-HALS USD Buy 1.1 2.0 218 NM NM NM NM NM NM - - - - 382.2 NM NM NM NM NMOPEN INVESTMENTS USD Hold 25.0 47.0 366 0.2 0.1 0.1 NM 3.6 4.1 - - - - 8.7 4.1 3.5 7.5 3.1 - 2.2Average Russia & Emerging Europe 6,173 1.6 1.3 1.4 5.9 14.1 8.4 0.0 0.0 0.0 -64.6 5.1 1.0 94.1 86.2 107.8Average Emerging Markets 216,912 1.3 1.3 1.2 19.3 15.0 15.5 1.9 1.6 1.8 2.1 9.3 9.5 39.2 34.4 35.7Source: <strong>Deutsche</strong> <strong>Bank</strong> estimates5 <strong>July</strong> <strong>2010</strong> <strong>Real</strong> <strong>Estate</strong>, Construction and Building Materials <strong>Egypt</strong> <strong>Real</strong> <strong>Estate</strong>
<strong>Deutsche</strong> <strong>Bank</strong> AG/London Page 9Figure 11: <strong>Deutsche</strong> <strong>Bank</strong> global developers universe (prices as <strong>of</strong> 4 <strong>July</strong> <strong>2010</strong>) – developed countriesCurrency Rating Current Target Mkt Cap P/BV P/E Div yield %ROE GearingPrice Price USD m 2009 <strong>2010</strong>E 2011E 2009 <strong>2010</strong>E 2011E 2009 <strong>2010</strong>E 2011E 2009 <strong>2010</strong>E 2011E 2009 <strong>2010</strong>E 2011EUnited StatesD.R. HORTON USD Hold 9.7 12.0 2,947 1.5 1.2 1.0 NM 13.1 16.9 1.6 1.5 1.5 - 21.0 11.5 8.0 49.5 27.4 4.6K. HOVNANIAN USD Hold 3.6 4.5 209 NM NM NM NM 2.3 NM - - - NM NM NM NM NM NMKB HOME USD Hold 10.6 17.0 1,121 1.5 1.4 1.5 NM NM NM 1.7 2.3 2.3 - 13.2 - 12.9 - 5.7 90.8 132.8 149.9LENNAR USD Hold 13.7 15.0 1,797 0.9 0.9 0.9 NM NM NM 1.5 1.1 1.1 - 13.8 1.9 2.4 50.4 67.7 69.1M.D.C. HOLDINGS USD Buy 26.6 46.0 1,503 1.4 1.2 1.3 60.1 NM 58.7 3.1 3.7 3.7 2.3 - 2.0 2.1 - 19.3 28.7 24.7MERITAGE HOMES USD Hold 16.1 20.0 545 1.2 1.1 1.0 NM 78.8 35.7 - - - - 13.1 2.3 4.1 73.3 85.5 78.5PULTEGROUP, INC. USD Hold 8.2 11.0 2,626 0.8 1.0 1.0 NM NM NM - - - - 39.2 - 0.4 - 0.2 76.4 45.3 36.2RYLAND HOMES USD Hold 15.9 22.0 827 1.5 1.3 1.3 NM NM 160.6 0.6 0.7 0.7 - 26.5 - 2.9 2.2 7.1 5.6 12.4TOLL BROTHERS USD Hold 16.1 18.0 3,074 1.1 1.2 1.2 NM NM NM - - - - 26.0 - 2.6 0.7 7.9 14.4 19.6Average United States 14,650 1.2 1.1 1.2 NM NM NM 1.0 1.0 1.0 -18.8 -0.6 1.7 42.0 50.9 49.4EuropeBARRATT DEVELOPMENTS GBP Buy 92.4 193.0 577 0.2 0.3 0.3 NM NM 24.5 - - - - 18.0 - 5.1 1.2 56.0 17.2 19.8BELLWAY GBP Hold 585.0 908.0 1,118 0.9 0.7 0.7 34.9 22.3 14.1 1.5 1.6 1.8 - 2.8 3.2 4.8 5.9 6.3 11.2BERKELEY GROUP HLDGS GBP Hold 773.0 972.0 1,674 1.5 1.2 1.1 12.6 13.2 12.0 - - - 11.6 9.5 9.6 - 35.5 - 36.7 - 23.0BOVIS HOMES GBP Buy 327.8 521.0 835 0.8 0.6 0.6 97.8 45.7 27.2 - 0.6 0.7 0.5 1.4 2.3 - 16.2 - 15.1 - 12.4JM SEK Hold 100.5 135.0 759 2.8 2.0 1.8 15.5 12.8 9.5 3.6 4.0 5.0 11.0 17.0 20.4 - 20.5 - 41.9 - 55.1NEXITY EUR Hold 23.2 24.0 1,487 0.6 0.6 NA 36.3 12.0 NA - - NA 1.7 5.1 NA 6.5 9.2 NAPERSIMMON GBP Buy 343.2 564.0 1,876 0.9 0.6 0.6 191.3 18.5 11.1 - - 2.2 4.7 3.4 5.4 16.1 5.2 - 3.2REDROW GBP Hold 107.8 160.0 570 1.4 0.8 0.7 NM NM 21.3 - - - - 28.8 - 0.9 3.5 73.1 26.5 36.1TAYLOR WIMPEY PLC GBP Buy 25.7 62.0 1,361 0.7 0.5 0.5 NM NM 8.0 - - - - 40.4 - 1.4 6.5 50.0 47.8 43.7YIT CORPORATION EUR Buy 14.4 20.0 1,582 2.4 2.2 2.0 15.4 13.4 10.5 4.5 3.8 4.5 8.9 17.4 20.2 67.6 54.1 49.1Average Europe 11,839 1.2 1.0 0.9 57.7 19.7 15.4 1.0 1.0 1.6 -5.2 5.0 8.2 20.3 7.3 7.4AustraliaAUSTRALAND AUD Buy 2.4 3.3 705 0.9 0.8 0.8 7.5 11.3 10.5 13.9 8.5 8.8 5.5 5.4 5.8 38.0 35.2 40.1GOODMAN GROUP AUD Buy 0.6 0.7 2,477 0.3 0.8 0.8 7.0 11.6 11.4 7.9 5.2 5.2 9.7 6.5 6.9 105.8 33.6 28.1LEND LEASE AUD Buy 7.2 9.0 2,342 1.2 1.0 1.0 10.4 10.8 10.0 5.9 4.6 5.0 9.6 7.9 9.9 0.2 4.1 7.9Average Australia 5,524 0.8 0.9 0.9 8.3 11.2 10.6 9.2 6.1 6.3 8.3 6.6 7.5 48.0 24.3 25.4JapanDAITO TRUST CONSTRUCTION JPY Buy 4930.0 5700.0 5,282 1.3 1.7 1.8 12.6 11.0 13.0 2.4 4.6 3.8 14.1 14.9 13.9 - 68.2 63.2 - 65.0DAIWA HOUSE INDUSTRY JPY Hold 785.0 1130.0 5,355 0.8 1.0 0.7 129.1 29.0 12.9 2.6 1.8 2.5 0.7 3.1 5.5 38.9 45.2 26.7LEOPALACE21 JPY Buy 261.0 400.0 1,735 0.6 1.0 0.6 17.5 NM NM 2.7 NM NM 6.4 - 72.8 - 5.0 - 26.0 - 22.5 - 32.0MITSUBISHI ESTATE JPY Buy 1217.0 1750.0 27,218 1.3 1.8 1.4 60.2 169.9 27.2 0.8 0.8 1.0 3.8 1.0 5.2 143.5 133.7 124.2MITSUI FUDOSAN JPY Buy 1226.0 1900.0 16,366 1.0 1.4 1.0 19.7 22.7 21.8 1.2 1.4 1.8 8.6 6.0 4.8 170.7 167.0 161.7PANAHOME JPY Buy 514.0 720.0 936 0.9 0.9 0.7 31.9 39.9 17.6 2.7 2.6 2.9 2.5 2.1 4.2 - 45.7 - 57.5 - 52.5SEKISUI CHEMICAL JPY Hold 554.0 650.0 3,138 0.8 1.0 0.8 311.3 25.4 17.1 1.7 1.8 1.8 0.3 3.5 4.9 24.4 17.4 24.6SEKISUI HOUSE JPY Buy 747.0 970.0 6,190 0.7 0.8 0.7 54.8 NM 22.9 2.6 1.2 2.6 1.5 - 4.0 3.1 16.4 15.5 8.3SUMITOMO FORESTRY JPY Hold 691.0 810.0 1,234 0.7 0.8 0.8 120.7 53.4 25.5 2.1 2.1 2.2 0.6 1.5 3.0 3.6 - 5.2 - 16.3SUMITOMO R&D JPY Buy 1474.0 2100.0 8,543 1.2 1.7 1.3 18.6 14.8 13.2 1.1 1.2 1.3 10.7 11.4 10.4 394.5 364.7 333.2TOKYO TATEMONO JPY Hold 264.0 370.0 1,367 0.5 0.4 0.4 20.2 20.1 22.6 2.5 3.0 3.0 2.7 2.2 2.0 189.1 185.3 178.7TOKYU LAND JPY Buy 306.0 400.0 2,349 0.7 0.9 0.8 23.2 17.7 13.7 1.8 1.9 2.3 5.2 5.5 5.7 227.9 213.8 219.7Average Japan 79,714 0.9 1.1 0.9 68.3 40.4 18.9 2.0 2.0 2.3 4.8 -2.1 4.8 89.1 93.4 75.9Average World 328,639 1.2 1.2 1.1 31.2 19.4 18.4 1.9 1.7 1.9 0.0 6.3 7.9 44.4 40.4 39.3Source: <strong>Deutsche</strong> <strong>Bank</strong> estimates5 <strong>July</strong> <strong>2010</strong> <strong>Real</strong> <strong>Estate</strong>, Construction and Building Materials <strong>Egypt</strong> <strong>Real</strong> <strong>Estate</strong>
5 <strong>July</strong> <strong>2010</strong> <strong>Real</strong> <strong>Estate</strong>, Construction and Building Materials <strong>Egypt</strong> <strong>Real</strong> <strong>Estate</strong>Stay risk averse: Buy <strong>SODIC</strong>We believe investors should look for value name with lower risks (financials-land liabilitiesand regulatory risks). <strong>SODIC</strong> stands out among the <strong>Egypt</strong>ian developers under coverage.Within our coverage universe, we have classified each stock’s positioning towards theinvestment strategy described above. Note that the assessment for each item has to beunderstood as ‘relative to the peer group’ and is not reflective <strong>of</strong> our fundamental view onindividual companies.Figure 12: Summary <strong>of</strong> stock coverage positioning towards our top-down investment strategyRelative to peer group <strong>SODIC</strong> PHD TMGReturnValuation Medium High LowCyclical upturn upside Medium High MediumRisksRegulatory Medium Medium HighDependency on funding Low High LowLand liabilities Low High HighBusiness segment (income bracket) High High/Upper mid Upper midSource: <strong>Deutsche</strong> <strong>Bank</strong> estimatesFigure 13: Recommendation, target price and key valuation metrics on our <strong>Egypt</strong>ian real estate coverage universeEGP <strong>SODIC</strong> PHD TMGRecommendation Buy Hold HoldPrices (as <strong>of</strong> 4 <strong>July</strong> <strong>2010</strong>) 80.2 4.8 7.0Target price 112 5.9 7.8% potential upside 40% 23% 11%Target P/BV <strong>2010</strong>E (x) 1.6 1.4 0.6Current P/BV<strong>2010</strong>E (x) 1.2 1.1 0.6Current P/BV 2009 (x) 1.3 1.7 0.62009 performance 95% 84% 125%YTD performance 0% -14% 2%Source: <strong>Deutsche</strong> <strong>Bank</strong> estimatesPage 10<strong>Deutsche</strong> <strong>Bank</strong> AG/London
5 <strong>July</strong> <strong>2010</strong> <strong>Real</strong> <strong>Estate</strong>, Construction and Building Materials <strong>Egypt</strong> <strong>Real</strong> <strong>Estate</strong>• <strong>SODIC</strong> (Buy): In our opinion, <strong>SODIC</strong> is a company led by strong management and istransforming from a mono project residential developer to a builder <strong>of</strong> downtowns inWest/East Cairo with a focus on undersupplied retail and commercial space. While weacknowledge that the company operates in the high-end segment where we expectlower growth compared to the mid-income segment, it <strong>of</strong>fers differentiated products interms <strong>of</strong> quality and concept. Non-residential should account for 57% <strong>of</strong> planned BUA,while the company intends to retain 30% <strong>of</strong> BUA as investment property. We like thestrategy, as the concept is unique but lucrative due to high yields in this space.Additionally, it has a low risk pr<strong>of</strong>ile due to its strong balance sheet (net cash EGP1.2bn-40% <strong>of</strong> market cap.), flexible development model leading to minimum outstandingcommitment at any point in time and low outstanding land liability (EGP165m over 7years). Admittedly, <strong>SODIC</strong> needs to raise EGP1bn (DBe) between 2011-2012E to buildthe investment portfolio, but in the case <strong>of</strong> funds not being raised, the financial pr<strong>of</strong>ile <strong>of</strong><strong>SODIC</strong> would not weaken materially as the projects are still in the drawing board stage.<strong>SODIC</strong>’s intrinsic value comes from its small but prime landbank entirely in Cairo. WestCairo landbank is located adjacent to Smart Village, a successful business park, whereasthe East Cairo landbank is located near the fast-growing Kattameya/New Cairo area. Thecurrent price values landbank at a slight (8%) premium to historical cost and implies nonew launches, which is unjustified following recent strong sales momentum (backloggrew from EGP1.9bn in 2008 to 2.7bn in 2009 and then to EGP3.4bn in Q1 <strong>2010</strong>). Weinitiate with a Buy and a TP <strong>of</strong> EGP112.• PHD (Hold): We see PHD as the most leveraged play on <strong>Egypt</strong>ian market. The companyholds the most diversified land bank and exposure to first and second homes. While wedo not see a rally in property prices in <strong>Egypt</strong> to play PHD, performance in second homessales remains difficult to predict. The company maintains a healthy backlog (EGP10bn)supporting its top line for the next 4+ years with on average >60% <strong>of</strong> launched projectsalready sold. PHD holds deep project pipeline while it intends to increase focus on highvolumemid-income segment. In addition, its vertically integrated model ensures bettermargins and guaranteed capacities in a country under construction boom. Nevertheless,the company has the highest fixed land liability among <strong>Egypt</strong>ian developers under ourcoverage (1.2x 2009 equity) with ~70% <strong>of</strong> the payment is outstanding which makes itmore risky than peers. Finally, non-Cairo location represents ~80% <strong>of</strong> the total landbankwhile we believe PHD will need to replenish its Cairo land (only c.20%) which holds thehighest potential, in our view. Finally, the recent negative news flow on Aswan landlowers visibility. We initiate with a Hold and a TP <strong>of</strong> EGP5.9.• TMG Holding (Hold): We believe TMG <strong>of</strong>fers the best exposure to the suburbanizationtrend in Cairo and demand from mid- to mid-upper segments in an acutely undersuppliedmarket. TMG is the largest <strong>Egypt</strong>ian developer with EGP24bn <strong>of</strong> backlog end-Q1 <strong>2010</strong>,which covers deliveries for the next 3+ years. Legal risks aside, cancellation risk isminimal as customers are in net equity territory and around 33% <strong>of</strong> cash has beencollected. Additionally, after a muted 2009, presales were strong in Q1 <strong>2010</strong>. (Net newpresales <strong>of</strong> EGP817m in Q1 <strong>2010</strong> vs. EGP77 in Q109). The next 3 years are crucial asTMG enters a massive delivery phase (c.26k units), which should improve the cash flowpr<strong>of</strong>ile (DBe EGP16bn will be collected from delivered units). However, on 22 June <strong>2010</strong>,an <strong>Egypt</strong>ian court ruled to nullify the sale <strong>of</strong> government land to TMG for its Madinatyproject (c.86% <strong>of</strong> landbank in <strong>Egypt</strong>, 71% <strong>of</strong> EV). The court ruled that the NUCA, a bodyunder the housing ministry, had broken the law by selling the land to TMG in 2005 andnot opening it up to the auction process. TMG has a unique agreement with NUCAwherein instead <strong>of</strong> paying the land in cash, it negotiated to pay Madinaty and Al Rehab inkind (7% and 12% <strong>of</strong> the BUA developed, respectively). While the housing minister hassaid that the court ruling does not cancel the TMG contract, risks remain on the potentialoutcome. NUCA appealed to the court to stop the execution <strong>of</strong> the verdict with a hearingset for 17 <strong>July</strong> <strong>2010</strong>. A positive outcome could lead us to change our view on the stock.We initiate coverage with a Hold and a TP <strong>of</strong> EGP7.8<strong>Deutsche</strong> <strong>Bank</strong> AG/London Page 11
5 <strong>July</strong> <strong>2010</strong> <strong>Real</strong> <strong>Estate</strong>, Construction and Building Materials <strong>Egypt</strong> <strong>Real</strong> <strong>Estate</strong>Figure 14: Summary <strong>of</strong> our views on <strong>Egypt</strong>ian developersStocks Rating Market Cap Av. Daily Volume(USD m) (USD m)Key market Short-term focus Medium-term focus<strong>SODIC</strong> Buy 511 1.8 Cairo Launch projects by phase within its Eastownand Westown developments, customizeprojects to market requirements, securefinance for investment property portfolioPHD Hold 887 2.1 Cairo/RedSea/NorthCoastFast track project completion, replenishment<strong>of</strong> Cairo land, project launchesTMG Hold 2,480 9.8 Cairo Court hearing on 17 <strong>July</strong> on Madinaty landSource: <strong>Deutsche</strong> <strong>Bank</strong>, ZawyaMaintain presales and focus on deliveriesBuild investment property portfolio,gradually migrate to mid-upper incomesegment, geographic diversificationInvest and ramp up <strong>of</strong> IP assets,migrate to mid-income, land acquisitionin CairoInvest in hotel assets and geographicaldiversificationPage 12<strong>Deutsche</strong> <strong>Bank</strong> AG/London
5 <strong>July</strong> <strong>2010</strong> <strong>Real</strong> <strong>Estate</strong>, Construction and Building Materials <strong>Egypt</strong> <strong>Real</strong> <strong>Estate</strong>ValuationValuation methodologyInvestment propertiesWe use 2009 BV for immature property. For mature hotels we use 12x <strong>2010</strong>E gross pr<strong>of</strong>it.Development propertiesWe have considered only those projects where construction has started and we have enoughvisibility on the development plan. For PHD and TMG we have considered pre sales till2012E. For <strong>SODIC</strong>, pre-sales are limited to the next 18 months, as we lack proper planbeyond that time.Land bankWe have considered 2007 land auction prices in Cairo (EGP850/sqm in WestCairo/EGP750/sqm in East Cairo) as a base to value land banks. As property prices increasedsince 2007, we believe our base is conservative. We apply different assumptions to residualland (based on the auction price) depending on the quality/location <strong>of</strong> the land. However, anauction is set to take place on 27 th <strong>July</strong> in Sheikh Zayed in Sixth <strong>of</strong> October City (West Cairo)which should create a benchmark valuation for land.• <strong>SODIC</strong>: Cairo land is benchmarked to 2007 auction price in East/West Cairo.Eastown/Westown lands are prime and comparable to lands sold in 2007 auction. Wevalue Yosr land located in West Cairo at cost (EGP230/sqm) as it has been acquired in2008 (non-prime land with low footprint).• PHD: Cairo land is benchmarked to 2007 auction price as location is comparable. NonCairo land (Red Sea, North Coast…) is valued assuming the cost structure <strong>of</strong> a subdeveloperwhich is buying the land (implied land value: EGP238/sqm).• TMG: 30% discount to land in East Cairo as location is less prime than land sold in 2007auction.Note that land bank in Saudi Arabia for TMG and PHD is valued at cost in our SOTP (others),in line with our methodology for Saudi developers.Figure 15: Summary <strong>of</strong> our landbank valuation methodology<strong>SODIC</strong> PHD TMGLand price EGP/sqm after discountIn West Cairo 850 850 850In East Cairo 750 750 525In West Cairo (non-prime) 230 - -Non Cairo - 238 -Residual land bank (m sqm)In West Cairo 0.93 1.3 0In East Cairo 0.67 0.64 19.2In West Cairo (non-prime) 1.3 - -Non Cairo - 15.9 -Total (m sqm) 2.9 17.8 19.2Residual land bank (EGPm)In West Cairo 793 1,098 -In East Cairo 501 481 10,072In West Cairo (non-prime) 290 - -Non Cairo - 3,777 -Land bank valuation (EGPm) 1,584 5,356 10,072Weighted average price (EGP/sqm) 554 300 525Source: <strong>Deutsche</strong> <strong>Bank</strong><strong>Deutsche</strong> <strong>Bank</strong> AG/London Page 13
5 <strong>July</strong> <strong>2010</strong> <strong>Real</strong> <strong>Estate</strong>, Construction and Building Materials <strong>Egypt</strong> <strong>Real</strong> <strong>Estate</strong>Below, we assess the impact <strong>of</strong> change in land value (per sqm), against DB base case, on ourTPs.In Figure 16, we change the value <strong>of</strong> land for one region at a time, while keeping otherregions constant. In Figure 17, we change the value <strong>of</strong> land for all regions together.Figure 16: TP sensitivity to change in value <strong>of</strong> the land (changing one region at a time)% chg from DB base assumption -40% -20% +20% +40%PHD <strong>SODIC</strong> TMG PHD <strong>SODIC</strong> TMG PHD <strong>SODIC</strong> TMG PHD <strong>SODIC</strong> TMGIn West Cairo -7% -8% 0% -4% -4% 0% 4% 4% 0% 7% 8% 0%In East Cairo -3% -5% -26% -2% -2% -13% 2% 2% 13% 3% 5% 26%In West Cairo (non-prime) 0% -3% 0% 0% -1% 0% 0% 1% 0% 0% 3% 0%Non Cairo -24% 0% 0% -12% 0% 0% 12% 0% 0% 24% 0% 0%Source: <strong>Deutsche</strong> <strong>Bank</strong>Figure 17: TP sensitivity to change in value <strong>of</strong> the land (changing all regions together)% chg from DB base assumption -40% -20% +20% +40%PHD <strong>SODIC</strong> TMG PHD <strong>SODIC</strong> TMG PHD <strong>SODIC</strong> TMG PHD <strong>SODIC</strong> TMGTotal upside/downside to TP -35% -16% -26% -17% -8% -13% 17% 8% 13% 35% 16% 26%Source: <strong>Deutsche</strong> <strong>Bank</strong>Page 14<strong>Deutsche</strong> <strong>Bank</strong> AG/London
5 <strong>July</strong> <strong>2010</strong> <strong>Real</strong> <strong>Estate</strong>, Construction and Building Materials <strong>Egypt</strong> <strong>Real</strong> <strong>Estate</strong>Figure 18: <strong>SODIC</strong> SOTPEGPm % EV CommentsDevelopment properties 1,567 48% DCF, WACC @14.6%Investment Properties 0 0% At 2009 BV (no capex incurred till 2009)Landbank 1,584 48% Benchmarked to 2007 auction pricesOthers 128 4% Investments @ 2009 BVTotal EV 3,279Net Cash (2009) - Adjusted rights issue 935Land liability (To be paid over 7 yrs) (146)Equity value 4,068Number <strong>of</strong> shares (m) - rights issue adjusted 36.3NAV per share 112Source: <strong>Deutsche</strong> <strong>Bank</strong> estimatesFigure 19: PHD SOTPEGPm % EVDevelopment properties 4,111 40%CommentsInvestment properties 483 5% 2009 BVLandbank 5,356 52%Associates & other assets 306 3% Includes KSA land at costTotal EV 10,255Net cash (2009) - Rights issue adjusted 98Land liabilities (2009 BV), to be paid over 8yrs (4,180)Equity Value 6,174Number <strong>of</strong> shares (m, rights issue adjusted) 1,048NAV per share 5.9Source: <strong>Deutsche</strong> <strong>Bank</strong> estimatesDCF at WACC, pre-sales limited to 2012E and 36 to40% gross marginWest/East Cairo @ 2007 auction price <strong>of</strong> EGP850/750per sqm. Non-Cairo: implied value assuming subdevelopercost structure (EGP238/sqm)Figure 20: TMG SOTPEGPm % EV CommentsDevelopment properties 8,703 38% DCF @ 15.1% WACCHotels & Resorts 2,211 10% Matured portfolio @ 12x GP, rest at BVLandbank 10,072 44% At 525/sqm (30% discount to 2007 Auction )Others 2,162Total EV 23,149Net debt (2009) (1,708)Equity value 21,441Number <strong>of</strong> shares (m) 2,009SOTP per share 10.7TP per share 7.8Source: <strong>Deutsche</strong> <strong>Bank</strong> estimates8% @ 2009BV (Associates, financial investments, includesKSA land at cost)Figure 21: TMG TP justificationCourt judgment EGP per share LikelihoodPositive 10.7 50%Negative 4.9 50%Average TP 7.8Source: <strong>Deutsche</strong> <strong>Bank</strong> estimates<strong>Deutsche</strong> <strong>Bank</strong> AG/London Page 15
5 <strong>July</strong> <strong>2010</strong> <strong>Real</strong> <strong>Estate</strong>, Construction and Building Materials <strong>Egypt</strong> <strong>Real</strong> <strong>Estate</strong>Company snapshotFigure 22: Revenues <strong>2010</strong>E – EGPmFigure 23: Asset structure Q1 <strong>2010</strong> – EGPm6,0005,0004,0003,0002,0001,0000PHD <strong>SODIC</strong> TMGDevelopment properties Investment properties Other revenuesSource: <strong>Deutsche</strong> <strong>Bank</strong> estimates100%90%80%70%60%50%40%30%20%10%0%2%86%36%2%63% 63%PHD <strong>SODIC</strong> TM GDevelopment properties Investment Properties Financial AssetsInvestments in associates CashSource: Companies data, <strong>Deutsche</strong> <strong>Bank</strong>Figure 24: Landbank breakdown (based on currentprojects) – m sqmFigure 25: Backlog and cash collected – EGPm4530,00045%403525,00036%3025201520,00015,00010,00027%18%1055,0009%-PHD <strong>SODIC</strong> TMG0PHD <strong>SODIC</strong> TMG0%CairoNon-CairoBacklog% Cash collectedSource: Companies data, <strong>Deutsche</strong> <strong>Bank</strong>Source: Companies data, <strong>Deutsche</strong> <strong>Bank</strong>Page 16<strong>Deutsche</strong> <strong>Bank</strong> AG/London
5 <strong>July</strong> <strong>2010</strong> <strong>Real</strong> <strong>Estate</strong>, Construction and Building Materials <strong>Egypt</strong> <strong>Real</strong> <strong>Estate</strong>Putting regulatory risk intoperspectiveAmbiguous legal framework has heightened regulatory riskWe have looked in depth at the legal framework pertaining to the <strong>Egypt</strong>ian real estate sectorand attempted to address the regulatory issues that have captured investors’ attentionrecently:• A law issued in 1979 provided rights to NUCA (New Urban Communities Authority), agovernment entity, to sell land directly (without auction process) to investors/developers.• Another law was issued in 1998 (Law 89 <strong>of</strong> 1998) stipulating sale <strong>of</strong> land fromgovernment entities through an auction process.This new law led the administrative court to issue an adverse judgment on 22 nd June <strong>2010</strong>against TMG’s land acquisition process. This decision has put TMG’s flagship project,‘Madinaty’, in jeopardy.Madinaty judgement to set the benchmarkIn our view, the administrative court verdict against NUCA and the leading developer TMGhas increased risks on an otherwise attractive <strong>Egypt</strong>ian real estate story.<strong>Egypt</strong>ian developers have acquired their land bank through 3 channels: private owners,government entities (such as NUCA) and through government auction process. Thegovernment began land auction process in 2006 while in the same time developers havebeen able to acquire land from government entities through bilateral negotiations. We believeinvestors could see risks <strong>of</strong> potential new cases/negative news flow against developers whohave acquired land from the government. Our analysis suggests that TMG and <strong>SODIC</strong> haveacquired almost 95% <strong>of</strong> their land from government entities through the non auction process,as compared to 8% for PHD. Nevertheless, we estimate that c.61% <strong>of</strong> <strong>SODIC</strong>’s entirelandbank may not be at risk, as 55% was acquired before 1998 law (thus not at risk) andanother 5% was acquired through auction (also not at risk). While we see regulatoryambiguity as a risk we do not expect major cancellations <strong>of</strong> land agreements, as such ascenario would have significant economic damages, impact the government’s credibility andcould put <strong>of</strong>f foreign investors.We believe investors will closely monitor the Supreme Court judgement on TMG case (notime frame yet) as this should set the benchmark. Till then, we see legal overhang dominatingthe sector.<strong>Deutsche</strong> <strong>Bank</strong> AG/London Page 17
5 <strong>July</strong> <strong>2010</strong> <strong>Real</strong> <strong>Estate</strong>, Construction and Building Materials <strong>Egypt</strong> <strong>Real</strong> <strong>Estate</strong>We have described below the snapshot <strong>of</strong> land acquisition for developers under coverage.Figure 26: PHD – Land* acquisition process (m sqm)Figure 27: <strong>SODIC</strong> - Land acquisition process* (m sqm)Acquired throughauction process5%Acquired fromgovernment(instalments)8%Acquired throughauction process6%Land acquired fromthird party87%Acquired fromgovernment(instalments)94%Source: PHD, <strong>Deutsche</strong> <strong>Bank</strong>, * Only <strong>Egypt</strong>Source: <strong>SODIC</strong>, <strong>Deutsche</strong> <strong>Bank</strong> * <strong>SODIC</strong> do not have any land outside <strong>Egypt</strong>Figure 28: TMG – Land* acquisition process (m sqm)Acquired from thirdparty5%Acquired fromgovernment (inkind)95%Source: <strong>Deutsche</strong> <strong>Bank</strong>, * Only <strong>Egypt</strong>Page 18<strong>Deutsche</strong> <strong>Bank</strong> AG/London
5 <strong>July</strong> <strong>2010</strong> <strong>Real</strong> <strong>Estate</strong>, Construction and Building Materials <strong>Egypt</strong> <strong>Real</strong> <strong>Estate</strong>Key themesSupportive demographics lead to strong domestic demandThe <strong>Egypt</strong>ian property market has benefited from supportive demographic fundamentals,namely a large and growing (2%/year 2000-2006) population with a high proportion <strong>of</strong> youngpeople (62% under the age <strong>of</strong> 30). According to CAPMAS, in 2009, <strong>Egypt</strong> had the largestpopulation across the Arab countries with approximately 76m people (excluding above 6m+<strong>Egypt</strong>ians abroad) or c.25% <strong>of</strong> the MENA population. Additionally, <strong>Egypt</strong> has the lowestproportion <strong>of</strong> expatriates (c.5% vs. 90+% for UAE) among the GCC countries, which webelieve creates a solid footing for sustainable organic demand for real estate.This demand for real estate can be gauged from the large and ever-growing population inCairo (where our developers under coverage mostly operate). According to the UN andCAPMAS, Greater Cairo is the 9 th largest metropolitan area in the world, with approximatelyc.20m residents in 2009 (originally designed for 5m people) or c.26% <strong>of</strong> <strong>Egypt</strong>’s population.Figure 29: Greater Cairo population (m)Figure 30: Greater Cairo population as a % <strong>of</strong> <strong>Egypt</strong>population25.020.0Greater CairoPopulation26%15.010.05.0-200020012002200320042005200620072008E2009E<strong>2010</strong>E2011E2012E2013E2014EOther <strong>Egypt</strong>Population74%Source: United Nations, CAPMAS, <strong>Deutsche</strong> <strong>Bank</strong>Source: United Nations, CAPMAS, <strong>Deutsche</strong> <strong>Bank</strong>Figure 31: <strong>Egypt</strong> population by age – 2008Figure 32: Median age <strong>of</strong> population (years)Above 60 years7%4545-60 years31%Less than 15 years32%4035302515-30 years30%20<strong>Egypt</strong>OmanKSAIndiaBahrainWorldQatarUAEChinaUSUKSource: United NationsSource: United Nations, <strong>Deutsche</strong> <strong>Bank</strong><strong>Deutsche</strong> <strong>Bank</strong> AG/London Page 19
5 <strong>July</strong> <strong>2010</strong> <strong>Real</strong> <strong>Estate</strong>, Construction and Building Materials <strong>Egypt</strong> <strong>Real</strong> <strong>Estate</strong>A high proportion <strong>of</strong> young people naturally results in a high number <strong>of</strong> marriages/annum(c.540k/year in <strong>Egypt</strong>), which further supports demand for housing units (according to theArab/Muslim culture, children stay with their parents until marriage and then move out).Assuming the number <strong>of</strong> marriages is divided in the proportion <strong>of</strong> population distribution, thenumber <strong>of</strong> new marriages would lead to a demand for 140k new units/annum in Cairo.Assuming only 30% (because <strong>of</strong> affordability) <strong>of</strong> couples actually move out, this would itselfcreate a demand <strong>of</strong> c.42k units (25% <strong>of</strong> additional demand/year <strong>of</strong> c.151k assumed in ourmodel).Suburbanization leading to growth in Cairo outskirts<strong>Egypt</strong> is seeing strong urbanization due to the migration <strong>of</strong> people from rural areas to urbanareas in search <strong>of</strong> work. Naturally Cairo, which is the economic centre stage <strong>of</strong> <strong>Egypt</strong>, hasalso seen urbanization and currently has one <strong>of</strong> the highest urban densities in the world.According to World Urban Areas, the urban population density <strong>of</strong> Cairo was 35,020 per km2in 2008. High urban density has led to suburbanization with the creation <strong>of</strong> satellite centres inthe East-West axis <strong>of</strong> Cairo, namely New Cairo, <strong>6th</strong> <strong>of</strong> October, 10th <strong>of</strong> Ramadan, 15th <strong>of</strong>May etc., where homebuyers can fulfil their desire for better houses, higher living standardsand a comparatively lower population.Figure 33: Urban and rural population as % <strong>of</strong> totalFigure 34: <strong>Egypt</strong> to witness higher growth urbanizationrate100%5.0%90%4.5%80%4.0%70%60%50%40%30%20%10%0%195019551960196519701975198019851990199520002005<strong>2010</strong>201520202025203020352040204520503.5%3.0%2.5%2.0%1.5%1.0%0.5%0.0%19551960196519701975198019851990199520002005<strong>2010</strong>20152020202520302035Rural populationUrban populationWorld - Urban population growth (CAGR)<strong>Egypt</strong> - Urban population growth (CAGR)Source: Population Division <strong>of</strong> the Department <strong>of</strong> Economic and Social Affairs <strong>of</strong> the United NationsSecretariat, World Population ProspectsSource: Population Division <strong>of</strong> the Department <strong>of</strong> Economic and Social Affairs <strong>of</strong> the United NationsSecretariat, World Population Prospects<strong>Egypt</strong>ians abroad form a key component <strong>of</strong> the property marketExpatriate <strong>Egypt</strong>ians partially contribute to the housing demand in <strong>Egypt</strong>. The typical rationale<strong>of</strong> the purchase is either to hold the property as an investment or to keep it for future use, incase the expatriate decides to settle back in <strong>Egypt</strong>. We estimate that expatriates <strong>Egypt</strong>iansrepresented approximately 6.5m <strong>of</strong> the population and remittances accounted for more than5% <strong>of</strong> GDP in 2008. In our coverage universe, expatriate <strong>Egypt</strong>ians account for 5-10% <strong>of</strong> thebacklog.Page 20<strong>Deutsche</strong> <strong>Bank</strong> AG/London
5 <strong>July</strong> <strong>2010</strong> <strong>Real</strong> <strong>Estate</strong>, Construction and Building Materials <strong>Egypt</strong> <strong>Real</strong> <strong>Estate</strong>Figure 35: Workers’ remittancesFigure 36: Remittance inflows (% total)10,0009,0008,0007,0006,0005,000Others19%US31%4,0003,000UAE19%2,0001,000-2003 2004 2005 2006 2007 2008Saudi Arabia11%Kuwait20%Source: World databankSource: CEICDemand supply analysis: shortfall to widen, especially in the lowtomid-income segmentWe attempt to quantify housing supply and demand imbalances, restricting our analysis toGreater Cairo where developers under coverage have significant exposure. Our analysissuggests an increase in demand/supply shortfall from 264k units (5% <strong>of</strong> demand) in 2009E to730k (11%) by 2014E, <strong>of</strong> which around 35% stems from mid- to upper-income segmentswhere our developers under coverage operate.We base our population assumptions on data from CAPMAS (Central Agency for PublicMobilization and Statistics). The current population for Greater Cairo stood at 19.6m in 2009and, based on historical trends, we expect the population to grow at a 2% CAGR over <strong>2010</strong>E-2014E. As per CAPMAS, the household size has been gradually declining in the past decade(1% per year over 2000-2009). We expect this trend to continue following urbanization andthe increase in number <strong>of</strong> families due to new marriages. We have assumed household sizewill decline from 3.9 in 2009 to 3.8 by 2014E. In addition, considering <strong>Egypt</strong>’s old stock, weassume an annual replacement demand <strong>of</strong> 13% (vs. 15% for KSA), in line with guidanceprovided by the Mortgage Finance Agency (MFA). This implies a total cumulative demand <strong>of</strong>5.7m units for 2009 and 6.4m units in 2014E, or an additional 790k units, demanded during2009E-2014E. On the supply side, we estimate 2009 stock at 5.4m (based on CAPMAS data).Based on future deliveries from developers, we expect supply to grow by 1% per year in<strong>2010</strong>E-2014E.Figure 37: Household size Figure 38: Demand-supply dynamics (units m)4.06.60-0.803.93.93.83.86.406.206.005.805.605.405.205.00-0.70-0.60-0.50-0.40-0.30-0.20-0.103.72009E <strong>2010</strong>E 2011E 2012E 2013E 2014E4.802009E <strong>2010</strong>E 2011E 2012E 2013E 2014E0.00Cumulative demand Cumulative supply Shortfall (in units)Source: CAPMAS, <strong>Deutsche</strong> <strong>Bank</strong> estimatesSource: CAPMAS, MFA, World <strong>Bank</strong>, <strong>Deutsche</strong> <strong>Bank</strong> estimates<strong>Deutsche</strong> <strong>Bank</strong> AG/London Page 21
5 <strong>July</strong> <strong>2010</strong> <strong>Real</strong> <strong>Estate</strong>, Construction and Building Materials <strong>Egypt</strong> <strong>Real</strong> <strong>Estate</strong>Further, we estimate demand and supply for low-/mid-/high-income segments based on<strong>Egypt</strong>’s income distribution provided by the World <strong>Bank</strong> to assess the market for ourdevelopers, which focus on upper-/mid-upper segments. We expect demand/supply shortfallin the target segment (mid-/high-income) ranging from 11% in mid-income and 4% in highincome<strong>of</strong> the total segment demand by 2014E (3m units) against 4% and 3% respectively in2009E.Figure 39: Greater Cairo – cumulative demand / supply and shortfall by income segmentsMillion Units 2009E <strong>2010</strong>E 2014E 2009E 2014ED S SF D S SF D S SF SF as a % <strong>of</strong> totalsegment demandLow income 2.98 2.81 0.17 3.06 2.81 0.24 3.40 3.00 0.40 6% 12%Mid income 2.53 2.44 0.09 2.57 2.45 0.13 2.86 2.53 0.32 4% 11%High income 0.15 0.15 0.00 0.18 0.17 0.01 0.20 0.19 0.01 3% 4%Total 5.66 5.39 0.26 5.81 5.43 0.38 6.45 5.72 0.73Source: World <strong>Bank</strong>, CAPMAS, MFA, <strong>Deutsche</strong> <strong>Bank</strong> estimates, D=demand, S=supply, SF=shortfallIndustry trend: mid-income segment to be the next focusOverall, we observe that the shortfall is especially prominent in the low-/mid-incomesegment. Currently, only TMG in our coverage universe operates meaningfully in the mid- tomid-upper segment. That said, other developers like PHD are progressively increasing theirfocus on this segment, <strong>of</strong>fering smaller units. We expect to see more <strong>of</strong> such migration asthe high-income segment approaches saturation.Figure 40: <strong>Egypt</strong> – demand by income segmentFigure 41: Target segment by developer – <strong>2010</strong>EHigh income3%0.30Mid income45%Low income52%Supply shortfall (units m)0.250.200.150.100.05TMGPHD<strong>SODIC</strong>-Low income Mid income High incomeSource: World <strong>Bank</strong>, <strong>Deutsche</strong> <strong>Bank</strong>Source: <strong>Deutsche</strong> <strong>Bank</strong> estimatesAffordability held back by lack <strong>of</strong> mortgage availabilityMortgage finance market in its infancyThe <strong>Egypt</strong>ian mortgage market is in its infancy, even with the creation <strong>of</strong> mortgage financelaw and Mortgage Finance Authority (MFA) in 2001. Despite strong growth in loans disbursedin the recent past (Source: MFA +274% 2003-2008), mortgages still form an insignificant0.5% <strong>of</strong> GDP (as <strong>of</strong> end-2009). This compares with 16% in Bahrain, 11% in Jordan, andaround 7% in the UAE. We believe conservative banking rules, a lack <strong>of</strong> efficient legalframework in dealing with defaults and high interest rates (12%+) combine to act as animpediment to all pervasive mortgage penetration. However, according to the <strong>Egypt</strong>ianinvestment minister (Reuters), <strong>Egypt</strong> is set to pass a new mortgage finance law (to deal withevictions in the case <strong>of</strong> defaults more efficiently than that which is currently prevailing) afterthe elections at the end <strong>of</strong> the year to provide a thrust to the property sector.Page 22<strong>Deutsche</strong> <strong>Bank</strong> AG/London
5 <strong>July</strong> <strong>2010</strong> <strong>Real</strong> <strong>Estate</strong>, Construction and Building Materials <strong>Egypt</strong> <strong>Real</strong> <strong>Estate</strong>Note that the <strong>Egypt</strong>ian real estate market is primarily a cash market. Cash purchasesrepresented 57% <strong>of</strong> all property transactions in <strong>Egypt</strong> from 2003 to 2008 (source: 2008 <strong>Egypt</strong>Housing Survey – USAID). Most <strong>of</strong> the purchases are made partially with savings andquarterly instalments paid in cash (generally 4 years) until delivery.Figure 42: Mortgage penetration (% <strong>of</strong> GDP)Figure 43: Total mortgage loans (EGPm)18.00%5,00016.00%14.00%12.00%4,0003,00010.00%8.00%2,0006.00%1,0004.00%2.00%0.00%<strong>Egypt</strong> KSA Russia Oman UAE Kuwait Qatar Jordan Bahrain-Sept.2005Dec.2005Mar.2006Jun.2006Sep.2006Dec.2006Mar.2007Sep.2007Dec.2007Mar.2008Jun.2008Sep.2008Mar.2009Jun.2009Sep.2009Dec.2009<strong>Bank</strong>sMortgage Finance CompaniesSource: <strong>Deutsche</strong> <strong>Bank</strong>, European Mortgage FederationSource: <strong>Egypt</strong>ian Financial Supervisory Authority (EFSA)Strong residential price increase in the past few years<strong>Egypt</strong> has seen strong residential price increases in the recent past, mainly due to acombination <strong>of</strong> acute undersupply and a growing economy with increasing disposableincome (World <strong>Bank</strong>/DBe +10-15% CAGR between 2006-<strong>2010</strong>E). Due to the absence <strong>of</strong>historical data, we use Madinaty villas and apartments as a proxy for the market where wesee apartment and villa prices have increased 50-60% between 2007 and now. Such asignificant price increase leads us to analyse where we stand on the affordability front.Figure 44: TMG : Madinaty and Al Rehab apartmentprice increase since 2007 – EGP/sqm6,0005,2004,4003,6002,800Figure 45: TMG: Madinaty and Al Rehab villa priceincrease since 2007 – EGP/sqm13,00012,00011,00010,0009,0008,0007,0006,0002,0002007 2008 2009 <strong>2010</strong>5,0002007 2008 2009 <strong>2010</strong>MadinatyRehabMadinatyRehabSource: TMGSource: TMG<strong>Deutsche</strong> <strong>Bank</strong> AG/London Page 23
5 <strong>July</strong> <strong>2010</strong> <strong>Real</strong> <strong>Estate</strong>, Construction and Building Materials <strong>Egypt</strong> <strong>Real</strong> <strong>Estate</strong>Figure 46: Increase in disposable income for mid income(per household) – EGP/yearFigure 47: Price/income ratio for selected cities110,000100,00090,00080,00070,00060,00050,00040,00030,000CAGR 10%2006 2007 2008 2009 <strong>2010</strong>TokyoMoscowParisBudapestPragueLondonWarsawAverage thresholdCairoNew YorkFrankfurt90 sqm- 2.0 4.0 6.0 8.0 10.0 12.0 14.0Source: World <strong>Bank</strong>, <strong>Deutsche</strong> <strong>Bank</strong>Source: <strong>Deutsche</strong> <strong>Bank</strong>With lack <strong>of</strong> mortgage for <strong>of</strong>f-plan properties, cash market prices stretches affordabilityfor mid-income consumersAt first glance, by comparing price to income ratio for select cities in the world, it seems amid-income apartment (in Madinaty) is still affordable, as the price to income ratio is c.4.5xwhereas a multiple <strong>of</strong> 5x is considered affordable across the globe. However, matters arecomplicated in <strong>Egypt</strong> as it is primarily a cash market with no access to mortgage for <strong>of</strong>f-planproperties.We try to gauge affordability levels for mid income segment at current property prices. Thetypical payment plan in <strong>Egypt</strong> spans for 4/5 years with equal payments each year. It startswith the booking <strong>of</strong> the apartment and ends in delivery <strong>of</strong> the apartment once the finalinstalment is paid. We assume an average mid-income household with a current income <strong>of</strong>EGP100k/annum who is planning to buy an apartment worth EGP450k. Our assumptionincludes that this household has seen 10% annual wage inflation for the past five years, witha savings rate <strong>of</strong> 20%. As a result, its accumulated savings were EGP97k, which is typicallyused to pay the down payment/first instalment <strong>of</strong> 20% (EGP90k).Our analysis suggests that in this case, cash outflows ranges from c.60-80% <strong>of</strong> income,which we believe is beyond the threshold level <strong>of</strong> 50%.Figure 48: Affordability for a cash purchase schemeEGP Yr 1 Yr 2 Yr 3 Yr 4 Yr 5BUA (sqm) 90 90 90 90 90Price/sqm <strong>of</strong> BUA 5,000 5,000 5,000 5,000 5,000Unit Price (EGP) 450,000 450,000 450,000 450,000 450,000Annual Payments 20% 20% 20% 20% 20%Annual cash outflow 90,000 90,000 90,000 90,000 90,000Annual household income 100,000 110,000 121,000 133,100 146,410Wage Inflation 10% 10% 10% 10%Accumulated savings 97,310Cash outflow/income 82% 74% 68% 61%Threshold cash outflow/income 50% 50% 50% 50%Conclusion: Affordable? No No No NoSource: <strong>Deutsche</strong> <strong>Bank</strong> estimatesAffordability could be enhanced by developers <strong>of</strong>fering structured financing schemesHowever, with innovative structured financing schemes such as the one <strong>of</strong>fered by TMG,affordability is greatly enhanced. We have used the same assumptions as illustrated above,Page 24<strong>Deutsche</strong> <strong>Bank</strong> AG/London
5 <strong>July</strong> <strong>2010</strong> <strong>Real</strong> <strong>Estate</strong>, Construction and Building Materials <strong>Egypt</strong> <strong>Real</strong> <strong>Estate</strong>except for the selling prices. To illustrate, we have used TMG’s selling prices (includinginterest component) for a 10 year payment plan. The payment plan is 15% at booking (Yr 1),10% annually for the next 4 years and 9% annually for the next 5 years. Our analysissuggests that although the cash market in its current form largely stretches the affordability<strong>of</strong> mid-income consumers; however, the developers that <strong>of</strong>fer flexible financing schemes forcustomers increases affordability for customers and should be able to recorddisproportionate market share gains.Figure 49: Affordability backed by structured financing schemeEGP Yr 1 Yr 2 Yr 3 Yr 4 Yr 5 Yr 6 Yr 7 Yr 8 Yr 9 Yr 10BUA (sqm) 90 90 90 90 90 90 90 90 90 90Price/sqm <strong>of</strong> BUA 5,938 5,938 5,938 5,938 5,938 5,938 5,938 5,938 5,938 5,938Unit Price (EGP) 534,375 534,375 534,375 534,375 534,375 534,375 534,375 534,375 534,375 534,375Annual Payments 15% 10% 10% 10% 10% 9% 9% 9% 9% 9%Annual cash outflow 80,156 53,438 53,438 53,438 53,438 48,094 48,094 48,094 48,094 48,094Annual household income 100,000 110,000 121,000 133,100 146,410 159,587 172,354 184,419 195,484 205,258Wage Inflation 10% 10% 10% 10% 10% 9% 8% 7% 6% 5%Accumulated savings 97,310Cash Outflow/Income+Savings 41% 49% 44% 40% 36% 30% 28% 26% 25% 23%Threshold cash outflow/income 50% 50% 50% 50% 50% 50% 50% 50% 50% 50%Conclusion: Affordable? Yes Yes Yes Yes Yes Yes Yes Yes Yes YesSource: <strong>Deutsche</strong> <strong>Bank</strong> estimatesScreening for risk…<strong>SODIC</strong> the least risky<strong>SODIC</strong> and PHD need to raise cash to fund investment propertiesAs <strong>of</strong> Q1 <strong>2010</strong>, all the <strong>Egypt</strong>ian developers in our coverage universe had manageable gearinglevels, primarily due to strong cash management in <strong>of</strong>f-plan business models. <strong>SODIC</strong> has thestrongest balance sheet with net cash <strong>of</strong> EGP1.2bn (gearing -55%, 40% <strong>of</strong> market cap),primarily due to the rights issue that raised EGP550m. TMG has a gearing level <strong>of</strong> 7%, whilePHD has a gearing <strong>of</strong> 19%. However, the <strong>Egypt</strong>ian developers’ business models are underevolution to include more investment property in their portfolio to capture the high yields inthe non-residential space. As a result, based on the current development plan, both <strong>SODIC</strong>and PHD need to raise EGP1bn each between <strong>2010</strong>E-2013E, whereas for TMG, the internalcash flows from deliveries in Madinaty and Al Rehab will be sufficient to fund the investmentproperties.Figure 50: Asset structure Q1 <strong>2010</strong> (at cost) – EGPmFigure 51: Net debt equity ratio Q1 <strong>2010</strong> and 2013E100%90%80%7%36%2%30%20%10%7%19%19%13%70%0%60%-10%50%40%86%-20%-30%-12%30%63% 63%-40%20%-50%10%0%TMG <strong>SODIC</strong> PHD-60%-55%TMG PHD <strong>SODIC</strong> TMG PHD <strong>SODIC</strong>Q1 <strong>2010</strong>2013EDevelopment properties Investment Properties Financial AssetsInvestments in associates CashSource: <strong>Deutsche</strong> <strong>Bank</strong> estimatesSource: <strong>Deutsche</strong> <strong>Bank</strong> estimates<strong>Deutsche</strong> <strong>Bank</strong> AG/London Page 25
5 <strong>July</strong> <strong>2010</strong> <strong>Real</strong> <strong>Estate</strong>, Construction and Building Materials <strong>Egypt</strong> <strong>Real</strong> <strong>Estate</strong>Land liability makes PHD more riskyWe analyse below the cash flow pr<strong>of</strong>ile <strong>of</strong> individual developers.• <strong>SODIC</strong> – Although we expect the company to raise debt successfully in <strong>2010</strong>, theinability to do so should not materially affect the financial pr<strong>of</strong>ile and land liability islimited. First, its projects for which fundraising is required are mostly in the drawingboard stage and could be held back if required. Second, outstanding land paymentliabilities are limited to only EGP165m (vs. net cash <strong>of</strong> EGP1.2bn as <strong>of</strong> Q1 <strong>2010</strong>) over thenext seven years (EGP 25m annually).• PHD – PHD has the highest land payment liabilities (EGP3.3bn between <strong>2010</strong>E-2013E).Based on our assumptions, we see that this sum could be paid <strong>of</strong>f from internal cashgeneration from project deliveries. However, if the real estate market conditions weakenand cash collection and presales do not proceed as expected, PHD will be exposed dueto its high liability.• TMG – Insignificant cash land liability. Its land payment liability is essentially in kind (7%<strong>of</strong> constructed residential BUA and 12% <strong>of</strong> constructed residential Madinaty/Al RehabBUA to be given to government in lieu <strong>of</strong> land). Nonetheless, TMG faces significantpotential legal risk in its Madinaty landbank (71% <strong>of</strong> EV – 86% <strong>of</strong> landbank in <strong>Egypt</strong>).Figure 52: <strong>SODIC</strong> cash flow (EGPm)<strong>2010</strong>E 2011E 2012E 2013EOperational cash flowCustomer cash collection (DP) 822 1,403 1,173 1,023Net operating income (IP+Others) 8 9 10 87Capex (DP) (767) (913) (734) (308)Capex (IP) (324) (682) (784) (283)Other capex (PPE) (24) (24) (24) (24)Land payments (24) (24) (24) (24)Other costs (SG&A, Finance Income, Tax etc.) (157) (211) (203) (366)Operating free cash flow (465) (441) (586) 105Investing cash flowInvestments/acquisitions - - - -Free cash flow after investing activities (465) (441) (586) 105Financing cash flowDebt repayment (97) 0 0 0Debt raised 0 500 500 0Equity raised 550 - - -Net free cash flow (12) 59 (86) 105Gearing -19% -1% 18% 13%Opening cash 482 470 528 443Closing cash 470 528 443 548Source: <strong>Deutsche</strong> <strong>Bank</strong> estimatesPage 26<strong>Deutsche</strong> <strong>Bank</strong> AG/London
5 <strong>July</strong> <strong>2010</strong> <strong>Real</strong> <strong>Estate</strong>, Construction and Building Materials <strong>Egypt</strong> <strong>Real</strong> <strong>Estate</strong>Figure 53: PHD cash flow (EGPm)<strong>2010</strong>E 2011E 2012E 2013EOperational cash flowCustomer cash collection (DP) 2,114 2,986 4,042 2,478Net operating income (IP+Others) 22 24 27 32Capex (DP) (1,599) (1,747) (1,846) (1,434)Capex (IP) (258) (352) (473) (340)Other capex (PPE) (219) - - -Land payments (632) (921) (883) (865)Other costs (SG&A and finance income) (144) (441) (558) (306)Operating free cash flow (716) (451) 308 (436)Investing cash flowInvestments / acquisitions (32) 47 47 47Free cash flow after investing activities (748) (404) 354 (389)Financing cash flowDebt repayment (417) (342) (281) (85)Debt raised 550 517 - 1,000Equity raised 699 - - -Other financing cash flow (minority stake) 160 - - -Net free cash flow 244 (229) 74 526Gearing 14% 20% 14% 19%Opening cash 135 379 150 224Closing cash 379 150 224 749Source: <strong>Deutsche</strong> <strong>Bank</strong> estimatesFigure 54: TMG cash flow (EGPm)<strong>2010</strong>E 2011E 2012E 2013EOperational cash flowCustomer cash collection (DP) 6,573 7,367 8,912 5,663Net operating income (IP+Others) 380 441 484 554Capex (DP) (4,959) (4,086) (4,628) (3,702)Capex (IP) (723) (1,057) (1,064) (770)Other capex (PPE) (100) (100) (100) (100)Land payments (146) (31) (15) 0Other costs (SG&A, Finance Income, Tax etc.) (566) (772) (1,107) (907)Operating free cash flow 458 1,763 2,482 739Investing cash flowInvestments/acquisitions - - - -Free cash flow after investing activities 458 1,763 2,482 739Financing cash flowDebt repayment (752) (620) (620) -Debt raised 200 - - -Equity raised - - - -Other financing cash flows - - - -Net free cash flow (94) 1,142 1,862 739Gearing 5% -2% -10% -12%Opening cash 399 304 1,447 3,309Closing cash 304 1447 3,309 4,048Source: <strong>Deutsche</strong> <strong>Bank</strong> estimates<strong>Deutsche</strong> <strong>Bank</strong> AG/London Page 27
5 <strong>July</strong> <strong>2010</strong> <strong>Real</strong> <strong>Estate</strong>, Construction and Building Materials <strong>Egypt</strong> <strong>Real</strong> <strong>Estate</strong>Market mispricing qualityOur analysis suggests that, at current share price levels:• <strong>Egypt</strong>ian developers are valued on only 2009 sales backlog, not assigning any premiumfor future sales (except PHD).• Investors are valuing developers’ landbank at similar price levels (from EGP251/sqm forTMG to EGP326/sqm for PHD), ignoring quality/location.• <strong>SODIC</strong> land is valued EGP299/sqm, a 8% premium to historical cost EGP 277/sqm. Notethat <strong>SODIC</strong> has high quality prime land in the east and west <strong>of</strong> Cairo for which a strongdemand exists. The last auction in 2007 fetched an average price <strong>of</strong> EGP833/sqm insimilar locations as that <strong>of</strong> <strong>SODIC</strong>’s landbank.• PHD land is valued at EGP326/sqm, a 95% premium to historical cost <strong>of</strong> EGP167/sqm.For PHD, we think the premium is explained by the fact that the company has acquiredland at very cheap prices (~80% at EGP46/sqm) and never marked to market (even atIPO)• TMG land is valued at EGP251/sqm, a 36% discount to historical cost EGP 395/sqm(during IPO in 2007).Figure 55: Implied landbank value at current share price<strong>SODIC</strong> PHD TMGCurrent Share price (EGP) 82.0 4.9 7.2Market cap(EGPm) 2,977 5,135 14,384-Development Properties 892 1,475 5,562-Investment Properties - 483 2,211-Net Debt (2009) 935 98 (1,708)-Investments (financial/JV) 128 306 862-Associates 79 1,300-Land liabilities (146) (4,180) -Implicit value <strong>of</strong> land 1,168 6,874 6,157<strong>Egypt</strong>ian residual land bank (m sqm)* 3.9 21.1 24.5Implicit value <strong>of</strong> land (EGP/Sqm) 299 326 251Discount/Premium to cost price 8% 95% -36%Land at cost (EGP/Sqm) - B/S 277 167 395Source: <strong>Deutsche</strong> <strong>Bank</strong> - * Residual land bank ending 2009Strong pre sales in Q1 <strong>2010</strong> after tough 2009 yearFurther, we believe that no premium from future launches is unjustified, as demand remainsstrong in <strong>Egypt</strong> and developers have extensive project launch plans over the next 18 months.<strong>Egypt</strong> showed strong resilience in 2009 compared to other MENA markets. Admittedly, presaleslast year decreased compared to previous years and developers witnessed an increasein cancellations. Nevertheless, cancellations never reached unmanageable proportions andnone <strong>of</strong> the developers in our coverage universe have witnessed material pricing pressuresdespite stretched affordability among consumers. Further, the latest trends suggest a pickupin sales in Q1 <strong>2010</strong> and a decrease in cancellations.Page 28<strong>Deutsche</strong> <strong>Bank</strong> AG/London
5 <strong>July</strong> <strong>2010</strong> <strong>Real</strong> <strong>Estate</strong>, Construction and Building Materials <strong>Egypt</strong> <strong>Real</strong> <strong>Estate</strong>Figure 56: Backlog and backlog/annualized <strong>2010</strong>E-2012ErevenuesFigure 57: Backlog vs. cumulative cancellations (fromQ408-Q110) – EGPm30,0004.812025,0004.010020,0003.28015,0002.46010,0001.6405,0000.820-TMG PHD <strong>SODIC</strong>-0TMG PHD <strong>SODIC</strong>Backlog Q1 <strong>2010</strong> (EGPm)No. <strong>of</strong> years <strong>of</strong> revenuesBacklog 2009 Cumulative cancellations (Indexed to 100)Source: Companies, <strong>Deutsche</strong> <strong>Bank</strong>Source: Companies, <strong>Deutsche</strong> <strong>Bank</strong>Figure 58: TMG net presales (net <strong>of</strong> cancellations) –EGPm900800700600500400300200Figure 59: PHD net presales (net <strong>of</strong> cancellations) –EGPm900700500300100100-(100)Q109 Q209 Q309 Q409 2009Quarterly Avg.Q110(100)(300)Q109 Q209 Q309 Q409 2009Quarterly Avg.Q110Source: TMGSource: PHDFigure 60: <strong>SODIC</strong> backlog evolution - EGPm3,5003,0002,5002,0001,5001,0002008 2009 Q1<strong>2010</strong>Allegria Forty West PolygonSource: <strong>SODIC</strong><strong>Deutsche</strong> <strong>Bank</strong> AG/London Page 29
5 <strong>July</strong> <strong>2010</strong> <strong>Real</strong> <strong>Estate</strong>, Construction and Building Materials <strong>Egypt</strong> <strong>Real</strong> <strong>Estate</strong>Commercial space undersupplied and quality below parGrade A stock comprises only 20% <strong>of</strong> total supplyDespite being the financial and business centre <strong>of</strong> <strong>Egypt</strong>, Cairo does not have a true centralbusiness district, as can be found in other international cities. The <strong>of</strong>fice market is highlyfragmented, with the majority <strong>of</strong> <strong>of</strong>fice space located in various mid-rise buildings throughoutGreater Cairo. Our channel checks with property consultants suggest that 20% is at a GradeA level and that most <strong>of</strong>fice spaces do not meet international standards <strong>of</strong> quality. As a result,there is a vast disparity between average commercial rent and premium rent atUSD260/sqm/pa and USD750/sqm/pa, respectively.Currently, Cairo’s <strong>of</strong>fice market is significantly undersupplied in terms <strong>of</strong> primary grade <strong>of</strong>ficebuildings as well as dedicated <strong>of</strong>fice buildings, as evidenced in the 99% occupancy rate(Source: Colliers). Existing supply consists <strong>of</strong>: (1) residential units that are converted into<strong>of</strong>fices; and (2) a very limited number <strong>of</strong> dedicated <strong>of</strong>fice buildings in Cairo (100% occupancyrates Class A stock).Figure 61: Major existing <strong>of</strong>fice supply in CairoName Location Type GLA (Sqm) Rents in EGP/Sqm/year Rents inUSD/Sqm/yearNile City Nile Corniche Mixed use 40,800* 4,740 840City Stars Nasr City Mixed use 77,000 3,390 600Smart Village Cairo-Alex Desert road Business park 270,000 2,280 415Pyramids Heights Cairo-Alex Desert road Business park 180,000 1,920 349WTC Downtown Tower 19,000 1,680 305Source: Colliers, *(NLA <strong>of</strong>fice component)Prices and rents in commercial segments remain resilientThe commercial segment in most MENA countries has seen significant pricing pressurebetween 2008 and 2009 and Q1 <strong>2010</strong>; however, Cairo has been very resilient. According toColliers, <strong>of</strong>fice rental rates increased 8% between 2008 and 2009 followed by a minordecrease <strong>of</strong> 2% in Q1 <strong>2010</strong> (vs. 17% decline average). Similarly, commercial sale pricesdeclined 5% vs. an average decline <strong>of</strong> 11%.Figure 62: Office: average rent Sqm pa – USDFigure 63: YoY change in commercial prices and rents inQ1 <strong>2010</strong>900800700600500400300200100-AverageStar CapitalNile CityTowersLibertyTower165 TowerAl ObourGardensDHLCommercialTower2008 2009 <strong>2010</strong>JAC OfficeTower10%5%0%-5%-10%-15%Cairo Average Jeddah Riyadh Dubai Abu Dhabi Doha-20%-25%-30%-35%-40%-45%YoY Change in Commercial PricesYoY Change in Com m ercial RentsSource: ColliersSource: ColliersPage 30<strong>Deutsche</strong> <strong>Bank</strong> AG/London
5 <strong>July</strong> <strong>2010</strong> <strong>Real</strong> <strong>Estate</strong>, Construction and Building Materials <strong>Egypt</strong> <strong>Real</strong> <strong>Estate</strong>Demand supply gap to widenGiven the lack <strong>of</strong> land availability in central Cairo and new satellite cities such as New Cairoand <strong>6th</strong> <strong>of</strong> October being the focus <strong>of</strong> development activity, we believe these new townshipsshould house a vast majority <strong>of</strong> <strong>of</strong>fice space in the coming years. However, according toColliers, the gap between demand and supply is expected to further widen due to insufficientsupply and continuously increasing demand on the back <strong>of</strong> economic growth and no newmajor project launches. Note that the number (cumulative) <strong>of</strong> new enterprises increased from3,100 in 2004 to 33k in 2009. Further, development delays (which are not uncommon) couldlead to supply not matching up to expectations.Retail market – Cairo has lowest retail GLA per capitaAccording to Colliers, Cairo has about 400,000 sqm <strong>of</strong> leasable space in retail malls, much <strong>of</strong>which suffers from a general lack <strong>of</strong> services and maintenance (in fact, many <strong>of</strong> existing mallslost their brand name retailers given unmet retailing standards). Cairo also witnesses thelowest per capita retail GLA compared to regional peers. However, according to Colliers,Cairo retail supply will increase by 83% between <strong>2010</strong>-2013 to approximately 1.18 millionsqm GLA. The majority <strong>of</strong> forthcoming shopping malls are developed in large residentialcommunities and are part <strong>of</strong> master plan developments, mainly located in New Cairo and <strong>6th</strong><strong>of</strong> October. However, despite a registered success <strong>of</strong> shopping malls, street-facing retailunits remain more popular and pr<strong>of</strong>itable due to the lower rental rates and absence <strong>of</strong> servicecharges, which lead to higher margins. The real challenge for forthcoming shopping malls liesin attracting retailers to choose them over the street-facing outlets. This could be achievedthrough differentiated products, unmatched service levels and above all rentals that providevalue for money.Figure 64: Retail GLA per capita in peer cities – 2009GLA (sqm)CairoMuscat (Oman)RiyadhFigure 65: Cairo cumulative shopping mall supply (sqmGLA)1,400,0001,200,0001,000,000Abu DhabiDohaDubaiManama (Bahrain)0.0 0.2 0.4 0.6 0.8 1.0 1.2 1.4 1.6 1.8800,000600,000400,000200,000-2009 <strong>2010</strong> 2011 2012 2013Source: ColliersSource: ColliersDecrease in sales in Q1 <strong>2010</strong> despite increase in footfallsRecent trends suggest that the retail segment is not immune to crisis. With consumerstightening their purse strings over global macroeconomic uncertainties, many retailers haveregistered a decrease in sales volumes despite an increase in footfalls. According to Colliers,average rental rates have registered a 12% decrease between 2009 and Q1 <strong>2010</strong> to USD630per sqm p.a.<strong>Deutsche</strong> <strong>Bank</strong> AG/London Page 31
5 <strong>July</strong> <strong>2010</strong> <strong>Real</strong> <strong>Estate</strong>, Construction and Building Materials <strong>Egypt</strong> <strong>Real</strong> <strong>Estate</strong>Hospitality – low Euro/Dollar exchange rate is a threatTourism is a key sector for the <strong>Egypt</strong>ian economy with receipts representing 7% <strong>of</strong> GDP in2008. <strong>Egypt</strong> also witnessed the second-highest number <strong>of</strong> tourist arrivals in the MENA regionin 2008, with Cairo accounting for roughly c.20% <strong>of</strong> total arrivals in <strong>Egypt</strong>. According to the<strong>Egypt</strong>ian Hotel Association, Cairo has a total <strong>of</strong> 153 hotels, combining 24,000 hotel roomsacross all categories with only 20% <strong>of</strong> existing hotel inventory affiliated to international hotelmanagement companies.In 2009, the hotel industry was affected by the downturn and tourist arrivals declined 2% y/y.Similarly, in 2009 ARRs declined 6%y/y and occupancy rates declined 21% y/y, leading to aRevpar decline <strong>of</strong> 22% y/y. As evidenced from leading hotels in the market, it seems that Q1key performance indicators (KPIs) fared better than they did last year. However, in the shortterm, with the Euro/Dollar rate remaining lower than before and Europeans forming asignificant proportion <strong>of</strong> tourist arrivals, we remain sceptical regarding a full-fledged recovery.Longer term, we believe <strong>Egypt</strong> will continue to attract tourists and tourist arrivals willcontinue to grow with improving economic conditions and government initiatives to promotenew leisure tourism destinations in the country. However, increasing competition as well asnew supply will continue to challenge the occupancy levels and the resultant Revpar.Figure 66: Cairo hospitality performance2008 (YoY) 2009 (YoY)ARR 3% -6%Occupancy rate -14% -8%RevPAR -12% -12%Source: ColliersFigure 67: International tourism, number <strong>of</strong> arrivals (m)Figure 68: International tourism, receipts (current mUSD)1440%1400040%1230%1200030%1086420%10%0%1000080006000400020%10%0%2-10%2000-10%02000 2001 2002 2003 2004 2005 2006 2007 2008 2009E-20%02000 2001 2002 2003 2004 2005 2006 2007 2008-20%International tourism, number <strong>of</strong> arrivals (M)ChangeInternational tourism, receipts (current M US$)ChangeSource: World databank, <strong>Deutsche</strong> <strong>Bank</strong>Source: World databank, <strong>Deutsche</strong> <strong>Bank</strong>Page 32<strong>Deutsche</strong> <strong>Bank</strong> AG/London
5 <strong>July</strong> <strong>2010</strong> <strong>Real</strong> <strong>Estate</strong>, Construction and Building Materials <strong>Egypt</strong> <strong>Real</strong> <strong>Estate</strong>Figure 69: Cairo cumulative hotel room supplyFigure 70: Hotels – occupancy rate Cairo17,00016,50016,00090%80%70%60%83%75%62%15,50050%15,00040%14,50014,00030%20%10%13,5002008 2009 <strong>2010</strong> 20110%2007 2008 2009Source: ColliersSource: ColliersFigure 71: Hotels – REVPAR (USD)Figure 72: Hotels – market occupancy250200150135 139 144164 16421580%70%60%50%40%50%62%65%69%71%74% 75% 75%1007530%20%5010%0<strong>Egypt</strong> Aman Jeddah Riyadh Doha Dubai Abu Dhabi0%Doha <strong>Egypt</strong> Aman Dubai Jeddah Riyadh Tripoli AbuDhabiSource: ColliersSource: Colliers<strong>Deutsche</strong> <strong>Bank</strong> AG/London Page 33
5 <strong>July</strong> <strong>2010</strong> <strong>Real</strong> <strong>Estate</strong>, Construction and Building Materials <strong>Egypt</strong> <strong>Real</strong> <strong>Estate</strong>Company pr<strong>of</strong>ilesPage 34<strong>Deutsche</strong> <strong>Bank</strong> AG/London
5 <strong>July</strong> <strong>2010</strong> <strong>Real</strong> <strong>Estate</strong>, Construction and Building Materials <strong>Egypt</strong> <strong>Real</strong> <strong>Estate</strong>Middle East <strong>Egypt</strong><strong>Real</strong> <strong>Estate</strong>, Construction and Building Materials <strong>Real</strong> <strong>Estate</strong>4 <strong>July</strong> <strong>2010</strong><strong>SODIC</strong>Reuters: OCDI.CABloomberg: OCDI ECA differentiated play; initiatewith BuyA company under transformation; initiate with Buy and EGP112 target priceStrong management is transforming <strong>SODIC</strong> from a mono project developer to abuilder <strong>of</strong> downtowns in West/East Cairo with a focus on undersupplied retail andcommercial space. The concept is unique, and lucrative due to high yields. <strong>SODIC</strong>has a low-risk pr<strong>of</strong>ile due to a strong BS (net cash EGP1.2bn, 40% <strong>of</strong> market cap),and a low outstanding land liability. The current share price implies no newlaunches and landbank at slight premium to historical cost. This is unjustifiedgiven the recent strong sales trend and high quality land. Buy with an EGP112 TP.Unique concept <strong>of</strong> building downtowns with focus on non residential<strong>SODIC</strong>’s development concept is differentiated, with a focus on building two newdowntowns in East and West Cairo. Non residential should account for 57% <strong>of</strong>planned BUA, while the company intends to retain 30% <strong>of</strong> BUA as investmentproperty. These segments are significantly undersupplied in Cairo and providehigh yields. Further, the development model is low risk and flexible, leading tominimum outstanding commitments at any given time. Admittedly, <strong>SODIC</strong> needsto raise EGP1bn (our estimate) in 2011E-2012E to build the investment portfolio.However, <strong>SODIC</strong>’s financial pr<strong>of</strong>ile would not weaken materially if the funds couldnot be raised as the projects would still be on the drawing board stage.Market mispricing <strong>SODIC</strong>’s prime landbank and future projectsThe intrinsic value <strong>of</strong> <strong>SODIC</strong> comes from its small but prime landbank entirely inCairo that carries only EGP165m outstanding liability. West Cairo landbank islocated adjacent to Smart Village, a successful business park, whereas East Cairolandbank is located near the fast-growing Kattameya/New Cairo area. Our analysissuggests that the current share price implies landbank at EGP299/sqm vs. a 2007average auction price <strong>of</strong> c.EGP833/sqm (66% discount). Note that in 1Q10,<strong>SODIC</strong> was able to sell land at c.EGP4,000/sqm. Additionally, the market is notassigning any value to the planned projects (next 18 months). This is unjustified as<strong>SODIC</strong> has successfully launched projects during the crisis and increased itsbacklog from EGP1.9bn in 2008 to EGP2.7bn in 2009 and EGP3.4bn in 1Q10.Target price <strong>of</strong> EGP112; initiate with BuyWe derive our target price using SOTP. For development properties, we use DCFwith WACC <strong>of</strong> 14.6%. We conservatively value the landbank at EGP750/sqm inEastown and EGP850/sqm in Westown, in line with 2007 auction prices. FurtherAl Yosr land which was acquired in 2008 is valued at cost (BV, EGP230/sqm).<strong>Egypt</strong>ian developers are exposed to risks such as availability <strong>of</strong> financing,economic conditions and consumer confidence. Key downside risks for <strong>SODIC</strong>include 1) lack <strong>of</strong> affordability in the high-end segment, 2) inability to replenish thelandbank in the future at competitive prices, 3) execution risk (early-stagecompany), 4) and inability to raise debt for future growth.BuyPrice at 4 Jul <strong>2010</strong> (EGP) 80.17Price Target (EGP) 112.0052-week range (EGP) 99.52 - 57.42Price/price relative160120804007/08 1/09 7/09 1/10<strong>SODIC</strong>Hermes <strong>Egypt</strong> Stock M (Rebased)Performance (%) 1m 3m 12mAbsolute -1.2 -17.3 18.6Stock dataMarket cap (EGP)(m) 2,907.8Shares outstanding (m) 36Free float (%) 58Hermes <strong>Egypt</strong> Stock Market Index 718.3Key indicators (FY1)ROE (%) 10.2Net debt/equity (%) -18.6Book value/share (EGP) 68.9Price/book (x) 1.2Net interest cover (x) –EBIT margin (%) 23.0Forecasts and ratiosYear End Dec 31 2009A <strong>2010</strong>E 2011E 2012ERevenue (EGPm) 31 937 1,336 1,017DB EPS (EGP) -4.03 6.01 8.59 5.32P/BV 1.3 1.2 1.0 1.0Source: <strong>Deutsche</strong> <strong>Bank</strong> estimates, company data<strong>Deutsche</strong> <strong>Bank</strong> AG/London Page 35
5 <strong>July</strong> <strong>2010</strong> <strong>Real</strong> <strong>Estate</strong>, Construction and Building Materials <strong>Egypt</strong> <strong>Real</strong> <strong>Estate</strong>Model updated:30 June <strong>2010</strong>Running the numbersMiddle East<strong>Egypt</strong><strong>Real</strong> <strong>Estate</strong><strong>SODIC</strong>Reuters: OCDI.CABuyBloomberg: OCDI ECPrice (5 Jul 10) EGP 79.92Target price EGP 112.0052-week Range EGP 57.42 - 99.52Market Cap (m) EGPm 2,899USDm 509Company Pr<strong>of</strong>ile<strong>SODIC</strong> was established in 1996 to undertake real estatedevelopment projects in Sixth <strong>of</strong> October City (West <strong>of</strong> Cairo).Currently, the company is in a transitional phase, movingfrom a mono project (Allegria) developer <strong>of</strong> residentialproperties for sale, to a developer building downtowns inEast/West Cairo with a diverse product portfolio (residential inhigh-end segment, commercial, retail and hospitality).Additionally, the strategy is to develop a portfolio <strong>of</strong> recurringincome generating rental assets.Price Performance16012080400Jul 08 Dec 08<strong>SODIC</strong>Jun 09 Dec 09 Jun 10Margin Trends1500-150-300-450-600Hermes <strong>Egypt</strong> St ock Market Index (Rebased)0 7 0 8 0 9 10 E 11E 12 EEBITDA Mar gin EBIT Mar ginGrowth & Pr<strong>of</strong>itability500-50-100Solvency30<strong>2010</strong>0-10-20-300 7 0 8 0 9 10 E 11E 12 ESales growth (LHS)ROE (RHS)0 7 0 8 0 9 10 E 11E 12 ENet debt /equit y (LHS)Athmane Benzerroug30<strong>2010</strong>0-10Net interest cover (RHS)+971 4 4283938 athmane.benzerroug@db.com6420Fiscal year end 31-Dec 2007 2008 2009 <strong>2010</strong>E 2011E 2012EFinancial SummaryDB EPS (EGP) 11.81 0.97 -4.03 6.01 8.59 5.32Reported EPS (EGP) 11.81 0.97 -4.03 6.01 8.59 5.32DPS (EGP) 0.00 0.00 0.00 0.00 0.00 0.00BVPS (EGP) 64.8 63.0 62.1 68.9 77.5 82.8Weighted average shares (m) 27 28 28 36 36 36Average market cap (EGPm) 4,514 4,216 1,777 2,899 2,899 2,899Enterprise value (EGPm) 3,981 3,995 1,268 2,307 2,751 3,338Valuation MetricsP/E (DB) (x) 14.2 156.5 nm 13.3 9.3 15.0P/E (Reported) (x) 14.2 156.5 nm 13.3 9.3 15.0P/BV (x) 3.53 0.68 1.29 1.16 1.03 0.97FCF Yield (%) nm 0.4 7.7 nm nm nmDividend Yield (%) 0.0 0.0 0.0 0.0 0.0 0.0EV/Sales (x) 8.1 17.2 41.3 2.5 2.1 3.3EV/EBITDA (x) 15.2 nm nm 10.4 7.6 14.6EV/EBIT (x) 15.2 nm nm 10.7 7.7 15.1Income Statement (EGPm)Sales revenue 493 232 31 937 1,336 1,017Gross pr<strong>of</strong>it 325 123 -2 382 531 405EBITDA 263 -8 -154 222 364 229Depreciation 1 3 6 6 7 7Amortisation 0 0 0 0 0 0EBIT 262 -12 -160 216 357 222Net interest income(expense) 34 12 -1 46 24 -40Associates/affiliates 5 0 0 0 0 40Exceptionals/extraordinaries 0 0 0 0 0 0Other pre-tax income/(expense) 22 38 23 11 11 12Pr<strong>of</strong>it before tax 323 38 -138 273 392 234Income tax expense -8 10 -25 55 78 39Minorities 0 0 2 2 2 2Other post-tax income/(expense) 0 0 0 0 0 0Net pr<strong>of</strong>it 331 27 -114 216 312 193DB adjustments (including dilution) 0 0 0 0 0 0DB Net pr<strong>of</strong>it 331 27 -114 216 312 193Cash Flow (EGPm)Cash flow from operations -12 29 160 -93 288 246Net Capex -8 -14 -24 -372 -729 -832Free cash flow -19 15 136 -465 -441 -586Equity raised/(bought back) 15 0 83 550 0 0Dividends paid 0 -18 -2 0 0 0Net inc/(dec) in borrowings 0 1 96 -97 500 500Other investing/financing cash flows -364 -214 -139 0 0 0Net cash flow -369 -216 174 -12 59 -86Change in working capital -416 -83 291 -318 -32 44Balance Sheet (EGPm)Cash and other liquid assets 467 238 482 470 528 443Tangible fixed assets 36 352 370 711 1,411 2,212Goodwill/intangible assets 0 0 0 0 0 0Associates/investments 85 4 149 149 149 149Other assets 1,674 3,647 4,015 4,782 5,684 6,407Total assets 2,262 4,242 5,016 6,112 7,772 9,211Interest bearing debt 0 1 97 0 500 1,000Other liabilities 498 2,463 3,161 3,586 4,432 5,176Total liabilities 498 2,465 3,258 3,586 4,932 6,176Shareholders' equity 1,745 1,757 1,733 2,499 2,811 3,004Minorities 19 20 26 28 29 31Total shareholders' equity 1,764 1,777 1,758 2,527 2,840 3,035Net debt -467 -237 -385 -470 -28 557Key Company MetricsSales growth (%) 35.8 -52.9 -86.8 nm 42.7 -23.9DB EPS growth (%) -2.0 -91.8 na na 43.0 -38.1EBITDA Margin (%) 53.3 -3.7 -503.0 23.7 27.2 22.5EBIT Margin (%) 53.1 -5.0 -522.8 23.0 26.7 21.8Payout ratio (%) 0.0 0.0 nm 0.0 0.0 0.0ROE (%) 21.1 1.6 -6.6 10.2 11.7 6.6Capex/sales (%) 1.6 6.1 78.8 39.7 54.6 81.8Capex/depreciation (x) 6.8 4.5 4.0 58.5 109.3 118.7Net debt/equity (%) -26.5 -13.3 -21.9 -18.6 -1.0 18.4Net interest cover (x) nm nm nm nm nm 5.5Source: Company data, <strong>Deutsche</strong> <strong>Bank</strong> estimatesPage 36<strong>Deutsche</strong> <strong>Bank</strong> AG/London
5 <strong>July</strong> <strong>2010</strong> <strong>Real</strong> <strong>Estate</strong>, Construction and Building Materials <strong>Egypt</strong> <strong>Real</strong> <strong>Estate</strong>Investment thesisOutlookWe see <strong>SODIC</strong> as a company led by a strong management team and under transformationfrom a mono-project (Allegria) residential developer to a developer <strong>of</strong> downtowns inEast/West Cairo. Its differentiated development concept is about focusing on developing amix <strong>of</strong> residential, commercial, retail and entertainment assets with emphasis on nonresidential and investment properties accounting for 57% and 30%, respectively, <strong>of</strong> theplanned BUA (excluding Allegria). We like the strategy as, due to acute undersupply, yieldsremain high in the non residential space. Additionally, the company’s development model islow risk, scalable and flexible with the master development plan divided into many subphases (again with a mix <strong>of</strong> retail, commercial, residential) resulting in minimum outstandingcommitments. The benefit <strong>of</strong> this strategy is if the real estate market slows down, <strong>SODIC</strong>may not launch new projects and customize the product <strong>of</strong>ferings to match marketrequirements. This was visible during the market slowdown in 2009 when <strong>SODIC</strong> achievedpositive sales momentum by reducing the unit sizes to make products more affordable.Going forward, with its differentiated products, we believe <strong>SODIC</strong> will be able to gain tractionin its planned new launches (in the next 18 months).<strong>SODIC</strong> also boasts a solid balance sheet with net cash <strong>of</strong> EGP1.2bn (end 1Q10, -55%gearing) after a rights issue (EGP550m in 1Q10) and cash management in its Allegria project.Nevertheless, as the company transforms itself to a developer with investment propertyassets, we estimate that it needs to raise c.EGP1bn. We see successful debt rising as thekey catalyst for <strong>SODIC</strong> as this would secure future investment property growth. However,should market conditions weaken and funds cannot be raised, <strong>SODIC</strong> can decide to holdback projects without weakening its financial pr<strong>of</strong>ile as the projects will still be at the drawingboard stage.The intrinsic value <strong>of</strong> <strong>SODIC</strong> comes also from its small but prime landbank. The West Cairolandbank is adjacent to Smart Village, a successful business park, whereas East Cairolandbank is near the fast growing Kattameya/New Cairo area. Our analysis suggests that thecurrent share price implies land bank at EGP299/sqm vs. the 2007 average auction price <strong>of</strong>c.EGP833/sqm (66% discount). Additionally, the market is not assigning any premium toplanned future projects (in the next 18 months). We believe this is unjustified as <strong>SODIC</strong> wasable to successfully launch projects during the crisis and improved its backlog fromEGP1.9bn in 2008 to 2.7bn in 2009 and EGP3.4bn in 1Q10.ValuationWe derive our target price by using SOTP valuation. For development properties, we useDCF with WACC <strong>of</strong> 14.6%. We conservatively value the landbank at EGP750/sqm inEastown, EGP850/sqm in Westown, in line with the 2007 auction prices. Further Al Yosr landwhich was acquired in 2008 is valued at cost (BV, EGP230/sqm).Risks<strong>Egypt</strong>ian real estate developers are exposed to risks such as availability <strong>of</strong> financing,economic conditions and consumer confidence. The key downside risks for <strong>SODIC</strong> include:1. lack <strong>of</strong> affordability in <strong>SODIC</strong>’s projects (high-end segment), 2. inability to replenish thelandbank in the future at competitive prices, 3. execution-related risk (early stage company),4. inability to raise debt for future projects.<strong>Deutsche</strong> <strong>Bank</strong> AG/London Page 37
5 <strong>July</strong> <strong>2010</strong> <strong>Real</strong> <strong>Estate</strong>, Construction and Building Materials <strong>Egypt</strong> <strong>Real</strong> <strong>Estate</strong>SWOT analysisStrengths• A strong management team that has been successful in transforming <strong>SODIC</strong> after pullingit out from a distressed situation.• Cheap landbank in prime locations <strong>of</strong> West Cairo (Sheikh Zayed City/<strong>6th</strong> <strong>of</strong> October) andEast Cairo (Kattameya/New Cairo) is a competitive advantage.• Strong investor linkage (EFG Hermes owns 15%), which could enable easier access t<strong>of</strong>inance.• Diversified product portfolio with plans to create two new downtowns in the east andwest <strong>of</strong> Cairo. Focus is on creating mixed-use communities incorporating commercial,retail and residential properties, which are rare in the <strong>Egypt</strong>ian real estate space.• Strong balance sheet with net cash position (EGP1.2bn as <strong>of</strong> 1Q10) and low outstandingland liability (EGP165m over next seven years)Weaknesses• It does not have a long track record <strong>of</strong> executing large-scale concept developments. Thecompany partnered with Lebanese developer Solidere to overcome the execution risk.• It is an early stage company with much <strong>of</strong> the intrinsic value coming from projects still inthe drawing board. Out <strong>of</strong> the total BUA planned, only 14% is under construction andanother 14% is planned for development in the next 18 months.• Limited landbank <strong>of</strong> only 5.7m sqm compared to peers. Although it is not underimmediate pressure to acquire land, <strong>SODIC</strong> will have to replenish land sometime infuture at a higher price as the land prices momentum in <strong>Egypt</strong> remains strong.Opportunities• Eastown and Westown are conceptually unique in <strong>Egypt</strong>; as a result, we believe thesedevelopments should attract strong investor interest. Successful launches in Eastownand Westown can provide accelerated growth than what is currently assumed.• Its small size enables it to be flexible and nimble footed in launching developments andcustomizing them according to customers’ tastes and preferences. Additionally, itsscalable development model prevents capital lock-up.• Operates in an acutely undersupplied market with project portfolio focusing on high-yieldretail and commercial segments.Threats• Primarily operates in the high-end segment, which <strong>of</strong>fers fewer opportunities than themid to mid-upper segment. Further, this segment has been the favorite playground <strong>of</strong>renowned international developers, which could lead to an increase in competition.• Need to raise EGP1bn <strong>of</strong> debt, in the current environment <strong>of</strong> tight liquidity, to finance itsinvestment properties.• Legal framework in <strong>Egypt</strong> is not very protective for developers. Homebuyers are able tocancel their booking anytime before the handover and developers can retain between 5-10% <strong>of</strong> the sales value. Nevertheless, the refund is not made before the unit is re-sold.Page 38<strong>Deutsche</strong> <strong>Bank</strong> AG/London
5 <strong>July</strong> <strong>2010</strong> <strong>Real</strong> <strong>Estate</strong>, Construction and Building Materials <strong>Egypt</strong> <strong>Real</strong> <strong>Estate</strong>ValuationSOTP <strong>of</strong> EGP112/shareWe value <strong>SODIC</strong> by using a SOTP with specific assumptions for each business line.Development propertiesWe use DCF to value development properties (WACC <strong>of</strong> 14.6%, RF rate 8.5%, risk premium<strong>of</strong> 5.5%, and beta <strong>of</strong> 1.1). Our <strong>2010</strong>E price assumptions are EGP8-10k.sqm for residential,EGP12.5k/sqm for commercial with gross margins <strong>of</strong> 35-40%. We value only those projectswhich have either been already launched or scheduled for launch in the next 18 months.Landbank valuationWe value the Eastown and Westown landbanks by benchmarking the land price to the priceachieved in the 2007 auction conducted by NUCA (EGP850/sqm for Sheikh Zayed andEGP750/sqm for New Cairo). For Al Yosr land, which was acquired in 2008, we value at cost<strong>of</strong> EGP230/sqm due to lack <strong>of</strong> any benchmark price. Our consolidated landbank valuationturns out to be EGP554/sqm. (Figure 122)Figure 73: <strong>SODIC</strong> SOTPEGPm % EV CommentsDevelopment properties 1,567 48% DCF, WACC @14.6%Investment Properties 0 0% At 2009 BV (no capex incurred till 2009)Landbank 1,584 48% Benchmarked to 2007 auction pricesOthers 128 4% Investments @ 2009 BVTotal EV 3,279 100%Net Cash (2009) ) - Adjusted rights issue 935Land liability (To be paid over 7 yrs) (146)Equity value 4,068Number <strong>of</strong> shares (m) - rights issue adjusted 36.3NAV per share 112Source: <strong>Deutsche</strong> <strong>Bank</strong> estimatesFigure 74: SOTP by segmentsFigure 75: SOTP by projectsNet cash20%Net Cash20%Allegria19%Others3%Developmentproperties39%Others6%Other Landbank11%Westown26%Lanbank39%InvestmentProperties0%Kattameya Plaza3%Eastown16%Source: <strong>Deutsche</strong> <strong>Bank</strong>Source: <strong>Deutsche</strong> <strong>Bank</strong><strong>Deutsche</strong> <strong>Bank</strong> AG/London Page 39
5 <strong>July</strong> <strong>2010</strong> <strong>Real</strong> <strong>Estate</strong>, Construction and Building Materials <strong>Egypt</strong> <strong>Real</strong> <strong>Estate</strong>Market neglects the quality <strong>of</strong> <strong>SODIC</strong>’s landbank and potentialvalue-creation from future projectsAt the current share price, we believe investors are neither appreciating the potential growth<strong>of</strong> the company from new project launches (lined up for the next 18 months) nor appreciatingthe quality <strong>of</strong> the landbank.First, the current stock price implies residual landbank (excluding the land equivalent <strong>of</strong> thealready sold portion <strong>of</strong> Allegria) at slight premium to historical cost <strong>of</strong> EGP277/sqm vs.<strong>Deutsche</strong> <strong>Bank</strong>’s estimate EGP554/sqm. Note that our estimate is conservative, based on2007 auction prices <strong>of</strong> EGP750/sqm achieved in New Cairo and EGP850/sqm achieved inSheikh Zayed, similar locations as that <strong>of</strong> <strong>SODIC</strong>’s landbank. Additionally, we value Al Yosr(West Cairo,) the land acquired in 2008, at a cost price <strong>of</strong> EGP230/sqm. Considering the factthat property prices have significantly moved up since 2007, we believe land values may havealso appreciated in tandem.Secondly, the current share price does not reflect the potential growth that we believe couldbe obtained from new project launches lined up in the next 18 months. We believe this isunjustified as <strong>SODIC</strong> has been able to generate positive sales momentum in 2009 and 1Q10when homebuyers supposedly tightened their purses. The backlog grew from EGP1.9bn byend-2008 to EGP2.7bn in 2009 and EGP3.4bn in 1Q10. Thus, we believe that <strong>SODIC</strong> will beable to successfully launch and sell its projects.Figure 76: <strong>Deutsche</strong> <strong>Bank</strong>’s estimate vs. implied valuation <strong>of</strong> segmental assets at current stock priceEGP/shareDBeImplied valuation @current share priceCommentsDevelopment properties 43 25* Includes only the pre sold portion <strong>of</strong> AllegriaInvestment properties - -Landbank 44 32 Values the landbank at 8% premium to historical cost <strong>of</strong> EGP277/sqmOthers 4 4Net Cash 22 22Total 112 82Source: <strong>Deutsche</strong> <strong>Bank</strong>Figure 77: Residual value <strong>of</strong> landbank (at 2009 Backlog levels)EGP/sqm Cost Price (EGP/sqm) Area (sqm) CommentsAllegria 125 637,875 A portion acquired in 1996 and a portion acquired in 2007Westown 56 1,073,293 Acquired in 1996, located in Sheikh ZayedAl Yosr (West Cairo) 230 1,260,000 Acquired in 2008, located in West CairoEast Cairo 698 933,963 Acquired in 2006, located in New CairoAverage Px/sqm 277 3,905,131* *total residual landbankSource: <strong>Deutsche</strong> <strong>Bank</strong>, <strong>SODIC</strong><strong>Deutsche</strong> <strong>Bank</strong>’s estimate <strong>of</strong> landbank is at a c.40-60% discount to the NAVAccording to our calculation, the landbank is at a c.58% discount to the NAV. We assume thecurrent selling price <strong>of</strong> apartments at EGP10,000/sqm, with gross margin <strong>of</strong> 40% and tax rate<strong>of</strong> 20%. Even if we were to assume that the high-end market would slow down and <strong>SODIC</strong>will have to customize its development property portfolio to the middle and upper incomesegments with selling price <strong>of</strong> cEGP7,750/sqm and gross margin <strong>of</strong> 35%; <strong>Deutsche</strong> <strong>Bank</strong>’sestimate <strong>of</strong> the landbank would still imply a c.40% discount to the NAV.Page 40<strong>Deutsche</strong> <strong>Bank</strong> AG/London
5 <strong>July</strong> <strong>2010</strong> <strong>Real</strong> <strong>Estate</strong>, Construction and Building Materials <strong>Egypt</strong> <strong>Real</strong> <strong>Estate</strong>Figure 78: <strong>Deutsche</strong> <strong>Bank</strong>’s estimate <strong>of</strong> landbank vs. NAVLocationDBe for Land Valuationused in SOTPIf sold to high-end customersIf sold to mid-upper customersNAV/sqm % Discount NAV/sqm % <strong>of</strong> discountWestown 850 2,296 -63% 1,557 -45%Autoville 850 2,296 -63% 1,557 -45%Al Yosr* 230 230 0% 230 0%Eastown 750 1,948 -61% 1,321 -43%Blended average 554 1,305 -58% 918 -40%Source: <strong>Deutsche</strong> <strong>Bank</strong>, *valuing it at cost as we have no detailed plans for the project yet<strong>Deutsche</strong> <strong>Bank</strong> AG/London Page 41
5 <strong>July</strong> <strong>2010</strong> <strong>Real</strong> <strong>Estate</strong>, Construction and Building Materials <strong>Egypt</strong> <strong>Real</strong> <strong>Estate</strong>Company pr<strong>of</strong>ileCorporate pr<strong>of</strong>ile<strong>SODIC</strong> was established in 1996 to undertake real estate development projects in Sixth <strong>of</strong>October City (West <strong>of</strong> Cairo). Currently, the company is in a transitional phase, moving from amono project (Allegria) developer <strong>of</strong> residential properties for sale, to a developer with adiverse product portfolio (residential in high-end segment, commercial, retail and hospitality).Additionally, the strategy is to develop a portfolio <strong>of</strong> recurring income generating rentalassets. Albeit smaller than its peer <strong>Egypt</strong>ian developers TMG and PHD, the most valuableasset <strong>of</strong> <strong>SODIC</strong> is its 5.7m sqm <strong>of</strong> cheap but prime landbank in the fast-growing Eastern andWestern suburbs <strong>of</strong> Cairo with plans to develop c.4m sqm <strong>of</strong> BUA. Having said that, we notethat most <strong>of</strong> the developments are still at the drawing board stage (no unit deliveries in thepast two years with new deliveries in Allegria starting in <strong>2010</strong>), which <strong>of</strong>fers <strong>SODIC</strong> theflexibility to rework/redesign developments should the real estate market face a slowdown.Below is the development plan <strong>of</strong> <strong>SODIC</strong>’s current landbank.Figure 79: Landbank split - Total 5.7m sqm, end 2009 Figure 80: BUA by project - Total 4m sqm, end 2009Kattameya Plaza(East Cairo)2%Eastown (EastCairo)14%Westown (WestCairo)18%Eastown (eastCairo)27%Al Yosr (WestCairo)22%Autoville (WestCairo)1%Allegria (WestCairo)43%Kattameya Plaza(East Cairo)3%Al Yosr (WestCairo)5%Autoville (WestCairo)0% Allegria (WestCairo)14%Westown (WestCairo)51%Source: <strong>SODIC</strong>, <strong>Deutsche</strong> <strong>Bank</strong>Source: <strong>SODIC</strong>, <strong>Deutsche</strong> <strong>Bank</strong>Figure 81: BUA by end use – Sqm, end 2009 Figure 82: BUA by revenue allocation – Sqm, end 2009Retail23%Hotels3%Lease24%Land Sale29%Residential42%Office32%BUA Sale47%Source: <strong>SODIC</strong>, <strong>Deutsche</strong> <strong>Bank</strong>Source: <strong>SODIC</strong>, <strong>Deutsche</strong> <strong>Bank</strong>Page 42<strong>Deutsche</strong> <strong>Bank</strong> AG/London
5 <strong>July</strong> <strong>2010</strong> <strong>Real</strong> <strong>Estate</strong>, Construction and Building Materials <strong>Egypt</strong> <strong>Real</strong> <strong>Estate</strong>Strong management team is a differentiator<strong>SODIC</strong> is run by a strong management team (appointed in 2006 to restructure the company).The management team has been fairly successful in resurrecting <strong>SODIC</strong> from a distressedsituation, arranging finance for land acquisitions at prime locations, monetizing the value <strong>of</strong><strong>SODIC</strong>’s landbank, partnering with other investors in its projects and above all providing aclear growth strategy for future.Shareholding structureEFG Hermes owns 15% (through its 94% holding in October Property Development) <strong>of</strong><strong>SODIC</strong>, followed by Olayan Saudi Investment Company (12%) and private individuals (12%).Free float is 58% while foreigners can own 100% <strong>of</strong> the stock.Figure 83: Shareholding structureOctober PropertyDevelopment16%Olayan SaudiInvestmentCompany12%Source: ZawyaFree Float58% Private Individuals12%GRE <strong>Egypt</strong>Other Corporate1%1%Key managersMr. Maher Rafik Maksoud – CEO and managing director. Prior to joining <strong>SODIC</strong>, heworked for eight years with Orascom Hotels and Development as executive vice presidentand CEO <strong>of</strong> the hotels division.Mr. Ahmed H. Dabbous – CFO. Prior to joining <strong>SODIC</strong>, he worked as a senior investment<strong>of</strong>ficer <strong>of</strong> IFC in Washington and as a country manager for Actis Africa.Mr. Youssef Hammad – Chief Commercial Officer. Prior to joining <strong>SODIC</strong>, he worked withProcter & Gamble, Orascom hotels and Orange.Mr. Ahmed Demerdash Badrawi – Chief Business Development Officer. Prior to joining<strong>SODIC</strong>, he had a string <strong>of</strong> entrepreneurial successes having founded <strong>Egypt</strong>’s first recordmanagement business and <strong>Egypt</strong>’s first English language independent newspaper.<strong>Deutsche</strong> <strong>Bank</strong> AG/London Page 43
5 <strong>July</strong> <strong>2010</strong> <strong>Real</strong> <strong>Estate</strong>, Construction and Building Materials <strong>Egypt</strong> <strong>Real</strong> <strong>Estate</strong><strong>Real</strong> estate portfolioKey development projectsAllegria (West Cairo)Spread over 2.4m sqm <strong>of</strong> land (556k sqm <strong>of</strong> planned BUA), Allegria is the flagship project <strong>of</strong><strong>SODIC</strong>. This luxury residential development located in West Cairo on Cairo Alexandria Roadtargets high end clients and will contain 1,224 residential units (in four phases) along with an18-hole Greg Norman Golf Course. The project was launched in 2007 and will be deliveredbetween <strong>2010</strong>-2012. As <strong>of</strong> end March <strong>2010</strong>, the project was c.75% sold (1,037 units) andc.45% <strong>of</strong> the cash has been collected on the sold units. The project has been well receivedby the market, as seen by strong price appreciation since launch.Westown (West Cairo)Located near Sheikh Zayed/Sixth <strong>of</strong> October City on Cairo Alexandria Road, Westown is one<strong>of</strong> the two downtowns that <strong>SODIC</strong> intends to develop. It will be spread over 1.2m sqm <strong>of</strong>land (BUA 2.0m sqm) and is set to be a mixed-use community with an optimum mix <strong>of</strong>residential, retail, commercial and hospitality space. The project was launched in 2009 andwill be delivered between 2013-2020. Westown includes a mix <strong>of</strong> “for sale” and “for lease”properties. The development has a strong location advantage as it is close to Smart Village, asuccessful business park. In light <strong>of</strong> the current market conditions, although the entire projectis master planned, it will not be launched together. Instead, it will be launched in phases (subdevelopments) with each phase catering to a mix <strong>of</strong> residential/commercial/retail usage. Welike the strategy as it reduces the risk <strong>of</strong> heavy upfront capex outlay in case the sales do notpick up as expected, and minimizes the risk <strong>of</strong> unsold inventory at completion.Figure 84: Westown BUA by segment – Sqm, end 2009 Figure 85: BUA by revenue mix – Sqm, end 2009Entertainment9%Hotel2%Residential23%Sale28%Retail18%Land Sale40%Commercial48%Lease32%Source: <strong>SODIC</strong>Source: <strong>SODIC</strong>The developments in Westown planned for the next 18months are the following.• Polygon – Launched in <strong>2010</strong>, Polygon is primarily an <strong>of</strong>fice complex (51k sqm) alongwith retail space <strong>of</strong> 3ksqm. 47% <strong>of</strong> the BUA is intended for sale while the remaining53% will be held as investment property. c.43% <strong>of</strong> the commercial space meant for salehas already been sold.• 40 West – Launched in <strong>2010</strong>, with a BUA <strong>of</strong> 57k sqm, 40 West is a mixed-use project(73% residential, 12% commercial, 5% retail, 10% hotel). 73% <strong>of</strong> the project is meantfor sale while the rest is expected to be held as investment property. c.42% <strong>of</strong> theresidential portion has already been sold.Page 44<strong>Deutsche</strong> <strong>Bank</strong> AG/London
5 <strong>July</strong> <strong>2010</strong> <strong>Real</strong> <strong>Estate</strong>, Construction and Building Materials <strong>Egypt</strong> <strong>Real</strong> <strong>Estate</strong>• WT Mall – With 125k sqm <strong>of</strong> BUA, this is a retail mall that is expected to be launched in2H10. The project will be completed by 2013 at a capex <strong>of</strong> c.EGP1bn. We expect yieldsto be high in this project, which will be jointly developed with Solidere (50/50).Eastown (East Cairo)Similar to Westown, Eastown is another downtown development <strong>of</strong> <strong>SODIC</strong> in the East <strong>of</strong>Cairo. Spread over 860k sqm <strong>of</strong> land (BUA 1.1m sqm), it is set to become a mixed-usecommunity. Again similar to Westown, the location is strategic as it is close to fast growingKattameya/New Cairo and is adjacent to the new campus <strong>of</strong> American University in Cairo andCairo International Airport. The project will be delivered between 2013-2020 and will consist<strong>of</strong> a mix <strong>of</strong> “for sale” and “for lease” properties. Similar to Westown, although a detailedMasterplan is in place for Eastown, the development will be done in phases in light <strong>of</strong> thecurrent market conditions.Figure 86: Eastown BUA by segment - SqmFigure 87: Eastown BUA by revenue mix - SqmRetail23%Hotel10%Entertainment2%Residential29%Land Sale37%Sale32%Commercial36%Lease31%Source: <strong>Deutsche</strong> <strong>Bank</strong>Source: <strong>Deutsche</strong> <strong>Bank</strong>Following are the Eastown developments that are planned for the next 18 months.• Esplanade - Set to be launched in 2H10, spread over 50k sqm <strong>of</strong> BUA, Esplanade is ahigh end residential complex intended for sale.• ET Office Park - Set to be launched in <strong>2010</strong>, ET Office Park will be a mixed usecommunity spread over 78k sqm <strong>of</strong> BUA (residential 10% <strong>of</strong> BUA, commercial 39%,retail 51%. 19% <strong>of</strong> BUA is meant for sale while 81% will be held as investment property.• ET Mall – Set to be launched in 2011, ET Mall will be spread over 100ksqm <strong>of</strong> BUA. Theproject is expected to be completed by 2013 at a capex <strong>of</strong> c.EGP800m. Like WestownMall, the yield is expected to be high.Kattameya Plaza (East Cairo)Spread over 126k sqm (114k sqm BUA), Kattameya Plaza is primarily a mid-income residentialdevelopment (92% residential, 8% commercial) located in the heart <strong>of</strong> New Cairo and is inclose proximity to Cairo International Airport and American University in Cairo. After a s<strong>of</strong>tlaunch in 2008, the project is estimated to be fully launched in <strong>2010</strong> and completed by 2012.It will include low-density apartment buildings with 466+ residential units.CasaLocated between Allegria and Beverly Hills in West Cairo, Casa is a residential developmentjointly developed by <strong>SODIC</strong> (20%), Palm Hills (51%) and others (29%). The developmentcontains c.1,200 low-density apartment units. The project was launched in 2007 and isestimated to be completed by 2012. <strong>SODIC</strong> is the minority shareholder in Casa and willrecognize its share <strong>of</strong> net pr<strong>of</strong>it from the project at completion in 2012 as investment income.<strong>Deutsche</strong> <strong>Bank</strong> AG/London Page 45
5 <strong>July</strong> <strong>2010</strong> <strong>Real</strong> <strong>Estate</strong>, Construction and Building Materials <strong>Egypt</strong> <strong>Real</strong> <strong>Estate</strong>Strategy and outlookValuable prime land in East and West CairoPrecious land in East and West Cairo is a prized possessionThe unique selling proposition and much <strong>of</strong> the intrinsic value <strong>of</strong> <strong>SODIC</strong> comes from plannedprojects in its landbank. <strong>SODIC</strong> has the smallest landbank compared to TMG and PHD buthas the most strategic location. It has 4.8m sqm in West <strong>of</strong> Cairo and 0.9msqm in East <strong>of</strong>Cairo where <strong>SODIC</strong> intends to create two new downtowns. West Cairo landbank is in Cairo-Alexandria Road, adjacent to Smart Village, an extremely successful, newly built commercialdevelopment. The population <strong>of</strong> smart village could become a captive audience forWestown’s residential space, whereas the retail space could become an obvious choice forthe residents <strong>of</strong> Sheikh Zayed City and pr<strong>of</strong>essionals in Smart Village alike. Similarly, its EastCairo landbank is close to fast growing Kattameya/New Cairo and is adjacent to the newcampus <strong>of</strong> American University in Cairo and Cairo International Airport. Of late, both areashave seen significant transaction activity from developers (<strong>Egypt</strong>ians/GCC alike), boosted byhomebuyers’ appetite for the higher living standards and the comparatively lower populationdensity <strong>of</strong> Cairo’s suburbs.Figure 88: <strong>SODIC</strong> landbank locationsSource: <strong>SODIC</strong><strong>SODIC</strong>’s landbank is at a 67% discount to 2007 average auction priceCurrently <strong>SODIC</strong> has 5.7m sqm <strong>of</strong> landbank in which 4.0m sqm <strong>of</strong> BUA has been planned.Most <strong>of</strong> the landbank has historically been acquired at cheap prices which we believe willlead to higher project pr<strong>of</strong>itability. Additionally, liability related to <strong>SODIC</strong>’s landbank is minimalas the landbank is mostly paid for except EGP165m that will be paid over a period <strong>of</strong> sevenyears starting <strong>2010</strong> (c.EGP24m/year). On average, we estimate <strong>SODIC</strong>’s residual landbank(after excluding land equivalent <strong>of</strong> the sold portion <strong>of</strong> Allegria) at EGP277/sqm implying a67% discount to the average price <strong>of</strong> EGP833/sqm achieved in the 2007 auction held byNational Urban Communities Association (<strong>Egypt</strong>).Page 46<strong>Deutsche</strong> <strong>Bank</strong> AG/London
5 <strong>July</strong> <strong>2010</strong> <strong>Real</strong> <strong>Estate</strong>, Construction and Building Materials <strong>Egypt</strong> <strong>Real</strong> <strong>Estate</strong>Figure 89: Cost <strong>of</strong> <strong>SODIC</strong>’s landbankProject Acquired Area (‘000 sqm) Px/ SqmAllegria 1996/2007 637,875 125Westown 1996 1,073,293 56Al Yosr (West Cairo) 2008 1,260,000 230East Cairo 2006 933,963 698Total 3,905,131 277Source: <strong>Deutsche</strong> <strong>Bank</strong>Table below highlights the transactions achieved in the 2007 auction held by NUCA.Figure 90: Land auction – 2007Location Purchaser Area (msqm) Px/sqm(EGP)New Cairo Damac - Dubai 6.1 753New Cairo Barwa <strong>Real</strong> <strong>Estate</strong> - Qatar 8.0 734New Cairo Ro'ya <strong>Real</strong> <strong>Estate</strong> - <strong>Egypt</strong> 1.9 1,288<strong>6th</strong> <strong>of</strong> October Al Hokair-KSA 0.8 1,302Sheikh Zayed Mesh'al <strong>Egypt</strong> 1.7 852Total 18.5 833Source: <strong>SODIC</strong>Solidere option at EGP950/sqm in Westown and EGP1,100/sqm in Eastown provides afloor market value for the landbank<strong>SODIC</strong> partnered with Lebanese developer Solidere (successfully reconstructed Beirut Citycentre) to develop Westown and Eastown. In return for its services, Solidere had an option topurchase Westown land at EGP950/sqm and Eastown land at EGP1,100/sqm. The Westownoption was exercised in 2008. We believe this has provided a realistic market value for itslandbank. Additionally, Solidere would take 7.5% <strong>of</strong> revenues on investment properties(above 80% occupancy) and claim 10% <strong>of</strong> gross pr<strong>of</strong>it on development properties.<strong>SODIC</strong> is not under immediate pressure to acquire landHaving acknowledged the quality and competitive advantage <strong>of</strong> <strong>SODIC</strong>’s landbank, we notethat its landbank is smaller than its peer group and at some point in the future the companyhas to replenish it at current market prices. That said, at the current pace <strong>of</strong> development(unless there is a development frenzy in the market), the company is not under anyimmediate pressure to acquire land and its current landbank could feed <strong>SODIC</strong> for the nextfew years. Excluding Allegria, <strong>SODIC</strong> has a development plan <strong>of</strong> 3.4m sqm <strong>of</strong> BUA <strong>of</strong> which itplans to launch 470k sqm <strong>of</strong> BUA for development in the next 18 months.Diversified portfolio with acute undersupplied commercial andretail developments57% <strong>of</strong> the planned BUA is intended for non residential use (commercial/retail)Historically, <strong>Egypt</strong>ian developers have focused on developing residential properties. As aresult, even in the fast growing suburbs in the East and West <strong>of</strong> Cairo, we see a visibleshortage <strong>of</strong> commercial, retail and other entertainment facilities (many residential convertedto commercial properties). As a result, these suburbs, although <strong>of</strong>fering quality residentialspace, have not been able to become fully fledged self-contained satellite cities. This iswhere <strong>SODIC</strong> intends to differentiate itself from the peer developers. The company’s focus isnot only on residential developments (high-end products) but more to build two distinctdowntowns in the East and West <strong>of</strong> Cairo These downtowns are to be mixed-usecommunities where people can both live and work. According to <strong>SODIC</strong>’s development plan,between <strong>2010</strong>-2018 (excluding Allegria as it is already under construction), nonresidentialwould account for 57% <strong>of</strong> the planned BUA.<strong>Deutsche</strong> <strong>Bank</strong> AG/London Page 47
5 <strong>July</strong> <strong>2010</strong> <strong>Real</strong> <strong>Estate</strong>, Construction and Building Materials <strong>Egypt</strong> <strong>Real</strong> <strong>Estate</strong>Figure 91: Planned BUA breakdown (<strong>2010</strong>-2018)excluding AllegriaFigure 92: BUA breakdown by project and businesssegment (sqm)EntertainmentHotel 5%4%1,800,0001,600,000Retail15%1,400,0001,200,000Residential43%1,000,000800,000600,000400,000200,000Commercial33%0Westown Eastown Allegria KattameyaPlazaAl YosrDahshourMallResidential Commercial Retail Hotel EntertainmentSource: <strong>SODIC</strong>Source: <strong>SODIC</strong>30% <strong>of</strong> the planned BUA to be retained as investment propertyBeyond the strategy to build properties for sale, <strong>SODIC</strong> intends to develop and hold a portion<strong>of</strong> retail and commercial properties as long-term investment properties. The broad plan is tosell 100% <strong>of</strong> residential properties, hold 100% <strong>of</strong> retail properties and hold 50% <strong>of</strong>commercial properties. We like this strategy as yields are high (more so for developers) dueto the demand-supply gap for non-residential developments. As a result, investment propertyrevenues are expected to ramp up significantly over time and account for 24% (our estimate)<strong>of</strong> revenues in 2014 (0 in 2009). This would lead to creation <strong>of</strong> a solid asset base in anundersupplied market, coupled with a more stable earnings pr<strong>of</strong>ile.Figure 93: Investment property revenues - EGPm700600500400100%80%60%300200100-2009 2011E 2013E 2014E 2015E40%20%0%IP RevenuesIP Revenues as a % <strong>of</strong> total revenuesSource: <strong>SODIC</strong>, <strong>Deutsche</strong> <strong>Bank</strong>Figure 94: BUA breakdown by end use in Westown -SqmFigure 95: BUA breakdown by end use in EastownLand Sale40%Sale28%Land Sale37%Sale32%Lease32%Lease31%Source: <strong>SODIC</strong>Source: <strong>SODIC</strong>Page 48<strong>Deutsche</strong> <strong>Bank</strong> AG/London
5 <strong>July</strong> <strong>2010</strong> <strong>Real</strong> <strong>Estate</strong>, Construction and Building Materials <strong>Egypt</strong> <strong>Real</strong> <strong>Estate</strong>Strong growth in residential presales with minimal cancellations (2% <strong>of</strong> backlog)As <strong>of</strong> 1Q10, <strong>SODIC</strong> has a backlog <strong>of</strong> EGP3.5bn, which provides earnings visibility for the nextthree years. Of the backlog, Allegria accounts for 90%, while 40West and Polygon accountfor 6% and 4%, respectively. The demand for <strong>SODIC</strong>’s product can be gauged from the factthat the backlog has continuously grown since 2008 with EGP 793m <strong>of</strong> new presales in 2009(+42% y/y) (at the peak <strong>of</strong> financial crisis) and a further EGP752m <strong>of</strong> new sales in 1Q10(+24% over 2009 end). Finally, the customer base <strong>of</strong> <strong>SODIC</strong> seems to be solid with minimaldelinquent payments, which according to the company never exceeded 1% <strong>of</strong> receivables,and cancellations from 3Q08 to 1Q10 amounted to only c. EGP60m (c.2% <strong>of</strong> total backlog).Figure 96: Backlog split – EGPm – 1Q10Figure 97: Backlog evolution - EGPmPolygonForth West 4%6%3,5003,0002,5002,0001,500Allegria90%1,0002008 2009 Q1<strong>2010</strong>Allegria Forty West PolygonSource: <strong>SODIC</strong>Source: <strong>SODIC</strong>Small size makes <strong>SODIC</strong> adaptable to changeA flexible model…Since <strong>SODIC</strong>’s landbank is small, it tries to optimize the utilization <strong>of</strong> the landbank. This isdone by developing scalable small sub phases in the master development and bycustomizing product <strong>of</strong>ferings to a particular segment <strong>of</strong> customers. Typically, <strong>SODIC</strong>’sproduct <strong>of</strong>ferings are premium and limited, so it can to some extent choose a narrow range<strong>of</strong> low-risk young and affluent customers for its products. The flexibility <strong>of</strong> customizingprojects/choosing customers has been granted by its small size; if the real estate marketslows down or there is a change in demand pattern, the company would stop launching newprojects or customize the product <strong>of</strong>fering to match market requirements. As a result, capexcommitments and unsold inventory should be at minimum, in our view. Note that <strong>SODIC</strong>’sflagship Allegria project consists <strong>of</strong> four phases whereas each <strong>of</strong> Eastown and Westown hasthree phases. On the other hand, if the market environment remains buoyant, the companycan quickly launch projects and harness the growth opportunity. A working example <strong>of</strong><strong>SODIC</strong>’s flexibility lies in successful launches in 2009 at the peak <strong>of</strong> the financial crisis where<strong>SODIC</strong> reduced the size <strong>of</strong> the units without lowering sales prices. Below we havehighlighted <strong>SODIC</strong>’s development plan for the next 18 months in Eastown and Westown.…already tested in tough 2009 year<strong>SODIC</strong> is an early-stage company with only one major project (Allegria) under construction;most other big-ticket projects are on the drawing board. Management followed a prudentstrategy in 2009 in holding back massive project launches in its Eastown and Westowndevelopments, which led to cash preservation. Instead, the company decided to phaseprojects and launch smaller projects (such as Polygon and 40 West in Westown), whichproved to be successful.<strong>Deutsche</strong> <strong>Bank</strong> AG/London Page 49
5 <strong>July</strong> <strong>2010</strong> <strong>Real</strong> <strong>Estate</strong>, Construction and Building Materials <strong>Egypt</strong> <strong>Real</strong> <strong>Estate</strong>Figure 98: Eastown and Westown planned BUA1.81.61.41.21.00.80.60.40.20.0Eastown plannedBUAEastown plannedBUA in next 18monthsWestown plannedBUAWestown plannedBUA in next 18monthsResidential Commercial Retail Hotel EntertainmentSource: <strong>SODIC</strong>, <strong>Deutsche</strong> <strong>Bank</strong>Strong cash management: Allegria is self-funded and expected to remain soSimilar to most <strong>of</strong> the <strong>Egypt</strong>ian real estate developers, <strong>SODIC</strong> follows a self-financing <strong>of</strong>f-plandevelopment model. After a critical mass <strong>of</strong> units is sold, construction starts. Further,payment plans are designed to minimize funding gap. Currently, c. 75% <strong>of</strong> Allegria is alreadysold and 45% <strong>of</strong> the cash has already been collected on the sold units. As a result, webelieve Allegria is currently cash positive and should remain so throughout the life <strong>of</strong> theproject.Figure 99: Allegria cash flows cumulative4,5004,0003,5003,0002,5002,0001,5001,0005000200720082009<strong>2010</strong>E2011E2012E2013E2014ECash Collection (cumulative) Capex (cumulative) Net Cash Flow (cumulative)Source: <strong>Deutsche</strong> <strong>Bank</strong>, <strong>SODIC</strong>Figure 100: Sold <strong>of</strong> current projectsFigure 101: Cash collected on sold units (currentprojects)450035004000350030003000250025002000200015001000500150010005000Allegria 40 West Polygon0Allegria 40 West PolygonSoldUnsoldCash collectedCash to be collectedSource: <strong>SODIC</strong>, <strong>Deutsche</strong> <strong>Bank</strong>Source: <strong>SODIC</strong>, <strong>Deutsche</strong> <strong>Bank</strong>Page 50<strong>Deutsche</strong> <strong>Bank</strong> AG/London
5 <strong>July</strong> <strong>2010</strong> <strong>Real</strong> <strong>Estate</strong>, Construction and Building Materials <strong>Egypt</strong> <strong>Real</strong> <strong>Estate</strong>Despite strong net cash position, EGP1bn needs to be raised tobuild the investment property portfolioAs <strong>of</strong> 1Q10, <strong>SODIC</strong> had a solid balance sheet with EGP1.2bn <strong>of</strong> net cash (gearing -55%) afteran EGP550m right issue. On the development property side, <strong>SODIC</strong> has been cash positiveand because <strong>of</strong> strong demand for its products, self financing model and flexible phasingstrategy, we believe it will continue to be so in the future. However, as the companytransitions its business model from “residential sales” to a mix <strong>of</strong> development andinvestment properties, it should incur significant capex (we estimate EGP1.8bn between<strong>2010</strong>E-12E based on the current development plan). As a result, the company needs to raisedebt amount <strong>of</strong> EGP1bn between 2011E-2012E, according to our estimates.Figure 102: <strong>SODIC</strong> cash flowsOperational Cash Flow<strong>2010</strong>E 2011E 2012E 2013ECustomer cash collection 822 1,403 1,173 1,023Net operating Income (IP+Others) 8 9 10 87Capex - DP (767) (913) (734) (308)Capex - IP (324) (682) (784) (283)Other Capex - PPE (24) (24) (24) (24)Land Payments (24) (24) (24) (24)Other operating costs (SG&A, Finance inc., Tax etc.) (157) (211) (203) (366)Operating Free Cash Flow (465) (441) (586) 105Investing Cash flowInvestments/Acquisitions/Others - - - -Free cash flow after investing activities (465) (441) (586) 105Financing Cash FlowDebt Repayment (97) 0 0 0Debt Raised 0 500 500 0Equity Raised 550 - - -Other Financing CashflowsNet Free Cashflow (12) 59 (86) 105Gearing -19% -1% 18% 13%Opening Cash 482 470 528 443Closing Cash 470 528 443 548Source: <strong>Deutsche</strong> <strong>Bank</strong>Similar to 2009, although securing debt financing is difficult, we believe <strong>SODIC</strong> will be able tosecure syndicated loans starting in 2011 as 1) the company is in a net cash situation(EGP1.2bn, -55% gearing), 2) financing is required to build the investment property portfoliowhich could be used as collateral, 3) assuming it is able to raise EGP1bn <strong>of</strong> debt over 2011-2012, gearing would be only 18% in 2012E, and 4) the company has strong links withinvestors (EFG Hermes owns 15% <strong>of</strong> the company). Alternatively, part <strong>of</strong> the proceeds fromland sales to sub-developers in its Eastown and Westown developments (1m sqm <strong>of</strong> landearmarked for sale) could also be used to finance construction <strong>of</strong> investment properties.However, an advantage for <strong>SODIC</strong> is that the majority <strong>of</strong> projects for which the financing isrequired is still at the drawing board stage. As a result, should market conditions weaken andfunds not be raised, <strong>SODIC</strong> can decide to hold back the projects without locking up capitaland weakening its financial pr<strong>of</strong>ile.<strong>Deutsche</strong> <strong>Bank</strong> AG/London Page 51
5 <strong>July</strong> <strong>2010</strong> <strong>Real</strong> <strong>Estate</strong>, Construction and Building Materials <strong>Egypt</strong> <strong>Real</strong> <strong>Estate</strong>FinancialsQ1 <strong>2010</strong> results and recent events<strong>SODIC</strong> posted an EGP 10.9m loss in 1Q10 while revenues reached EGP 15.3m. Lowrevenues were primarily due to a lack <strong>of</strong> handovers (Allegria handovers to start in 2H10) in itsprojects. Note that <strong>SODIC</strong> recognizes revenues at completion.Figure 103: 1Q resultsEGPm 1Q10 1Q09Sales 15.4 3.2Gross pr<strong>of</strong>it/loss (0.5) (1.5)Net pr<strong>of</strong>it before tax 18.8 (8.8)Income tax (current and deferred) 29.8 (0.5)Net loss (10.9) (8.3)Source: <strong>SODIC</strong>However, in 1Q10, two significant events happened 1/ Land sales <strong>of</strong> EGP115m to subdevelopers and 2/ strong presales momentum in Allegria project (EGP287m in 1Q vs.EGP793m in entire 2009) and new launches in 40 West (presales <strong>of</strong> EGP201m) and Polygon(EGP115m) putting the total backlog at EGP3.4bn.At end 1Q10, <strong>SODIC</strong> had a strong balance sheet with EGP1.2bn net cash (-55% gearing)primarily due to its rights issue <strong>of</strong> EGP550m.End June <strong>2010</strong>, <strong>SODIC</strong> announced the acquisition <strong>of</strong> 50% <strong>of</strong> a Syrian <strong>Real</strong> estate companynamed Palmyra for EGP222m ($40.5m). In total Palmyra has 2.6m sqm <strong>of</strong> land <strong>of</strong> which thecapital Damascus account for 61%, Aleppo 33% and Lattakia 6%.Page 52<strong>Deutsche</strong> <strong>Bank</strong> AG/London
5 <strong>July</strong> <strong>2010</strong> <strong>Real</strong> <strong>Estate</strong>, Construction and Building Materials <strong>Egypt</strong> <strong>Real</strong> <strong>Estate</strong>Income statementFigure 104: Income statementEGP m 2008 2009 <strong>2010</strong>E 2011E 2012ERevenues 232 31 937 1,336 1,017% growth -52.9% -86.8% 2953.0% 42.7% -23.9%COGS (109) (33) (555) (805) (613)Gross pr<strong>of</strong>it 123 (2) 382 531 405as <strong>of</strong> % sales 53.1% -7.4% 40.7% 39.8% 39.8%% growth -62.1% -101.8% Nm 39.2% -23.8%Selling & marketing expenses (46) (46) (48) (51) (53)General and administrative expenses (54) (87) (91) (96) (101)Board <strong>of</strong> directors remunerations & allowances (32) (19) (20) (21) (22)EBITDA (8) (154) 222 364 229as <strong>of</strong> % sales -3.7% -503.0% 23.7% 27.2% 22.5%% growth -103.2% 1719.6% -243.8% 63.8% -37.1%Depreciation (3) (6) (6) (7) (7)EBIT (12) (160) 216 357 222as <strong>of</strong> % sales -5.0% -522.8% 23.0% 26.7% 21.8%Net interest income/(expense) 12 (1) 46 24 (40)Other operating revenues 37 23 11 11 12Share from associates 0 - 40Pr<strong>of</strong>it before tax 38 (138) 273 392 234Income tax (10) 25 (55) (78) (39)Effective tax rate (ex Associates & JVs) 26.9% 18.4% -20% -20% -20%Minority interest (0) (2) (2) (2) (2)% minorities 1.6% -1.6% -1.6% -1.6% -1.6%Attributable net income 27 (114) 216 312 193% growth -91.7% -517.0% -289.1% 44.1% -38.1%as <strong>of</strong> % sales 11.8% Na 23.1% 23.3% 19.0%Source: <strong>Deutsche</strong> <strong>Bank</strong>, <strong>SODIC</strong>Cash flow statementFigure 105: Cash Flow StatementEGPm 2008 2009 <strong>2010</strong>E 2011E 2012ECash flow from operations 112 (132) 224 320 202WCR change (83) 291 (318) (32) 44Payment for purchase <strong>of</strong> fixed assets & projects under construction (14) (24) (24) (24) (24)Land Payment (24) (24) (24)Additions to investment properties (324) (682) (784)Operating free cash-flow 15 136 (465) (441) (586)Payment for acquisition <strong>of</strong> investments in subsidiaries (296) (0)Payment for acquisition <strong>of</strong> held for trading investments - (114)Others (dividends , associates, investments) 81 (26)FCF after investing activities (200) (4) (465) (441) (586)Payments for loans installments (ST) (97) - -Proceeds from banks - credit facilities 1 96 0 500 500Minority interest 2 1Amounts collected on account <strong>of</strong> share capital increase and share premium 83 550Dividends paid (18) (2)Net cash flow (216) 174 (12) 59 (86)Source: <strong>Deutsche</strong> <strong>Bank</strong>, <strong>SODIC</strong><strong>Deutsche</strong> <strong>Bank</strong> AG/London Page 53
5 <strong>July</strong> <strong>2010</strong> <strong>Real</strong> <strong>Estate</strong>, Construction and Building Materials <strong>Egypt</strong> <strong>Real</strong> <strong>Estate</strong>Balance sheetFigure 106: Balance SheetEGPm 2008 2009 <strong>2010</strong>E 2011E 2012EAssetsLong term assetsFixed assets 44 51 69 86 104Projects under construction 2 12 12 12 12Available for sale investments 4 4 4 4 4Amounts paid on investments in companies under establishment 26 26 26 26Investment property 307 306 630 1,312 2,096Trade & notes receivable 1,258 1,115 1,115 1,115 1,115Deferred tax assets 23 49 49 49 49Total long term assets 1,637 1,563 1,905 2,604 3,406Current assetsInventories & letters <strong>of</strong> credit 1 1 1 1 1Work in process 1,310 1,714 2,481 3,383 4,106Amounts due from customers - constructions 2 9 9 9 9Trade & notes receivable 637 740 740 740 740Debtor & other debit balances 416 387 387 387 387Held for trading investments - 119 119 119 119Cash at banks & on hand 209 383 370 429 343Fixed deposits (adjustment) 29 99 99 99 99Total current assets 2,605 3,453 4,207 5,168 5,805Total assets 4,242 5,016 6,112 7,772 9,211Liabilities and EquityCurrent liabilitiesProvisions 104 99 99 99 99<strong>Bank</strong> - credit facilities 1 97 - - -Customers - deposit 1,976 2,626 2,626 2,626 2,626Amounts due to customers - constructions 1 1 1 1Contractors, supplies & notes payable 35 88 536 1,407 2,173Creditors & other credit balances 166 201 201 201 201Total current liabilities 2,282 3,112 3,463 4,334 5,100EquityAuthorized share capital 500 500 500 500 500Issued & fully paid in capital 284 284 363 363 363Amounts paid on account <strong>of</strong> share capital increase and share premium 83 83 83 83Legal reserves 140 142 142 142 142Special reserve - share premium 912 912 1,384 1,384 1,384Retained earnings 465 492 708 1,020 1,213Treasury shares (80) (80) (80) (80) (80)Amount set aside for incentive & bonus plan 9 14 14 14 14Net pr<strong>of</strong>it (loss) for period / year 27 (114) (114) (114) (114)Total shareholders' equity 1,757 1,733 2,499 2,811 3,004Minority interest 20 26 28 29 31Total equity 1,777 1,758 2,527 2,840 3,035Long-term liabilitiesNotes payable 183 146 122 99 75LT Loans - 500 1,000Total long-term liabilities 183 146 122 599 1,075Total liabilities and equity 4,242 5,016 6,112 7,772 9,211Source: <strong>SODIC</strong>, <strong>Deutsche</strong> <strong>Bank</strong>Page 54<strong>Deutsche</strong> <strong>Bank</strong> AG/London
5 <strong>July</strong> <strong>2010</strong> <strong>Real</strong> <strong>Estate</strong>, Construction and Building Materials <strong>Egypt</strong> <strong>Real</strong> <strong>Estate</strong>Middle East <strong>Egypt</strong><strong>Real</strong> <strong>Estate</strong>, Construction and Building Materials Construction4 <strong>July</strong> <strong>2010</strong>Palm Hills DevelopmentsReuters: PHDC.CABloomberg: PHDC ECToo leveraged in currenttimes; initiate with HoldLeveraged play on <strong>Egypt</strong>ian market – Initiate with Hold and EGP5.9 TPWe see PHD as the most leveraged play on the <strong>Egypt</strong>ian market. The companyholds the most diversified land bank and exposure to first and second homes.While we do not see a rally in property prices in <strong>Egypt</strong> to play PHD, performancein second homes sales remains difficult to predict. Finally, PHD carries thehighest land liability among <strong>Egypt</strong>ian developers under coverage. Hold – TPEGP5.9.Solid backlog and large diversified land bankThe company maintains a healthy backlog (EGP10bn) supporting its top line forthe next 4+ years with on average >60% <strong>of</strong> launched projects already sold. PHDholds the largest/most diversified landbank, deep project pipeline while it intendsto increase focus on high-volume mid-income segment. In addition, its verticallyintegrated model ensures better margins and guaranteed capacities in a countryunder construction boom.Riskier than peers in current timesWhile we do not see a rally in property prices in <strong>Egypt</strong> to play PHD, performancein second homes sales remains difficult to predict while it dominate the pipeline.Furthermore, the company has the highest fixed land liability among <strong>Egypt</strong>iandevelopers under our coverage (1.2x 2009 equity) with ~70% <strong>of</strong> the payment isoutstanding which makes it more risky than peers. Finally, non-Cairo locationrepresents ~80% <strong>of</strong> the total landbank while we believe PHD will need toreplenish its Cairo land (only c.20%) which holds the highest potential, in ourview. Finally, the recent negative news flow <strong>of</strong> Aswan land lowers visibility.Hold; target price <strong>of</strong> EGP5.9We value PHD based on SOTP (WACC: 14.9%). We have included only thoseprojects for which construction has started or been put on a fast track. We valueinvestment properties at 2009 BV. For land valuation, we markup its Cairo land to2007 auction price, while non-Cairo land is valued assuming a sub-developer’scost structure (see valuation methodology for details).Key specific downside risksfor PHD include exposure to a relatively higher funding gap, given a deep pipeline;slower second-home sales; and high fixed liabilities payments. Upside risksinclude progress in the Saudi venture and better-than-expected sales anddeliveries.HoldPrice at 4 Jul <strong>2010</strong> (EGP) 4.82Price Target (EGP) 5.9052-week range (EGP) 9.35 - 4.82Price/price relative16128405/08 11/08 5/09 11/09 5/10Palm Hills DevelopmeHermes <strong>Egypt</strong> Stock M (Rebased)Performance (%) 1m 3m 12mAbsolute -12.2 -27.4 -37.8Stock dataMarket cap (EGP)(m) 5,051.4Shares outstanding (m) 1,048Free float (%) 38Hermes <strong>Egypt</strong> Stock Market Index 718.3Key indicators (FY1)ROE (%) 14.9Net debt/equity (%) 13.5Book value/share (EGP) 4.2Book value/share (EGP) 4.2Price/book (x) 1.1Net interest cover (x) –EBIT margin (%) 36.6Forecasts and ratiosYear End Dec 31 2008A 2009A <strong>2010</strong>E 2011E 2012ERevenue (EGPm) 1,235 1,146 1,577 3,763 4,626DB EPS (EGP) 0.91 0.65 0.50 1.02 0.87P/BV 1.1 1.7 1.1 0.9 0.8Source: <strong>Deutsche</strong> <strong>Bank</strong> estimates, company data<strong>Deutsche</strong> <strong>Bank</strong> AG/London Page 55
5 <strong>July</strong> <strong>2010</strong> <strong>Real</strong> <strong>Estate</strong>, Construction and Building Materials <strong>Egypt</strong> <strong>Real</strong> <strong>Estate</strong>Model updated:01 <strong>July</strong> <strong>2010</strong>Running the numbersMiddle East<strong>Egypt</strong>ConstructionPalm Hills DevelopmentsReuters: PHDC.CAHoldBloomberg: PHDC ECPrice (5 Jul 10) EGP 4.65Target price EGP 5.9052-week Range EGP 4.65 - 9.35Market Cap (m) EGPm 4,873USDm 856Company Pr<strong>of</strong>ilePHD is a diversified real estate developer headquartered inCairo, <strong>Egypt</strong>. PHD's core business includes acquiring largeareas <strong>of</strong> land at competitive prices, creating value bydeveloping villas/apartments and resorts, and selling them to(primarily) mid- to high-income buyers. The company'slandbank stands at ~49m sqm (including 6.6m sqm in KSA)and PHD has a portfolio <strong>of</strong> 32 projects across <strong>Egypt</strong>.Price Performance1612840M ay 08 Nov 08 M ay 09 Nov 09Palm Hills DevelopmentsJun 10Margin Trends706050403020Hermes <strong>Egypt</strong> St ock Market Index (Rebased)07 08 09 10E 11E 12EGrowth & Pr<strong>of</strong>itability15010 0500-50Solvency30<strong>2010</strong>0EBITDA Mar ginEBIT Mar gin0 7 0 8 0 9 10 E 11E 12 ESales growth (LHS)ROE (RHS)0 7 0 8 0 9 10 E 11E 12 ENet debt /equit y (LHS)Athmane Benzerroug4030<strong>2010</strong>0Net interest cover (RHS)+971 4 4283938 athmane.benzerroug@db.com2520151050Fiscal year end 31-Dec 2007 2008 2009 <strong>2010</strong>E 2011E 2012EFinancial SummaryDB EPS (EGP) 0.27 0.91 0.65 0.50 1.02 0.87Reported EPS (EGP) 0.28 0.94 0.68 0.54 1.06 0.91DPS (EGP) 0.00 0.00 0.00 0.00 0.00 0.00BVPS (EGP) 1.5 3.8 4.5 4.2 5.3 6.2Weighted average shares (m) 699 699 699 1,048 1,048 1,048Average market cap (EGPm) na 6,276 5,072 4,873 4,874 4,875Enterprise value (EGPm) na 6,094 5,145 4,906 5,235 4,644Valuation MetricsP/E (DB) (x) na 9.9 11.1 9.4 4.6 5.4P/E (Reported) (x) na 9.5 10.7 8.6 4.4 5.1P/BV (x) 0.00 1.06 1.67 1.10 0.88 0.75FCF Yield (%) na nm nm nm nm 3.9Dividend Yield (%) na 0.0 0.0 0.0 0.0 0.0EV/Sales (x) nm 4.9 4.5 3.1 1.4 1.0EV/EBITDA (x) nm 8.1 9.6 8.1 4.0 4.2EV/EBIT (x) nm 8.3 10.2 8.5 4.2 4.4Income Statement (EGPm)Sales revenue 535 1,235 1,146 1,577 3,763 4,626Gross pr<strong>of</strong>it 393 941 691 817 1,813 1,741EBITDA 284 749 535 602 1,302 1,111Depreciation 2 14 27 20 62 47Amortisation 0 5 5 5 5 5EBIT 282 730 503 577 1,234 1,059Net interest income(expense) -64 -35 38 43 28 18Associates/affiliates 0 0 0 0 0 0Exceptionals/extraordinaries 0 0 0 0 0 0Other pre-tax income/(expense) 5 25 20 47 47 47Pr<strong>of</strong>it before tax 223 719 560 667 1,309 1,124Income tax expense 30 59 40 48 93 80Minorities -4 2 45 53 104 89Other post-tax income/(expense) 0 0 0 0 0 0Net pr<strong>of</strong>it 197 658 476 566 1,112 955DB adjustments (including dilution) -5 -25 -20 -47 -47 -47DB Net pr<strong>of</strong>it 191 633 456 520 1,065 908Cash Flow (EGPm)Cash flow from operations 175 -538 -19 -433 -272 635Net Capex -451 -110 -57 -455 -328 -446Free cash flow -276 -649 -76 -888 -600 189Equity raised/(bought back) 493 990 0 699 0 0Dividends paid 0 0 0 0 0 0Net inc/(dec) in borrowings 181 330 73 305 325 -162Other investing/financing cash flows -729 -403 -177 128 47 47Net cash flow -330 268 -180 244 -229 74Change in working capital -80 -1,276 -501 -1,030 -1,508 -415Balance Sheet (EGPm)Cash and other liquid assets 386 280 135 379 150 224Tangible fixed assets 480 543 90 283 216 163Goodwill/intangible assets 0 48 42 44 44 44Associates/investments 108 674 775 1,090 1,418 1,864Other assets 4,783 7,600 9,489 11,290 13,926 14,652Total assets 5,758 9,145 10,531 13,086 15,754 16,947Interest bearing debt 673 627 735 1,041 1,365 1,203Other liabilities 3,942 5,686 6,386 7,157 8,285 8,596Total liabilities 4,615 6,313 7,121 8,197 9,650 9,799Shareholders' equity 1,040 2,687 3,162 4,428 5,539 6,494Minorities 103 145 248 461 565 654Total shareholders' equity 1,143 2,832 3,410 4,888 6,104 7,148Net debt 286 348 601 662 1,215 979Key Company MetricsSales growth (%) nm 130.8 -7.2 37.6 138.6 22.9DB EPS growth (%) na 231.1 -28.0 -24.0 104.9 -14.8EBITDA Margin (%) 53.1 60.7 46.7 38.2 34.6 24.0EBIT Margin (%) 52.7 59.1 43.9 36.6 32.8 22.9Payout ratio (%) 0.0 0.0 0.0 0.0 0.0 0.0ROE (%) 18.9 35.3 16.3 14.9 22.3 15.9Capex/sales (%) 84.4 8.9 5.0 28.9 8.7 9.6Capex/depreciation (x) 222.8 5.9 1.8 18.2 4.9 8.5Net debt/equity (%) 25.0 12.3 17.6 13.5 19.9 13.7Net interest cover (x) 4.4 20.6 nm nm nm nmSource: Company data, <strong>Deutsche</strong> <strong>Bank</strong> estimatesPage 56<strong>Deutsche</strong> <strong>Bank</strong> AG/London
5 <strong>July</strong> <strong>2010</strong> <strong>Real</strong> <strong>Estate</strong>, Construction and Building Materials <strong>Egypt</strong> <strong>Real</strong> <strong>Estate</strong>Investment thesisOutlookEstablished in 2005, PHD <strong>of</strong>fers the best-leveraged and diversified exposure to the <strong>Egypt</strong>ianmarket. With operations across <strong>Egypt</strong> and land in KSA, the company holds one <strong>of</strong> thelargest/most diversified landbank (49m sqm) among <strong>Egypt</strong>ian developers. Also, PHDmaintains a deep pipeline <strong>of</strong> 32 projects, supported by the largest/widest sales network,primarily focusing high-income segments. However, this is set to change as the companyplans to increase its exposure in the mid-income segment, where we see high potential forgrowth. The company stands at an inflection point <strong>of</strong> project deliveries (DBe 16,000 unitsduring <strong>2010</strong>E-15E) with a low risk <strong>of</strong> unsold inventories/defaults as projects are on average69% sold, with ~37% cash collected. In addition, a vertically integrated model ensures bettermargins, while assuring capacities in a country that is undergoing construction boom. Finally,PHD is planning to ramp up its investment properties to contribute to 30% <strong>of</strong> 2015Erevenues, which we think is ambitious.While we do not see a rally in property prices in <strong>Egypt</strong> to play PHD, performance in secondhomes sales remains difficult to predict while it dominate the pipeline. Furthermore, thecompany has the highest fixed land liability among <strong>Egypt</strong>ian developers under our coverage(1.2x 2009 equity) with ~70% <strong>of</strong> the payment is outstanding which makes it more risky thanpeers. In addition, non-Cairo location represents ~80% <strong>of</strong> the total landbank while we believePHD will need to replenish its Cairo land (only c.20%) which holds the highest potential, inour view. Finally, the recent negative news flow <strong>of</strong> Aswan land lowers visibility.At 1.2x <strong>2010</strong>E BV, the stock is one <strong>of</strong> the most expensive amongst <strong>Egypt</strong>ian developersunder our coverage. We initiate with Hold and TP EGP5.9.ValuationWe value PHD based on SOTP (WACC: 14.9%). We have included only those projects forwhich construction has started or been put on a fast track. We value investment properties at2009 BV. For land valuation, we mark-up its Cairo land to 2007 auction price, while non-Cairoland is valued assuming a sub-developer’s cost structure (see valuation methodology fordetails).RisksKey specific downside risks for PHD include exposure to a relatively higher funding gap,given deep pipeline; slower second-home sales; and high fixed liabilities payments. Upsiderisks include progress in the Saudi venture and better-than-expected sales and deliveries.<strong>Deutsche</strong> <strong>Bank</strong> AG/London Page 57
5 <strong>July</strong> <strong>2010</strong> <strong>Real</strong> <strong>Estate</strong>, Construction and Building Materials <strong>Egypt</strong> <strong>Real</strong> <strong>Estate</strong>SWOT analysisStrength• Holds one <strong>of</strong> the most diversified landbanks, acquired at very cheap prices, which issufficient to support project development for the next 7-10 years.• Unlike its peers, PHD has been able to secure sufficient funding to support the projectscurrently under development and meet its obligations for the next 2 years.• Most diversified and deepest project pipeline among <strong>Egypt</strong>ian developers.• Largest sales and distribution network among <strong>Egypt</strong>ian developers. It has an agreementwith Coldwell <strong>Bank</strong>er (a 49% associate with 800 <strong>of</strong>fices and 126,000 sales associatesaround the world) to promote and sell PHD’s properties.• A healthy backlog <strong>of</strong> EGP10bn (assuring visibility for ~4+ years <strong>of</strong> revenues).• Only <strong>Egypt</strong>ian developer to have an in-house construction arm and has a long-termpartnership with one <strong>of</strong> the biggest private contractors in <strong>Egypt</strong>, which providesguaranteed capacities.Weakness• Highest land liability amongst <strong>Egypt</strong>ian developers (1.2x 2009 equity).• Exposure to construction cost overruns. As most projects are over 60% sold, PHD haslocked selling prices, while costs remain variable.• PHD’s ambitious pipeline <strong>of</strong> 32 projects and land acquisitions has increased dependencyon external funding.Opportunity• The company’s Saudi venture provides significant opportunity to pr<strong>of</strong>it from theuntapped/undersupplied market.• PHD has put its high-value projects on a fast track to take advantage <strong>of</strong> decliningconstruction costs providing opportunity to enhance margins.• Sales centers established in the UK and across the Gulf <strong>of</strong>fer access to internationalinvestors.• Diversification into hotels and commercial developments should assure recurring cashflowThreat• PHD has the highest exposure to the second-homes segment, which remains difficult topredict.• Similar to other developers, PHD is exposed to adverse regulatory changes.• PHD could face tougher market conditions for high-end products as this segmentapproaches saturation.• Legal framework in <strong>Egypt</strong> is not very protective for developers. Homebuyers are able tocancel anytime before handover and developers can keep between 5-10% <strong>of</strong> the salesvalue. Nevertheless, the refund is not made before the unit is re-sold.Page 58<strong>Deutsche</strong> <strong>Bank</strong> AG/London
5 <strong>July</strong> <strong>2010</strong> <strong>Real</strong> <strong>Estate</strong>, Construction and Building Materials <strong>Egypt</strong> <strong>Real</strong> <strong>Estate</strong>ValuationValuation methodologyWe adopt a SOTP method to value PHD. The assumptions are described below.Development propertiesWe include only projects for which the construction has started or been put on a fast track,and restrict our pre-sales horizon to 2012E. We assume an average selling price ranging fromEGP 2,500-11,000/sqm (mid- to high-income properties) and have maintained a 36% margin(vs. management guidance <strong>of</strong> 36-40%) for all projects except those located in North Coast(40% - in line with management guidelines).Investment propertiesInvestment properties are considered at 2009 BV.Land bankWe value the residual land <strong>of</strong> 18m sqm using a NAV method. We have marked up Cairo landto the 2007 auction price (850/sqm for W.Cairo, 750/sqm for E.Cairo), resulting in a NAV <strong>of</strong>EGP1.6bn. For non-Cairo land (16m sqm), we assume the cost structure <strong>of</strong> a sub-developer,(GPM <strong>of</strong> 30% / land cost: 25% <strong>of</strong> the total cost) to assess the implied land value. This resultsin a NAV <strong>of</strong> EGP3.8bn (EGP238 per sqm). Overall, we derive a NAV <strong>of</strong> EGP5.4bn (EGP300 persqm). Further, we have considered land liabilities separately at 2009 BV.Figure 107: Valuation <strong>of</strong> non-Cairo land (Sub developer case)EGPm 25% GPM Base case (30% GPM) 35% GPMBUA sold (Sqm m) 5.4 5.4 5.4Average selling price (EGP/sqm) 4,000 4,000 4,000Revenues 21,583 21,583 21,583Target gross pr<strong>of</strong>it 5,396 6,475 7,554Target gross pr<strong>of</strong>it margin 25% 30% 35%Total COGS 16,187 15,108 14,029Land as a % <strong>of</strong> total COGS (DBe) 25% 25% 25%Implied land cost/value 4,047 3,777 3,507Construction costs 12,140 11,331 10,522Source: <strong>Deutsche</strong> <strong>Bank</strong> estimatesInvestment in associates and JVWe consider JV in KSA at cost (EGP306m).WACC calculationWe use WACC <strong>of</strong> 14.9%to discount the projects’ cash flows (RFF: 8.5%, ERP: 5.5%, Beta:1.2, cost <strong>of</strong> equity: 15.1%, cost <strong>of</strong> debt: 12.5%).<strong>Deutsche</strong> <strong>Bank</strong> AG/London Page 59
5 <strong>July</strong> <strong>2010</strong> <strong>Real</strong> <strong>Estate</strong>, Construction and Building Materials <strong>Egypt</strong> <strong>Real</strong> <strong>Estate</strong>Target price: EGP5.9We derive a target price <strong>of</strong> EGP5.9 using SOTP.Figure 108: PHD: SOTPEGPm % EVDevelopment properties 4,111 40%CommentsInvestment properties 483 5% 2009 BVLandbank 5,356 52%Associates & other assets 306 3% Includes KSA land at costTotal EV 10,255Net cash (2009) - Rights issue adjusted 98Land liabilities (2009 BV), to be paid over 8yrs (4,180)Equity Value 6,174Number <strong>of</strong> shares (m, rights issue adjusted) 1,048NAV per share 5.9Source: <strong>Deutsche</strong> <strong>Bank</strong> estimatesDCF at WACC, pre-sales limited to 2012E and 36 to40% gross marginWest/East Cairo @ 2007 auction price <strong>of</strong> EGP850/750per sqm. Non-Cairo: implied value assuming subdevelopercost structure (EGP238/sqm)Figure 109: EV breakdown by asset class (EGPm)Figure 110: EV breakdown by period (EGPm)Associates & otherassets3%2017E-16%<strong>2010</strong>E5%Developmentproperties40%Land52%Investment properties5%2011E-2017E79%Source: <strong>Deutsche</strong> <strong>Bank</strong>Source: <strong>Deutsche</strong> <strong>Bank</strong>Page 60<strong>Deutsche</strong> <strong>Bank</strong> AG/London
5 <strong>July</strong> <strong>2010</strong> <strong>Real</strong> <strong>Estate</strong>, Construction and Building Materials <strong>Egypt</strong> <strong>Real</strong> <strong>Estate</strong>Free option value: Saudi venture could add EGP1.9 to our TPPHD holds 6.6m sqm <strong>of</strong> land through a 51% JV in Saudi Arabia. At present, the company hasnot revealed any project details, but assuming the current market parameters, we expect thisventure to hold a free option value <strong>of</strong> EGP1.9/share. This is based on the followingcalculation: assuming a Floor Space Index (FSI: BUA / Total land area) <strong>of</strong> 0.85, the JV coulddevelop 5.6m sqm <strong>of</strong> BUA on the 6.6m sqm <strong>of</strong> land. With a cost <strong>of</strong> SAR 3,000 per sqm andselling price <strong>of</strong> SAR4,000 per sqm, the total potential pr<strong>of</strong>it could be SAR3.1bn on a PV basis(construction period <strong>of</strong> 2011E-2014E, 1yr pre-sales and discounted at WACC), or SAR1.6bn(EGP2.4bn) at PHD’s level. (Note that all parameters approximately match with projectsdeveloped by the leading Saudi developer - Dar Al Arkan).Figure 111: Potential value addition from Saudi venture*Potential value <strong>of</strong> Saudi ventureLand area (m sqm) 6.6FSI** (BUA / total land area) 0.85BUA (m sqm) 5.6Development cost (SAR/Sqm) (construction + land) 3,000Selling price (SAR/Sqm) 4,000Gross pr<strong>of</strong>it (SAR/Sqm) 1,000Sales value (SARm) 22,440Net pr<strong>of</strong>it margin 25%Net pr<strong>of</strong>it (SARm) 5,610Net present value (SARm) 3,008PHD's net present (51% stake), SARm 1,534PHD's net present value (EGPm) 2,301NPV/share (EGP) 2.20Already assumed in book value/share (EGP) 0.29Incremental value addition/share (EGP) 1.90Source: <strong>Deutsche</strong> <strong>Bank</strong>, * assuming mid income residential development, **FSI: Floor space index<strong>Deutsche</strong> <strong>Bank</strong> AG/London Page 61
5 <strong>July</strong> <strong>2010</strong> <strong>Real</strong> <strong>Estate</strong>, Construction and Building Materials <strong>Egypt</strong> <strong>Real</strong> <strong>Estate</strong>Company pr<strong>of</strong>ileCorporate pr<strong>of</strong>ileEstablished in 2005, Palm Hills Development (PHD) is one <strong>of</strong> the largest real estatedevelopers in <strong>Egypt</strong> in terms <strong>of</strong> landbank. The company was floated in May 2008 and is listedon the Cairo-Alexandria Stock Exchange and London Stock Exchange. PHD’s core businessincludes acquiring large areas <strong>of</strong> land at competitive prices, creating value by developingvillas/apartments and resorts, and selling them to (primarily) mid- to high-income buyers. Thecompany’s landbank stands at ~49m sqm (including 6.6m sqm in KSA) and PHD has aportfolio <strong>of</strong> 32 projects across <strong>Egypt</strong>. As a part <strong>of</strong> its strategy, PHD aims to derive 30% <strong>of</strong>2015E revenues from recurring income (vs. 0% in 2009), which we think is ambitious.PHD sells villas/apartments and retains non-residential developments for investmentpurposes. The company recognizes revenues from land on signing <strong>of</strong> the contract, villas onpercentage completion basis and apartments on delivery. Hence, despite selling on average60% in all its projects, PHD’s revenues have been predominantly from the sale <strong>of</strong> villa land(90% in 2009), due to minimum deliveries. This is followed by revenues from theconstruction <strong>of</strong> villas. From <strong>2010</strong>E, we expect unit sales to contribute more as PHD entersthe delivery stage. Recurring income should start from 2011E.Figure 112: Revenue breakdown, 2007-09 (EGPm)Figure 113: Gross pr<strong>of</strong>it breakdown, 2007-09 (EGPm)100%90%3%0%10%100%90%2%0%2%80%80%70%70%60%60%50%40%97% 100%90%50%40%98% 100% 98%30%30%20%20%10%10%0%2007 2008 20090%2007 2008 2009Sale <strong>of</strong> land attributable to villas and town housesRevenue from construction contractsSale <strong>of</strong> land attributable to villas and town housesRevenue from construction contractsSource: PHD, <strong>Deutsche</strong> <strong>Bank</strong>Source: PHD, <strong>Deutsche</strong> <strong>Bank</strong>Page 62<strong>Deutsche</strong> <strong>Bank</strong> AG/London
5 <strong>July</strong> <strong>2010</strong> <strong>Real</strong> <strong>Estate</strong>, Construction and Building Materials <strong>Egypt</strong> <strong>Real</strong> <strong>Estate</strong>PHD has formed various JVs and acquired varying stakes in many businesses. Currently, thecompany develops projects through its 12 subsidiaries and 1 associate.Figure 114: Subsidiaries and associatesStakeSubsidiariesNew Cairo For <strong>Real</strong> <strong>Estate</strong> Development 100%Royal Gardens For <strong>Real</strong> <strong>Estate</strong> Investment Co. 51%Palm Hills Middle East Company For <strong>Real</strong> <strong>Estate</strong> Investments 100%Middle East For Development And Investment Touristic 59%Gamsha For Touristic Development 60%Nile Palm Al Naeem For <strong>Real</strong> <strong>Estate</strong> Development 51%Saudi Urban Development Company 51%Rakeen <strong>Egypt</strong> For <strong>Real</strong> <strong>Estate</strong> Investment 100%Al Naeem For The Hotel And Touristic Villages 60%Gawda For Trade Services 100%New East Cairo For <strong>Real</strong> <strong>Estate</strong> Development 59%City For <strong>Real</strong> <strong>Estate</strong> Development 51%AssociateColdwell <strong>Bank</strong>er 49%Source: PHD, <strong>Deutsche</strong> <strong>Bank</strong>Shareholding structurePHD was listed on the Alexandria-Cairo stock exchange in 2008, and at the same time itsGDR was listed on the London Stock Exchange (1 GDR: 5 ordinary shares). Mansour &Maghraby Investment and Development Co (founder) has the largest stake <strong>of</strong> 55%. Free floatis 38%, while there is no foreign-ownership restriction.Figure 115: Shareholding structureExec. directors7%Free float38%MMID*55%Source: PHD, <strong>Deutsche</strong> <strong>Bank</strong>, *Mansour & Maghraby Investment and Development Co<strong>Deutsche</strong> <strong>Bank</strong> AG/London Page 63
5 <strong>July</strong> <strong>2010</strong> <strong>Real</strong> <strong>Estate</strong>, Construction and Building Materials <strong>Egypt</strong> <strong>Real</strong> <strong>Estate</strong>Key managersYasseen Mansour – Chairman <strong>of</strong> the Board <strong>of</strong> Directors and CEO - has served aschairman <strong>of</strong> the board <strong>of</strong> directors and CEO <strong>of</strong> PHD since it was founded in January 2005. Hehas also served as the president and chief executive <strong>of</strong>ficer <strong>of</strong> MMID, a joint stock companyprimarily owned by the Mansour Group and the El-Maghraby Group since 1996, and theprimary shareholder <strong>of</strong> Palm Hills Developments.Mohamed Ashraf Abu Al Dahab – CEO for Construction: As chief executive <strong>of</strong>ficer forconstruction and one <strong>of</strong> the founders <strong>of</strong> PHD, Mr.Dahab manages the company’s currentprojects. Eng. Dahab has served on the board <strong>of</strong> directors since January 2005.Ihab Assem Swellem – CFO: Prior to joining PHD in 2009, Swellem was CFO and head <strong>of</strong>mergers and acquisitions at Orascom Capital. Mr. Swellem came to OraCap from RingGroup, a group <strong>of</strong> companies fully owned by Orascom Telecom Group, where he was CFO.He has completed training courses with the London Business School, Euromoney Training,and the Institute for International Research, among others. He holds a bachelor’s degree inaccounting from Cairo University and an MBA from Maastricht University.Page 64<strong>Deutsche</strong> <strong>Bank</strong> AG/London
5 <strong>July</strong> <strong>2010</strong> <strong>Real</strong> <strong>Estate</strong>, Construction and Building Materials <strong>Egypt</strong> <strong>Real</strong> <strong>Estate</strong><strong>Real</strong> estate portfolioKey development projectsDiversified project pipelinePHD maintains one <strong>of</strong> the largest and most diversified pipelines, including 32 projects (out <strong>of</strong>which 16 are under construction) spread across <strong>Egypt</strong> (Red Sea, North coast, 6 th <strong>of</strong> October,Cairo and Aswan) and has plans to develop projects in Saudi Arabia (Riyadh and Jeddah). Thetotal pipeline costs EGP32bn, out <strong>of</strong> which EGP16bn is either committed or put on a fasttrack.Figure 116: PHD: One <strong>of</strong> the widest project pr<strong>of</strong>ilesPHD <strong>SODIC</strong> TMG Heliopolis <strong>Egypt</strong>ian resorts Nasr CityTarget segments Mid - high income High income Mid - high income Mid income Mid - high income Mid incomeProject location Across <strong>Egypt</strong> West / East Cairo Mostly East Cairo East Cairo Red Sea East CairoProject typeResidentialCommercialHotelsResortsSource: PHD, <strong>Deutsche</strong> <strong>Bank</strong>Unlike its competitors, the company has projects specifically targeting first andsecond/vacation homebuyers. Historically, this segment has performed well during summermonths, while first-home sales stagnated, thus providing a hedge against seasonality.However, we remain skeptical about the predictability <strong>of</strong> this segment in the current scenarioand, we believe, this segment (as compared to first-home segment) holds relatively lowerroom for price appreciation.In terms <strong>of</strong> price points, PHD <strong>of</strong>fers units ranging from below EGP0.5m to over EGP2m. Weexpect more units in the sub-EGP1m category as the company is increasing its focus on themiddle-income segment.Figure 117: Residential target clientele* (BUA sqm)Figure 118: Units sold by price range (EGPm)> 2.019%0-0.513%First homebuyers50%Second homebuyers50%1.5-2.013%0.5-1.039%1.0-1.516%Source: PHD, <strong>Deutsche</strong> <strong>Bank</strong>, * Adjusted for PHD’s stakeSource: PHD, <strong>Deutsche</strong> <strong>Bank</strong><strong>Deutsche</strong> <strong>Bank</strong> AG/London Page 65
Page 66 <strong>Deutsche</strong> <strong>Bank</strong> AG/LondonFigure 119: PHD: Project pipelineSales Land Area BUA Total costProjectsPHD's Stake Start Date End date launch year (m Sqm) (m Sqm) (EGPm) % completed % soldProjects included in our SOTPSixth <strong>of</strong> October project (1st homebuyer project)Village Gardens October 51% 2009 2015 2009 0.24 0.19 674 2% 94%Bamboo extension 100% 2007 2011 Jan-08 0.17 0.07 131 50% 90%Golf Views* 100% 2005 2015 Jul-05 2.16 0.56 1,115 8% 79%Palm Park 100% 2007 2013 Dec-07 0.47 0.37 746 2% 53%Golden palm, Bamboo and Cascada 100% 2005 <strong>2010</strong> Apr-05 0.40 0.18 242 100% 100%Golf Extension * 100% 2008 2015 Jan-08 1.30 0.51 1,103 0% 40%CASA 51% 2007 2013 Jun-07 0.29 0.39 780 15% 73%New Cairo (1st homebuyer project)Palm Hills Katameya* 100% 2006 2011 Jun-06 0.93 0.31 594 43% 74%The Village Gate 51% 2008 2012 Jun-08 0.13 0.16 297 9% 46%Village Gardens Katameya 89% 2009 2014 Jan-09 0.28 0.31 467 0% 53%The Village (Including village mall) 100% 2006 2011 Nov-06 0.11 0.15 487 22% 88%Park View 51% 2009 2014 Oct-09 0.10 0.07 139 0% 43%Cairo Alex Road (1st homebuyer project)Palm Hills Botanica 100% 2009 2015 Mar-09 7.12 1.48 3,052 5% 94%North Coast (2nd homebuyer project)Hacienda White (Zone 1)* 88% 2009 2012 Aug-09 0.21 0.08 119 0% 76%Hacienda Bay (Zone 1)* 100% 2007 2012 Jul-07 2.31 0.48 1,920 18% 56%Red Sea (2nd homebuyer project)El Ain Sokhna* 60% 2008 2013 Feb-08 5.55 1.77 4,394 0% 54%Total or Wavg 21.8 7.1 16,259 69%Projects excluded from our SOTPSixth <strong>of</strong> October project (1st homebuyer project)190 Feddan 100% <strong>2010</strong> 2016 Jul-10 0.84 0.39 681 0% 0%New Cairo (1st homebuyer project)Ellamy 51% 2011 2014 Jan-11 0.03 0.03 105 0% 0%City 51% na na na 0.14 0.10 203 0% 0%Kapci 89% na na na 0.27 0.31 450 0% 0%North Coast (2nd homebuyer project)Hacienda White (Zone 2 and 2 Ext) 88% <strong>2010</strong> 2014 Jun-10 0.41 0.17 505 0% 0%Hacienda Coast 1 Middle East 59% 2011 2015 Jan-11 0.58 0.23 830 0% 0%Hacienda Coast 2 Middle East 100% 2012 2015 Jan-12 0.45 0.10 462 0% 0%Hacienda Bay (Zone 2) 100% 2012 2015 Jan-12 1.21 0.34 795 0% 0%Hacienda Bay (Zone 3) 100% 2013 TBD Jan-13 7.45 2.47 5,333 0% 0%Hacienda Bay (Zone 3) Extension 100% 2013 TBD Jan-13 1.18 1.00 1,862 0% 0%Red Sea (2nd homebuyer project)Palm Gamsha 59% 2012 TBD Jun-12 5.00 1.40 4,600 0% 0%Other projects (1st homebuyer project)Aswan 60% na na na 0.12 0.15 359 0% 0%Total 17.7 6.7 16,184Source: PHD, <strong>Deutsche</strong> <strong>Bank</strong>, *projects on fast-track, TBD= To be decidedR(5 <strong>July</strong> <strong>2010</strong> <strong>Real</strong> <strong>Estate</strong>, Construction and Building Materials <strong>Egypt</strong> <strong>Real</strong> <strong>Estate</strong>
5 <strong>July</strong> <strong>2010</strong> <strong>Real</strong> <strong>Estate</strong>, Construction and Building Materials <strong>Egypt</strong> <strong>Real</strong> <strong>Estate</strong>The portfolio is skewed more towards development properties (60% <strong>of</strong> BUA), while all nonresidentialproperties are retained for investment purposes (40%). As illustrated in Figure 17,the Red Sea and North coast regions form the bulk <strong>of</strong> PHD’s residential project pipeline.Figure 120: Project pipeline split *, (BUA sqm)Figure 121: Geographical location <strong>of</strong> projects (BUA sqm)Investmentproperty40%Red Sea26%Other projects1%Sixth <strong>of</strong> October18%New Cairo10%Developmentproperty60%Cairo Alex Road12%North Coast33%Source: PHD, <strong>Deutsche</strong> <strong>Bank</strong>, *after factoring in PHD’s stake in each projectSource: PHD, <strong>Deutsche</strong> bankIn terms <strong>of</strong> the type <strong>of</strong> units <strong>of</strong>fered, PHD’s development properties (all residentialdevelopments) include more <strong>of</strong> villas on a BUA basis. This implies that land sales wouldcontinue to dictate revenues, as only villa land sales are recognized separately at the time <strong>of</strong>signing the contract. For non-residential development, the retail/commercial segmentrepresents 76% <strong>of</strong> the BUA, compared with 24% for hospitality.Figure 122: Residential units: Breakdown (BUA Sqm)Figure 123: Non-residential: Breakdown (BUA sqm)Apartments33%Hospitality24%Villas67%Retail / commercial76%Source: PHD, <strong>Deutsche</strong> <strong>Bank</strong>Source: PHD, <strong>Deutsche</strong> <strong>Bank</strong>PHD intends to retain all non-residential development for investment purposes. Currently, thecompany is developing one hotel (Ritz Carlton), a golf course, a clubhouse and retail space inthe Palm Hills October premises. The company plans to generate 30% <strong>of</strong> its revenue fromthe hospitality, retail and education segments by 2015E (vs. 0% in 2009). PHD acquired a60% stake in Maccor in Q1 10 (a 460-room stake-adjusted portfolio). The strategy is toestablish hotels under the Accor brand across <strong>Egypt</strong>. PHD, under the name <strong>of</strong> Maccor, plansto operate 1,150 rooms within 2 years, and further increase it to 3,500 rooms by 2015. PHDhas also collaborated with various hospitality-based companies such as Taj Hotels (for NorthCoast, Sokhna, Aswan projects) and Ritz Carlton (for Cairo) to jointly manage hotels.<strong>Deutsche</strong> <strong>Bank</strong> AG/London Page 67
5 <strong>July</strong> <strong>2010</strong> <strong>Real</strong> <strong>Estate</strong>, Construction and Building Materials <strong>Egypt</strong> <strong>Real</strong> <strong>Estate</strong>Healthy landbank, but associated with high liabilitiesPHD holds one <strong>of</strong> the largest landbanks <strong>of</strong> 49m sqm (40m sqm equity adjusted), with 31% inGreater Cairo and the remaining in leisure destinations such as Red Sea and North Coast.Around 86% <strong>of</strong> the land is located across <strong>Egypt</strong>, while the other 14% is located in SaudiArabia. The land is accounted in the balance sheet at EGP5.5bn (EGP5.2 per share).The land has been bought at a concession price (DBe avg. EGP167/sqm) on an installmentbasis from the government. We see 2 distinct advantages: As the land purchase price, whichis below the current market price, is fixed, PHD is in a better position vs. its peers to exploitthe increase in real estate prices; and because only 14% <strong>of</strong> the total landbank is underconstruction, PHD is under no immediate compulsion to replenish its landbank as it hassufficient land reserves to support its development for the next 7-10 years.Figure 124: Landbank (m sqm), as <strong>of</strong> end 2009Figure 125: PHD land acquisition cost* (EGP/sqm)60800504050 493270060050030400<strong>2010</strong>20963002001000TMG PHD Heliopolis <strong>Egypt</strong>ianResortsNasr city<strong>SODIC</strong>-Sixth <strong>of</strong> OctoberprojectNew Cairo Cairo Alex Road North Coast Red SeaSource: PHDSource: PHD, <strong>Deutsche</strong> <strong>Bank</strong>, *weighted averageFigure 126: Landbank status, (sqm)Figure 127: Landbank breakdown, (sqm)Raw Land19%Villa Mora0%Aswan2%KSA14%<strong>6th</strong> October12%New Cairo4%Master Planned67%Under Construction14%Red Sea22%North Coast+Alexandria31%Cairo-Alex Desert Rd15%Source: <strong>Deutsche</strong> <strong>Bank</strong>Source: <strong>Deutsche</strong> <strong>Bank</strong>Page 68<strong>Deutsche</strong> <strong>Bank</strong> AG/London
5 <strong>July</strong> <strong>2010</strong> <strong>Real</strong> <strong>Estate</strong>, Construction and Building Materials <strong>Egypt</strong> <strong>Real</strong> <strong>Estate</strong>On the flipside, however, PHD has one <strong>of</strong> the highest land liabilities across <strong>Egypt</strong>iandevelopers. As <strong>of</strong> 2009, PHD had paid around 30% <strong>of</strong> the total land liability (EGP6.8bn) andhad therefore EGP4.6bn (1.2x 2009 equity) <strong>of</strong> outstanding payments to be made to thegovernment/other parties in the next eight years. This compares with EGP165m for <strong>SODIC</strong>,whereas for TMG, the land liability is accounted as percentage <strong>of</strong> BUA developed. In the case<strong>of</strong> PHD, our analysis suggests that 82% <strong>of</strong> the total liability pertains to Cairo land (New Cairo-Sixth <strong>of</strong> October).Figure 128: Land liability per year – EGPmFigure 129: Split <strong>of</strong> land liability - EGPm10009008007006005004003002001000<strong>2010</strong> 2011 2012 2013 2014 2015 2016 2017 2018New Cairo24%North Coast17%Red Sea1% Other projects0%Sixth <strong>of</strong> Octoberproject58%Source: PHD, <strong>Deutsche</strong> <strong>Bank</strong>Source: PHD, <strong>Deutsche</strong> <strong>Bank</strong><strong>Deutsche</strong> <strong>Bank</strong> AG/London Page 69
5 <strong>July</strong> <strong>2010</strong> <strong>Real</strong> <strong>Estate</strong>, Construction and Building Materials <strong>Egypt</strong> <strong>Real</strong> <strong>Estate</strong>Strategy and outlookGrowing backlog provides earnings visibilityPHD had a total backlog <strong>of</strong> EGP9.4bn ending 2009 and 9.9bn end-Q1 10. As this backlogpertains to projects scheduled for completion in the next 5 years, it implies the currentbacklog could generate on average EGP2bn in revenues per annum, even without any furthersales.Figure 130: Backlog (EGP bn)Figure 131: Backlog maturity, ending 2009 (EGPbn)12108.39.49.97201533%<strong>2010</strong>4%201116%864.64202007 2008 2009 Q1 <strong>2010</strong>20143%201318%201226%Source: PHD, <strong>Deutsche</strong> <strong>Bank</strong>Source: PHD, <strong>Deutsche</strong> <strong>Bank</strong>Cancellation and receivable risks are manageableCancellations have progressively declined (Q1 10: 2% <strong>of</strong> backlog) after peaking at ~7% in Q109. In terms <strong>of</strong> backlog exposure to cancellation, we expect that around 23% <strong>of</strong> the totalbacklog, which is in reservation stage, holds above-average cancellation risk. The remaining77% holds a low cancellation risk as customers have already entered into a contract. Further,an 18% cancellation rate (management guidance) for outstanding reservations implies only4% <strong>of</strong> the total backlog is effectively exposed to cancellation risk, or EGP0.4/share.Figure 132: Cancellation as a % <strong>of</strong> backlog (EGPbn)Figure 133: Backlog exposure to cancellations (EGPbn)12.010.08.06.04.02.08%7%6%5%4%3%2%1%Above averagecancellation risk23%-Q408 Q109 Q209 Q309 Q409 Q1 10Contract Reservation Cancellation, % <strong>of</strong> backlog (RHS)0%Low cancellationrisk77%Source: PHD, <strong>Deutsche</strong> <strong>Bank</strong>Source: PHD, <strong>Deutsche</strong> <strong>Bank</strong>At first glance, receivables (102% <strong>of</strong> the 2009 equity) look risky, but as these are cashreceivables, which are partly netted <strong>of</strong>f against advance billings, the exposure <strong>of</strong> equity toreceivables is actually lower than it appears.Page 70<strong>Deutsche</strong> <strong>Bank</strong> AG/London
5 <strong>July</strong> <strong>2010</strong> <strong>Real</strong> <strong>Estate</strong>, Construction and Building Materials <strong>Egypt</strong> <strong>Real</strong> <strong>Estate</strong>Note that receivables are spread over 5,000 customers (~6,000 units). Out <strong>of</strong> the totalreceivables, 69% relates to projects where ~37% <strong>of</strong> cash is received (DBe: W-avg basis),which implies greater commitment from customers and lower risk <strong>of</strong> default. In addition,these projects are put on an accelerated mode, which assures customers <strong>of</strong> a sooner-thananticipateddelivery, making them more committed to pay the remaining installments.Figure 134: Receivables breakdown, end-2009 (EGPm)Figure 135: Cash received as a % <strong>of</strong> project sold*, end-2009 (EGPm)Others31%100%90%80%70%60%50%40%30%20%10%0%61%39%86%14%47%53%56%44%75% 76%25% 24%63%37%Projects on fast track69%Golf Vws.Golf Extn.PHKatameyaH-Bay (Z1)SokhnaH-White(Z1)WavgCash receivedReceivablesSource: PHD, <strong>Deutsche</strong> <strong>Bank</strong>Source: PHD, <strong>Deutsche</strong> <strong>Bank</strong>, *includes only projects on fast trackVertically integrated model secures deliveryPHD is the only <strong>Egypt</strong>ian developer to have an in-house construction arm. The company alsohas a JV with Hassan Allams & Sons, one <strong>of</strong> the leading private contractors in <strong>Egypt</strong>. Thismodel provides guaranteed capacity, assuring timely delivery. This is important because<strong>Egypt</strong> is undergoing a construction boom and securing contractors could becomeincreasingly challenging. In addition, the model has proven to be successful as the in-houseconstruction arm enables PHD to construct at cost and save on external contractors’margins, while the JV provides an attractive cost + 9.5% model (previously cost + 12%)against a market margin <strong>of</strong> 11-15%.High-value projects put on fast-track constructionPHD has prioritized developments and put 6 projects on a fast track to benefit from lowbuilding-material prices in <strong>Egypt</strong>. In terms <strong>of</strong> value, the top four projects represent ~70% <strong>of</strong>DBe revenues from unit sales for <strong>2010</strong>E-15E. By end-2009, most <strong>of</strong> these projects were 50–80% sold vs. 0-40% completed, hence implying ample headroom for margin enhancement inthe current environment where the cost <strong>of</strong> construction has declined. Finally, acceleratingproject construction assures faster delivery, resulting in higher customer commitment andmitigates default risk. Note that these projects account for around 76% <strong>of</strong> the currentreceivables.<strong>Deutsche</strong> <strong>Bank</strong> AG/London Page 71
5 <strong>July</strong> <strong>2010</strong> <strong>Real</strong> <strong>Estate</strong>, Construction and Building Materials <strong>Egypt</strong> <strong>Real</strong> <strong>Estate</strong>Figure 136: : Most important projects (revenue <strong>2010</strong>E-15E), EGPmFigure 137: Most important projects (receivables as <strong>of</strong>end-2009), EGPmPalm Park4%Others13%Ain Sokhna27%Others24%PH Katameya9%H-Bay (Z1)20%Golf Ext11%Golf Views16%Projects on fast track76%Source: <strong>Deutsche</strong> <strong>Bank</strong>Source: <strong>Deutsche</strong> <strong>Bank</strong>Shift towards upper mid-income segment should boost marketshareFollowing a tough year in 2009 for all developers, PHD is increasing its focus on the uppermid-income segment. The average selling price and size per unit has declined since 2006.Further, the company is making its products more affordable by adopting innovative paymentplans. We believe this should increase clientele, as seen in 2009, when the customer basegrew 36% y-o-y, and enabled PHD to gain market share.Figure 138: Cumulative units sold by value range(EGPm)Figure 139: Average selling price per unit (EGPm)6,0005,00032.54,0003,00021.61.51.22,00011,00002006 2007 2008 200902006 2007 2008 20090-0.5m 0.5-1.0m 1.0-1.5m 1.5-2.0m >2.0mSource: PHD, <strong>Deutsche</strong> <strong>Bank</strong>Source: PHD, <strong>Deutsche</strong> <strong>Bank</strong>This is well supported by one <strong>of</strong> the largest, most widely distributed sales forces among<strong>Egypt</strong>ian developers. The company has 86 salespeople across <strong>Egypt</strong> and holds an agreementwith Coldwell <strong>Bank</strong>er, a 49% associate with 800 <strong>of</strong>fices and 126,000 sales associates aroundthe world, to promote and sell PHD’s properties. PHD has opened sales <strong>of</strong>fices in Europe(London) and intends to open more centers across the Gulf region. It recently entered into aMOU with Borooj Properties, the real estate arm <strong>of</strong> Abu Dhabi Islamic <strong>Bank</strong> (ADIB), toexpand its client base and provide mortgage finance to potential customers through ADIB’sprograms.Page 72<strong>Deutsche</strong> <strong>Bank</strong> AG/London
5 <strong>July</strong> <strong>2010</strong> <strong>Real</strong> <strong>Estate</strong>, Construction and Building Materials <strong>Egypt</strong> <strong>Real</strong> <strong>Estate</strong>Saudi Arabian venture – Well thought out and well timedPHD has a 51% (<strong>of</strong> the EGP600m) JV in Saudi Arabia and holds 6.6m sqm <strong>of</strong> land, 3.6m sqmin Riyadh and 3m sqm in Jeddah. We think this is a well-timed move as Saudi real estate ison the brink <strong>of</strong> change, and the introduction <strong>of</strong> the new mortgage law could trigger rapidgrowth. Note that KSA requires around DBe 0.2m houses every year against a supply <strong>of</strong> justover DBe 0.1m units. This shortage is particularly evident in Riyadh and Jeddah.No compulsion to raise fundsWe believe PHD would require funding in the midterm to continue its developments andbuild its investment portfolio. Nevertheless, based on the projects considered for our SOTP(until 2012), PHD seems to have enough funding for the next 2 years. In the meantime, weexpect cash-flow generation to improve as almost 52% (EGP2bn) <strong>of</strong> receivables matureduring <strong>2010</strong>E-11E. In terms <strong>of</strong> financing, PHD finalized a ~1bn loan agreement in Q110 andsuccessfully completed a EGP700m rights issue that began on 8 March.Figure 140: Cash flow generation (<strong>2010</strong>E-12E)EGPm <strong>2010</strong>E 2011E 2012EOpening cash balance 135 379 150Customer cash collection (DP) 2,114 2,986 4,042Net operating income (IP) 22 24 27Construction cost (DP) (1,599) (1,747) (1,846)Capex (IP) (258) (352) (473)Other capex (219) - -land payments (632) (921) (883)Other operating costs (144) (441) (558)Net cash flow from operations (716) (451) 308Acquisition - - -Other investing cash flow (32) 47 47Debt repayment (417) (342) (281)Other financing CF 160 - -Excess cash / (shortfall cash) before additional funding (870) (367) 224Equity raised 699 - -Debt raised 550 517 -Excess cash / (shortfall cash) after additional funding 379 150 224Source: <strong>Deutsche</strong> <strong>Bank</strong>,<strong>Deutsche</strong> <strong>Bank</strong> AG/London Page 73
5 <strong>July</strong> <strong>2010</strong> <strong>Real</strong> <strong>Estate</strong>, Construction and Building Materials <strong>Egypt</strong> <strong>Real</strong> <strong>Estate</strong>As <strong>of</strong> Q110, PHD has a 19% gearing, while cash generating capacity from the currentbacklog should provide enough headroom for sourcing funds for new developments. Debtmaturity also looks comfortable, with big maturity expected only in 2015E (EGP567m), priorto which PHD is expected to deliver most <strong>of</strong> its important projects.Figure 141: Net debt and gearingFigure 142: Debt maturity (EGPm)1,40030%6001,20025%5001,00020%40080060040020015%10%5%300200100-2007 2008 2009 <strong>2010</strong>E 2011E 2012E0%-<strong>2010</strong>E 2011E 2012E 2013E 2014E 2015ENet debt / (Net cash), EGPmGearingPrincipalinterestSource: PHD, <strong>Deutsche</strong> <strong>Bank</strong>Source: PHD, <strong>Deutsche</strong> <strong>Bank</strong>Page 74<strong>Deutsche</strong> <strong>Bank</strong> AG/London
5 <strong>July</strong> <strong>2010</strong> <strong>Real</strong> <strong>Estate</strong>, Construction and Building Materials <strong>Egypt</strong> <strong>Real</strong> <strong>Estate</strong>Financial reviewHistorical revenue performance is not very meaningful at this stage. PHD has derivedrevenues primarily from the sale <strong>of</strong> lands associated with villas and townhouses, despiteachieving significant unit sales, due to limited deliveries. As described below, the disparitybetween revenues and sales is mainly due to PHD’s revenue recognition policy. Thecompany recognizes land revenues associated with villas and townhouses upon the signing<strong>of</strong> a contract, while revenues from construction are recognized on a percentage completionbasis with a minimum threshold <strong>of</strong> 50% construction. Revenues from apartments and multitenant builds are recognized upon delivery.Figure 143:Revenue breakdown, EGPm (2006-09) Figure 144: Sales (2006-09)1,400690%25003,5001,2001,000590%490%20003,0002,500800390%15002,000600290%10001,500400200190%90%5001,000500-2006 2007 2008 2009-10%02006 2007 2008 2009-land attributable to villas Construction contracts yoy growth (RHS)Sales (EGPm), RHSUnits soldSource: PHD, <strong>Deutsche</strong> <strong>Bank</strong>Source: PHD, <strong>Deutsche</strong> <strong>Bank</strong>Positive net reservations in 2009 despite challenging market conditions2009 was a year <strong>of</strong> opposites, H109 was weaker, with stagnating primary home sales, butsecond/vacation homes recorded strong demand in H209. The company witnessed a strongresponse for Hacienda Bay (Zone 1) and the launch <strong>of</strong> Hacinda white (Phase 1) in Q309 (76%sold by end-2009). Total backlog reached EGP9.4bn (+13% yoy) on the back <strong>of</strong> a EGP1bnincrease in net reservations, while contracts conversion increased 5% y-o-y to EGP3.3bn.Revenues were EGP1.1bn (-7.2% yoy) for 2009, mainly due to a tough H109, with lower netsales (net reservations + net contracts) stemming from an increase in cancellations.However, H209 was stronger, with revenues growing 65% y-o-y and net sales recovering.Figure 145: Sales and revenues (EGPm)Figure 146: Operating and net income, 2006-09 (EGPm)1,55080070%1,35070060%1,150950750550350150(50)60050040030020010050%40%30%20%10%(250)Q1 08 Q208 Q308 Q408 Q109 Q209 Q309 Q409 Q11002006 2007 2008 20090%Net reservations Contracts RevenuesSource: PHD, <strong>Deutsche</strong> <strong>Bank</strong>EBITDA Net income EBITDA mgn (RHS) NPM (RHS)Source: PHD, <strong>Deutsche</strong> <strong>Bank</strong><strong>Deutsche</strong> <strong>Bank</strong> AG/London Page 75
5 <strong>July</strong> <strong>2010</strong> <strong>Real</strong> <strong>Estate</strong>, Construction and Building Materials <strong>Egypt</strong> <strong>Real</strong> <strong>Estate</strong>Improving pre sales activity in Q1 10Revenues came in at EGP198m (+52% y-o-y,-58% q-o-q) with the introduction <strong>of</strong> recurringrevenues (EGP1.8m from Maccor). Net income stood at EGP107 m (+21% y-o-y,-20% q-o-q)on the back <strong>of</strong> higher other income stemming from the Maccor acquisition.The backlog reached approx. EGP 10bn (+6% vs. 2009), out <strong>of</strong> which cumulative contractsreached EGP7.4bn and cumulative reservations were EGP2.6bn. New reservations increased33% q-o-q and 86% y-o-y to EGP773m. Cancellations continued on a declining trend to reachEGP186m in Q1 (-36% q-o-q, -70% y-o-y). All in all, net reservations increased to EGP588m (-EGP209m for Q109, EGP288m for Q410). However, contract conversions stayed low (-3% y-o-y, -50 q-o-q) as the company focused on new reservations. We believe Q2 and Q3 shouldsee an increase in new contracts as conversions should improve as legal formalities are met.Figure 147: Quarterly resultsEGPm Q1 10 Q1 09 % Chg Q4 09 % ChgRevenues 198 130 52% 471 -58%Gross pr<strong>of</strong>it 107 109 -2% 224 -52%GPM 54% 84% 48%Net income 107 89 21% 134 -20%DB restated net income post minorities 60 83 -28% 128 -53%Net margin 30% 64% 27%Source: PHD, <strong>Deutsche</strong> <strong>Bank</strong>Page 76<strong>Deutsche</strong> <strong>Bank</strong> AG/London
5 <strong>July</strong> <strong>2010</strong> <strong>Real</strong> <strong>Estate</strong>, Construction and Building Materials <strong>Egypt</strong> <strong>Real</strong> <strong>Estate</strong>Pr<strong>of</strong>it and loss accountFigure 148: Pr<strong>of</strong>it and loss accountEGP m 2008 2009 <strong>2010</strong>E 2011E 2012ERevenues 1,235 1,146 1,577 3,763 4,626% growth 130.8% -7.2% 37.6% 138.6% 22.9%COGS (293) (455) (760) (1,950) (2,886)as <strong>of</strong> % sales -23.8% -39.7% -48.2% -51.8% -62.4%Gross pr<strong>of</strong>it 941 691 817 1,813 1,741as <strong>of</strong> % sales 76.2% 60.3% 51.8% 48.2% 37.6%% growth 139.8% -26.6% 18.2% 122.0% -4.0%SG&A (excluding depreciation & amortization) (193) (156) (215) (512) (629)as <strong>of</strong> % sales -15.6% -13.6% -13.6% -13.6% -13.6%Other operating income 0 0 0 0 0EBITDA 749 535 602 1,302 1,111as <strong>of</strong> % sales 60.7% 46.7% 38.2% 34.6% 24.0%% growth 163.8% -28.5% 12.5% 116.1% -14.6%EBIT 730 503 577 1,234 1,059as <strong>of</strong> % sales 59.1% 43.9% 36.6% 32.8% 22.9%% growth 159.0% -31.1% 14.8% 113.8% -14.2%Net interest income/(expense) (35) 38 43 28 18Other income/(expense) 25 20 47 47 47Tax (59) (40) (48) (93) (80)Attributable net income 658 476 566 1,112 955% growth -27.7% 19.1% 96.2% -14.1%Source: PHD, <strong>Deutsche</strong> <strong>Bank</strong><strong>Deutsche</strong> <strong>Bank</strong> AG/London Page 77
5 <strong>July</strong> <strong>2010</strong> <strong>Real</strong> <strong>Estate</strong>, Construction and Building Materials <strong>Egypt</strong> <strong>Real</strong> <strong>Estate</strong>Cash flow statementFigure 149: Cash flow statementEGPm 2008 2009 <strong>2010</strong>E 2011E 2012ECash flow from operations 738 482 598 1,236 1,050(Incr)/decr in working capital (1,276) (501) (1,030) (1,508) (415)Purchase <strong>of</strong> property, plant and equipment (57) (26) (218) - -Disposal <strong>of</strong> property, plant & equipment - 0 - - -Purchase <strong>of</strong> investment property - (31) (236) (328) (446)Purchase <strong>of</strong> intangibles (53) - (2) - -Total capex (110) (57) (455) (328) (446)Operating free cash-flow (649) (76) (888) (600) 189Advance payments for investments acquisition (362) (7) (53) - -Acquisition <strong>of</strong> subsidiary net <strong>of</strong> cash (80) (196) - - -Proceeds from sale <strong>of</strong> AFS investments - - (25) - -Other income - - 47 47 47FCF after investing activities (1,091) (278) (920) (553) 236Proceeds from shares issued 990 - 699 - -Proceeds from term loan 376 157 550 517 -Payments for term loan (47) (84) (245) (192) (162)Amounts paid under capital increase by minorities 11 - - - -Minority share in the capital <strong>of</strong> subsidiary 38 25 160 - -Acquisition <strong>of</strong> minority stake (11) - - - -Net cash flow 268 (180) 244 (229) 74Source: PHD, <strong>Deutsche</strong> <strong>Bank</strong>Page 78<strong>Deutsche</strong> <strong>Bank</strong> AG/London
5 <strong>July</strong> <strong>2010</strong> <strong>Real</strong> <strong>Estate</strong>, Construction and Building Materials <strong>Egypt</strong> <strong>Real</strong> <strong>Estate</strong>Balance sheetFigure 150: Balance sheetEGPm 2008 2009 <strong>2010</strong>E 2011E 2012EASSETSInvestment property - 483 719 1,047 1,493Property, plant and equipment 543 90 283 216 163Advance payments for investment acquisition 471 165 218 218 218Intangible assets 48 42 44 44 44Notes receivable 1,658 2,501 2,501 2,501 2,501Others / inv. In an associate - 0 26 26 26Notes receivables 683 967 1,216 1,581 1,681Account receivables, deposits and prepayments 319 547 688 895 951<strong>Bank</strong> balance and cash 280 135 379 150 224Fair asset at FV through P&L - Held for trading 203 128 128 128 128Development properties 4,940 5,474 6,885 8,949 9,518Total assets 9,145 10,531 13,086 15,754 16,947LIABILITIES AND EQUITYEquityShare capital 932 1,398 2,097 2,097 2,097Share premium 891 - - - -Statuary Reserves 14 516 516 516 516Retained earnings 851 1,249 1,815 2,927 3,881Minority interest 145 248 461 565 654Total equity 2,832 3,410 4,888 6,104 7,148Term loans 380 355 660 984 822Land purchase liabilities 1,653 872 872 872 872Notes Payables 1,172 1,948 1,948 1,948 1,948Other non current liabilities 165 253 253 253 253Deferred tax liabilities 2 2 2 2 2<strong>Bank</strong> overdraft 111 146 146 146 146Current portion <strong>of</strong> term loans 136 235 235 235 235Current portion <strong>of</strong> land purchase liabilities 299 319 319 319 319Account payables & accruals 266 253 319 414 440Notes payables 261 400 503 654 696Advances from customers 574 328 413 536 571Bills in excess <strong>of</strong> cost 1,237 1,970 2,478 3,221 3,425Income tax payable 58 40 50 65 69Provisions - - - - -Total liabilities and equity 9,145 10,531 13,086 15,754 16,947Net debt 348 601 662 1,215 979Gearing 12% 18% 14% 20% 14%Source: PHD, <strong>Deutsche</strong> <strong>Bank</strong><strong>Deutsche</strong> <strong>Bank</strong> AG/London Page 79
5 <strong>July</strong> <strong>2010</strong> <strong>Real</strong> <strong>Estate</strong>, Construction and Building Materials <strong>Egypt</strong> <strong>Real</strong> <strong>Estate</strong>Middle East <strong>Egypt</strong><strong>Real</strong> <strong>Estate</strong>, Construction and Building Materials <strong>Real</strong> <strong>Estate</strong>4 <strong>July</strong> <strong>2010</strong>TMG HoldingReuters: TMGH.CABloomberg: TMGH EYRisks on land <strong>of</strong>fset a strongstory; initiate with HoldRisks on land <strong>of</strong>fset a strong story; initiate with HoldTMG <strong>of</strong>fers the best exposure to the urbanization trend in Cairo and demand fromthe mid to mid-upper segments in an acutely undersupplied market. The companyhas a solid sales backlog <strong>of</strong> EGP24bn, which provides earnings visibility for thenext 3+years. Nevertheless, the potential outcome <strong>of</strong> lawsuit on the Madinatylandbank remains difficult to predict and adds risk. A positive outcome could leadus to change our view on the stock. We initiate with a Hold.Solid sales backlog with strong Q1 presalesTMG is <strong>Egypt</strong>’s largest property developer with EGP24bn <strong>of</strong> backlog as <strong>of</strong> end1Q10, which covers deliveries for the next 3+ years. Legal risks aside,cancellation risk is low as customers are in net equity territory, and around 33% <strong>of</strong>cash has been collected. Additionally, after a muted 2009, presales were strong in1Q10. (EGP1.2bn in 1Q10 vs. EGP0.4bn in 1Q09). The next three years are crucialas TMG enters a massive delivery phase (c.26k units), which should improve thecash flow pr<strong>of</strong>ile (we forecast c.EGP16bn to be collected from delivered units).Risks on Madinaty landbank lower visibilityOn 22 June, an <strong>Egypt</strong>ian court ruled to nullify the sale <strong>of</strong> government land to TMGfor its Madinaty project. The court ruled that NUCA, a body under housingministry, had broken the law by selling the land to TMG in 2005 and not opening itup to an auction process. TMG has a unique agreement with NUCA: instead <strong>of</strong>paying for the land in cash, it negotiated to pay for Madinaty and Al Rehab in kind(7% and 12% <strong>of</strong> the developed BUA). Madinaty land represents 33m sqm or 86%<strong>of</strong> TMG’s land in <strong>Egypt</strong> (71% <strong>of</strong> EV). NUCA appealed to the court to stop theexecution <strong>of</strong> the verdict with a hearing set for 17 <strong>July</strong> <strong>2010</strong>. Although the housingminister said that the court ruling does not cancel the TMG contract, risks remainon the potential outcome.Target price <strong>of</strong> EGP7.8, HoldOur standalone SOTP valuation is EGP10.7/share. Nonetheless we believe anegative outcome on the Madinaty case could result in significant valuationdownside (EGP4.9 per share). We apply a 50% likelihood to this scenario,resulting in a target price <strong>of</strong> EGP7.8, equivalent to a 27% discount to ourstandalone value. For development properties, we use DCF with WACC <strong>of</strong> 15.1%(RF rate 8.5%, RP 5.5%, Beta 1.3). For the existing hotel portfolio, we use 12x<strong>2010</strong>E gross pr<strong>of</strong>it. We value hotel properties under construction at BV, and thelandbank at EGP525/sqm, a 30% discount to 2007 auction price. Key specificdownside risks for TMG include 1) Potential outcome on Madinaty case, 2)backlog cancellation/presales slowdown, 3) lack <strong>of</strong> affordability, 4) tourismslowdown, 5) construction cost inflation, 6) excessive concentration on Madinaty(71% <strong>of</strong> SOTP), and 7) news flow relating to the ex-chairman’s trial. Upside riskinclude favourable outcome on Madinaty lawsuit.HoldPrice at 4 Jul <strong>2010</strong> (EGP) 7.03Price Target (EGP) 7.8052-week range (EGP) 8.54 - 5.08Price/price relative119865327/08 1/09 7/09 1/10TMG HoldingHermes <strong>Egypt</strong> Stock M (Rebased)Performance (%) 1m 3m 12mAbsolute -12.0 -9.8 27.4Stock dataMarket cap (EGP)(m) 14,124.9Shares outstanding (m) 2,009Free float (%) 42Hermes <strong>Egypt</strong> Stock Market Index 718.3Key indicators (FY1)ROE (%) 5.3Net debt/equity (%) 4.8Book value/share (EGP) 12.1Price/book (x) 0.6Net interest cover (x) –EBIT margin (%) 31.2Forecasts and ratiosYear End Dec 31 2009A <strong>2010</strong>E 2011E 2012ERevenue (EGPm) 4,822 5,271 7,539 11,499DB EPS (EGP) 0.57 0.63 0.89 1.38P/BV 0.6 0.6 0.5 0.5Source: <strong>Deutsche</strong> <strong>Bank</strong> estimates, company dataPage 80<strong>Deutsche</strong> <strong>Bank</strong> AG/London
5 <strong>July</strong> <strong>2010</strong> <strong>Real</strong> <strong>Estate</strong>, Construction and Building Materials <strong>Egypt</strong> <strong>Real</strong> <strong>Estate</strong>Model updated:30 June <strong>2010</strong>Running the numbersMiddle East<strong>Egypt</strong><strong>Real</strong> <strong>Estate</strong>TMG HoldingReuters: TMGH.CAHoldBloomberg: TMGH EYPrice (5 Jul 10) EGP 6.86Target price EGP 7.8052-week Range EGP 5.08 - 8.54Market Cap (m) EGPm 13,783USDm 2,420Company Pr<strong>of</strong>ileTalaat Mostafa Group Holding is the largest real estatedeveloper in <strong>Egypt</strong>. The business model revolves arounddeveloping large-scale integrated city and communitycomplexes, primarily in the outskirts <strong>of</strong> Cairo, targeted at midto mid upper income clientele. It has a proven execution trackrecord, having already delivered 57,000 units and a BUA <strong>of</strong>more than 9mn sqm. TMG has 50m sqm <strong>of</strong> landbank in <strong>Egypt</strong>and Saudi Arabia. The most notable <strong>of</strong> TMG's projects is theMadinaty project spanning over 33.6m sqm.Price Performance11986532Jul 08 Dec 08 Jun 09TMG HoldingDec 09 M ay 10Margin Trends34323028262422Hermes <strong>Egypt</strong> St ock Market Index (Rebased)0 9 10 E 11E 12 EEBITDA MarginGrowth & Pr<strong>of</strong>itability6040200Solvency1050-5-10-15EBIT Mar gin0 9 10 E 11E 12 ESales growth (LHS)ROE (RHS)0 9 10 E 11E 12 ENet debt /equit y (LHS)Athmane BenzerrougNet interest cover (RHS)+971 4 4283938 athmane.benzerroug@db.com151050Fiscal year end 31-Dec 2009 <strong>2010</strong>E 2011E 2012EFinancial SummaryDB EPS (EGP) 0.57 0.63 0.89 1.38Reported EPS (EGP) 0.55 0.63 0.89 1.38DPS (EGP) 0.00 0.00 0.00 0.00BVPS (EGP) 11.5 12.1 13.0 14.4Weighted average shares (m) 2,009 2,009 2,009 2,009Average market cap (EGPm) 10,236 13,783 13,783 13,783Enterprise value (EGPm) 11,466 14,629 12,983 10,702Valuation MetricsP/E (DB) (x) 8.9 10.9 7.7 5.0P/E (Reported) (x) 9.3 10.9 7.7 5.0P/BV (x) 0.60 0.56 0.53 0.48FCF Yield (%) nm 3.3 12.8 18.0Dividend Yield (%) 0.0 0.0 0.0 0.0EV/Sales (x) 2.4 2.8 1.7 0.9EV/EBITDA (x) 9.1 8.3 5.3 2.8EV/EBIT (x) 9.9 8.9 5.6 3.0Income Statement (EGPm)Sales revenue 4,822 5,271 7,539 11,499Gross pr<strong>of</strong>it 1,486 2,012 2,826 4,329EBITDA 1,261 1,757 2,463 3,774Depreciation 101 111 158 242Amortisation 0 0 0 0EBIT 1,160 1,646 2,304 3,533Net interest income(expense) 72 30 74 202Associates/affiliates 0 0 0 0Exceptionals/extraordinaries 0 0 0 0Other pre-tax income/(expense) 80 33 33 33Pr<strong>of</strong>it before tax 1,313 1,710 2,412 3,768Income tax expense 113 342 482 754Minorities 93 106 150 234Other post-tax income/(expense) 0 0 0 0Net pr<strong>of</strong>it 1,106 1,261 1,779 2,780DB adjustments (including dilution) 43 0 0 0DB Net pr<strong>of</strong>it 1,150 1,261 1,779 2,780Cash Flow (EGPm)Cash flow from operations -233 1,427 2,950 3,661Net Capex -225 -969 -1,188 -1,179Free cash flow -458 458 1,763 2,482Equity raised/(bought back) -310 0 0 0Dividends paid 0 0 0 0Net inc/(dec) in borrowings -56 -552 -620 -620Other investing/financing cash flows -140 0 0 0Net cash flow -964 -94 1,142 1,862Change in working capital -1,474 -18 896 438Balance Sheet (EGPm)Cash and other liquid assets 399 304 1,447 3,309Tangible fixed assets 4,312 5,170 6,200 7,137Goodwill/intangible assets 15,135 15,135 15,135 15,135Associates/investments 2,162 2,195 2,229 2,262Other assets 31,881 36,840 40,926 45,555Total assets 53,889 59,646 65,937 73,398Interest bearing debt 2,106 1,554 934 314Other liabilities 26,954 31,895 36,877 41,944Total liabilities 29,060 33,449 37,811 42,258Shareholders' equity 23,144 24,406 26,185 28,965Minorities 1,685 1,791 1,941 2,175Total shareholders' equity 24,829 26,197 28,126 31,140Net debt 1,708 1,250 -513 -2,995Key Company MetricsSales growth (%) nm 9.3 43.0 52.5DB EPS growth (%) na 9.7 41.1 56.2EBITDA Margin (%) 26.1 33.3 32.7 32.8EBIT Margin (%) 24.0 31.2 30.6 30.7Payout ratio (%) 0.0 0.0 0.0 0.0ROE (%) 4.9 5.3 7.0 10.1Capex/sales (%) 4.7 18.4 15.8 10.3Capex/depreciation (x) 2.2 8.8 7.5 4.9Net debt/equity (%) 6.9 4.8 -1.8 -9.6Net interest cover (x) nm nm nm nmSource: Company data, <strong>Deutsche</strong> <strong>Bank</strong> estimates<strong>Deutsche</strong> <strong>Bank</strong> AG/London Page 81
5 <strong>July</strong> <strong>2010</strong> <strong>Real</strong> <strong>Estate</strong>, Construction and Building Materials <strong>Egypt</strong> <strong>Real</strong> <strong>Estate</strong>Investment thesisOutlookTMG is the largest real estate developer in <strong>Egypt</strong>. We see the company as a strongbeneficiary <strong>of</strong> urbanization and middle class growth in a market characterized by acuteresidential undersupply for mid to mid-upper income consumers – TMG’s target clientele.Along with a long execution track record, TMG has developed a brand name leading to abacklog <strong>of</strong> EGP24bn providing 3+ years <strong>of</strong> earnings visibility. Legal risks aside, cancellationrisk is low as customers are in net equity territory, and around 33% <strong>of</strong> cash has beencollected. Additionally, after a muted 2009, presales were strong in 1Q10 (EGP1.2bn in 1Q10vs. EGP0.4bn in 1Q09). The next three years are crucial as TMG enters a massive deliveryphase (c.26k units) which should improve the cash flow pr<strong>of</strong>ile (we estimate c.EGP16bn tobe collected from delivered units).TMG land has been acquired under favorable terms, payment for which will be made in kind(7% and 12% <strong>of</strong> finished residential built up area (BUA), respectively for Madinaty and AlRehab II) after completion <strong>of</strong> each phase. We like this approach as it prevents capital frombeing locked up, reduces the risk <strong>of</strong> unsold inventory and leads to the right alignment <strong>of</strong> cashflows.However, on 22 June, an <strong>Egypt</strong>ian court ruled to nullify the sale <strong>of</strong> government land to TMGfor its Madinaty project. The court ruled that the NUCA, a body under the housing ministry,had broken the law by selling the land to TMG in 2005 and not opening it up to an auctionprocess. As mentioned above, TMG has a unique agreement with NUCA among <strong>Egypt</strong>iandevelopers: Madinaty land represents 33m sqm or 86% <strong>of</strong> TMG’s land in <strong>Egypt</strong> (71% <strong>of</strong> EV).NUCA appealed to the court to stop the execution <strong>of</strong> the verdict with a hearing set for 17 <strong>July</strong>(source: Reuters). Although the housing minister said that the court ruling does not cancel theTMG contract, risks remain on the outcome.Thus, despite an interesting story, we initiate with a Hold and target price <strong>of</strong> EGP7.8.ValuationOur standalone SOTP valuation works out to EGP10.7/share. Nonetheless we believe that anegative outcome from the court on Madinaty land could result in significant valuationdownside (EGP4.9 per share). We apply a 50% likelihood to this scenario, resulting in a targetprice <strong>of</strong> EGP7.8 equivalent to a 27% discount to our standalone value. For developmentproperties, we use DCF with WACC <strong>of</strong> 15.1% (RF rate 8.5%, RP 5.5%, Beta 1.3). For theexisting hotel portfolio, we use 12x <strong>2010</strong>E gross pr<strong>of</strong>it. We value hotel properties underconstruction at BV, and the landbank at EGP525/sqm, at 30% discount to 2007 auction price<strong>of</strong> EGP750/sqm achieved in East Cairo.Risks<strong>Egypt</strong>ian developers are exposed to availability <strong>of</strong> financing, economic conditions andconsumer confidence, which drive the real estate market. Key specific downside risks forTMG include 1) Potential outcome on Madinaty Court case, 2) backlog cancellation/presalesslowdown, 3) lack <strong>of</strong> affordability in TMG’s projects, 4) tourism slowdown, 5) constructioncost inflation, 6) excessive concentration on Madinaty (71% <strong>of</strong> SOTP), and 7) overhang fromnews flow relating to the ex-chairman’s trial. Upside risk include favourable outcome onMadinaty lawsuit.Page 82<strong>Deutsche</strong> <strong>Bank</strong> AG/London
5 <strong>July</strong> <strong>2010</strong> <strong>Real</strong> <strong>Estate</strong>, Construction and Building Materials <strong>Egypt</strong> <strong>Real</strong> <strong>Estate</strong>SWOT analysisStrengths• Long execution track record with a strong brand name – a key requirement in an <strong>of</strong>f-planmodel where customers have to trust the company with their hard earned money.• Off-plan business model, flexible construction model along with favorable landacquisition terms (payment in kind and aligned with delivery)• Low gearing (8% in 1Q10), leaving enough room for future debt raising.Weaknesses• Exposure to inflation in construction costs as products are sold <strong>of</strong>f plan and then built.• Limited diversity <strong>of</strong> assets: 97% <strong>of</strong> residential BUA is based in <strong>Egypt</strong>. Around 86% <strong>of</strong> theBUA is concentrated in Madinaty (New Cairo).• Sustained slowdown in tourism could affect TMG’s hotel performance.• Potential outcome <strong>of</strong> ex-chairman’s trial could create a short-term overhang on the stock.Opportunities• Favorable demographics, growing middle class and undersupply <strong>of</strong> quality affordablehousing.• Strategy to increase the number <strong>of</strong> hotel rooms 3.8x to 2,600 by 2014 from 684 in 2009.• International expansion already in place in Saudi Arabia, with plans to export the businessmodel to other demographically similar geographies.Threats• Potential negative outcome on the court judgment on Madinaty.• Potential economic slowdown could affect the pre-sales (similar to 2009).• Increasing competition in TMG’s target segment from notable international developersand inability to acquire large parcels <strong>of</strong> land in the future at favorable rates could affectpr<strong>of</strong>itability.The legal framework in <strong>Egypt</strong> is not very protective for developers. Homebuyers are able tocancel any time before handover with developers allowed to keep between 5-10% <strong>of</strong> thesales value. Nevertheless, the refund is not made before the unit is re-sold.<strong>Deutsche</strong> <strong>Bank</strong> AG/London Page 83
5 <strong>July</strong> <strong>2010</strong> <strong>Real</strong> <strong>Estate</strong>, Construction and Building Materials <strong>Egypt</strong> <strong>Real</strong> <strong>Estate</strong>ValuationStandalone SOTP at EGP10.7We value TMG using an SOTP with specific assumptions for each business line.Development propertiesWe use a DCF to value development properties with a WACC <strong>of</strong> 15.1% (RF rate 8.5%, Riskpremium <strong>of</strong> 5.5% and Beta <strong>of</strong> 1.3). Our <strong>2010</strong>E residential price assumptions are EGP10k/sqmfor villas and EGP5k/sqm for apartments with gross margins <strong>of</strong> 41% for villas and 31% forapartments. We include new pre-sales only for the next three years in DCF.Hospitality businessFor mature hotels such as Nile Plaza, Four Seasons Sharm El Sheikh and Alexandria, we use12x <strong>2010</strong>E gross pr<strong>of</strong>it. We value Nile Hotel Cairo (immature asset) at 2009 BV.Landbank valuationWe value the landbank at EGP525/sqm, which is a 30% discount to 2007 auction price <strong>of</strong>EGP750/sqm achieved in New Cairo. Discount reflects the location <strong>of</strong> the land and executionrisk.Figure 151: SOTP ValuationEGPm EGPm % EV CommentsDevelopment properties 8,703 38% DCF @ 15.1% WACCHotels & Resorts 2,211 10% Matured portfolio @ 12x GP, rest at BVLandbank 10,072 44% @525/sqm (30% discount to 2007 Auction)Others 2,162 8% @ 2009BV (Associates, financial investments)Total EV 23,149 100%Net debt (1,708)Equity value 21,441Number <strong>of</strong> shares (M) 2,009SOTP per share 10.7Source: <strong>Deutsche</strong> <strong>Bank</strong>We have performed a sensitivity analysis below to see how the discount to auction priceaffects our standalone SOTP.Figure 152: Standalone SOTP sensitivity to discount to auction priceDiscount to standalone SOTP @ 0% @ 10% @ 20% @ 30% @ 40% @ 50% @ 60% @ 70% @ 80% @ 90% @ 100%SOTP /Share 12.8 12.1 11.4 10.7 10.0 9.2 8.5 7.8 7.1 6.4 5.7Source: <strong>Deutsche</strong> <strong>Bank</strong>Page 84<strong>Deutsche</strong> <strong>Bank</strong> AG/London
5 <strong>July</strong> <strong>2010</strong> <strong>Real</strong> <strong>Estate</strong>, Construction and Building Materials <strong>Egypt</strong> <strong>Real</strong> <strong>Estate</strong>Figure 153: EV by business segmentFigure 154: EV by projectsOthers9%Developmentproperties38%Hotels & Resorts10%Al Rabwa1%Others9%Lanbank43%Al Rehab9%Hotels & Resorts10%Madinaty71%Source: <strong>Deutsche</strong> <strong>Bank</strong>Source: <strong>Deutsche</strong> <strong>Bank</strong>Target price set at EGP7.8We believe a negative outcome from the court on Madinaty land could result in significantvaluation downside. In that case, we remove the Madinaty landbank valuation from ourcalculation and include only the development properties backlog (EGP25bn) as <strong>of</strong> end-2009.We apply a 50% likelihood to this scenario, resulting in an EGP7.8 valuation. We have workedout a sensitivity analysis on the potential negative outcome (Figure 6).Figure 155: Target price justificationCourt judgment EGP per share LikelihoodPositive 10.7 50%Negative 4.9 50%Average TP 7.8Source: <strong>Deutsche</strong> <strong>Bank</strong>Figure 156: Sensitivity analysis on court rulingLikelihood <strong>of</strong> negative outcome 0% 10% 20% 30% 40% 50% 60% 70% 80% 90% 100%TP (EGP) 10.7 10.1 9.5 8.9 8.4 7.8 7.2 6.6 6.1 5.5 4.9Source: <strong>Deutsche</strong> <strong>Bank</strong>Option value <strong>of</strong> EGP0.3/share from Saudi Arabia projectIn Riyadh, TMG plans to build an integrated residential community modeled on Al Rehab in<strong>Egypt</strong>. The company has formed a 50/50 JV with Al Oula <strong>Real</strong> <strong>Estate</strong> Development Company.(Note that all parameters approximately match with projects developed by the leading Saudideveloper - Dar Al Arkan). At this stage, we cautiously value the project at book value(EGP0.2/share). However, at full potential, the project could generate EGP0.3/share <strong>of</strong> upside(see calculation below).Figure 157: Nassamat Al Riyadh ValuationSales Value (SARm) 4,900Net pr<strong>of</strong>it margin 25%Net pr<strong>of</strong>it (SARm) 1,200Net Present Value (SARm) 663Net Present Value (EGPm) 972NPV/Share (EGP) 0.5Already assumed in Book Value/share (EGP) 0.2Incremental Value addition/share (EGP) 0.3Source: <strong>Deutsche</strong> <strong>Bank</strong><strong>Deutsche</strong> <strong>Bank</strong> AG/London Page 85
5 <strong>July</strong> <strong>2010</strong> <strong>Real</strong> <strong>Estate</strong>, Construction and Building Materials <strong>Egypt</strong> <strong>Real</strong> <strong>Estate</strong>Company pr<strong>of</strong>ileCorporate pr<strong>of</strong>ileTalaat Mostafa Group Holding is the largest real estate developer in <strong>Egypt</strong>. The businessmodel revolves around developing large-scale integrated city and community complexes,primarily in the outskirts <strong>of</strong> Cairo, targeted at mid to mid upper income clientele. It has aproven execution track record, having already delivered 57,000 units and a BUA <strong>of</strong> more than9mn sqm. TMG has 50m sqm <strong>of</strong> landbank in <strong>Egypt</strong> and Saudi Arabia (through a 50/50 JV withAl Oula <strong>Real</strong> <strong>Estate</strong> Development Company). The most notable <strong>of</strong> TMG’s projects is theMadinaty project spanning over 33.6m sqm. Additionally, to incorporate more recurringincome in its earnings model, TMG has diversified into developing hotels and resortcomplexes. Currently, it has 684 operational 5-star hotel rooms in three hotels in Cairo, SharmEl Sheikh and Alexandria with plans to increase the number <strong>of</strong> hotel rooms to 2,600 by 2014with a projected capex <strong>of</strong> c.EGP4bn.Figure 158: Breakdown <strong>of</strong> revenues/gross pr<strong>of</strong>it – 2009 Figure 159: Gross pr<strong>of</strong>it margin – 2009100%80%4% 6%11%15%45%40%35%41% 42%60%30%29%40%84%79%25%20%20%15%10%0%RevenuesGross Pr<strong>of</strong>itProperty Sales Hotels Services5%0%Property Sales Hotels ServicesSource: TMGSource: TMGFigure 160: Talaat Mostafa company structureTMG HoldingCompanyDirect & Indirectholding 100%98.6%100%99.9%Indirect holding<strong>of</strong> 81.31%Arab Co. forHotels & Tourism(ICON)Alexandria Co.for UrbanDevpt.5.81%100%Alexandria <strong>Real</strong><strong>Estate</strong>59.6% 8.53%100%San Stefano<strong>Real</strong> <strong>Estate</strong>100%Arab Co. forUrban Devpt. &ProjectsMay FairAl Rabwa I & IISan StefanoComplex100% 100% 100% 50%Al Rehab I Al Rehab II Madinaty Saudi J/V56%Four SeasonsNile Plaza100%Four SeasonsSharm ElSheikh100%Nile Hotel84.7%%San StefanoGrand Plaza100%Marsa AlamSource: TMGPage 86<strong>Deutsche</strong> <strong>Bank</strong> AG/London
5 <strong>July</strong> <strong>2010</strong> <strong>Real</strong> <strong>Estate</strong>, Construction and Building Materials <strong>Egypt</strong> <strong>Real</strong> <strong>Estate</strong>Shareholding structureThe founding family holds 50% <strong>of</strong> the shares while the government <strong>of</strong> <strong>Egypt</strong>, through MisrInsurance, Banque Misr, National Insurance and Export Development <strong>Bank</strong>, indirectly holds acombined stake <strong>of</strong> 8%. Free float is 42% while there is no foreign ownership restriction.Figure 161: Shareholding structureFree Float42%TMG Investment50%GRE <strong>Egypt</strong>8%Source: Zawya, Bloomberg, <strong>Deutsche</strong> <strong>Bank</strong>Key managersTarek Talaat Mostafa – Chairman and Managing Director since September 2008. Prior tothat, he was the Chairman and Managing Director <strong>of</strong> Alexandria Construction Company, one<strong>of</strong> the largest contractors in the MENA Region. He is an elected member <strong>of</strong> the <strong>Egypt</strong>ianParliament and Chairs its Housing and Infrastructure Committee, is a member <strong>of</strong> the NationalDemocratic Party, the Board <strong>of</strong> the <strong>Egypt</strong>ian Construction Contractors Union, and theNational Union <strong>of</strong> the Chambers <strong>of</strong> Commerce, as well as being the founder <strong>of</strong> the YouthAssociation <strong>of</strong> Sidi Gaber. He received a Bachelor's degree in Civil Engineering fromAlexandria University in 1975.Hany Talaat Mostafa – Board Member – Director - He is also Chairman <strong>of</strong> AlexandriaAgricultural Company and other companies operating in the agricultural sector in which theTalaat Mostafa family has owned significant holdings since 2002. Prior to that time, he wasan engineer from 1978 to 1981, a Board Member from 1981 to 1982 and the ManagingDirector from 1982 to 2002 <strong>of</strong> Alexandria Agricultural Company. He is also a Member <strong>of</strong> theBoards <strong>of</strong> various companies operating in the real estate and construction sectors in whichthe Talaat Mostafa family has significant holdings. He received a Bachelor's degree in CivilEngineering from the University <strong>of</strong> Alexandria in 1978.Jihad M. Sawaftah – Vice President – Chief Financial Officer since October 2007. He isalso the Vice President, Financial Controller and Information Technology Head withresponsibilities for each <strong>of</strong> the operating companies since 2004. Before joining TMG,Sawaftah worked with HRH Prince Alwaleed Bin Talal Bin Abdulaziz Al Saud, and served,among other positions, as Group Financial Controller <strong>of</strong> Kingdom Hotel Investment Group andas CFO <strong>of</strong> Kingdom Planet Hollywood. He holds a B.Sc. in Finance, <strong>Bank</strong>ing and Accountingfrom Yarmouk University, Jordan.<strong>Deutsche</strong> <strong>Bank</strong> AG/London Page 87
5 <strong>July</strong> <strong>2010</strong> <strong>Real</strong> <strong>Estate</strong>, Construction and Building Materials <strong>Egypt</strong> <strong>Real</strong> <strong>Estate</strong><strong>Real</strong> <strong>Estate</strong> PortfolioKey development projectsTMG has the largest landbank among <strong>Egypt</strong>ian developers under coverage. In <strong>Egypt</strong>, all thelandbank is in Cairo. The Madinaty project accounts for 86% <strong>of</strong> the <strong>Egypt</strong>ian landbank.Figure 162: <strong>Egypt</strong>ian landbank by project – sqm, end2009Al Rehab II(Close to New Cairo)12%Al Rabwa(<strong>6th</strong> <strong>of</strong> October)2%Figure 163: Landbank by geography, end 2009Saudi Arabia7%Madinaty(Close to New cairo)86%<strong>Egypt</strong>93%Source: TMG, <strong>Deutsche</strong> <strong>Bank</strong>Source: TMG, <strong>Deutsche</strong> <strong>Bank</strong>High exposure to residential segment in <strong>Egypt</strong>BUA allocated for development is 27m sqm. The development plan extends till 2020 and ismostly in residential properties for sale (73%), comprising apartments and villas, but alsoinclude hotels (10%), commercial and other allied facilities. The residential BUA split between<strong>Egypt</strong> and Saudi Arabia is 97%/3%Figure 164: BUA by business segment – 2020EFigure 165: Residential BUA by project – 2020EInfrastructureUtilities17%Hotels10%Al Rehab II12%Al Rabwa II1%Nassamat AlRiyadh (KSA)3%DevelopmentProperties73%Madinaty84%Source: TMGSource: TMGPage 88<strong>Deutsche</strong> <strong>Bank</strong> AG/London
5 <strong>July</strong> <strong>2010</strong> <strong>Real</strong> <strong>Estate</strong>, Construction and Building Materials <strong>Egypt</strong> <strong>Real</strong> <strong>Estate</strong>Between <strong>2010</strong>E-20E, we estimate TMG will deliver four large scale projects, namelyMadinaty, Al Rehab II, Al Rabwa II and Nassmat Al Riyadh (Saudi Arabia) with a total BUA <strong>of</strong>20m sqm.Figure 166: TMG project detailsMadinaty Al Rehab Al Rabwa RiyadhTotal Land Area (sqm) 33,600,000 9,900,400 2,137,828 4,000,000To be developed land area 33,600,000 4,684,225 819,028 (Rabwa II) 4,000,000BUA (sqm) 20,580,644 2,839,834 118,320 1,609,575Location New Cairo New Cairo Sixth <strong>of</strong> October City RiyadhCommence 2006 Nov 1996/<strong>July</strong> 2006 2006 <strong>2010</strong>Completion 2020 2011/2017 2012 2013Apartments (units) 105,831 13,260 - 2,050Villas (units) 6,292 1,800 340 2,265Source: <strong>Deutsche</strong> <strong>Bank</strong>MadinatyLocated adjacent to New Cairo, 35 km east <strong>of</strong> Cairo, Madinaty is the largest and the mostimportant integrated residential community development project for TMG and is replete witheducation, leisure, business and retail facilities. It is spread over 33.6m sqm with a plannedresidential BUA <strong>of</strong> 16.8m sqm (consisting <strong>of</strong> 106,000 apartments and 6,000 villas) and a totalBUA <strong>of</strong> 20.8m sqm. Construction will take place over six overlapping phases each 3-4 yearslong. The project started in 2006; first deliveries started in April <strong>2010</strong> and will be complete by2020. The project has been well received by prospective buyers with 29% <strong>of</strong> the BUA (to bedelivered to 2020) already sold out.Al Rehab IIFollowing the success <strong>of</strong> Al Rehab I, which was the first integrated city and communitycomplex to be constructed in <strong>Egypt</strong>, TMG launched an extension to the project named AlRehab II. Located adjacent to New Cairo and 27 km East <strong>of</strong> Cairo, Al Rehab II is spread over aland area <strong>of</strong> 3.7m sqm and a BUA <strong>of</strong> 2.6m sqm consisting <strong>of</strong> 13,000 apartments and 1,800villas along with leisure, retail, commercial and other associated infrastructure. The projectwill be completed in 2017 in four phases. The project is successful with 43% <strong>of</strong> the BUA (tobe delivered till 2017) already sold out.Al Rabwa IISimilar to Al Rehab, Al Rabwa II is an extension <strong>of</strong> the existing Al Rabwa I. Located in 6 th <strong>of</strong>October City, it is a high end residential complex comprising 340 villas spanning over 800,000sqm. Construction is expected to take place in four phases with each phase consisting <strong>of</strong> 86villas. To date 59% <strong>of</strong> the BUA has been sold.<strong>Deutsche</strong> <strong>Bank</strong> AG/London Page 89
5 <strong>July</strong> <strong>2010</strong> <strong>Real</strong> <strong>Estate</strong>, Construction and Building Materials <strong>Egypt</strong> <strong>Real</strong> <strong>Estate</strong>Figure 167: TMG development locationsSource: TMGNassmat Al Riyadh (Saudi Arabia)This is TMG’s first venture (Areez Limited, 50/50 JV with Al Oula <strong>Real</strong> <strong>Estate</strong> DevelopmentCompany) outside <strong>Egypt</strong>. It is an integrated residential complex comprising 2,265 villas and2,050 apartments spanning over 4m sqm. Construction is expected to start in <strong>2010</strong> (notstarted yet) and finish in 2012. In May <strong>2010</strong>, TMG obtained the approval <strong>of</strong> the SaudiAuthorities to sell <strong>of</strong>f-plan real estate units in the project.Hospitality portfolioCurrently TMG has three operational 5-star hotels managed by the Four Seasons brand inCairo, Sharm El Sheikh and Alexandria, comprising 684 rooms.• Four Seasons Sharm El Sheikh (located on the Red Sea) is the first hotel <strong>of</strong> TMG andhas 200 rooms. It is a mature property with 2009 ARR (average room rate) <strong>of</strong> $437,Revpar <strong>of</strong> $262, occupancy <strong>of</strong> 60% and a gross margin <strong>of</strong> 42%. It is 81% owned byTMG.• Four Seasons Nile Plaza Cairo (located on river Nile) is TMG’s most pr<strong>of</strong>itable hotel andconsists <strong>of</strong> 366 rooms. Like Sharm El Sheikh, it is also a mature property with 2009 ARR<strong>of</strong> $366, Revpar <strong>of</strong> $205, occupancy <strong>of</strong> 56% and a gross margin <strong>of</strong> 49%. It is 46%owned by TMG.• Four Seasons San Stefano – Alexandria is the latest hotel <strong>of</strong> TMG and is yet to rampup fully. It has 127 guest rooms. In 2009 it had an ARR <strong>of</strong> $273, Revpar <strong>of</strong> $139,occupancy <strong>of</strong> 51% and gross margin <strong>of</strong> 10%. It is 68.4% owned by TMG.• Nile Kempinski Hotel Cairo is a 191 room 5-star hotel in Cairo and is expected to openin <strong>2010</strong>. Similar to Nile Plaza Cairo, we expect an ARR <strong>of</strong> $384 and occupancy <strong>of</strong> 65% atfull ramp-up in 2012.Page 90<strong>Deutsche</strong> <strong>Bank</strong> AG/London
5 <strong>July</strong> <strong>2010</strong> <strong>Real</strong> <strong>Estate</strong>, Construction and Building Materials <strong>Egypt</strong> <strong>Real</strong> <strong>Estate</strong>Figure 168: Hotel portfolio (684 rooms) - 2009 Figure 169: Hotels - Revenue contribution - 2009San StefanoAlexandria17%Sharm El Sheikh29%San StefanoAlexandria13%Sharm El Sheikh33%Nile Plaza Cairo54%Nile Plaza Cairo54%Source: TMGSource: TMGFigure 170: Revpar - USDFigure 171: Hotels - Gross pr<strong>of</strong>it margin35030025020015060%50%40%30%20%10010%5002007 2008 2009 Q1 <strong>2010</strong>0%-10%-20%2007 2008 2009 Q1 <strong>2010</strong>Sharm El Sheikh Nile Plaza Cairo San Stefano AlexandriaSharm El Sheikh Nile Plaza Cairo San Stefano AlexandriaSource: TMGSource: TMG<strong>Deutsche</strong> <strong>Bank</strong> AG/London Page 91
5 <strong>July</strong> <strong>2010</strong> <strong>Real</strong> <strong>Estate</strong>, Construction and Building Materials <strong>Egypt</strong> <strong>Real</strong> <strong>Estate</strong>Strategy and outlookTargeting the right customer segment<strong>Egypt</strong> has been a beneficiary <strong>of</strong> rapid economic growth and increasing income levels amongthe population. The expansion <strong>of</strong> the middle class and the urbanization has lead to theemergence <strong>of</strong> satellite cities adjacent to Cairo. This has also been driven by homebuyers’appetite for higher living standards and the comparatively lower population density <strong>of</strong> Cairo’ssuburbs. TMG has been one <strong>of</strong> the pioneers to capitalize on pent-up demand for residentialhousing on the outskirts. The company launched successful projects targeting the mid andmid-upper income segments where the potential growth is the highest, in our view. Ouranalysis suggests that Cairo’s residential market will witness a widening shortfall from264,000 units (5% <strong>of</strong> demand) in 2009 to 730,000 (11%) by 2014 <strong>of</strong> which around c.35%stems from the mid to mid-upper income segment where our developers under coverageoperate.Strong execution track recordCompared to many <strong>of</strong> its local/regional peers, TMG has a longer execution track record <strong>of</strong>20+ years. This has earned it a strong brand name which has become synonymous withquality and reliability. To date, the company has delivered more than 57,000 units anddeveloped 9m sqm <strong>of</strong> BUA which places it higher up the learning curve compared to itscompetition. The lifeline <strong>of</strong> TMG’s property development model is <strong>of</strong>f plan sales which weview as a concept investment where buyers essentially invest in the brand name <strong>of</strong> thedeveloper and trust it with their hard-earned savings.An investor in any <strong>of</strong> TMG’s projects has historically generated handsome returns. Webelieve this has contributed immensely to the brand’s strength and has enabled the companyto be ahead <strong>of</strong> the competition along the value chain. This applies to pre-selling the units andsecuring financing for customers, dealing with contractors, obtaining attractive landpayments terms including in-kind. Even after the delivery <strong>of</strong> units, to control quality <strong>of</strong> theprojects, TMG manages the facilities on a cost neutral-basis. This serves two purposes: forcustomers, it helps to maintain the resale value <strong>of</strong> units; for TMG, it creates a strong platformfor new launch phases and price increases.Successful integrated township development conceptThe strategy <strong>of</strong> TMG is to develop integrated communities consisting <strong>of</strong> villas/apartments <strong>of</strong>different sizes targeting a mix <strong>of</strong> clientele in its target segment. The communities include allprimary and secondary facilities and services such as education, healthcare, commercialrecreational and maintenance facilities. The positive aspect <strong>of</strong> this strategy is that if theproject is successful in the initial stages, it creates a halo effect and there is a greater chancethat the project will be successful it its entirety. With every successful phase, the value <strong>of</strong> thesurrounding land increases, creating a fertile environment for price increases. This isparticularly true for TMG, which has only four major development projects that would bring inrevenues for the next 5-10 years. This reduces the need to launch new projects and repeatthe process <strong>of</strong> opportunistic landbank acquisition, development and sales. Instead, it givesmanagement enough time to strategize and look for opportunities to export the modelelsewhere. Further, once a project is complete, opportunities are created to launch costeffective (shared infrastructure, marketing and sales) extensions to the existing projects. Thishappened with the launch <strong>of</strong> extensions to Al Rehab and Al Rabwa after the parent projectswere highly successful.Page 92<strong>Deutsche</strong> <strong>Bank</strong> AG/London
5 <strong>July</strong> <strong>2010</strong> <strong>Real</strong> <strong>Estate</strong>, Construction and Building Materials <strong>Egypt</strong> <strong>Real</strong> <strong>Estate</strong>The flip side <strong>of</strong> the strategy is that if the project is not successful in the initial stages, thesheer size could create a significant liability on the company’s books. However, going byTMG’s track record and favorable landbank acquisition terms, we have more reasons tobelieve otherwise.Backlog provides visibility for next 3+ yearsEGP24bn backlog provides visibility while presales back on track in Q1 <strong>2010</strong>TMG’s positioning has lead to a healthy sales backlog <strong>of</strong> EGP24bn as <strong>of</strong> Q110, providingearnings visibility for the next 3+ years, albeit the sales backlog has declined from a peak <strong>of</strong>EGP30bn in 2Q08. In 1H09, in line with its regional peers, presales were muted as customersadopted a “wait and see” attitude to prices. However cancellations were limited to
5 <strong>July</strong> <strong>2010</strong> <strong>Real</strong> <strong>Estate</strong>, Construction and Building Materials <strong>Egypt</strong> <strong>Real</strong> <strong>Estate</strong>Legal risks aside, cancellation risks not material as customers are in net equity territoryLegal risks aside, we are not concerned about the threat <strong>of</strong> cancellations as prices in TMGprojects have held up well, as a result <strong>of</strong> which the customers are still in net equity territory.Moreover, since most sales in the current backlog happened before 2009, we estimate thataround 33% <strong>of</strong> cash has been already collected by end 2009, thus reducing the risk <strong>of</strong>default. Additionally, since a critical mass <strong>of</strong> projects has already been sold and the currentprojects have gained traction, we believe any cancellations could be replaced by new sales.Figure 176: Villa prices - Price psqm - EGPFigure 177: Apartment* prices - Price psqm - EGP14,0006,00013,00012,0005,50011,0005,00010,0009,0004,5008,0007,0006,0004,0003,5005,0002007 2008 2009 <strong>2010</strong>3,0002007 2008 2009 <strong>2010</strong>MadinatyRehabMadinatyRehabSource: TMGSource: TMG, * Finished apartmentsOff-plan model and flexible construction lower risk pr<strong>of</strong>ileSell first and don’t start construction unless significant portion <strong>of</strong> units is soldTMG doesn’t start construction unless a significant portion <strong>of</strong> the units is sold for a particularphase <strong>of</strong> construction. Further, payment plans are designed in a way that coincides withconstruction milestones and reduce the funding gap to a minimum. We like this strategy as ithas two primary benefits; 1/ reduces reliance on external debt financing that would lead to alighter balance sheet and 2/ reduces the risk <strong>of</strong> carrying unsold inventory on delivery.Figure 178: Cash collected in current backlogFigure 179: % <strong>of</strong> sold residential BUA45%40%35%30%25%20%15%10%5%0%41%34%32%33%Madinaty Al Rehab II Al Rabwa II All Projects90%80%70%60%50%40%30%20%10%0%78%65%63%60%Madinaty Al Rehab II Al Rabwa II All ProjectsBUA Sold/ BUA delivered (till 2014) RatioSource: TMG, <strong>Deutsche</strong> <strong>Bank</strong>Source: TMG, <strong>Deutsche</strong> <strong>Bank</strong>Flexible construction model prevents a substantial portion <strong>of</strong> capital being locked upTMG’s strategy is to adopt a flexible construction model and build in phases. Although scaleadvantages could be somewhat lower in such a model, in the current market conditions, weview this as positive as it prevents the company from building an entire infrastructure in onego and locking up a substantial portion <strong>of</strong> capital. Further, it allows TMG to respond to actualdemand and avoid carrying an inventory <strong>of</strong> unsold units in case <strong>of</strong> a slowdown. Additionally, itPage 94<strong>Deutsche</strong> <strong>Bank</strong> AG/London
5 <strong>July</strong> <strong>2010</strong> <strong>Real</strong> <strong>Estate</strong>, Construction and Building Materials <strong>Egypt</strong> <strong>Real</strong> <strong>Estate</strong>creates flexibility to adapt construction <strong>of</strong> each phase to demand changes (size, design, andstyle) from changing consumer preferences.Figure 180: Madinaty phase capexFigure 181: Al Rehab phase capex25,0005,0004,50020,0004,0003,50015,0003,0002,50010,0002,0001,5005,0001,00050002006 2007 2008 2009 <strong>2010</strong>E 2011E 2012E 2013E 2014E02006 2007 2008 2009 <strong>2010</strong>E 2011E 2012E 2013E 2014E 2015EPh 1 Capex Ph 2 Capex Ph 3 CapexPh 6 Capex Ph 7 Capex Ph 8 Capex Ph 9 CapexSource: <strong>Deutsche</strong> <strong>Bank</strong>Source: <strong>Deutsche</strong> <strong>Bank</strong>In-kind payment for land leads to right alignment <strong>of</strong> cash flows7% <strong>of</strong> Madinaty and 12% <strong>of</strong> Al Rehab II BUA to be paid to government as land costHistorically, TMG has acquired land from the government at preferential terms throughbilateral negotiation. TMG acquired 33.6m sqm <strong>of</strong> land for Madinaty and 4m sqm <strong>of</strong> land in AlRehab II from the government, payment for which is to be made in kind. 7% <strong>of</strong> the BUA(total 2.3m sqm assuming all BUA is residential) after each completed phase <strong>of</strong> Madinaty and12% <strong>of</strong> the BUA (total 312k <strong>of</strong> BUA) after each completed phase in Al Rehab II will have to begiven to the government as the cost <strong>of</strong> land purchase. This arrangement is particularly uniqueas it doesn’t require any upfront capital outlay compared to peers.As described below, we estimate that under the terms <strong>of</strong> the agreement, the implicit cost <strong>of</strong>TMG land is c.45% cheaper than the auction price.Figure 182: Land acquisition economicsMadinatyAl Rehab IICompleted residential BUA to be given to government (sqm) 2,700,000 312,000Residential selling price (BUA/sqm/EGP) 5,000 5,000Implied Land Cost (EGPm) 13,500 1,560Land acquired (sqm) 33,600,000 3,700,000Implied price/sqm (EGP) 402 422Auction Price 750 750Discount -46% -44%Source: <strong>Deutsche</strong> <strong>Bank</strong>Structured home financing has increased affordability for TMGcustomersThe <strong>Egypt</strong>ian mortgage market is untapped with banks not allowed to provide loans on presold units. Normally, a lack <strong>of</strong> mortgage availability should have made TMG’s projectsunaffordable to a large section <strong>of</strong> TMG’s customers who belong to the mid to mid-upperincome category (annual income <strong>of</strong> EGP80,000-EGP150,000) and are young (some just fiveyears into their working life) and thus unlikely to have enough savings to buy a propertyentirely in cash.<strong>Deutsche</strong> <strong>Bank</strong> AG/London Page 95
5 <strong>July</strong> <strong>2010</strong> <strong>Real</strong> <strong>Estate</strong>, Construction and Building Materials <strong>Egypt</strong> <strong>Real</strong> <strong>Estate</strong>In order to address the issue <strong>of</strong> affordability, TMG has developed innovative financingtechniques that essentially are securitized transactions and work like a mortgage. Accordingto this arrangement, after collecting a 10%-20% down payment in the form <strong>of</strong> cash, TMGallows customers to pay the balance over a 4-17 year period (cost <strong>of</strong> financing 13-14% p.a)and collects post-dated cheques. On delivery <strong>of</strong> a unit, TMG presents the post-datedcheques pertaining to the unit to the bank and receives a cash equivalent to the NPV <strong>of</strong> thecheques. Post delivery, the relationship becomes a bank/customer relationship with norecourse to the company, thus not exposing TMG to any default risk. Over time, with thesuccess <strong>of</strong> its projects, TMG has been able to increase the duration <strong>of</strong> the credit period; theAl Rehab project started with 4-8 years <strong>of</strong> credit period while the current Madinaty project<strong>of</strong>fers financing up to 17 years. TMG’s financing schemes have gained traction withcustomers, with 87% <strong>of</strong> Madinaty pre-sales being financed by these mortgage-liketransactions.Figure 183: Madinaty cumulative mix <strong>of</strong> paymentsFigure 184: Al Rehab cumulative mix <strong>of</strong> payments17 years21%Cash13%6 years4%10 years11%15 years17%8 years18%12 years1%10 years26%4-8 years89%Source: TMGSource: TMGWe tried to work out an exercise on affordability with a structured financing plan. We assumea unit price <strong>of</strong> EGP534k, construction cycle <strong>of</strong> four years. We assume a current householdsalary <strong>of</strong> EGP100k (having grown 10% every year for the last five years). Assuming a savingsrate <strong>of</strong> 20%, we calculate accumulated savings <strong>of</strong> EGP97k. This is utilized in paying the downpayment. According to our analysis, annual cash outflow is mostly within the 50% threshold,over which we consider as unaffordable.Figure 185: Affordability backed by structured financing schemeEGP Yr 1 Yr 2 Yr 3 Yr 4 Yr 5 Yr 6 Yr 7 Yr 8 Yr 9 Yr 10BUA (sqm) 90 90 90 90 90 90 90 90 90 90Price/sqm <strong>of</strong> BUA 5,938 5,938 5,938 5,938 5,938 5,938 5,938 5,938 5,938 5,938Unit Price (EGP) 534,375 534,375 534,375 534,375 534,375 534,375 534,375 534,375 534,375 534,375Annual Payments 15% 10% 10% 10% 10% 9% 9% 9% 9% 9%Annual cash outflow 80,156 53,438 53,438 53,438 53,438 48,094 48,094 48,094 48,094 48,094Annual household income 100,000 110,000 121,000 133,100 146,410 159,587 172,354 184,419 195,484 205,258Wage Inflation 10% 10% 10% 10% 10% 9% 8% 7% 6% 5%Accumulated savings 97,310Cash Outflow/Income 41% 49% 44% 40% 36% 30% 28% 26% 25% 23%Threshold cash outflow/income 50% 50% 50% 50% 50% 50% 50% 50% 50% 50%Conclusion: Affordable? Yes Yes Yes Yes Yes Yes Yes Yes Yes YesSource: <strong>Deutsche</strong> <strong>Bank</strong> estimatesPage 96<strong>Deutsche</strong> <strong>Bank</strong> AG/London
5 <strong>July</strong> <strong>2010</strong> <strong>Real</strong> <strong>Estate</strong>, Construction and Building Materials <strong>Egypt</strong> <strong>Real</strong> <strong>Estate</strong>Off-plan sales approval in Saudi: TMG first beneficiaryIn Riyadh, TMG plans to build an integrated residential community modeled on Al Rehab in<strong>Egypt</strong>. The company has formed a 50/50 JV with Al Oula <strong>Real</strong> <strong>Estate</strong> Development Companyand has acquired 3.1m sqm <strong>of</strong> land in Riyadh. Early May <strong>2010</strong>, TMG announced that it hadobtained the approval <strong>of</strong> the Saudi Authorities to sell <strong>of</strong>f-plan real estate units in its projectNassamat AlRiyadh. Construction is expected to start in <strong>2010</strong> (not started yet) and finish in2013.Figure 186: Nassamat Al Riyadh project detailsLand Size (m sqm) 3.1Land acquisition priceSAR105/sqmResidential BUA (m sqm) 1.4Sales Launch/Completion <strong>2010</strong>/2013Apartments - Land Size/Units/Avg. Size422k Sqm/2112/200 sqmVillas - Land Size/Units/Avg. Size1,914k sqm/ 2033/355 sqmSource: TMGWe view this move positively as the Saudi market <strong>of</strong>fers attractive prospects. Our analysissuggests that Saudi Arabia will require 1.2m units by 2015 against a supply <strong>of</strong> 0.9m units,implying a shortfall <strong>of</strong> 25% (0.3m units). The key issue for Saudi Arabia remains the approval<strong>of</strong> the long awaited mortgage law, which should increase mortgage financing supply andhence affordability. TMG addressed this issue with a financing agreement on NassamatAlRiyadh, with Riyadh <strong>Bank</strong> providing customer loans for 25 years.At this stage, we cautiously value the project at book value (EGP0.2/share). At full potential,the project could generate EGP0.3/share <strong>of</strong> upside (see calculation below). We could revisitour estimates once <strong>of</strong>f-plan sales approval is received and we see strong momentum.Figure 187: Nassamat Al Riyadh ValuationCumulative Sales Value (SARbn) 4.9Net pr<strong>of</strong>it margin 25%Cumulative net pr<strong>of</strong>it (SARbn) 1.2Net Present Value (SARbn) 0.7Net Present Value (EGPbn) 1.0NPV/Share (EGP) 0.5Already assumed in Book Value/share (EGP) 0.2Incremental Value addition/share (EGP) 0.3Source: <strong>Deutsche</strong> <strong>Bank</strong>TMG has also finalized a 3.8m sqm land plot in Jeddah that has legal issues relating to landrights. However, no cash has been paid to date and therefore it has no effect on ourvaluation.Number <strong>of</strong> hotel rooms to increase 3.8x by 2014We like TMG’s strategy <strong>of</strong> increasing the contribution from recurring income as this wouldlead to a more stable earnings pr<strong>of</strong>ile. Further, this keeps TMG well ahead <strong>of</strong> its developerpeers who are starting to diversify to include more recurring income in the revenue mix. Asmentioned before, the company intends to achieve its objective by building more hotels anddeveloping commercial/retail portfolio. Currently, TMG has 684 operational 5-star hotel roomsacross three hotels that have ramped up well and are in the best business and touristlocations. By 2014, TMG plans to invest EGP4bn and increase the number <strong>of</strong> hotel rooms to2,600 (3.8x from today). We estimate this would lead to hotel revenues increasing at 24%<strong>Deutsche</strong> <strong>Bank</strong> AG/London Page 97
5 <strong>July</strong> <strong>2010</strong> <strong>Real</strong> <strong>Estate</strong>, Construction and Building Materials <strong>Egypt</strong> <strong>Real</strong> <strong>Estate</strong>CAGR between 2009-2014E. In the longer term, the company has plans to increase thenumber <strong>of</strong> hotel rooms to 5,000.Figure 188: Hotel portfolio (number <strong>of</strong> rooms)Figure 189: Hotel revenues (EGPm)300025002000150010005001,8001,6001,4001,2001,00080002001 2004 2007 <strong>2010</strong> 2012 2013 2014Sharm El Sheikh Nile Plaza San StefanoNile Hotel Sharm El Sheikh - Ext. LuxorMarsa Alam TMG Building Hotel Madinaty6004002009 <strong>2010</strong>E 2011E 2012E 2013E 2014ESource: TMGSource: <strong>Deutsche</strong> <strong>Bank</strong>, TMGOff-Plan sales <strong>of</strong> residential units attached to hotels part finance the constructionThe hotel and resorts business <strong>of</strong> TMG is capital consumptive with no return during theconstruction period. They are typically funded with a debt/equity mix <strong>of</strong> 70/30. In order topartially solve the issue <strong>of</strong> huge upfront capex requirements for large scale hotel projects,TMG <strong>of</strong>fers equity participation in the form <strong>of</strong> residential units within the hotel portfolio. Theresidential units are sold under an <strong>of</strong>f-plan model (similar to property development model –single bullet payment upfront) to prospective buyers and cash collection from residential unitsales helps to partly finance hotel construction. Once the project is constructed, buyers havethe option to lease out their units under a rental program where TMG maintains the propertyand receives 50% share <strong>of</strong> the revenue. Overall, TMG objective is to maintain an IRR <strong>of</strong> 18%on hotel properties.Page 98<strong>Deutsche</strong> <strong>Bank</strong> AG/London
5 <strong>July</strong> <strong>2010</strong> <strong>Real</strong> <strong>Estate</strong>, Construction and Building Materials <strong>Egypt</strong> <strong>Real</strong> <strong>Estate</strong>Figure 190: Progress on planned hotel propertiesName <strong>of</strong> hotelNo. <strong>of</strong>No. <strong>of</strong>rooms residential unitsCompletionInvestmentcost (EGPm)Current StageNile Hotel 191 <strong>2010</strong> 600 To be opened in <strong>2010</strong>Four Seasons Sharm Ext. 96 114 2012 692 Land purchased, design finished, licenses issuedMarsa Alam Ph 1 500 500 2013 865 Land purchased, design finished, licenses issuedFour Seasons Luxor 201 - 2013 738 Signed concession agreement, design finished, licenses issuedFour Seasons Madinaty 240 100 2014 733 Finished designTMG Building 200 - 2014 765 Land purchased, design finished and licenses issuedTotal 1,428 714 4,393Source: TMG<strong>Deutsche</strong> <strong>Bank</strong> AG/London Page 99
5 <strong>July</strong> <strong>2010</strong> <strong>Real</strong> <strong>Estate</strong>, Construction and Building Materials <strong>Egypt</strong> <strong>Real</strong> <strong>Estate</strong>FinancialsQ1 <strong>2010</strong> results reviewTMG follows a completed contract method <strong>of</strong> revenue recognition. 1Q10 revenues wereEGP1.6bn (+3.8% yoy, +244% qoq) driven by unit deliveries after a low number <strong>of</strong> deliveriesduring 4Q09 in the Rehab project. Hotels saw a 10.6% yoy increase in revenues to EGP145mand 6.6% drop against 4Q09. Gross pr<strong>of</strong>it reached EGP463m (-1.3 yoy, +129% qoq). Grosspr<strong>of</strong>it margin was 28.8% against 30.3% in 1Q09 following lower margins in units deliveriesand hotels. Net pr<strong>of</strong>it was EGP324m (+3.2% yoy, +94% qoq). Finally, as mentioned earlier,TMG recorded EGP1.2bn new sales <strong>of</strong> real estate units in 1Q10 compared to EGP436m inQ109 (+172%).Figure 191: Q1 resultsEGPm 1Q10 1Q09 YoY change 4Q 09 QoQ changeRevenues 1,607 1,548 3.8% 467 243.7%Gross pr<strong>of</strong>it 463 469 -1.3% 202 128.7%as <strong>of</strong> % sales 28.8% 30.3% 43.3%Pr<strong>of</strong>it after tax from continued operations 345 342 1.0% 215 60.6%Minority interest (21) (28) (47)Attributable net income 324 314 3.2% 167 93.6%Source: TMGIncome statementFigure 192: Income statementEGPm 2009 <strong>2010</strong>E 2011E 2012ERevenues 4,822 5,271 7,539 11,499% growth -11.0% 9.3% 43.0% 52.5%COGS (3,336) (3,259) (4,713) (7,170)as <strong>of</strong> % sales -69.2% -61.8% -62.5% -62.3%Gross pr<strong>of</strong>it 1,486 2,012 2,826 4,329as <strong>of</strong> % sales 30.8% 38.2% 37.5% 37.7%% growth -18.9% 35.3% 40.5% 53.2%SG&A (233) (254) (364) (555)Others 7EBITDA 1,261 1,757 2,463 3,774as <strong>of</strong> % sales 26.1% 33.3% 32.7% 32.8%% growth -27.6% 39.4% 40.1% 53.3%EBIT 1,160 1,646 2,304 3,533as <strong>of</strong> % sales 24.0% 31.2% 30.6% 30.7%% growth -29.7% 42.0% 39.9% 53.3%Net interest income/(expense) 72 30 74 202Others 81 33 33 33Income Tax (113) (342) (482) (754)Minority interest (93) (106) (150) (234)Attributable net income 1,106 1,261 1,779 2,780% growth -23.3% 14.0% 41.1% 56.2%as <strong>of</strong> % sales 22.9% 23.9% 23.6% 24.2%Source: <strong>Deutsche</strong> <strong>Bank</strong>, TMGPage 100<strong>Deutsche</strong> <strong>Bank</strong> AG/London
5 <strong>July</strong> <strong>2010</strong> <strong>Real</strong> <strong>Estate</strong>, Construction and Building Materials <strong>Egypt</strong> <strong>Real</strong> <strong>Estate</strong>Cash flow statementFigure 193: Cash flow statementEGPm 2009 <strong>2010</strong>E 2011E 2012ECash flow from operations 1,241 1,445 2,054 3,223(Incr)/decr in working capital (1,474) (18) 896 438Purchase <strong>of</strong> PPE and projects under construction (225) (100) (100) (100)Projects under construction (723) (1,057) (1,064)Outstanding land liability (146) (31) (15)Total capex (225) (969) (1,188) (1,179)Operating free cash-flow (458) 458 1,763 2,482Gain from sale <strong>of</strong> fixed assets 2 - - -Purchase <strong>of</strong> available for sale investments 7 - - -Increase in investment debtors 15 - - -FCF after investing activities (435) 458 1,763 2,482Changes in G/W due to changes in minority interest (217)Reconciliation on retained earnings 49Cash proceeds from loans and facilities (ST) (56) (752)Cash proceeds from loans and facilities (LT) 200 (620) (620)Net foreign exchange difference 4 - - -Increase in minority shareholders (310) - - -Net cash flow (964) (94) 1,142 1,862Source: <strong>Deutsche</strong> <strong>Bank</strong>, TMG<strong>Deutsche</strong> <strong>Bank</strong> AG/London Page 101
5 <strong>July</strong> <strong>2010</strong> <strong>Real</strong> <strong>Estate</strong>, Construction and Building Materials <strong>Egypt</strong> <strong>Real</strong> <strong>Estate</strong>Balance sheetFigure 194: Balance SheetEGPm 2009 <strong>2010</strong>E 2011E 2012EAssetsProperty, plant and equipment 3,729 4,588 5,617 6,555Projects under construction 582 582 582 582Goodwill 15,135 15,135 15,135 15,135Available for sale investments 51 52 53 54Investment in associates 2 3 3 4Bond held to maturity 336 336 336 336Total Non Current Assets 19,835 20,695 21,726 22,665Current AssetsWork in progress 11,718 16,678 20,764 25,392Inventory (Net) 29 29 29 29Accounts and Notes Receivables 17,061 17,061 17,061 17,061Prepayment and Other Debit Balances 3,073 3,073 3,073 3,073Available for Sale Investments 8 8 8 8Investment debtors 1,305 1,305 1,305 1,305Financial assets at fair value (Trading investments) 461 493 525 557Cash and cash equivalent 399 304 1,447 3,309Total Current Assets 34,053 38,950 44,211 50,733Total Assets 53,889 59,646 65,937 73,398Liabilities and equityCurrent LiabilitiesProvisions 1 1 1 1<strong>Bank</strong> overdraft 49 49 49 49Creditors and notes payable 604 5,545 10,527 15,594Current portion <strong>of</strong> loans and facilities 752 - - -Current portion <strong>of</strong> long term liabilities 65 65 65 65Customers downpayments / advance payment 20,447 20,447 20,447 20,447Other credit balances 1,704 1,704 1,704 1,704Total current liabilities 23,621 27,811 32,793 37,859Loans and facilities 1,240 1,440 820 200-Long term liabilities 4,178 4,178 4,178 4,178Deferred Tax Liability 21 21 21 21Total non current liabilities 5,439 5,639 5,018 4,398Total liabilities 29,060 33,449 37,811 42,258EquityIssued and paid up capital 20,302 20,302 20,302 20,302Legal reserves 163 163 163 163Net unrealized gains (losses) on available for sale (1) (1) (1) (1)General reserves 26 26 26 26Treasury stock (134) (134) (134) (134)Retained earnings 1,682 2,943 4,723 7,503Pr<strong>of</strong>it for the year 1,106 1,106 1,106 1,106Total equity for parent company shareholders 23,144 24,406 26,185 28,965Minority interest 1,685 1,791 1,941 2,175Total equity 24,829 26,197 28,126 31,140Total liabilities and equity 53,889 59,646 65,937 73,398Source: <strong>Deutsche</strong> <strong>Bank</strong>, TMGPage 102<strong>Deutsche</strong> <strong>Bank</strong> AG/London
5 <strong>July</strong> <strong>2010</strong> <strong>Real</strong> <strong>Estate</strong>, Construction and Building Materials <strong>Egypt</strong> <strong>Real</strong> <strong>Estate</strong>The author <strong>of</strong> this report wishes to acknowledge the contribution made by Dipanjan Ray andSandeep Srinivas, employees <strong>of</strong> Evalueserve DIFC, a third-party provider to <strong>Deutsche</strong> <strong>Bank</strong> <strong>of</strong>research support services.<strong>Deutsche</strong> <strong>Bank</strong> AG/London Page 103
5 <strong>July</strong> <strong>2010</strong> <strong>Real</strong> <strong>Estate</strong>, Construction and Building Materials <strong>Egypt</strong> <strong>Real</strong> <strong>Estate</strong>Appendix 1Important DisclosuresAdditional information available upon requestDisclosure checklistCompany Ticker Recent price* Disclosure<strong>SODIC</strong> OCDI.CA 79.92 (EGP) 5 Jul 10 NAPalm Hills Developments PHDC.CA 4.65 (EGP) 5 Jul 10 6TMG Holding TMGH.CA 6.86 (EGP) 5 Jul 10 NA*Prices are sourced from local exchanges via Reuters, Bloomberg and other vendors. Data is sourced from <strong>Deutsche</strong> <strong>Bank</strong> and subject companies.Important Disclosures Required by U.S. RegulatorsDisclosures marked with an asterisk may also be required by at least one jurisdiction in addition to the United States. See“Important Disclosures Required by Non-US Regulators” and Explanatory Notes.6. <strong>Deutsche</strong> <strong>Bank</strong> and/or its affiliate(s) owns one percent or more <strong>of</strong> any class <strong>of</strong> common equity securities <strong>of</strong> this companycalculated under computational methods required by US law.Important Disclosures Required by Non-U.S. RegulatorsPlease also refer to disclosures in the “Important Disclosures Required by US Regulators” and the Explanatory Notes.6. <strong>Deutsche</strong> <strong>Bank</strong> and/or its affiliate(s) owns one percent or more <strong>of</strong> any class <strong>of</strong> common equity securities <strong>of</strong> this companycalculated under computational methods required by US law.For disclosures pertaining to recommendations or estimates made on securities other than the primary subject <strong>of</strong> thisresearch, please see the most recently published company report or visit our global disclosure look-up page on ourwebsite at http://gm.db.com/ger/disclosure/DisclosureDirectory.eqsr.Analyst CertificationThe views expressed in this report accurately reflect the personal views <strong>of</strong> the undersigned lead analyst about the subjectissuers and the securities <strong>of</strong> those issuers. In addition, the undersigned lead analyst has not and will not receive anycompensation for providing a specific recommendation or view in this report. Athmane BenzerrougPage 104<strong>Deutsche</strong> <strong>Bank</strong> AG/London
5 <strong>July</strong> <strong>2010</strong> <strong>Real</strong> <strong>Estate</strong>, Construction and Building Materials <strong>Egypt</strong> <strong>Real</strong> <strong>Estate</strong>Historical recommendations and target price: <strong>SODIC</strong> (OCDI.CA)(as <strong>of</strong> 5/07/<strong>2010</strong>)160.00Previous RecommendationsSecurity Price140.00120.00100.0080.0060.0040.0020.001Strong BuyBuyMarket PerformUnderperformNot RatedSuspended RatingCurrent RecommendationsBuyHoldSellNot RatedSuspended Rating*New Recommendation Structureas <strong>of</strong> September 9, 20020.00Jul 08 Oct 08 Jan 09 Apr 09 Jul 09 Oct 09 Jan 10 Apr 10Date1. 5/7/<strong>2010</strong>: Buy, Target Price Change EGP112.00Historical recommendations and target price: Palm Hills Developments (PHDC.CA)(as <strong>of</strong> 5/07/<strong>2010</strong>)25.00Previous RecommendationsSecurity Price20.0015.0010.005.001Strong BuyBuyMarket PerformUnderperformNot RatedSuspended RatingCurrent RecommendationsBuyHoldSellNot RatedSuspended Rating*New Recommendation Structureas <strong>of</strong> September 9, 20020.00May 08 Aug 08 Nov 08 Feb 09 May 09 Aug 09 Nov 09 Feb 10 May 10Date1. 5/7/<strong>2010</strong>: Hold, Target Price Change EGP5.90<strong>Deutsche</strong> <strong>Bank</strong> AG/London Page 105
5 <strong>July</strong> <strong>2010</strong> <strong>Real</strong> <strong>Estate</strong>, Construction and Building Materials <strong>Egypt</strong> <strong>Real</strong> <strong>Estate</strong>Historical recommendations and target price: TMG Holding (TMGH.CA)(as <strong>of</strong> 5/07/<strong>2010</strong>)10.00Previous RecommendationsSecurity Price9.008.007.006.005.004.003.002.001Strong BuyBuyMarket PerformUnderperformNot RatedSuspended RatingCurrent RecommendationsBuyHoldSellNot RatedSuspended Rating*New Recommendation Structureas <strong>of</strong> September 9, 20021.000.00Jul 08 Oct 08 Jan 09 Apr 09 Jul 09 Oct 09 Jan 10 Apr 10Date1. 5/7/<strong>2010</strong>: Hold, Target Price Change EGP7.80Equity rating keyEquity rating dispersion and banking relationshipsBuy: Based on a current 12- month view <strong>of</strong> total shareholderreturn (TSR = percentage change in share pricefrom current price to projected target price plus projecteddividend yield ) , we recommend that investorsbuy the stock.Sell: Based on a current 12-month view <strong>of</strong> total shareholderreturn, we recommend that investors sell thestockHold: We take a neutral view on the stock 12-monthsout and, based on this time horizon, do not recommendeither a Buy or Sell.Notes:1. Newly issued research recommendations and targetprices always supersede previously published research.2. Ratings definitions prior to 27 January, 2007 were:Buy: Expected total return (including dividends) <strong>of</strong>10% or more over a 12-month periodHold: Expected total return (including dividends)between -10% and 10% over a 12-month periodSell: Expected total return (including dividends) <strong>of</strong> -10% or worse over a 12-month period500400300200100057%35%15%10%8%15%Buy Hold SellCompanies Covered Cos. w/ <strong>Bank</strong>ing RelationshipGlobal UniversePage 106<strong>Deutsche</strong> <strong>Bank</strong> AG/London
5 <strong>July</strong> <strong>2010</strong> <strong>Real</strong> <strong>Estate</strong>, Construction and Building Materials <strong>Egypt</strong> <strong>Real</strong> <strong>Estate</strong>Regulatory Disclosures1. Important Additional Conflict DisclosuresAside from within this report, important conflict disclosures can also be found at https://gm.db.com/equities under the"Disclosures Lookup" and "Legal" tabs. Investors are strongly encouraged to review this information before investing.2. Short-Term Trade Ideas<strong>Deutsche</strong> <strong>Bank</strong> equity research analysts sometimes have shorter-term trade ideas (known as SOLAR ideas) that are consistentor inconsistent with <strong>Deutsche</strong> <strong>Bank</strong>'s existing longer term ratings. These trade ideas can be found at the SOLAR link athttp://gm.db.com.3. Country-Specific DisclosuresAustralia: This research, and any access to it, is intended only for "wholesale clients" within the meaning <strong>of</strong> the AustralianCorporations Act.EU countries: Disclosures relating to our obligations under MiFiD can be found athttp://globalmarkets.db.com/riskdisclosures.Japan: Disclosures under the Financial Instruments and Exchange Law: Company name - <strong>Deutsche</strong> Securities Inc.Registration number - Registered as a financial instruments dealer by the Head <strong>of</strong> the Kanto Local Finance Bureau (Kinsho) No.117. Member <strong>of</strong> associations: JSDA, The Financial Futures Association <strong>of</strong> Japan. Commissions and risks involved in stocktransactions - for stock transactions, we charge stock commissions and consumption tax by multiplying the transactionamount by the commission rate agreed with each customer. Stock transactions can lead to losses as a result <strong>of</strong> share pricefluctuations and other factors. Transactions in foreign stocks can lead to additional losses stemming from foreign exchangefluctuations.New Zealand: This research is not intended for, and should not be given to, "members <strong>of</strong> the public" within the meaning <strong>of</strong>the New Zealand Securities Market Act 1988.Russia: This information, interpretation and opinions submitted herein are not in the context <strong>of</strong>, and do not constitute, anyappraisal or evaluation activity requiring a license in the Russian Federation.<strong>Deutsche</strong> <strong>Bank</strong> AG/London Page 107
<strong>Deutsche</strong> <strong>Bank</strong> AG/LondonMiddle East locations<strong>Deutsche</strong> <strong>Bank</strong> DubaiDubai International Financial CentreThe Gate, West Wing, Level 3P.O. Box 504 902Dubai CityTel: (971) 4 3611 700<strong>Deutsche</strong> <strong>Bank</strong> Saudi ArabiaAl Faisaliah Tower17th & 28th FloorOlaya, RiyadhSaudi ArabiaTel: (+966) 1 273 9700<strong>Deutsche</strong> <strong>Bank</strong> Israel46 Rothschild Boulevard21st Floor66883 Tel AvivTel: (+972) 3 710-2000<strong>Deutsche</strong> <strong>Bank</strong> TurkeyEski Buyukdere Cad. Tekfen TowerNo:209 Kat:17-18TR-34394 IstanbulTel: (+90) 212 317 01 00International locations<strong>Deutsche</strong> <strong>Bank</strong> Securities Inc.60 Wall StreetNew York, NY 10005United States <strong>of</strong> AmericaTel: (1) 212 250 2500<strong>Deutsche</strong> <strong>Bank</strong> AG London1 Great Winchester StreetLondon EC2N 2EQUnited KingdomTel: (44) 20 7545 8000<strong>Deutsche</strong> <strong>Bank</strong> AGGroße Gallusstraße 10-1460272 Frankfurt am MainGermanyTel: (49) 69 910 00<strong>Deutsche</strong> <strong>Bank</strong> AG<strong>Deutsche</strong> <strong>Bank</strong> PlaceLevel 16Corner <strong>of</strong> Hunter & Phillip StreetsSydney, NSW 2000AustraliaTel: (61) 2 8258 1234<strong>Deutsche</strong> <strong>Bank</strong> AGLevel 55Cheung Kong Center2 Queen's Road CentralHong KongTel: (852) 2203 8888<strong>Deutsche</strong> Securities Inc.2-11-1 NagatachoSanno Park TowerChiyoda-ku, Tokyo 100-6171JapanTel: (81) 3 5156 6701Global DisclaimerThe information and opinions in this report were prepared by <strong>Deutsche</strong> <strong>Bank</strong> AG or one <strong>of</strong> its affiliates (collectively "<strong>Deutsche</strong> <strong>Bank</strong>"). The information herein is believed to be reliable and has been obtained from public sourcesbelieved to be reliable. <strong>Deutsche</strong> <strong>Bank</strong> makes no representation as to the accuracy or completeness <strong>of</strong> such information.<strong>Deutsche</strong> <strong>Bank</strong> may engage in securities transactions, on a proprietary basis or otherwise, in a manner inconsistent with the view taken in this research report. In addition, others within <strong>Deutsche</strong> <strong>Bank</strong>, including strategists andsales staff, may take a view that is inconsistent with that taken in this research report.Opinions, estimates and projections in this report constitute the current judgement <strong>of</strong> the author as <strong>of</strong> the date <strong>of</strong> this report. They do not necessarily reflect the opinions <strong>of</strong> <strong>Deutsche</strong> <strong>Bank</strong> and are subject to change withoutnotice. <strong>Deutsche</strong> <strong>Bank</strong> has no obligation to update, modify or amend this report or to otherwise notify a recipient there<strong>of</strong> in the event that any opinion, forecast or estimate set forth herein, changes or subsequently becomesinaccurate. Prices and availability <strong>of</strong> financial instruments are subject to change without notice. This report is provided for informational purposes only. It is not an <strong>of</strong>fer or a solicitation <strong>of</strong> an <strong>of</strong>fer to buy or sell any financialinstruments or to participate in any particular trading strategy. Target prices are inherently imprecise and a product <strong>of</strong> the analyst judgement.As a result <strong>of</strong> <strong>Deutsche</strong> <strong>Bank</strong>’s recent acquisition <strong>of</strong> BHF-<strong>Bank</strong> AG, a security may be covered by more than one analyst within the <strong>Deutsche</strong> <strong>Bank</strong> group. Each <strong>of</strong> these analysts may use differing methodologies to value thesecurity; as a result, the recommendations may differ and the price targets and estimates <strong>of</strong> each may vary widely.<strong>Deutsche</strong> <strong>Bank</strong> has instituted a new policy whereby analysts may choose not to set or maintain a target price <strong>of</strong> certain issuers under coverage with a Hold rating. In particular, this will typically occur for "Hold" rated stockshaving a market cap smaller than most other companies in its sector or region. We believe that such policy will allow us to make best use <strong>of</strong> our resources. Please visit our website at http://gm.db.com to determine the targetprice <strong>of</strong> any stock.The financial instruments discussed in this report may not be suitable for all investors and investors must make their own informed investment decisions. Stock transactions can lead to losses as a result <strong>of</strong> price fluctuations andother factors. If a financial instrument is denominated in a currency other than an investor's currency, a change in exchange rates may adversely affect the investment. Past performance is not necessarily indicative <strong>of</strong> futureresults. <strong>Deutsche</strong> <strong>Bank</strong> may with respect to securities covered by this report, sell to or buy from customers on a principal basis, and consider this report in deciding to trade on a proprietary basis.Unless governing law provides otherwise, all transactions should be executed through the <strong>Deutsche</strong> <strong>Bank</strong> entity in the investor's home jurisdiction. In the U.S. this report is approved and/or distributed by <strong>Deutsche</strong> <strong>Bank</strong>Securities Inc., a member <strong>of</strong> the NYSE, the NASD, NFA and SIPC. In Germany this report is approved and/or communicated by <strong>Deutsche</strong> <strong>Bank</strong> AG Frankfurt authorized by the BaFin. In the United Kingdom this report is approvedand/or communicated by <strong>Deutsche</strong> <strong>Bank</strong> AG London, a member <strong>of</strong> the London Stock Exchange and regulated by the Financial Services Authority for the conduct <strong>of</strong> investment business in the UK and authorized by the BaFin.This report is distributed in Hong Kong by <strong>Deutsche</strong> <strong>Bank</strong> AG, Hong Kong Branch, in Korea by <strong>Deutsche</strong> Securities Korea Co. This report is distributed in Singapore by <strong>Deutsche</strong> <strong>Bank</strong> AG, Singapore Branch, and recipients inSingapore <strong>of</strong> this report are to contact <strong>Deutsche</strong> <strong>Bank</strong> AG, Singapore Branch in respect <strong>of</strong> any matters arising from, or in connection with, this report. Where this report is issued or promulgated in Singapore to a person who isnot an accredited investor, expert investor or institutional investor (as defined in the applicable Singapore laws and regulations), <strong>Deutsche</strong> <strong>Bank</strong> AG, Singapore Branch accepts legal responsibility to such person for the contents<strong>of</strong> this report. In Japan this report is approved and/or distributed by <strong>Deutsche</strong> Securities Inc. The information contained in this report does not constitute the provision <strong>of</strong> investment advice. In Australia, retail clients should obtaina copy <strong>of</strong> a Product Disclosure Statement (PDS) relating to any financial product referred to in this report and consider the PDS before making any decision about whether to acquire the product. <strong>Deutsche</strong> <strong>Bank</strong> AGJohannesburg is incorporated in the Federal Republic <strong>of</strong> Germany (Branch Register Number in South Africa: 1998/003298/10). Additional information relative to securities, other financial products or issuers discussed in thisreport is available upon request. This report may not be reproduced, distributed or published by any person for any purpose without <strong>Deutsche</strong> <strong>Bank</strong>'s prior written consent. Please cite source when quoting.Copyright © <strong>2010</strong> <strong>Deutsche</strong> <strong>Bank</strong> AGGRCM<strong>2010</strong>PROD019030