Egypt Real Estate Sector - Talaat Moustafa Group
Egypt Real Estate Sector - Talaat Moustafa Group
Egypt Real Estate Sector - Talaat Moustafa Group

You also want an ePaper? Increase the reach of your titles
YUMPU automatically turns print PDFs into web optimized ePapers that Google loves.
05 October 2011<br />
EEMEA/<strong>Egypt</strong><br />
Equity Research<br />
<strong>Real</strong> <strong>Estate</strong> (Emerging EMEA)<br />
Research Analysts<br />
Ahmed Badr<br />
971 4 362 0223<br />
ahmed.badr@credit-suisse.com<br />
Vincent Resillot<br />
44 20 7883 5550<br />
vincent.resillot@credit-suisse.com<br />
<strong>Egypt</strong> <strong>Real</strong> <strong>Estate</strong> <strong>Sector</strong><br />
SECTOR REVIEW<br />
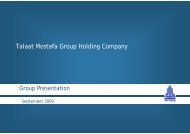
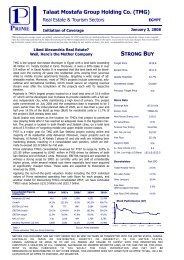
TMG becomes our only differentiated story<br />
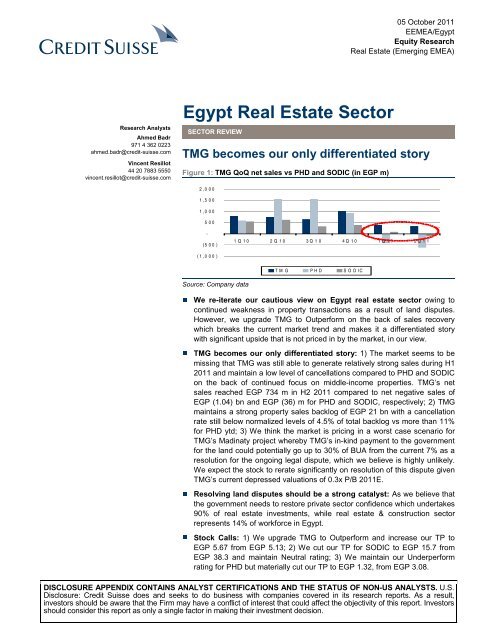
Figure 1: TMG QoQ net sales vs PHD and SODIC (in EGP m)<br />
2,000<br />
1,500<br />
1,000<br />
500<br />
-<br />
(5 0 0 )<br />
1Q10 2Q10 3Q10 4Q10 1Q11 2Q11<br />
(1,0 00 )<br />
TM G PHD SODIC<br />
Source: Company data<br />
We re-iterate our cautious view on <strong>Egypt</strong> real estate sector owing to<br />
■<br />
continued weakness in property transactions as a result of land disputes.<br />
However, we upgrade TMG to Outperform on the back of sales recovery<br />
which breaks the current market trend and makes it a differentiated story<br />
with significant upside that is not priced in by the market, in our view.<br />
TMG becomes our only differentiated story: 1) The market seems to be<br />
■<br />
missing that TMG was still able to generate relatively strong sales during H1<br />
2011 and maintain a low level of cancellations compared to PHD and SODIC<br />
on the back of continued focus on middle-income properties. TMG’s net<br />
sales reached EGP 734 m in H2 2011 compared to net negative sales of<br />
EGP (1.04) bn and EGP (36) m for PHD and SODIC, respectively; 2) TMG<br />
maintains a strong property sales backlog of EGP 21 bn with a cancellation<br />
rate still below normalized levels of 4.5% of total backlog vs more than 11%<br />
for PHD ytd; 3) We think the market is pricing in a worst case scenario for<br />
TMG’s Madinaty project whereby TMG’s in-kind payment to the government<br />
for the land could potentially go up to 30% of BUA from the current 7% as a<br />
resolution for the ongoing legal dispute, which we believe is highly unlikely.<br />
We expect the stock to rerate significantly on resolution of this dispute given<br />
TMG’s current depressed valuations of 0.3x P/B 2011E.<br />
Resolving land disputes should be a strong catalyst: As we believe that<br />
■<br />
the government needs to restore private sector confidence which undertakes<br />
90% of real estate investments, while real estate & construction sector<br />
represents 14% of workforce in <strong>Egypt</strong>.<br />
Stock Calls: 1) We upgrade TMG to Outperform and increase our TP to<br />
■<br />
EGP 5.67 from EGP 5.13; 2) We cut our TP for SODIC to EGP 15.7 from<br />
EGP 38.3 and maintain Neutral rating; 3) We maintain our Underperform<br />
rating for PHD but materially cut our TP to EGP 1.32, from EGP 3.08.<br />
DISCLOSURE APPENDIX CONTAINS ANALYST CERTIFICATIONS AND THE STATUS OF NON-US ANALYSTS. U.S.<br />
Disclosure: Credit Suisse does and seeks to do business with companies covered in its research reports. As a result,<br />
investors should be aware that the Firm may have a conflict of interest that could affect the objectivity of this report. Investors<br />
should consider this report as only a single factor in making their investment decision.
05 October 2011<br />
Weak outlook; but TMG becomes<br />
our only differentiated story<br />
Short term threats to demand and developers’ sales<br />
due to land title disputes…<br />
Although we believe that strong fundamental demand in the housing market remains intact,<br />
especially in Middle and Lower income housing segments, we expect most developers<br />
sales volume to continue to remain under pressure in the near term as a result of ongoing<br />
land title legal disputes which may continue to push buyers to put their purchases on hold.<br />
Moreover, we also expect developers to continue to experience rising cancellations given<br />
the concerns regarding ownership of land, which could lead to significant delays in project<br />
completion for some developers such as PHD and SODIC.<br />
…but TMG’s sales still outperform on middle-income<br />
demand<br />
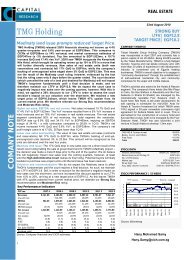
On the other hand, we believe that the market is missing the fact that TMG was still able to<br />
generate relatively strong sales during H1 2011 and maintain a low level of cancellations<br />
compared to PHD and SODIC on the back of continued focus on middle-income<br />
properties. TMG’s gross property sales reached EGP 1.17 bn in H2 2011 (EGP 734 m net<br />
of cancellations) compared to net negative sales of EGP (1.04) bn and EGP (36) m for<br />
PHD and SODIC, respectively. We believe this is a result of continued execution and<br />
property delivery in Madinaty project which helped restore buyers’ confidence in the<br />
project, despite the outstanding legal dispute with regards to TMG’s ownership of the land.<br />
TMG’s cancellation rate normalizing but less so for<br />
PHD<br />
Moreover, TMG still maintains a strong property sales backlog of EGP 21 bn and a total<br />
cancellations’ rate which remains below normalized levels of 4.5% of total backlog vs a<br />
cancellation rate of more than 11% of total backlog for PHD ytd.<br />
Figure 2: TMG: Gross and net sales QoQ<br />
in millions, unless otherwise stated<br />
Figure 3: PHD: Gross and net sales QoQ<br />
in millions, unless otherwise stated<br />
1,400<br />
2,000<br />
1,200<br />
1,000<br />
800<br />
600<br />
1,500<br />
1,000<br />
500<br />
400<br />
200<br />
-<br />
1Q10 2Q10 3Q10 4Q10 1Q11 2Q11<br />
-<br />
(500)<br />
(1,000)<br />
1Q10 2Q10 3Q10 4Q10 1Q11 2Q11<br />
Gross Sales<br />
Net Sales<br />
Gross Sales<br />
Net Sales<br />
Source: Company data<br />
Source: Company data<br />
<strong>Egypt</strong> <strong>Real</strong> <strong>Estate</strong> <strong>Sector</strong> 2
05 October 2011<br />
Madinaty project too big to fail<br />
We believe that the Madinaty land legal dispute continues to be the main overhang<br />
risk on the stock despite the <strong>Egypt</strong>ian State Judicial Council recommending the court to<br />
dismiss the legal case against TMG’s land title back in June. Putting the legal outcome<br />
aside, we believe that it remains in the <strong>Egypt</strong>ian Government’s interest to keep such a<br />
mega development going due to its significant economic benefits to housing and<br />
employment (Project is expected to house some 600k people upon completion). However,<br />
we don’t rule out the possibility of TMG having to pay a higher in-kind price to the<br />
government (currently 7% of total BUA) as a resolution for this civil dispute.<br />
Accordingly we undertake the below sensitivity analysis which implies that the market<br />
is pricing in that TMG could end-up paying as much as 30% of BUA (In-kind payment)<br />
compared to the current contractual in-kind payment of 7% of total BUA in the form of<br />
apartments to the government. We think that TMG potentially paying 30% represents a<br />
worst case scenario which we believe is highly unlikely and hence we think the stock looks<br />
very attractive at these levels.<br />
Figure 4: TMG: TP sensitivity to potential increase in government portion in Madinaty<br />
Government portion of total BUA<br />
Effective Government portion of TP (EGP per share)<br />
Apartment BUA<br />
Base Case - 7% 20% 5.67<br />
10% 28% 5.4<br />
15% 42% 5.0<br />
20% 56% 4.6<br />
25% 70% 4.2<br />
30% 84% 3.8<br />
Source: Company data, Credit Suisse estimates<br />
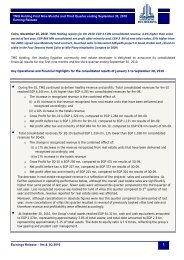
Significant valuation upside potential; TMG to<br />
outperform, in our view<br />
TMG trades at depressed valuation of 0.3x P/B 2011E, in line with PHD. We believe the<br />
stock should rerate significantly on the back of sales recovery and resolution of land<br />
dispute over the next 12 months, which makes it deserves. However, this would not be the<br />
case for SODIC and PHD due to our expectations of continued weakness in new sales<br />
and deteriorating working capital for PHD as a result of above average cancellations which<br />
negatively affected the company’s cash flow.<br />
Figure 5: One Year Forward Price to Book (FY 2012E)<br />
Figure 6: TMG: SOTP Breakdown<br />
1.8<br />
1.6<br />
1.4<br />
1.2<br />
1.0<br />
0.8<br />
0.6<br />
0.4<br />
0.2<br />
0.0<br />
Aug<br />
10<br />
Sep<br />
10<br />
Oct<br />
10<br />
Nov<br />
10<br />
Dec<br />
10<br />
Jan<br />
11<br />
Feb<br />
11<br />
Mar<br />
11<br />
Apr<br />
11<br />
May<br />
11<br />
TMG SODIC PHD<br />
Jun<br />
11<br />
Jul<br />
11<br />
Aug<br />
11<br />
7<br />
6<br />
5<br />
4<br />
3<br />
2<br />
1<br />
0<br />
4.9<br />
Madinaty<br />
0.1<br />
Al Rehab 1(Phase 6)<br />
0.5<br />
Al Rehab 2<br />
0.1 0.3<br />
Al Rabwa 2<br />
Nasamat El Riyadh<br />
1.7<br />
Net Debt, Minorities and<br />
Book Value<br />
0.2<br />
Investment properties<br />
1.3<br />
Hotels<br />
5.7<br />
TMG<br />
Source: the BLOOMBERG PROFESSIONAL service<br />
Source: Credit Suisse estimates<br />
<strong>Egypt</strong> <strong>Real</strong> <strong>Estate</strong> <strong>Sector</strong> 3
05 October 2011<br />
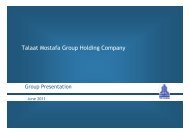
Selling prices to remain stable on supply cut; A<br />
potentially similar scenario to 2009… 1<br />
We believe that real estate prices will continue to remain stable (similar to<br />
2008/2009A) primarily owing to 1) Cash nature of <strong>Egypt</strong>ian housing market, with limited<br />
mortgage penetration (0.33% of GDP in 2010A), which would not force buyers to sell their<br />
property in order to settle the mortgage; and 2) Delay in project completion due to land<br />
disputes and developers slowing construction activity has already resulted in cutting the<br />
expected supply for 2011E and 2012E.<br />
Figure 7: Average selling prices per Sq m for Villas and apartments in East and west<br />
Cairo<br />
In EGP<br />
14,000<br />
12,000<br />
10,000<br />
Prices held up due to<br />
tight supply & market<br />
being cash dominated<br />
8,000<br />
6,000<br />
4,000<br />
2,000<br />
-<br />
2006 2007 2008 2009 2010<br />
Apartments<br />
Villas<br />
Source: <strong>Egypt</strong>ian real estate companies, Credit Suisse research<br />
Figure 8: Cairo: Expected Supply Pipeline (2011E)<br />
Residential (Units in New Cairo Offices (Sqm of Grade A) Retail (Sqm) Hotels (No. of Rooms)<br />
and 6 th Oct)<br />
Current Stock (2010) 46,000 688,000 741,000 13,600<br />
Pre Crisis- Supply 17,000 117,000 445,000 237<br />
Post Crisis- Supply 12,750 87,000 325,000 -<br />
% Change -25.0% -25.6% -27.0% -100.0%<br />
Source: JLL, Credit Suisse research<br />
1 The authors of this report wish to acknowledge the contribution made by Rahul Kaul, an employee of<br />
CRISIL Global Research and Analytics, a business division of CRISIL Limited, a third-party provider of<br />
research services to Credit Suisse<br />
<strong>Egypt</strong> <strong>Real</strong> <strong>Estate</strong> <strong>Sector</strong> 4
`<br />
05 October 2011<br />
Why the government needs to<br />
revive the sector<br />
Private sector undertakes more than 90% of real<br />
estate investments<br />
The private sector has been the dominant player in the real estate sector in <strong>Egypt</strong><br />
over the past 3 years and we believe it is key for the government to restore investor<br />
confidence in the sector through a swift resolution for current land ownership disputes.<br />
Note that the private sector remains fundamental for the development of the sector<br />
contributing more than 90% of real estate investments over the past 3 years on average.<br />
Moreover, as long as an uncertain legal and political climate prevails, real estate<br />
and construction sectors are unlikely to attract as much FDI as they have in the past<br />
(c. USD 610Mn during 2010). We believe, that while trying to revive Foreign Investment in<br />
<strong>Egypt</strong>, real estate and construction would remain government’s priorities, especially in light<br />
of the fact that they together formed 18% of FDI (Excl. Petroleum) during 2010A.<br />
We highlight that The Supreme Military Council has recently asked the government<br />
to honour previous land contracts which we believe is a positive step in resolving these<br />
disputes and should act as a catalyst for the real estate market.<br />
Figure 9: Private sector contribution to total <strong>Real</strong> estate & construction investments in<br />
<strong>Egypt</strong> (9M 2010/11A)<br />
10 0%<br />
90%<br />
80%<br />
70%<br />
60%<br />
50%<br />
40%<br />
30%<br />
20%<br />
10%<br />
0%<br />
83 %<br />
Construction and Building<br />
92%<br />
<strong>Real</strong> <strong>Estate</strong><br />
Govt <strong>Sector</strong> Economic Authorities Public Companies Private <strong>Sector</strong><br />
Source: Central Bank of <strong>Egypt</strong><br />
Figure 10: <strong>Egypt</strong> FDI breakdown by sector (Ex. Petroleum)<br />
in US$ millions, unless otherwise stated<br />
Figure 11: <strong>Real</strong> estate & construction represented 18% of<br />
<strong>Egypt</strong> FDI’s in 2010A (Ex. Petroleum)<br />
in %<br />
100%<br />
90%<br />
80%<br />
70%<br />
60%<br />
50%<br />
40%<br />
30%<br />
20%<br />
10%<br />
0%<br />
395<br />
424<br />
138.4<br />
225.5<br />
305.3<br />
2007/2008 2008/2009 2009/2010<br />
Finance Undistributed Manufacturing<br />
Services <strong>Real</strong> estate Construction<br />
303.8<br />
Agriculture Tourism Communications and IT<br />
Source: Central Bank of <strong>Egypt</strong><br />
Agriculture<br />
8%<br />
Construction<br />
9%<br />
Communication<br />
Tourism s and IT<br />
7% 2%<br />
<strong>Real</strong> estate<br />
9% Services<br />
11% Manufacturing<br />
13%<br />
Source: Central Bank of <strong>Egypt</strong><br />
Finance<br />
25%<br />
Undistributed<br />
16%<br />
<strong>Egypt</strong> <strong>Real</strong> <strong>Estate</strong> <strong>Sector</strong> 5
05 October 2011<br />
What is the land worth in a “No-Demand’’ market<br />
Developers such as PHD have already returned about 10 million sq m of land and<br />
will return further land to avoid any further legal disputes and offset pressure on<br />
working capital resulting from land payments. If the stand still in the sector continues, we<br />
believe that the government will struggle to auction any potential recovered land at<br />
reasonable rates as investors/developers are likely to continue to shy away till political as<br />
well as legal uncertainty ends.<br />
<strong>Sector</strong> standstill could severely affect employment<br />
Following the crisis, unemployment rates have severely shot up to 11.8% during Q2<br />
2011 from 8.9% at the end of Q4 2010. It remains extremely important for the present<br />
government to contain the current high employment rate in <strong>Egypt</strong> by creating new job<br />
opportunities (and restoring jobs lost during the crisis esp. in <strong>Real</strong> estate and tourism), in<br />
order to avoid further protest/unrest. <strong>Real</strong> estate construction and other supplementary<br />
activities have provided a significant c. 14% of total employment opportunities in the past,<br />
which makes it all the more important for the govt. to revive the sector, in our view.<br />
Figure 12: <strong>Egypt</strong>: Employment Breakdown by Industry<br />
(Private)<br />
in %<br />
Figure 13: <strong>Egypt</strong>: Quarterly Unemployment Rate<br />
in %<br />
T&C<br />
5%<br />
<strong>Real</strong> estate<br />
activities :<br />
4%<br />
Edu., health,&<br />
Others<br />
9%<br />
Construction &<br />
building<br />
10%<br />
Internal trade<br />
13%<br />
Restaurants &<br />
hotels<br />
3%<br />
Others<br />
1%<br />
Manufacturing<br />
17%<br />
Agricultural<br />
activities<br />
38%<br />
13%<br />
12%<br />
11%<br />
10%<br />
9%<br />
8%<br />
7%<br />
6%<br />
Mar03<br />
Sep 03<br />
Mar04<br />
Sep 04<br />
Mar05<br />
Sep 05<br />
Mar06<br />
Sep 06<br />
Mar07<br />
Sep 07<br />
Mar08<br />
Sep 08<br />
Mar09<br />
Sep 09<br />
Mar10<br />
Sep 10<br />
Mar11<br />
Source: Ministry of Planning<br />
Source: CAPMAS<br />
The “Off-Plan’’ model needs to remain intact<br />
<strong>Real</strong> estate buyers in <strong>Egypt</strong> are primarily cash buyers since mortgage penetration is very<br />
low and house purchase is financed through savings and income, thereby making “Off<br />
plan” sales model crucial to provide affordability as developers provide flexible payment<br />
terms to facilitate house purchases. However, current land ownership disputes represent a<br />
significant threat to this model, resulting in buyers putting their purchases on hold, despite<br />
the genuine need for housing.<br />
Figure 14: <strong>Egypt</strong>: Mortgage lending evolution<br />
in EGP millions, unless otherwise stated<br />
Figure 15: <strong>Egypt</strong>: Mortgage lending as % of GDP<br />
in %, unless otherwise stated<br />
4,500<br />
4,000<br />
3,500<br />
3,000<br />
2,500<br />
2,000<br />
1,500<br />
1,000<br />
500<br />
-<br />
1,882<br />
1,314<br />
821<br />
2,089<br />
1,596<br />
355<br />
1,094<br />
16<br />
214<br />
90 231<br />
467<br />
2005 2006 2007 2008 2009 2010<br />
0.35%<br />
0.30%<br />
0.25%<br />
0.20%<br />
0.15%<br />
0.10%<br />
0.05%<br />
0.00%<br />
0.33%<br />
0.28%<br />
0.21%<br />
0.11%<br />
0.07%<br />
0.02%<br />
2005 2006 2007 2008 2009 2010<br />
Banks<br />
Mortgage Finance Companies<br />
Mortgage Lending as % of GDP<br />
Source: <strong>Egypt</strong>ian Financial Supervisory authority, Ministry of Finance<br />
Source: <strong>Egypt</strong>ian Financial Supervisory authority, Ministry of Finance<br />
<strong>Egypt</strong> <strong>Real</strong> <strong>Estate</strong> <strong>Sector</strong> 6
05 October 2011<br />
Europe / <strong>Egypt</strong><br />
<strong>Real</strong> <strong>Estate</strong> Management & Development<br />
Rating (from Neutral) OUTPERFORM*<br />
Price (03 Oct 11, £E) 3.60<br />
Target price (£E) (from 5.01) 5.67¹<br />
Market cap. (£E m) 7,428.82<br />
Enterprise value (£E m) 11,582.5<br />
*Stock ratings are relative to the relevant country benchmark.<br />
¹Target price is for 12 months.<br />
Research Analysts<br />
Ahmed Badr<br />
971 4 362 0223<br />
ahmed.badr@credit-suisse.com<br />
Vincent Resillot<br />
44 20 7883 5550<br />
vincent.resillot@credit-suisse.com<br />
<strong>Talaat</strong> <strong>Moustafa</strong> <strong>Group</strong> (TMGH.CA)<br />
Significant upside on Madinaty resolution<br />
Action: We upgrade TMG to Outperform (from Neutral) and increase our TP<br />
■<br />
to EGP 5.67 per share (from 5.13) on the back of relatively strong sales in<br />
H1 2011 and attractive valuation. However, we cut our cumulative earnings<br />
estimates (2011-2013E) by 20.6% to reflect a more stretched property<br />
delivery schedule.<br />
Why do we upgrade TMG: 1) We believe that the market is missing the<br />
■<br />
fact that TMG was still able to generate relatively strong sales during H1<br />
2011 and maintain a low level of cancellations compared to PHD and SODIC<br />
on the back of continued focus on middle-income properties. TMG’s gross<br />
property sales reached EGP 1.17 bn in H2 2011 (EGP 734 m net of<br />
cancellations) compared to net negative sales of EGP (1.04) bn and EGP<br />
(36) m for PHD and SODIC, respectively. We believe this is a result of<br />
continued execution and property delivery in Madinaty project which helped<br />
restore buyers’ confidence in the project, despite the outstanding legal<br />
dispute with regards to TMG’s ownership of the land; 2) The market seems<br />
to be pricing in that TMG could end-up paying as much as 30% of BUA (Inkind<br />
payment) compared to the current contractual in-kind payment of 7% of<br />
total BUA in the form of apartments to the government in order to resolve the<br />
Madinaty land legal dispute. We think that TMG potentially paying 30%<br />
represents a worst case scenario which we believe is highly unlikely and<br />
hence we think the stock looks very attractive at these levels; 3) we remain<br />
comfortable with TMG’s debt position as BS continues to be underleveraged<br />
with Net debt/Equity of about 10% in 2011E.<br />
Catalysts: Resolution of the Madinaty project land dispute and continued<br />
■<br />
property sales recovery in Q3 are the main positive catalysts.<br />
Valuation: TMG trades at depressed valuation of 0.3x P/B 2011E. We<br />
■<br />
believe the stock should rerate significantly on the back of sales recovery<br />
and resolution of land dispute over the next 12 months.<br />
Share price performance<br />
9<br />
7<br />
5<br />
3<br />
Oct-09 Feb-10 Jun-10 Oct-10 Feb-11 Jun-11<br />
Price<br />
Price relative<br />
The price relative chart measures performance against the<br />
<strong>Egypt</strong> Financial <strong>Group</strong> Index index which closed at 213.3 on<br />
03/10/11<br />
On 03/10/11 the spot exchange rate was £E7.96/Eu 1. -<br />
Eu .76/US$1<br />
Performance Over 1M 3M 12M<br />
Absolute (%) -7.9 -26.7 -47.4<br />
Relative (%) 1.7 -7.0 -23.0<br />
Financial and valuation metrics<br />
Year 12/10A 12/11E 12/12E 12/13E<br />
Revenue (£E m) 5,339.4 5,318.4 7,070.4 7,529.0<br />
EBITDA (£E m) 1,213.39 1,157.17 1,978.85 2,148.03<br />
Net Income (£E m) 940.0 783.0 1,360.3 1,480.5<br />
CS adj. EPS (£E) 0.47 0.39 0.68 0.74<br />
Prev. EPS (£E) — 0.53 0.92 —<br />
ROIC (%) 3.45 3.19 5.21 5.46<br />
P/E (adj., x) 7.71 9.26 5.33 4.90<br />
P/E rel. (%) 90.5 143.5 121.1 140.3<br />
EV/EBITDA 9.3 10.0 5.8 4.4<br />
Dividend (12/11E, £E) — IC (12/11E, £E m) 27,635.1<br />
Dividend yield (%) — EV/IC 0.42<br />
Net debt (12/11E, £E m) 2,495.0 Current WACC 14.6<br />
Net debt/equity (12/11E, %) 9.9 Free float (%) 24.4<br />
BV/share (12/11E, £E) 12.5 Number of shares (m) 2,063.56<br />
Source: Company data, Thomson Reuters, Credit Suisse estimates.<br />
<strong>Egypt</strong> <strong>Real</strong> <strong>Estate</strong> <strong>Sector</strong> 7
05 October 2011<br />
Valuation and Forecasts<br />
Figure 16: TMG: SOTP Valuation Summary<br />
in EGP millions, unless otherwise stated<br />
Project Valuation methodology Valuation % Ownership<br />
Property sales<br />
Madinaty DCF analysis 9,925 100%<br />
Al Rehab 1(Phase 6) DCF analysis 295 100%<br />
Al Rehab 2 DCF analysis 1,021 100%<br />
Al Rabwa 2 DCF analysis 191 99%<br />
Nasamat El Riyadh DCF analysis 516 50%<br />
Total Property sales 11,948<br />
Investment properties<br />
Rehab Mall 2 7% Cap rate 52 100%<br />
Rehab open food court 7% Cap rate 7 100%<br />
Rehab Workshops 7% Cap rate 17 100%<br />
San Stefano Mall 7% Cap rate 255 100%<br />
Beymen 7% Cap rate 71 100%<br />
Total Investment properties 403<br />
Hotels<br />
Four Seasons Sharm El Sheikh DCF analysis 550 100%<br />
Four Seasons Nile Plaza DCF analysis 1,208 100%<br />
San Stefano Grand Plaza DCF analysis 134 85%<br />
Nile Hotel DCF analysis 263 100%<br />
Four Seasons Sharm El Sheikh extension DCF analysis 185 100%<br />
Marsa Alam DCF analysis 378 100%<br />
Total Hotels 2,717<br />
Total EV 15,068<br />
less: net debt (9M10A) (2,227)<br />
less: minorities (9M10A) (1,328)<br />
Plus: Investments at BV (9M10A) 4.5<br />
Equity value 11,518<br />
Number of shares 2,030<br />
Equity value per share 5.67<br />
Current share price 3.60<br />
Potential Upside/(Downside) 57.5%<br />
Source: Company data, Credit Suisse estimates<br />
Figure 17: TMG: New vs. Old Estimates<br />
in EGP millions, unless otherwise stated<br />
2011E 2012E 2013E Cumulative<br />
New<br />
Old Change<br />
(%)<br />
New<br />
Old Change<br />
(%)<br />
New<br />
Old Change<br />
(%)<br />
New<br />
(2011-<br />
13E)<br />
Old<br />
(2011-<br />
13E)<br />
Change<br />
(%)<br />
Revenue 5,318 6,039 -11.9% 7,070 8,125 -13.0% 7,529 6,349 18.6% 19,918 20,512 -2.9%<br />
EBITDA 1,157 1,354 -14.5% 1,979 2,320 -14.7% 2,148 1,936 10.9% 5,284 5,610 -5.8%<br />
EBITDA Margin % 21.8% 22.4% 28.0% 28.5% 28.5% 30.5% 26.5% 27.3%<br />
Net Income 783 1,101 -28.9% 1,360 1,887 -27.9% 1,481 1,576 -6.0% 3,624 4,564 -20.6%<br />
Source: Credit Suisse estimates<br />
<strong>Egypt</strong> <strong>Real</strong> <strong>Estate</strong> <strong>Sector</strong> 8
05 October 2011<br />
Europe / <strong>Egypt</strong><br />
<strong>Real</strong> <strong>Estate</strong> Management & Development<br />
Rating<br />
NEUTRAL*<br />
Price (03 Oct 11, £E) 12.88<br />
Target price (£E) 15.66¹<br />
Market cap. (£E m) 1,167.91<br />
Enterprise value (£E m) 275.3<br />
*Stock ratings are relative to the relevant country benchmark.<br />
¹Target price is for 12 months.<br />
Research Analysts<br />
Ahmed Badr<br />
971 4 362 0223<br />
ahmed.badr@credit-suisse.com<br />
Vincent Resillot<br />
44 20 7883 5550<br />
vincent.resillot@credit-suisse.com<br />
Six of October Development<br />
and Investment Company (OCDI.CA)<br />
Weak medium-term outlook for property sales;<br />
Maintain Neutral and cut TP<br />
Action: We significantly cut our cumulative estimates (2011-2013E) by 68%<br />
■<br />
and our TP to EGP 15.7 (from EGP 38.3) on the back of rising cancellations<br />
which has been wiping out previously recorded sales and potential<br />
significant delays in execution of SODIC’s two main projects, Westown and<br />
Eastown, (together contribute 58% of valuation) on the back of continued<br />
land ownership disputes and defensive behaviour for high-end property<br />
buyers. We maintain our Neutral rating for SODIC.<br />
Why are we cautious on SODIC over the next 12 months: We expect<br />
■<br />
SODIC to continue to experience a rising level of cancellation for previously<br />
purchased properties on the back of targeting the high-end residential and<br />
commercial segments, which have been most affected by the current<br />
standstill in the real estate market. This would in turn negatively affect<br />
SODIC’s earnings in 2011-2013E. SODIC’s cancellations reached EGP 91<br />
m and EGP 293 m in Q1 and Q2 2011A, respectively thus resulting in net<br />
sales turning negative in Q2 2011A. On the other hand, we are comfortable<br />
with SODIC’s working capital position as the net cash position on the BS<br />
should help the company compensate for lost cash flows resulting from<br />
cancellations and ease pressure on working capital.<br />
Catalysts: Potential further cancellations for previously sold properties<br />
■<br />
would be the main negative catalyst over the next 12 months.<br />
■ Valuation: SODIC trades at 0.5x P/B 2011E vs 0.3x for both TMG and PHD.<br />
Share price performance<br />
43<br />
33<br />
23<br />
13<br />
Oct-09 Feb-10 Jun-10 Oct-10 Feb-11 Jun-11<br />
Price<br />
Price relative<br />
The price relative chart measures performance against the<br />
<strong>Egypt</strong> Financial <strong>Group</strong> Index index which closed at 213.3 on<br />
03/10/11<br />
On 03/10/11 the spot exchange rate was £E7.96/Eu 1. -<br />
Eu .76/US$1<br />
Performance Over 1M 3M 12M<br />
Absolute (%) -24.9 -47.3 -65.0<br />
Relative (%) -17.1 -33.1 -48.8<br />
Financial and valuation metrics<br />
Year 12/10A 12/11E 12/12E 12/13E<br />
Revenue (£E m) 519.5 1,323.7 1,034.7 611.7<br />
EBITDA (£E m) 109.60 -80.61 294.06 142.54<br />
Net Income (£E m) 114.6 -33.7 246.4 104.0<br />
CS adj. EPS (£E) 3.28 -0.37 2.72 1.15<br />
Prev. EPS (£E) — 3.94 3.59 —<br />
ROIC (%) 3.87 -5.17 9.81 3.66<br />
P/E (adj., x) 3.93 -34.69 4.74 11.23<br />
P/E rel. (%) 46.1 -537.8 107.7 322.0<br />
EV/EBITDA 4.0 -3.4 2.5 5.7<br />
Dividend (12/11E, £E) — IC (12/11E, £E m) 1,478.7<br />
Dividend yield (%) — EV/IC 0.19<br />
Net debt (12/11E, £E m) -892.6 Current WACC 16.0<br />
Net debt/equity (12/11E, %) -37.6 Free float (%) 63.0<br />
BV/share (12/11E, £E) 25.8 Number of shares (m) 90.68<br />
Source: Company data, Thomson Reuters, Credit Suisse estimates.<br />
<strong>Egypt</strong> <strong>Real</strong> <strong>Estate</strong> <strong>Sector</strong> 9
05 October 2011<br />
Valuation and Forecasts<br />
Figure 18: SODIC: SOTP valuation summary<br />
in EGP millions, unless otherwise stated<br />
Project Valuation methodology Valuation SODIC stake (%) Value to SODIC<br />
Project<br />
Allegria DCF analysis 426 100% 426<br />
Westown DCF analysis 392 100% 392<br />
Eastown DCF analysis 319 100% 319<br />
Autoville DCF analysis 80 50% 40<br />
Kattameya Plaza DCF analysis 36 100% 36<br />
Total EV of launched projects (EGP Mn) 1,214<br />
Cash (H1 11) 574<br />
Equity investments (H1 11) 4.8<br />
Outstanding debt (H1 11) (276)<br />
Minority interest (H1 11) (96)<br />
Equity value 1,420<br />
Number of shares (Mn) 90.7<br />
Target price 15.66<br />
Current Price 12.88<br />
Premium or (Discount) 21.6%<br />
Source: Company data, Credit Suisse estimates<br />
Figure 19: SODIC: New vs. old estimates<br />
in EGP millions, unless otherwise stated<br />
2011 E 2012 E 2013 E Cumulative<br />
New Old Change<br />
(%)<br />
New Old Change<br />
(%)<br />
New Old Change<br />
(%)<br />
New Old Change<br />
(%)<br />
Revenue 1,324 1,433 -8% 1,035 1,195 -13% 612 991 -38% 2,970 3,620 -18%<br />
EBITDA (81) 443 -118.2% 294 402 -26.8% 143 421 -66.1% 356 1,265 -71.9%<br />
EBITDA Margin % -6% 31% 28% 34% 23% 42% 12% 35%<br />
Net Income (34) 357 -109.4% 246 325 -24.3% 104 338 -69.23% 316 1,020 -69.01%<br />
Source: Credit Suisse estimates<br />
Figure 20: SODIC: QoQ sales turned negative in Q2 2011A<br />
in EGP millions, unless otherwise stated<br />
Figure 21: SODIC: TP contribution by project<br />
in EGP per share<br />
80 0<br />
70 0<br />
60 0<br />
5.0<br />
4.5<br />
4.0<br />
3.5<br />
4.7<br />
4.3<br />
3.5<br />
50 0<br />
40 0<br />
30 0<br />
3.0<br />
2.5<br />
2.0<br />
1.5<br />
20 0<br />
10 0<br />
0<br />
-10 0<br />
-20 0<br />
Q1 Q2 Q3 Q4 Q1 Q2 Q3 Q4 Q1 Q2 Q3 Q4 Q1 Q2<br />
2008 2008 2008 2008 2009 2009 2009 20092010<br />
2010 2010 2010 201 1 2011<br />
1.0<br />
0.5<br />
0.0<br />
0.4 0.4<br />
Allegria Autoville Kattameya Plaza Westown Eastown<br />
Source: Company data<br />
Source: Credit Suisse estimates<br />
<strong>Egypt</strong> <strong>Real</strong> <strong>Estate</strong> <strong>Sector</strong> 10
05 October 2011<br />
Europe / <strong>Egypt</strong><br />
<strong>Real</strong> <strong>Estate</strong> Management & Development<br />
Rating<br />
UNDERPERFORM* [V]<br />
Price (03 Oct 11, £E) 1.22<br />
Target price (£E) (from 3.08) 1.32¹<br />
Market cap. (£E m) 1,278.95<br />
Enterprise value (£E m) 2,793.2<br />
*Stock ratings are relative to the relevant country benchmark.<br />
¹Target price is for 12 months.<br />
[V] = Stock considered volatile (see Disclosure Appendix).<br />
Share price performance<br />
7<br />
5<br />
3<br />
1<br />
Oct-09 Feb-10 Jun-10 Oct-10 Feb-11 Jun-11<br />
Price<br />
Research Analysts<br />
Ahmed Badr<br />
971 4 362 0223<br />
ahmed.badr@credit-suisse.com<br />
Vincent Resillot<br />
44 20 7883 5550<br />
vincent.resillot@credit-suisse.com<br />
Price relative<br />
The price relative chart measures performance against the<br />
<strong>Egypt</strong> Financial <strong>Group</strong> Index index which closed at 213.3 on<br />
03/10/11<br />
On 03/10/11 the spot exchange rate was £E7.96/Eu 1. -<br />
Eu .76/US$1<br />
Performance Over 1M 3M 12M<br />
Absolute (%) -29.9 -47.4 -78.9<br />
Relative (%) -22.6 -33.3 -69.1<br />
Palm Hills Development<br />
Company (PHDC.CA)<br />
Funding gap remains the main concern<br />
Action: We reiterate our Underperform rating for PHD and materially cut our<br />
■<br />
TP to EGP 1.32 (down from EGP 3.08) on the back of rising pressure on<br />
working capital as a result of significant cancellations. We also remove the<br />
Ain Sokhna project which has been shelved by the company and previously<br />
contributed 8.5% of our valuation for PHD.<br />
Investment Case: We believe that PHD will continue to underperform other<br />
■<br />
<strong>Egypt</strong>ian real estate names on the back of: 1) PHD has been hit harder than<br />
its peers on cancellations which reached EGP 1.54 bn (11% of total sales<br />
backlog) in H1 2011A due to concerns over land ownership and ability to<br />
deliver presold properties. This has also been reflected in minor gross sales<br />
for H2 2011 which reached EGP 492 m, down 80% yoy; 2) PHD has<br />
experienced significant delays in buyers’ instalment payments which has<br />
negatively affected its cash flows during H1 2011A; 3) Although PHD has<br />
been able to reduce its land liabilities by about 45% to EGP 2.5 bn as of end<br />
of Q2 2011A through returning about 10 mn square meters to the<br />
government, outstanding land liability is still significant (1.9x market cap) and<br />
would still put further pressure on the company’s working capital over the<br />
coming 12 months. Taking all the above factors into account, we estimate<br />
that PHD has a funding gap of about EGP 600-800 m between H2 2011-<br />
2012E, which we believe will be difficult to finance in the current environment<br />
and hence the current distressed valuation is justified, in our view.<br />
Catalysts: Potential further cancellations, weak property sales and a<br />
■<br />
widening funding gap are the main negative catalysts.<br />
Valuation: PHD trades at a P/B of 0.3x and 0.27x for 2011E and 2012E,<br />
■<br />
respectively.<br />
Financial and valuation metrics<br />
Year 12/10A 12/11E 12/12E 12/13E<br />
Revenue (£E m) 1,831.0 798.7 1,724.5 2,334.8<br />
EBITDA (£E m) 645.39 7.58 693.48 1,055.72<br />
Net Income (£E m) 526.4 -57.0 509.7 810.4<br />
CS adj. EPS (£E) 0.50 -0.05 0.49 0.77<br />
Prev. EPS (£E) — 0.71 1.05 —<br />
ROIC (%) 8.09 -0.50 7.95 11.62<br />
P/E (adj., x) 2.43 -22.43 2.51 1.58<br />
P/E rel. (%) 28.5 -347.7 57.0 45.2<br />
EV/EBITDA 4.4 368.4 4.1 2.2<br />
Dividend (12/11E, £E) — IC (12/11E, £E m) 6,326.2<br />
Dividend yield (%) — EV/IC 0.44<br />
Net debt (12/11E, £E m) 1,514.3 Current WACC 14.6<br />
Net debt/equity (12/11E, %) 31.5 Free float (%) 35.0<br />
BV/share (12/11E, £E) 4.1 Number of shares (m) 1,048.32<br />
Source: Company data, Thomson Reuters, Credit Suisse estimates.<br />
<strong>Egypt</strong> <strong>Real</strong> <strong>Estate</strong> <strong>Sector</strong> 11
05 October 2011<br />
Valuation and Forecasts<br />
Figure 22: Palm Hills: Adjusted SOTP valuation summary<br />
in EGP millions, unless otherwise stated<br />
Project Valuation methodology Valuation PHD stake (%) Value to PHD<br />
Launched projects<br />
Golf Views DCF 360 100% 360<br />
Golf ext DCF 758 100% 758<br />
Katamya DCF 355 100% 355<br />
Bambo Ext DCF 35 100% 35<br />
Hacienda Bay DCF 981 100% 981<br />
Casa DCF 103 51% 53<br />
The Village DCF 72 100% 72<br />
Palm Parks DCF 319 100% 319<br />
Village ext (Gate) DCF 272 51% 139<br />
Botanica - Forty Nine DCF 64 100% 64<br />
Village Garden (6 October) DCF 55 51% 28<br />
Village Garden (New Cairo) DCF 203 89% 181<br />
Park View DCF 128 51% 65<br />
Hacienda White 1 & 2 DCF 496 88% 436<br />
Total Launched Projects 4,201 3,846<br />
Macor - Hotels DCF 272 60% 163<br />
Rental Portfolio DCF 479 100% 479<br />
Total EV (EGP Mn) 4,487<br />
Cash (2010A) 148<br />
Equity investments (2010A) 0.2<br />
Outstanding debt (2010A) (922)<br />
Outstanding land liability<br />
(1,846)<br />
(Discounted)<br />
Minority interest (2010A) (481)<br />
Equity value 1,387<br />
Number of shares (m) 1,048<br />
TP 1.32<br />
Current Price 1.22<br />
Premium or (Discount) 8.2%<br />
Source: Company data, Credit Suisse estimates<br />
Figure 23: Palm hills: Old vs. New Estimates<br />
in EGP millions, unless otherwise stated<br />
2011E 2012E 2013E Cumulative<br />
New<br />
Old Change<br />
(%)<br />
New<br />
Old Change<br />
(%)<br />
New<br />
Old Change<br />
(%)<br />
New<br />
(2011-<br />
13E)<br />
Old<br />
(2011-<br />
13E)<br />
Change<br />
(%)<br />
Revenue 799 1,837 -56.5% 1,725 2,282 -24.4% 2,335 2,225 5.0% 4,858 6,343 -23.4%<br />
EBITDA 8 810 -99.1% 693 1,171 -40.8% 1,056 1,149 -8.2% 1,757 3,131 -43.9%<br />
EBITDA Margin % 0.9% 44.1% 40.2% 51.3% 45.2% 51.7% 36% 49%<br />
Net Income -57 668 -108.5% 510 911 -44.1% 810 896 -9.6% 1,263 2,475 -49.0%<br />
Source: Credit Suisse estimates<br />
Companies Mentioned (Price as of 03 Oct 11)<br />
Palm Hills Development Company (PHDC.CA, £E1.26, UNDERPERFORM [V], TP £E1.32)<br />
Six of October Development and Investment Company (OCDI.CA, £E12.88, NEUTRAL, TP £E15.66)<br />
<strong>Talaat</strong> <strong>Moustafa</strong> <strong>Group</strong> (TMGH.CA, £E3.60, OUTPERFORM, TP £E5.67)<br />
<strong>Egypt</strong> <strong>Real</strong> <strong>Estate</strong> <strong>Sector</strong> 12
05 October 2011<br />
Important Global Disclosures<br />
Disclosure Appendix<br />
The analysts identified in this report each certify, with respect to the companies or securities that the individual analyzes, that (1) the views<br />
expressed in this report accurately reflect his or her personal views about all of the subject companies and securities and (2) no part of his or her<br />
compensation was, is or will be directly or indirectly related to the specific recommendations or views expressed in this report.<br />
See the Companies Mentioned section for full company names.<br />
3-Year Price, Target Price and Rating Change History Chart for PHDC.CA<br />
PHDC.CA Closing Target<br />
Price Price Initiation/<br />
Date (£E) (£E) Rating Assumption<br />
31-Mar-09 4.718 6.429 O X<br />
15-Oct-09 6.877 6.778 N<br />
26-Jan-10 6.298 R<br />
12-Jul-10 4.35 6.062 O<br />
21-Oct-10 5.79 7.63<br />
11-Mar-11 4.87 3.077 U<br />
£E<br />
9<br />
8<br />
7<br />
6<br />
5<br />
4<br />
3<br />
2<br />
1<br />
6<br />
31-Mar-09<br />
O<br />
7<br />
N<br />
R<br />
6<br />
O<br />
8<br />
4-Oct-08<br />
4-Dec-08<br />
4-Feb-09<br />
4-Apr-09<br />
4-Jun-09<br />
4-Aug-09<br />
4-Oct-09<br />
4-Dec-09<br />
4-Feb-10<br />
4-Apr-10<br />
4-Jun-10<br />
4-Aug-10<br />
4-Oct-10<br />
4-Dec-10<br />
4-Feb-11<br />
4-Apr-11<br />
4-Jun-11<br />
4-Aug-1 1<br />
Closing Price Target Price Initiation/Assumption Rating<br />
O=Outperform; N=Neutral; U=Underperform; R=Restricted; NR=Not Rated; NC=Not Covered<br />
3<br />
U<br />
3-Year Price, Target Price and Rating Change History Chart for OCDI.CA<br />
OCDI.CA Closing Target<br />
Price Price Initiation/ 45<br />
Date (£E) (£E) Rating Assumption 40<br />
31-Mar-09 14.18 14.336 U X<br />
15-Oct-09 35.968 45.6 O<br />
35<br />
03-Jun-10 32.468 43.651<br />
30<br />
11-Mar-11 32.252 38.315 N<br />
25<br />
46<br />
O<br />
44<br />
38<br />
N<br />
20<br />
15<br />
£E<br />
10<br />
4-Oct-08<br />
4-Dec-08<br />
14 U<br />
31-Mar-09<br />
4-Feb-09<br />
4-Apr-09<br />
4-Jun-09<br />
4-Aug-09<br />
4-Oct-09<br />
4-Dec-09<br />
4-Feb-10<br />
4-Apr-10<br />
4-Jun-10<br />
4-Aug-10<br />
4-Oct-10<br />
4-Dec-10<br />
4-Feb-11<br />
4-Apr-11<br />
4-Jun-11<br />
4-Aug-1 1<br />
Closing Price Target Price Initiation/Assumption Rating<br />
O=Outperform; N=Neutral; U=Underperform; R=Restricted; NR=Not Rated; NC=Not Covered<br />
3-Year Price, Target Price and Rating Change History Chart for TMGH.CA<br />
TMGH.CA Closing Target<br />
Price Price Initiation/<br />
Date (£E) (£E) Rating Assumption<br />
01-Mar-10 7.454 10.129 O X<br />
21-Oct-10 7.337 10.13<br />
11-Mar-11 6.371 5 N<br />
£E<br />
12<br />
11<br />
10<br />
9<br />
8<br />
7<br />
6<br />
5<br />
4<br />
3<br />
2<br />
1-Mar-10<br />
10 10<br />
O<br />
4-Oct-08<br />
4-Dec-08<br />
4-Feb-09<br />
4-Apr-09<br />
4-Jun-09<br />
4-Aug-09<br />
4-Oct-09<br />
4-Dec-09<br />
4-Feb-10<br />
4-Apr-10<br />
4-Jun-10<br />
4-Aug-10<br />
4-Oct-10<br />
4-Dec-10<br />
4-Feb-11<br />
4-Apr-11<br />
4-Jun-11<br />
4-Aug-1 1<br />
Closing Price Target Price Initiation/Assumption Rating<br />
O=Outperform; N=Neutral; U=Underperform; R=Restricted; NR=Not Rated; NC=Not Covered<br />
The analyst(s) responsible for preparing this research report received compensation that is based upon various factors including Credit Suisse's total<br />
revenues, a portion of which are generated by Credit Suisse's investment banking activities.<br />
5<br />
N<br />
<strong>Egypt</strong> <strong>Real</strong> <strong>Estate</strong> <strong>Sector</strong> 13
05 October 2011<br />
Analysts’ stock ratings are defined as follows:<br />
Outperform (O): The stock’s total return is expected to outperform the relevant benchmark* by at least 10-15% (or more, depending on perceived<br />
risk) over the next 12 months.<br />
Neutral (N): The stock’s total return is expected to be in line with the relevant benchmark* (range of ±10-15%) over the next 12 months.<br />
Underperform (U): The stock’s total return is expected to underperform the relevant benchmark* by 10-15% or more over the next 12 months.<br />
*Relevant benchmark by region: As of 29 th May 2009, Australia, New Zealand, U.S. and Canadian ratings are based on (1) a stock’s absolute total<br />
return potential to its current share price and (2) the relative attractiveness of a stock’s total return potential within an analyst’s coverage universe**,<br />
with Outperforms representing the most attractive, Neutrals the less attractive, and Underperforms the least attractive investment opportunities.<br />
Some U.S. and Canadian ratings may fall outside the absolute total return ranges defined above, depending on market conditions and industry<br />
factors. For Latin American, Japanese, and non-Japan Asia stocks, ratings are based on a stock’s total return relative to the average total return of<br />
the relevant country or regional benchmark; for European stocks, ratings are based on a stock’s total return relative to the analyst's coverage<br />
universe**. For Australian and New Zealand stocks, 12-month rolling yield is incorporated in the absolute total return calculation and a 15% and a<br />
7.5% threshold replace the 10-15% level in the Outperform and Underperform stock rating definitions, respectively. The 15% and 7.5% thresholds<br />
replace the +10-15% and -10-15% levels in the Neutral stock rating definition, respectively.<br />
**An analyst's coverage universe consists of all companies covered by the analyst within the relevant sector.<br />
Restricted (R): In certain circumstances, Credit Suisse policy and/or applicable law and regulations preclude certain types of communications,<br />
including an investment recommendation, during the course of Credit Suisse's engagement in an investment banking transaction and in certain other<br />
circumstances.<br />
Volatility Indicator [V]: A stock is defined as volatile if the stock price has moved up or down by 20% or more in a month in at least 8 of the past 24<br />
months or the analyst expects significant volatility going forward.<br />
Analysts’ coverage universe weightings are distinct from analysts’ stock ratings and are based on the expected<br />
performance of an analyst’s coverage universe* versus the relevant broad market benchmark**:<br />
Overweight: Industry expected to outperform the relevant broad market benchmark over the next 12 months.<br />
Market Weight: Industry expected to perform in-line with the relevant broad market benchmark over the next 12 months.<br />
Underweight: Industry expected to underperform the relevant broad market benchmark over the next 12 months.<br />
*An analyst’s coverage universe consists of all companies covered by the analyst within the relevant sector.<br />
**The broad market benchmark is based on the expected return of the local market index (e.g., the S&P 500 in the U.S.) over the next 12 months.<br />
Credit Suisse’s distribution of stock ratings (and banking clients) is:<br />
Global Ratings Distribution<br />
Outperform/Buy* 49% (61% banking clients)<br />
Neutral/Hold* 39% (56% banking clients)<br />
Underperform/Sell* 9% (55% banking clients)<br />
Restricted 2%<br />
*For purposes of the NYSE and NASD ratings distribution disclosure requirements, our stock ratings of Outperform, Neutral, and Underperform most closely correspond to Buy,<br />
Hold, and Sell, respectively; however, the meanings are not the same, as our stock ratings are determined on a relative basis. (Please refer to definitions above.) An investor's<br />
decision to buy or sell a security should be based on investment objectives, current holdings, and other individual factors.<br />
Credit Suisse’s policy is to update research reports as it deems appropriate, based on developments with the subject company, the sector or the<br />
market that may have a material impact on the research views or opinions stated herein.<br />
Credit Suisse's policy is only to publish investment research that is impartial, independent, clear, fair and not misleading. For more detail please refer to Credit<br />
Suisse's Policies for Managing Conflicts of Interest in connection with Investment Research:<br />
http://www.csfb.com/research-and-analytics/disclaimer/managing_conflicts_disclaimer.html<br />
Credit Suisse does not provide any tax advice. Any statement herein regarding any US federal tax is not intended or written to be used, and cannot<br />
be used, by any taxpayer for the purposes of avoiding any penalties.<br />
See the Companies Mentioned section for full company names.<br />
Price Target: (12 months) for (PHDC.CA)<br />
Method: Our TP is derived from a SOTP valuation whereby we do a DCF for all projects underconstruction using our average WACC of 14.6%. Our<br />
WACC of 14.6% is derived from a cost of equity of 15.3% and cost of debt of 12%.<br />
Risks: 1) Recent land disputes in <strong>Egypt</strong> might negatively affect investor sentiment and may represent a short-term overhang on real estate stocks in<br />
<strong>Egypt</strong>; 2) : Lower than expected sales performance would represent further downside risk; 3) An increase in the rate of cancellations, especially on<br />
the holiday homes front would have further negative impact on our valuation.<br />
Price Target: (12 months) for (OCDI.CA)<br />
Method: Our TP of EGP 15.66 per share is derived from a SOTP valuation whereby we do a DCF for each individual project. We use an average<br />
WACC of 16% in our DCF.<br />
Risks: Risks include political risks in the Middle East, cancellation of sold properties, property sales not materialising and<br />
cancellation of projects amongst others.<br />
Price Target: (12 months) for (TMGH.CA)<br />
Method: Our TP is derived from a SOTP valuation whereby we value each business segment separately; 1) We value TMG's real estate projects<br />
(property sales) and hotels via a DCF approach using our average WACC of 14.4%. We use a terminal growth rate of 3% for hotels; 2) we value<br />
TMG's investment properties by applying a 7% cap rate to 2015E discounted FCF.<br />
<strong>Egypt</strong> <strong>Real</strong> <strong>Estate</strong> <strong>Sector</strong> 14
05 October 2011<br />
Risks: We see the following risks: A slowdown in new sales in H2 2011E will result in further backlog deterioration and could put pressure on the<br />
share price; and TMG's selling prices in the Madinaty and Al Rehab projects more than doubled from 2006 to date. We are concerned that continued<br />
price increases may result in houses becoming too expensive and put pressure on affordability and demand.<br />
Please refer to the firm's disclosure website at www.credit-suisse.com/researchdisclosures for the definitions of abbreviations typically used in the<br />
target price method and risk sections.<br />
See the Companies Mentioned section for full company names.<br />
As of the end of the preceding month, Credit Suisse beneficially owned 1% or more of a class of common equity securities of (PHDC.CA, OCDI.CA).<br />
This holding is calculated according to U.S. regulatory requirements which are based on Section 13(d) of the Securities and Exchange Act of 1934.<br />
Important Regional Disclosures<br />
Singapore recipients should contact a Singapore financial adviser for any matters arising from this research report.<br />
The analyst(s) involved in the preparation of this report have not visited the material operations of the subject company (PHDC.CA, OCDI.CA,<br />
TMGH.CA) within the past 12 months.<br />
Restrictions on certain Canadian securities are indicated by the following abbreviations: NVS--Non-Voting shares; RVS--Restricted Voting Shares;<br />
SVS--Subordinate Voting Shares.<br />
Individuals receiving this report from a Canadian investment dealer that is not affiliated with Credit Suisse should be advised that this report may not<br />
contain regulatory disclosures the non-affiliated Canadian investment dealer would be required to make if this were its own report.<br />
For Credit Suisse Securities (Canada), Inc.'s policies and procedures regarding the dissemination of equity research, please visit<br />
http://www.csfb.com/legal_terms/canada_research_policy.shtml.<br />
As of the date of this report, Credit Suisse acts as a market maker or liquidity provider in the equities securities that are the subject of this report.<br />
Principal is not guaranteed in the case of equities because equity prices are variable.<br />
Commission is the commission rate or the amount agreed with a customer when setting up an account or at anytime after that.<br />
Taiwanese Disclosures: Reports written by Taiwan-based analysts on non-Taiwan listed companies are not considered recommendations to buy or<br />
sell securities under Taiwan Stock Exchange Operational Regulations Governing Securities Firms Recommending Trades in Securities to<br />
Customers.<br />
To the extent this is a report authored in whole or in part by a non-U.S. analyst and is made available in the U.S., the following are important<br />
disclosures regarding any non-U.S. analyst contributors:<br />
The non-U.S. research analysts listed below (if any) are not registered/qualified as research analysts with FINRA. The non-U.S. research analysts<br />
listed below may not be associated persons of CSSU and therefore may not be subject to the NASD Rule 2711 and NYSE Rule 472 restrictions on<br />
communications with a subject company, public appearances and trading securities held by a research analyst account.<br />
• Ahmed Badr, non-U.S. analyst, is a research analyst employed by Credit Suisse Securities (Europe) Limited.<br />
• Vincent Resillot, non-U.S. analyst, is a research analyst employed by Credit Suisse Securities (Europe) Limited.<br />
For Credit Suisse disclosure information on other companies mentioned in this report, please visit the website at www.creditsuisse.com/researchdisclosures<br />
or call +1 (877) 291-2683.<br />
Disclaimers continue on next page.<br />
<strong>Egypt</strong> <strong>Real</strong> <strong>Estate</strong> <strong>Sector</strong> 15
05 October 2011<br />
Europe / <strong>Egypt</strong><br />
Equity Research<br />
This report is not directed to, or intended for distribution to or use by, any person or entity who is a citizen or resident of or located in any locality, state, country or other jurisdiction<br />
where such distribution, publication, availability or use would be contrary to law or regulation or which would subject Credit Suisse AG, the Swiss bank, or its subsidiaries or its affiliates<br />
(“CS”) to any registration or licensing requirement within such jurisdiction. All material presented in this report, unless specifically indicated otherwise, is under copyright to CS. None of<br />
the material, nor its content, nor any copy of it, may be altered in any way, transmitted to, copied or distributed to any other party, without the prior express written permission of CS. All<br />
trademarks, service marks and logos used in this report are trademarks or service marks or registered trademarks or service marks of CS or its affiliates.<br />
The information, tools and material presented in this report are provided to you for information purposes only and are not to be used or considered as an offer or the solicitation of an<br />
offer to sell or to buy or subscribe for securities or other financial instruments. CS may not have taken any steps to ensure that the securities referred to in this report are suitable for<br />
any particular investor. CS will not treat recipients as its customers by virtue of their receiving the report. The investments or services contained or referred to in this report may not be<br />
suitable for you and it is recommended that you consult an independent investment advisor if you are in doubt about such investments or investment services. Nothing in this report<br />
constitutes investment, legal, accounting or tax advice or a representation that any investment or strategy is suitable or appropriate to your individual circumstances or otherwise<br />
constitutes a personal recommendation to you. CS does not offer advice on the tax consequences of investment and you are advised to contact an independent tax adviser. Please<br />
note in particular that the bases and levels of taxation may change.<br />
CS believes the information and opinions in the Disclosure Appendix of this report are accurate and complete. Information and opinions presented in the other sections of the report<br />
were obtained or derived from sources CS believes are reliable, but CS makes no representations as to their accuracy or completeness. Additional information is available upon<br />
request. CS accepts no liability for loss arising from the use of the material presented in this report, except that this exclusion of liability does not apply to the extent that liability arises<br />
under specific statutes or regulations applicable to CS. This report is not to be relied upon in substitution for the exercise of independent judgment. CS may have issued, and may in<br />
the future issue, a trading call regarding this security. Trading calls are short term trading opportunities based on market events and catalysts, while stock ratings reflect investment<br />
recommendations based on expected total return over a 12-month period as defined in the disclosure section. Because trading calls and stock ratings reflect different assumptions and<br />
analytical methods, trading calls may differ directionally from the stock rating. In addition, CS may have issued, and may in the future issue, other reports that are inconsistent with, and<br />
reach different conclusions from, the information presented in this report. Those reports reflect the different assumptions, views and analytical methods of the analysts who prepared<br />
them and CS is under no obligation to ensure that such other reports are brought to the attention of any recipient of this report. CS is involved in many businesses that relate to<br />
companies mentioned in this report. These businesses include specialized trading, risk arbitrage, market making, and other proprietary trading.<br />
Past performance should not be taken as an indication or guarantee of future performance, and no representation or warranty, express or implied, is made regarding future<br />
performance. Information, opinions and estimates contained in this report reflect a judgement at its original date of publication by CS and are subject to change without notice. The<br />
price, value of and income from any of the securities or financial instruments mentioned in this report can fall as well as rise. The value of securities and financial instruments is subject<br />
to exchange rate fluctuation that may have a positive or adverse effect on the price or income of such securities or financial instruments. Investors in securities such as ADR’s, the<br />
values of which are influenced by currency volatility, effectively assume this risk.<br />
Structured securities are complex instruments, typically involve a high degree of risk and are intended for sale only to sophisticated investors who are capable of understanding and<br />
assuming the risks involved. The market value of any structured security may be affected by changes in economic, financial and political factors (including, but not limited to, spot and<br />
forward interest and exchange rates), time to maturity, market conditions and volatility, and the credit quality of any issuer or reference issuer. Any investor interested in purchasing a<br />
structured product should conduct their own investigation and analysis of the product and consult with their own professional advisers as to the risks involved in making such a purchase.<br />
Some investments discussed in this report have a high level of volatility. High volatility investments may experience sudden and large falls in their value causing losses when that<br />
investment is realised. Those losses may equal your original investment. Indeed, in the case of some investments the potential losses may exceed the amount of initial investment, in<br />
such circumstances you may be required to pay more money to support those losses. Income yields from investments may fluctuate and, in consequence, initial capital paid to make<br />
the investment may be used as part of that income yield. Some investments may not be readily realisable and it may be difficult to sell or realise those investments, similarly it may<br />
prove difficult for you to obtain reliable information about the value, or risks, to which such an investment is exposed.<br />
This report may provide the addresses of, or contain hyperlinks to, websites. Except to the extent to which the report refers to website material of CS, CS has not reviewed the linked<br />
site and takes no responsibility for the content contained therein. Such address or hyperlink (including addresses or hyperlinks to CS’s own website material) is provided solely for your<br />
convenience and information and the content of the linked site does not in any way form part of this document. Accessing such website or following such link through this report or<br />
CS’s website shall be at your own risk.<br />
This report is issued and distributed in Europe (except Switzerland) by Credit Suisse Securities (Europe) Limited, One Cabot Square, London E14 4QJ, England, which is regulated in<br />
the United Kingdom by The Financial Services Authority (“FSA”). This report is being distributed in Germany by Credit Suisse Securities (Europe) Limited Niederlassung Frankfurt am<br />
Main regulated by the Bundesanstalt fuer Finanzdienstleistungsaufsicht ("BaFin"). This report is being distributed in the United States by Credit Suisse Securities (USA) LLC ; in<br />
Switzerland by Credit Suisse AG; in Canada by Credit Suisse Securities (Canada), Inc.; in Brazil by Banco de Investimentos Credit Suisse (Brasil) S.A. or its affiliates; in Mexico by<br />
Banco Credit Suisse (México), S.A. (transactions related to the securities mentioned in this report will only be effected in compliance with applicable regulation); in Japan by Credit<br />
Suisse Securities (Japan) Limited, Financial Instrument Firm, Director-General of Kanto Local Finance Bureau (Kinsho) No. 66, a member of Japan Securities Dealers Association,<br />
The Financial Futures Association of Japan, Japan Securities Investment Advisers Association, Type II Financial Instruments Firms Association; elsewhere in Asia/Pacific by<br />
whichever of the following is the appropriately authorised entity in the relevant jurisdiction: Credit Suisse (Hong Kong) Limited, Credit Suisse Equities (Australia) Limited , Credit Suisse<br />
Securities (Thailand) Limited, Credit Suisse Securities (Malaysia) Sdn Bhd, Credit Suisse AG, Singapore Branch, Credit Suisse Securities (India) Private Limited regulated by the<br />
Securities and Exchange Board of India (registration Nos. INB230970637; INF230970637; INB010970631; INF010970631), having registered address at 9th Floor, Ceejay<br />
House,Dr.A.B. Road, Worli, Mumbai - 18, India, T- +91-22 6777 3777, Credit Suisse Securities (Europe) Limited, Seoul Branch, Credit Suisse AG, Taipei Securities Branch, PT Credit<br />
Suisse Securities Indonesia, Credit Suisse Securities (Philippines ) Inc., and elsewhere in the world by the relevant authorised affiliate of the above. Research on Taiwanese securities<br />
produced by Credit Suisse AG, Taipei Securities Branch has been prepared by a registered Senior Business Person. Research provided to residents of Malaysia is authorised by the<br />
Head of Research for Credit Suisse Securities (Malaysia) Sdn. Bhd., to whom they should direct any queries on +603 2723 2020.<br />
In jurisdictions where CS is not already registered or licensed to trade in securities, transactions will only be effected in accordance with applicable securities legislation, which will vary<br />
from jurisdiction to jurisdiction and may require that the trade be made in accordance with applicable exemptions from registration or licensing requirements. Non-U.S. customers<br />
wishing to effect a transaction should contact a CS entity in their local jurisdiction unless governing law permits otherwise. U.S. customers wishing to effect a transaction should do so<br />
only by contacting a representative at Credit Suisse Securities (USA) LLC in the U.S.<br />
Please note that this report was originally prepared and issued by CS for distribution to their market professional and institutional investor customers. Recipients who are not market<br />
professional or institutional investor customers of CS should seek the advice of their independent financial advisor prior to taking any investment decision based on this report or for<br />
any necessary explanation of its contents. This research may relate to investments or services of a person outside of the UK or to other matters which are not regulated by the FSA or<br />
in respect of which the protections of the FSA for private customers and/or the UK compensation scheme may not be available, and further details as to where this may be the case<br />
are available upon request in respect of this report.<br />
Any Nielsen Media Research material contained in this report represents Nielsen Media Research's estimates and does not represent facts. NMR has neither reviewed nor approved<br />
this report and/or any of the statements made herein.<br />
If this report is being distributed by a financial institution other than Credit Suisse AG, or its affiliates, that financial institution is solely responsible for distribution. Clients of that<br />
institution should contact that institution to effect a transaction in the securities mentioned in this report or require further information. This report does not constitute investment advice<br />
by Credit Suisse to the clients of the distributing financial institution, and neither Credit Suisse AG, its affiliates, and their respective officers, directors and employees accept any<br />
liability whatsoever for any direct or consequential loss arising from their use of this report or its content.<br />
Copyright 2011 CREDIT SUISSE AG and/or its affiliates. All rights reserved.<br />
CREDIT SUISSE SECURITIES (Europe) Limited<br />
Europe: +44 (20) 7888-8888<br />
<strong>Egypt</strong> RE Oct 5 2011 FINAL1.doc