Deutsche Bank - Egypt Real Estate - (6th of July 2010) - SODIC
Deutsche Bank - Egypt Real Estate - (6th of July 2010) - SODIC
Deutsche Bank - Egypt Real Estate - (6th of July 2010) - SODIC

Create successful ePaper yourself
Turn your PDF publications into a flip-book with our unique Google optimized e-Paper software.
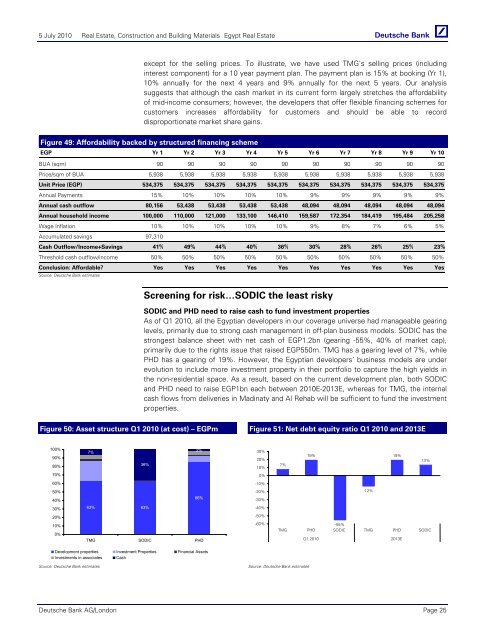
5 <strong>July</strong> <strong>2010</strong> <strong>Real</strong> <strong>Estate</strong>, Construction and Building Materials <strong>Egypt</strong> <strong>Real</strong> <strong>Estate</strong>except for the selling prices. To illustrate, we have used TMG’s selling prices (includinginterest component) for a 10 year payment plan. The payment plan is 15% at booking (Yr 1),10% annually for the next 4 years and 9% annually for the next 5 years. Our analysissuggests that although the cash market in its current form largely stretches the affordability<strong>of</strong> mid-income consumers; however, the developers that <strong>of</strong>fer flexible financing schemes forcustomers increases affordability for customers and should be able to recorddisproportionate market share gains.Figure 49: Affordability backed by structured financing schemeEGP Yr 1 Yr 2 Yr 3 Yr 4 Yr 5 Yr 6 Yr 7 Yr 8 Yr 9 Yr 10BUA (sqm) 90 90 90 90 90 90 90 90 90 90Price/sqm <strong>of</strong> BUA 5,938 5,938 5,938 5,938 5,938 5,938 5,938 5,938 5,938 5,938Unit Price (EGP) 534,375 534,375 534,375 534,375 534,375 534,375 534,375 534,375 534,375 534,375Annual Payments 15% 10% 10% 10% 10% 9% 9% 9% 9% 9%Annual cash outflow 80,156 53,438 53,438 53,438 53,438 48,094 48,094 48,094 48,094 48,094Annual household income 100,000 110,000 121,000 133,100 146,410 159,587 172,354 184,419 195,484 205,258Wage Inflation 10% 10% 10% 10% 10% 9% 8% 7% 6% 5%Accumulated savings 97,310Cash Outflow/Income+Savings 41% 49% 44% 40% 36% 30% 28% 26% 25% 23%Threshold cash outflow/income 50% 50% 50% 50% 50% 50% 50% 50% 50% 50%Conclusion: Affordable? Yes Yes Yes Yes Yes Yes Yes Yes Yes YesSource: <strong>Deutsche</strong> <strong>Bank</strong> estimatesScreening for risk…<strong>SODIC</strong> the least risky<strong>SODIC</strong> and PHD need to raise cash to fund investment propertiesAs <strong>of</strong> Q1 <strong>2010</strong>, all the <strong>Egypt</strong>ian developers in our coverage universe had manageable gearinglevels, primarily due to strong cash management in <strong>of</strong>f-plan business models. <strong>SODIC</strong> has thestrongest balance sheet with net cash <strong>of</strong> EGP1.2bn (gearing -55%, 40% <strong>of</strong> market cap),primarily due to the rights issue that raised EGP550m. TMG has a gearing level <strong>of</strong> 7%, whilePHD has a gearing <strong>of</strong> 19%. However, the <strong>Egypt</strong>ian developers’ business models are underevolution to include more investment property in their portfolio to capture the high yields inthe non-residential space. As a result, based on the current development plan, both <strong>SODIC</strong>and PHD need to raise EGP1bn each between <strong>2010</strong>E-2013E, whereas for TMG, the internalcash flows from deliveries in Madinaty and Al Rehab will be sufficient to fund the investmentproperties.Figure 50: Asset structure Q1 <strong>2010</strong> (at cost) – EGPmFigure 51: Net debt equity ratio Q1 <strong>2010</strong> and 2013E100%90%80%7%36%2%30%20%10%7%19%19%13%70%0%60%-10%50%40%86%-20%-30%-12%30%63% 63%-40%20%-50%10%0%TMG <strong>SODIC</strong> PHD-60%-55%TMG PHD <strong>SODIC</strong> TMG PHD <strong>SODIC</strong>Q1 <strong>2010</strong>2013EDevelopment properties Investment Properties Financial AssetsInvestments in associates CashSource: <strong>Deutsche</strong> <strong>Bank</strong> estimatesSource: <strong>Deutsche</strong> <strong>Bank</strong> estimates<strong>Deutsche</strong> <strong>Bank</strong> AG/London Page 25