Trace element stoichiometry of marine plankton & its effect ... - IMBER
Trace element stoichiometry of marine plankton & its effect ... - IMBER
Trace element stoichiometry of marine plankton & its effect ... - IMBER

You also want an ePaper? Increase the reach of your titles
YUMPU automatically turns print PDFs into web optimized ePapers that Google loves.
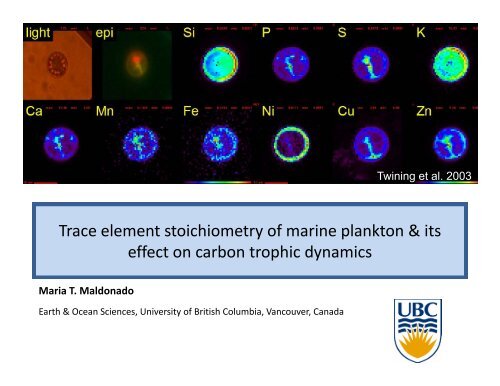
Twining et al. 2003<br />
<strong>Trace</strong> <strong>element</strong> <strong>stoichiometry</strong> <strong>of</strong> <strong>marine</strong> <strong>plankton</strong> & <strong>its</strong><br />
<strong>effect</strong> on carbon trophic dynamics<br />
Maria T. Maldonado<br />
Earth & Ocean Sciences, University <strong>of</strong> British Columbia, Vancouver, Canada
Talk Outline<br />
1. Technical challenges hll in determining dt ii <strong>plankton</strong> trace metal tl<br />
<strong>stoichiometry</strong><br />
2. Overview <strong>of</strong> “bulk <strong>plankton</strong>” metal <strong>stoichiometry</strong><br />
3. Phyto<strong>plankton</strong>‐specific metal <strong>stoichiometry</strong><br />
‐ evolutionary, taxonomic, environmental influences<br />
4. Transfer efficiencies <strong>of</strong> metals to upper trophic levels.<br />
5. Metal <strong>stoichiometry</strong> & links to the <strong>marine</strong> C cycle<br />
‐ bacteria/phyto<strong>plankton</strong>/zoo<strong>plankton</strong><br />
‐ C fixation, calcification & C remineralization<br />
6. Ecological implications phyto<strong>plankton</strong> metal <strong>stoichiometry</strong><br />
7. Conclusions<br />
Armbrust (2009)
Technical challenges determining <strong>plankton</strong> trace metal <strong>stoichiometry</strong><br />
‣Separating living from detrital/lithogenic material; contribution <strong>of</strong><br />
various organisms to a given size classes<br />
‐ Laboratory (cellular <strong>stoichiometry</strong>) vs. field estimates (bulk)<br />
‣ Intracellular vs. extracellular trace metals; i.e. uptake vs. adsorption<br />
‣Normalizing cellular trace metal concentrations: P vs. C<br />
‣Measurements are time consuming and potentially expensive<br />
ICPMS: multi-<strong>element</strong> in situ & lab; (extra- intra-cellular wash; lithogenic<br />
ICPMS: multi-<strong>element</strong> in situ & lab; (extra-, intra-cellular wash; lithogenic<br />
contamination)<br />
SXRF: metal <strong>stoichiometry</strong> and mapping <strong>of</strong> individual cells in situ & lab<br />
Radiotracers: physiological studies (uptake, recycling, storage...)
Synchroton X‐ray fluorescence microprobe<br />
Light, epifluorescence micrographs<br />
& SXRF false-color <strong>element</strong> maps<br />
using estimates<br />
<strong>of</strong> cell volume to<br />
calculate cell C<br />
Fluorescence spectra<br />
<strong>of</strong> a diatom<br />
Iron content <strong>of</strong> Thalassiosira weissflogii<br />
Twining et al. 2003, 2004, 2008
What to use to normalize the trace metal data, using P or C<br />
- <strong>Trace</strong> metals & C cycle: normalize to cellular C<br />
- Geochemists prefer normalizing to P<br />
- P content is very plastic (Sterner & Elser 2002)<br />
- P is not the best proxy for biomass<br />
Trend: different Cu:P quotas for green vs. red algae disappears if normalized to C<br />
Species<br />
C:P<br />
(mol:mol)<br />
Cu:P<br />
(mmol:mol)<br />
Cu:C<br />
(μmol:mol)<br />
Mean Cu:P<br />
(mmol:mol)<br />
Mean Cu:C<br />
(μmol:mol)<br />
Chlorophyceae 198 ±35 0.45 ± 0.31 2.17 ±1.19<br />
Prasinophyceae 200 ± 9 0.55 ± 0.06 2.77 ±0.2 0.5 2.47<br />
Dinophyceae 117 ±31 0.29 ± 0.24 2.26 ±1.62<br />
Prymnesiophyceae 70 ± 8 0.09 ± 0.03 1.32 ±0.56<br />
Bacillariophyceae 62 ±22 0.17 ±0.09 2.8 ±1.4 0.18 2.13<br />
Data from Ho et al. 2003
Talk Outline<br />
1. Technical challenges hll in determining dt ii <strong>plankton</strong> trace metal tl<br />
<strong>stoichiometry</strong><br />
2. Overview <strong>of</strong> “bulk <strong>plankton</strong>” metal <strong>stoichiometry</strong><br />
3. Phyto<strong>plankton</strong>‐specific metal <strong>stoichiometry</strong><br />
‐ evolutionary, taxonomic, environmental influences<br />
4. Transfer efficiencies <strong>of</strong> metals to upper trophic levels.<br />
5. Metal <strong>stoichiometry</strong> & links to the <strong>marine</strong> C cycle<br />
‐ bacteria/phyto<strong>plankton</strong>/zoo<strong>plankton</strong><br />
‐ C fixation, calcification & C remineralization<br />
6. Ecological implications phyto<strong>plankton</strong> metal <strong>stoichiometry</strong><br />
7. Conclusions<br />
Armbrust (2009)
Overview <strong>of</strong> “bulk <strong>plankton</strong>” metal <strong>stoichiometry</strong> (lab vs. field)<br />
Study<br />
(mol:mol)<br />
Compiled by<br />
Bruland et al. 1991<br />
P Fe Zn Cu Mn Ni Cd Co<br />
1000 5 2 0.4 0.4 0.4 0.4<br />
Kuss & Kremling 1000 5 2 0.4 2 1 0.5 0.2<br />
1999<br />
Twinning et al. 2004 1000 1.8 5.4 0.26 0.61 0.21<br />
Ho et al. 2003 1000 7.5 0.8 0.38 3.28 0.22 0.19<br />
Copepods, Ho et al.<br />
2007<br />
1000 13 3.6 1.1 0.33 0.071<br />
Mean 6.5 2.8 0.57 1.25 0.56 0.37 0.15<br />
Range (X‐fold) 7.2 6.8 2.9 12.6 4.5 2.4 2.8<br />
MEAN stoichiometric values vary 2-13 fold
Size‐fractionation <strong>of</strong> metal <strong>stoichiometry</strong> in the field<br />
• Metal content (Al, Ti, Mn, Fe, Co, Ni, Cu, Zn) decreases as size <strong>of</strong> organisms<br />
increases (Ho et al. 2007)<br />
a) Higher SA to volume ratio in the smaller fractions, potential for more<br />
extracellular trace metals<br />
Ho et al 2007<br />
Me g wt -1 )<br />
(μg M<br />
10 -60 m<br />
60 -150 m > 150 m
But there is significant variability within the mean values….<br />
Two ends <strong>of</strong> each box represents<br />
the 25 & 75 percentiles for all data<br />
<br />
Under identical growth<br />
conditions, difference<br />
among species (~20 fold,<br />
exception Cd) ) reflects:<br />
1. Unique cell biochemistry<br />
2. Ability to take up Me<br />
+<br />
3. Ability to store Me +<br />
Ho et al. 2003
Talk Outline<br />
1. Technical challenges hll in determining dt ii <strong>plankton</strong> trace metal tl<br />
<strong>stoichiometry</strong><br />
2. Overview <strong>of</strong> “bulk <strong>plankton</strong>” metal <strong>stoichiometry</strong><br />
3. Phyto<strong>plankton</strong>‐specific metal <strong>stoichiometry</strong><br />
‐ evolutionary, taxonomic, environmental influences<br />
4. Transfer efficiencies <strong>of</strong> metals to upper trophic levels.<br />
5. Metal <strong>stoichiometry</strong> & links to the <strong>marine</strong> C cycle<br />
‐ bacteria/phyto<strong>plankton</strong>/zoo<strong>plankton</strong><br />
‐ C fixation, calcification & C remineralization<br />
6. Ecological implications phyto<strong>plankton</strong> metal <strong>stoichiometry</strong><br />
7. Conclusions<br />
Armbrust (2009)
Phyto<strong>plankton</strong>‐specific metal <strong>stoichiometry</strong><br />
Taxonomic trends (Quigg et al. 2003 & Ho et al. 2003) (~ 20 fold difference):<br />
• Green superfamily (chl b): high Fe (higher PSI:PSII ratio) , Cu & Zn<br />
• Red superfamily (chl c): high Cd, Co & Mn<br />
• Prokaryotic autotrophs: high Fe, Mo, Co<br />
Geographic trends:<br />
• Coastal phyto<strong>plankton</strong> higher Fe quotas (~2 ‐ 4 fold) than oceanic<br />
(Sunda and Huntsman 1995, Maldonado and Price 1996)<br />
Environmental trends:<br />
• Metal concentrations:<br />
– Change in [Me’] by 100 X changes quota by 2‐2020 fold<br />
– <strong>Trace</strong> metal substitutions (ie. Zn, Co & Cd), 2‐5 fold<br />
• Light:<br />
– Increase metal tlquotas under low light high h (10 fold or greater) )(Finkel et al. 2006)<br />
• Macronutrient interactions (N &P): 2‐10 fold;
Taxonomic patterns <strong>of</strong> phyto<strong>plankton</strong> metal <strong>stoichiometry</strong><br />
Clear differences<br />
among taxonomic<br />
groups<br />
For modellers, using<br />
functional groups<br />
seems appropriate<br />
Growth conditions also<br />
important.<br />
t<br />
Ho et al. 2003
Interactions between trace metals and acquisition <strong>of</strong> N, C and P<br />
Price and Morel 2003<br />
-Fe limitation, high Si:N diatom (Hutchins & Bruland 98; Takeda 98; Marchetti & Harrison 2007)<br />
-Fe limitation, high cellular P (~1.5 fold, Price 2005)
Talk Outline<br />
1. Technical challenges hll in determining dt ii <strong>plankton</strong> trace metal tl<br />
<strong>stoichiometry</strong><br />
2. Overview <strong>of</strong> “bulk <strong>plankton</strong>” metal <strong>stoichiometry</strong><br />
3. Phyto<strong>plankton</strong>‐specific metal <strong>stoichiometry</strong><br />
‐ evolutionary, taxonomic, environmental influences<br />
4. Transfer efficiencies <strong>of</strong> metals to upper trophic levels.<br />
5. Metal <strong>stoichiometry</strong> & links to the <strong>marine</strong> C cycle<br />
‐ bacteria/phyto<strong>plankton</strong>/zoo<strong>plankton</strong><br />
‐ C fixation, calcification & C remineralization<br />
6. Ecological implications phyto<strong>plankton</strong> metal <strong>stoichiometry</strong><br />
7. Conclusions<br />
Armbrust (2009)
Metal assimilation efficiency by copepods feeding on phyto<strong>plankton</strong> (ie.<br />
diatoms)<br />
1. Phyto<strong>plankton</strong> cellular trace metal partitioning: extracellular, cytoplasmic & membrane bound<br />
2. Cytoplasmic trace metal pool increases by ~ 10% during stationary phase<br />
Cu<br />
Fe<br />
Co<br />
(Reinfelder & Fisher 1991, Hutchins & Bruland 1994, Chang & Reinfelder 2000)
Metal assimilation efficiency by juvenile fish feeding on copepods<br />
Copepods trace metal partitioning: s<strong>of</strong>t‐tissue & exoskeleton<br />
Elements in the s<strong>of</strong>t tissue control assimilation efficiency by juvenile fish<br />
(Reinfelder & Fisher 1994)
Talk Outline<br />
1. Technical challenges hll in determining dt ii <strong>plankton</strong> trace metal tl<br />
<strong>stoichiometry</strong><br />
2. Overview <strong>of</strong> “bulk <strong>plankton</strong>” metal <strong>stoichiometry</strong><br />
3. Phyto<strong>plankton</strong>‐specific metal <strong>stoichiometry</strong><br />
‐ evolutionary, taxonomic, environmental influences<br />
4. Transfer efficiencies <strong>of</strong> metals to upper trophic levels.<br />
5. Metal <strong>stoichiometry</strong> & links to the <strong>marine</strong> C cycle<br />
‐ bacteria/phyto<strong>plankton</strong>/zoo<strong>plankton</strong><br />
‐ C fixation, calcification & C remineralization<br />
6. Ecological implications phyto<strong>plankton</strong> metal <strong>stoichiometry</strong><br />
7. Conclusions<br />
Armbrust (2009)
Metal <strong>effect</strong>s on C fixation and calcification rates (POC / PIC)<br />
‐ Low Fe decreases growth rate & calcification rates BUT low Zn only<br />
decreases growth rates<br />
Fe<br />
Zn<br />
(Schulz et al. 2004)
<strong>Trace</strong> metal <strong>effect</strong>s on the <strong>marine</strong> C cycle:<br />
Remineralization and C trophic transfer<br />
HETEROTROPHIC BACTERIA:<br />
- higher Fe:C ratios than phyto<strong>plankton</strong><br />
- Fe limitation lowers their growth efficiency<br />
Fe case study<br />
Tortell et al. 1996
<strong>Trace</strong> metal <strong>effect</strong>s on the <strong>marine</strong> C cycle:<br />
Remineralization and C trophic transfer<br />
PROTOZOANS<br />
Fe case study<br />
- require 2-3 fold more Fe<br />
than phyto<strong>plankton</strong><br />
-their growth efficiency<br />
decreases under low Fe<br />
(34 vs. 16 %), despite<br />
faster filtration rates and<br />
ingestion rates <strong>of</strong> C<br />
Phyto<strong>plankton</strong><br />
iron-deficient ~ 3<br />
(Maldonado & Price 1996)<br />
- Fe recycling was higher<br />
when Fe limited (60 vs.<br />
85%)<br />
(Chase & Price 1997)
Changes in relative trophic position –prey selectivity<br />
Fe case study<br />
Ochromonas<br />
MIXOTROPHS<br />
- Ingesting bacteria:<br />
an <strong>effect</strong>ive way to obtain Fe when Fe<br />
is low (additional bacterial C benef<strong>its</strong>)<br />
control<br />
- Higher growth efficiency<br />
when assimilating bacterial Fe<br />
vs. assimilating dissolved Fe<br />
- Ingestion rates & clearance rates<br />
faster for Fe limited Ochromonas<br />
o Fe supplied as dissolved or bacterial Fe<br />
control T. pseudonana with bacterial Fe<br />
(Maranger et al. 1998)
Talk Outline<br />
1. Technical challenges hll in determining dt ii <strong>plankton</strong> trace metal tl<br />
<strong>stoichiometry</strong><br />
2. Overview <strong>of</strong> “bulk <strong>plankton</strong>” metal <strong>stoichiometry</strong><br />
3. Phyto<strong>plankton</strong>‐specific metal <strong>stoichiometry</strong><br />
‐ evolutionary, taxonomic, environmental influences<br />
4. Transfer efficiencies <strong>of</strong> metals to upper trophic levels.<br />
5. Metal <strong>stoichiometry</strong> & links to the <strong>marine</strong> C cycle<br />
‐ bacteria/phyto<strong>plankton</strong>/zoo<strong>plankton</strong><br />
‐ C fixation, calcification & C remineralization<br />
6. Ecological implications phyto<strong>plankton</strong> metal <strong>stoichiometry</strong><br />
7. Conclusions<br />
Armbrust (2009)
Why do pennate diatoms dominate iron‐induced blooms<br />
High<br />
[Nitrate] µM<br />
Low<br />
Alaska<br />
SERIES<br />
July 29 th , 2002<br />
Day 20<br />
Patch size = 700 km<br />
2<br />
Eifex 2004 www.awi.de/.../Pics/<strong>plankton</strong>Inside-g.gif<br />
Pseudo‐nitzschia spp.<br />
Courtesy <strong>of</strong> Jim Gower, Boyd Institute et <strong>of</strong> Ocean al. 2004 Sciences, Nature Canada
Ecological implications <strong>of</strong> phyto<strong>plankton</strong> metal <strong>stoichiometry</strong><br />
Iron requirements in oceanic pennate vs. centric diatoms<br />
a<br />
300<br />
250<br />
200<br />
150<br />
100<br />
Oceanic Pennates, Pseudo-nitzchia spp.<br />
Oceanic Centrics, Thalassiosira spp.<br />
High Fe<br />
Quota<br />
High Fe-Q<br />
(mol Fe mol C -1 )<br />
b<br />
50<br />
0<br />
14<br />
12<br />
10<br />
8<br />
6<br />
4<br />
• Pennates have higher h maximum<br />
Fe quotas than Centrics<br />
• Pennates & Centrics have<br />
similarly low minimum Fe requirements<br />
Fe-Qhigh : Fe-Qlow F<br />
Low Fe Quota<br />
Low Fe-Q<br />
(mol Fe mol C -1 )<br />
c<br />
2<br />
0<br />
60<br />
Oceanic Pennate diatoms (Pseudo-<br />
nitzschia spp.) have a higher h Fe storage<br />
Low Fe‐Q<br />
40<br />
20<br />
0<br />
capacity than oceanics (Thalassiosira spp.)<br />
High Fe‐Q :<br />
P. heimii type 1 (UBC403)<br />
P. cf. heimii type 2 (UBC303)<br />
P. dolorosa (UBC203)<br />
P. cf. turgidula (UBC103)<br />
T. oceanica (1003)<br />
T. parthenela (Thal 9)<br />
T. subtilis (50 Ait)<br />
P. multiseries (Orø13)<br />
P. cf. calliantha (NWFSC186)<br />
T. pseudonana (3H)<br />
T. weissflogii (Actin)<br />
Marchetti et al. L&O 2006
Iron storage molecule ferritin discovered in Pseudo‐nitzschia<br />
monomer<br />
multimer (24mer)<br />
• Exhib<strong>its</strong> ferroxidase<br />
activity<br />
• Stores > 600 atoms in vitro<br />
multimer<br />
(24mer) Marchetti et al. 2009
light<br />
Exudation<br />
Primary Production<br />
POM<br />
(particulate organic matter)<br />
Dissolved Organic Matter<br />
DOM<br />
Viral<br />
lysis<br />
Consumption<br />
Excretion<br />
Grazers<br />
Consumption<br />
C-Link<br />
Bacteria<br />
Euphotic zone<br />
mixing<br />
Excretion<br />
nutrient release<br />
Remineralization<br />
nutrient / CO 2 release<br />
C-Sink<br />
Phyto<strong>plankton</strong><br />
Sinking<br />
POM Export<br />
nutrients<br />
POM export<br />
Fecal pellets (egestion),<br />
sloppy feeding<br />
Deep Ocean<br />
sediments
Conclusions<br />
• Metal <strong>stoichiometry</strong> measurements are difficult, methods are evolving<br />
• Choice <strong>of</strong> biomass proxy for normalization is important<br />
t<br />
• Using functional phyto<strong>plankton</strong> p groups in models is good approach<br />
• Environmental influences must be considered<br />
• The transfer <strong>of</strong> metals across trophic levels appears well constrained<br />
• <strong>Trace</strong> metal <strong>stoichiometry</strong> may affect production, consumption &<br />
remineralization pathways<br />
• Understanding <strong>of</strong> metal <strong>stoichiometry</strong> can provide insights into ecological<br />
dynamics