

Teacher Related Indicators & EDI - DISE
Teacher Related Indicators & EDI - DISE
Teacher Related Indicators & EDI - DISE

You also want an ePaper? Increase the reach of your titles
YUMPU automatically turns print PDFs into web optimized ePapers that Google loves.
Part IV<br />
<strong>Teacher</strong>-<strong>Related</strong> <strong>Indicators</strong><br />
Introduction<br />
Apart from information on school facilities<br />
and enrolment, a good amount of<br />
information on teachers is also being<br />
collected under the <strong>DISE</strong> each year. Comprehensive data<br />
on profiles of more than 5.63 million teachers is being<br />
maintained under the <strong>DISE</strong>. This rich set of information<br />
could well be useful in developing teacher education<br />
plans by its potential users, the NCERT, SCERT, DIET and<br />
BRC faculty across the country. Many teacher indicators<br />
maintained under the <strong>DISE</strong> are also part of Quality<br />
Monitoring Tools (QMT) for elementary education under<br />
the SSA being developed by the NCERT. If needed,<br />
information on teachers can also be obtained at<br />
disaggregated levels, such as school, cluster, block,<br />
district, state and national level.<br />
The following set of indicators with respect to<br />
teachers has been analysed both at the individual state<br />
levels and as average of all<br />
states. Wherever necessary,<br />
indicators are also presented<br />
and analysed by school<br />
category. In most of the cases,<br />
besides gender-wise distribution<br />
of teachers, comprehensive<br />
information about parateachers<br />
(contractual teachers)<br />
is also presented. This renders<br />
the <strong>DISE</strong> as a singular source<br />
that disseminates detailed<br />
information on all aspects of<br />
para-teachers. This section presents the number of<br />
para-teachers by school category, their educational and<br />
professional qualifications, training status, etc. All these<br />
parameters have been analysed and presented, as also<br />
those of regular teachers. One of the other significant<br />
indicators is the percentage of teachers involved in nonteaching<br />
assignments and the average number of days<br />
of involvement in such assignments. The age<br />
distribution of teachers can also be of great help in<br />
planning for teachers’ recruitment in years to come.<br />
Among other variables, the following deserve special<br />
mention: the number of teachers by age and sex, and<br />
by school category; teachers profile by caste; number<br />
of teachers provided in-service training; pupil-teacher<br />
ratio; average number of teachers by school category;<br />
percentage of female teachers; types of teachers, etc.<br />
Wherever required, indicators have also been<br />
separately analysed in the case of Government and<br />
Private managements.<br />
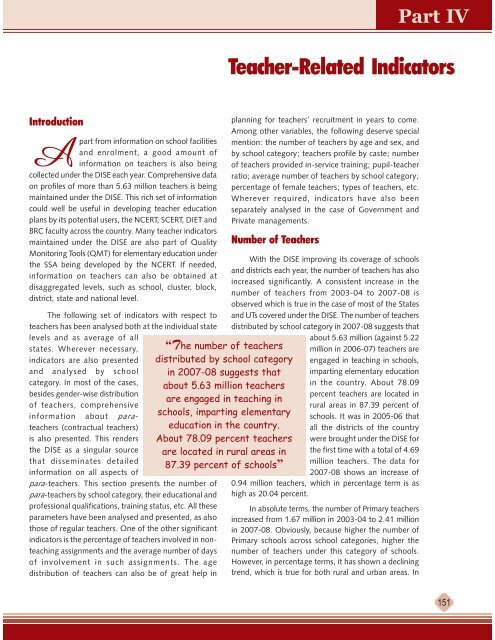
Number of <strong>Teacher</strong>s<br />
“The number of teachers<br />
distributed by school category<br />
in 2007-08 suggests that<br />
about 5.63 million teachers<br />
are engaged in teaching in<br />
schools, imparting elementary<br />
education in the country.<br />
About 78.09 percent teachers<br />
are located in rural areas in<br />
87.39 percent of schools”<br />
With the <strong>DISE</strong> improving its coverage of schools<br />
and districts each year, the number of teachers has also<br />
increased significantly. A consistent increase in the<br />
number of teachers from 2003-04 to 2007-08 is<br />
observed which is true in the case of most of the States<br />
and UTs covered under the <strong>DISE</strong>. The number of teachers<br />
distributed by school category in 2007-08 suggests that<br />
about 5.63 million (against 5.22<br />
million in 2006-07) teachers are<br />
engaged in teaching in schools,<br />
imparting elementary education<br />
in the country. About 78.09<br />
percent teachers are located in<br />
rural areas in 87.39 percent of<br />
schools. It was in 2005-06 that<br />
all the districts of the country<br />
were brought under the <strong>DISE</strong> for<br />
the first time with a total of 4.69<br />
million teachers. The data for<br />
2007-08 shows an increase of<br />
0.94 million teachers, which in percentage term is as<br />
high as 20.04 percent.<br />
In absolute terms, the number of Primary teachers<br />
increased from 1.67 million in 2003-04 to 2.41 million<br />
in 2007-08. Obviously, because higher the number of<br />
Primary schools across school categories, higher the<br />
number of teachers under this category of schools.<br />
However, in percentage terms, it has shown a declining<br />
trend, which is true for both rural and urban areas. In<br />
151
Part IV<br />
Elementary Education in India : Analytical Report<br />
percentage terms, it has declined from a high of 46.35<br />
percent in 2004-05 to 43.40 percent in 2007-08. Primary<br />
Year<br />
Number<br />
of<br />
Districts<br />
teachers. About 86 percent of Primary school teachers<br />
are located in rural areas. On the other hand, every<br />
Table D1<br />
Distribution of <strong>Teacher</strong>s by School Category: 2003-04 to 2007-08<br />
Primary<br />
Only<br />
School Category<br />
Primary<br />
Primary with Upper Upper<br />
with Upper Primary & Primary<br />
Primary Secondary/Hr. Only<br />
Secondary<br />
Number<br />
Upper<br />
Primary &<br />
Secondary/Hr.<br />
Secondary<br />
Total<br />
<strong>Teacher</strong>s<br />
2003-04 539 1674591 999855 179107 261856 304999 36,67,637<br />
2004-05 581 1854473 1144835 234576 282517 470702 41,72,287<br />
2005-06 604 2063342 1317058 270229 402161 491491 46,90,176<br />
2006-07 609 2268014 1428944 302151 546590 584877 52,18,578<br />
2007-08 624 2416539 1531542 405375 507767 664566 56,34,589<br />
Note: <strong>Teacher</strong>s in different categories may not add to total teachers because of missing values.<br />
Figure 4.1<br />
Distribution of <strong>Teacher</strong>s by Category<br />
schools have more than 2.42 million teachers (against<br />
2.27 million in 2006-07) of the total 5.63 million<br />
fourth teacher is found to be teaching in independent<br />
Elementary schools (27.50 percent). The percentage of<br />
152
<strong>Teacher</strong>-<strong>Related</strong> <strong>Indicators</strong><br />
Part IV<br />
teachers in such schools in rural and urban areas is 26.64<br />
and 30.64, respectively (Tables D-1 and D-2). This is<br />
almost the same as their respective percentages in the<br />
previous year. In other types of schools, the percentage<br />
varies between 7.28 in integrated Higher Secondary<br />
schools and 11.93 in Upper Primary attached to<br />
Secondary and Higher Secondary schools. Independent<br />
Upper Primary schools reported<br />
to have 9.12 percent of the total<br />
number of teachers.<br />
Obviously, because of the<br />
size of the state, the highest<br />
number of teachers is in Uttar<br />
Pradesh (0.64 million), that is,<br />
11.44 percent of the total<br />
teachers in the country. On the<br />
other hand, among other states,<br />
Himachal Pradesh (1.13 percent)<br />
and Uttarakhand (1.07 percent)<br />
have the least number of<br />
teachers. Delhi reported<br />
1,01,895 teachers which is 1.81<br />
percent of the total teachers imparting elementary<br />
education. It is similar to the figures for the previous<br />
year. The total number of teachers in Delhi is more than<br />
the same in a number of other states. The highest<br />
percentage of teachers among the north-eastern states<br />
is observed in Meghalaya (34,652). It is 0.62 percent of<br />
Table D2<br />
Percentage Distribution of <strong>Teacher</strong>s by Category: 2003-04 to 2007-08<br />
All Areas Rural Areas Urban Areas<br />
School<br />
Category<br />
2004 2005 2006 2007 2004 2005 2006 2007 2004 2005 2006 2007<br />
-05 -06 -07 -08 -05 -06 -07 -08 -05 -06 -07 -08<br />
Primary Only 46.35 45.27 44.19 43.40 50.08 49.11 48.38 47.44 32.79 30.80 29.28 28.75<br />
Primary with 28.61 28.79 27.84 27.50 27.88 28.09 26.89 26.64 31.58 31.44 31.27 30.64<br />
Upper Primary<br />
Primary with 5.86 5.91 5.89 7.28 3.70 4.11 3.79 4.81 14.00 12.71 13.37 16.23<br />
Upper Primary<br />
& Secondary/<br />
Hr. Secondary<br />
Upper Primary 7.06 8.88 10.65 9.12 7.90 9.02 10.80 9.65 3.99 8.37 10.11 7.19<br />
Only<br />
Upper Primary 11.76 10.79 11.40 11.93 10.25 9.34 10.13 10.55 17.46 16.26 15.91 16.97<br />
& Secondary/<br />
Hr. Secondary<br />
Note: Totals may not add to hundred because of missing values and rounding of figures.<br />
“Obviously, because of the<br />
size of the state, the highest<br />
number of teachers is in Uttar<br />
Pradesh (0.64 million), that is,<br />
11.44 percent of the total<br />
teachers in the country. Uttar<br />
Pradesh also has the highest<br />
number of teachers in Primary<br />
schools (0.46 million), which<br />
is 18.91 percent of the<br />
total Primary teachers<br />
in the country”<br />
the total teachers imparting elementary education in<br />
the country. Uttar Pradesh also has the highest number<br />
of teachers in Primary schools (0.46 million), which is<br />
18.91 percent of the total Primary teachers in the<br />
country. Lakshadweep has the least number of teachers<br />
in its 16 Primary schools (203)<br />
in 2007-08, while Delhi has<br />
29,923 (1.24 percent) teachers.<br />
All the north-eastern states<br />
reported small number of<br />
Primary school teachers. Andhra<br />
Pradesh, Bihar, Madhya Pradesh,<br />
Maharashtra, Rajasthan, Tamil<br />
Nadu and West Bengal reported<br />
higher number of Primary school<br />
teachers, matching their<br />
geographical size.<br />
The <strong>DISE</strong> data further reveals<br />
that 69.28 percent of the total<br />
teachers imparting elementary<br />
education in 2007-08 is in schools that are under the<br />
government management compared to 69.14 percent<br />
in the previous year. Another 10.35 percent are in<br />
schools under government-aided management.<br />
153
Part IV<br />
Elementary Education in India : Analytical Report<br />
Together these schools have a percentage as high as<br />
79.64 percent. This means that 8 out of 10 teachers<br />
are working either in government or aided<br />
management schools,<br />
compared to 2 out of 10 in the<br />
case of the Private Un-aided<br />
management. In a few states,<br />
such as, Bihar, Jharkhand, Orissa<br />
and Tripura, the percentage of<br />
teachers under government<br />
management is above 90. On<br />
the other hand, all the teachers<br />
in Lakshadweep are working<br />
under the Government management. Government and<br />
aided managements together in these states have<br />
about 95 percent of the total teachers. On the other<br />
“There are about 145<br />
districts across 35 States<br />
and UTs that have more<br />
than 50 percent female<br />
teachers. All schools together<br />
have had 42.72 percent female<br />
teachers in 2007-08”<br />
increased. There are about 145 districts across 35 States<br />
and UTs that have more than 50 percent female teachers.<br />
All schools together have had 42.72 percent (against<br />
41.86 percent in 2006-07) female<br />
teachers in 2007-08. Urban areas<br />
(65.23 percent) had higher<br />
percentage of female teachers<br />
than rural areas (36.51 percent)<br />
in 2007-08; this is true for all<br />
types of schools. Irrespective of<br />
the types of schools, a significant<br />
difference is also noticed in the<br />
case of female teachers in schools<br />
under private and government managements. Compared<br />
to 50.29 percent female teachers in private management<br />
schools, the corresponding percentage for government<br />
Table D3<br />
Distribution of Female <strong>Teacher</strong>s by School Category: 2004-05 to 2007-08<br />
All Areas Rural Areas Urban Areas<br />
School<br />
Category<br />
2004 2005 2006 2007 2004 2005 2006 2007 2004 2005 2006 2007<br />
-05 -06 -07 -08 -05 -06 -07 -08 -05 -06 -07 -08<br />
Primary Only 38.06 39.17 40.89 42.30 32.77 34.31 36.10 37.73 68.21 68.17 69.07 69.63<br />
Primary with 43.20 42.96 44.46 45.12 36.35 36.40 37.38 38.31 65.79 65.01 66.18 66.60<br />
Upper Primary<br />
Primary with 58.30 54.39 53.67 55.79 44.25 43.25 39.45 43.88 72.21 67.90 68.07 68.58<br />
Upper Primary<br />
& Secondary/<br />
Hr. Secondary<br />
Upper Primary 25.89 34.05 38.52 35.36 22.59 27.28 31.84 29.78 50.14 61.25 64.00 62.51<br />
Only<br />
Upper Primary 37.76 36.09 36.29 37.91 30.42 28.19 28.97 30.96 53.93 53.01 52.91 53.58<br />
& Secondary/<br />
Hr. Secondary<br />
All Schools 39.78 40.33 41.86 42.72 33.12 34.00 35.39 36.51 64.75 64.02 64.94 65.23<br />
hand, in a few states, such as Chandigarh, Delhi, Jammu<br />
& Kashmir, Madhya Pradesh, Rajasthan, Manipur and<br />
Nagaland, the percentage of teachers under the Private<br />
Un-aided management is high.<br />
Female <strong>Teacher</strong>s<br />
One of the provisions of the Operation Blackboard<br />
scheme was to ensure that one of the teachers appointed<br />
would preferably be female. Over a period of time, the<br />
percentage of female teachers across types of school has<br />
schools has been low at 38.62 (37.39 in 2006-07) (Tables<br />
D-3 and D-4).<br />
More than 80 percent of the total teachers in<br />
private managed (all categories) schools in Chandigarh<br />
(90.88 percent), Delhi (81.27 percent) and Tamil Nadu<br />
(81.63 percent), are female teachers. The percentage<br />
of female teachers under such managements is also high<br />
in the states like the Andaman and Nicobar Islands (78<br />
percent), Dadra and Nagar Haveli (71 percent), Goa (75<br />
percent), Himachal Pradesh (64 percent), Kerala (72<br />
154
<strong>Teacher</strong>-<strong>Related</strong> <strong>Indicators</strong><br />
Part IV<br />
percent), Punjab (75 percent) and Karnataka (68.73<br />
percent). Chandigarh also has the high percentage of<br />
female teachers (75 percent) in government schools,<br />
compared to 67 percent in Kerala. The corresponding<br />
percentage for Delhi is 59.<br />
Further, it is noticed that percentage of female<br />
teachers in government managed schools (all categories)<br />
teachers in private managed schools in Puducherry (70),<br />
Punjab (75), and Tamil Nadu (82) is much higher than<br />
the same in government managed schools.<br />
The percentage of female teachers by school<br />
category across 35 States and Union Territories reveals<br />
that irrespective of the type of school,the percentage of<br />
female teachers has been satisfactory, except the<br />
Figure 4.2<br />
Percentage of Female <strong>Teacher</strong>s<br />
is higher than the same in private managed schools in<br />
Assam, Bihar, Maharashtra and Uttar Pradesh. However,<br />
the percentage of female teachers in government<br />
managed schools in Bihar has<br />
been low at 36.95, compared to<br />
31.91 in West Bengal and 28.21<br />
in Rajasthan, all of which have<br />
shown improvement over the<br />
previous year. On the other<br />
hand, in a few other states, the<br />
percentage of female teachers in<br />
government managed schools<br />
has been above 50 of the total<br />
strength of teachers. Puducherry<br />
(50 percent), Punjab (59 percent) and Tamil Nadu (65<br />
percent) are such states. The percentage of female<br />
“In a few states, the<br />
percentage of female<br />
teachers in government<br />
managed schools has been<br />
above 50 of the total<br />
strength of teachers.<br />
Puducherry, Punjab and<br />
Tamil Nadu are such states”<br />
integrated Higher Secondary schools. In Higher Secondary<br />
schools, female teachers outnumber their male<br />
counterparts with a percentage of 55.79. The percentage<br />
of female teachers in such schools<br />
in urban areas is as high as 68.58,<br />
compared to 43.88 in rural areas.<br />
The percentage of female<br />
teachers in Higher Secondary<br />
schools under private<br />
management has been 59.47,<br />
compared to 47.91 in schools<br />
managed by government.<br />
However, a few states like<br />
Arunachal Pradesh (30 percent),<br />
Bihar (29 percent), Jharkhand (28 percent), Rajasthan (29<br />
percent), Tripura (29 percent), Uttar Pradesh (43 percent),<br />
155
Part IV<br />
Elementary Education in India : Analytical Report<br />
Map 4.1<br />
156
<strong>Teacher</strong>-<strong>Related</strong> <strong>Indicators</strong><br />
Part IV<br />
and West Bengal (42 percent), have had a very low<br />
percentage of female teachers in this category. On the<br />
other hand, in Delhi (64 percent), Karnataka (59 percent),<br />
Puducherry (48 percent) and Kerala (68 percent), the<br />
majority of teachers in integrated Higher Secondary<br />
schools are female. The North-Eastern states of<br />
Meghalaya (60 percent) and Mizoram (59 percent) also<br />
have high percentage of female teachers in such schools.<br />
However, it is Chandigarh that has the highest percentage<br />
of female teachers (75) in Higher Secondary schools.<br />
Table D4<br />
Distribution of Female <strong>Teacher</strong>s by School Category and Management: 2004-05 to 2007-08<br />
School<br />
Category<br />
Percentage<br />
All Government Managements<br />
All Private Managements<br />
2004-05 2005-06 2006-07 2007-08 2004-05 2005-06 2006-07 2007-08<br />
Primary Only 34.31 35.58 37.30 38.79 58.65 57.03 57.74 57.99<br />
Primary with 39.42 39.38 40.56 41.24 52.99 51.64 52.65 53.32<br />
Upper Primary<br />
Primary with Upper 46.39 45.97 44.53 47.91 64.94 59.72 58.84 59.47<br />
Primary & Secondary/<br />
Hr. Secondary<br />
Upper Primary Only 24.76 28.73 32.00 31.27 29.83 45.95 49.90 43.78<br />
Upper Primary with 36.70 34.26 34.65 36.60 39.10 37.99 37.94 39.65<br />
Secondary & Higher<br />
Secondary<br />
All Schools 34.56 35.77 37.39 38.62 47.97 47.72 49.69 50.29<br />
In Elementary (Primary with Upper Primary)<br />
schools, the percentage of female teachers (45.12) has<br />
been a bit higher than the same in the Primary schools<br />
(42.30 percent). On the other hand, the percentage of<br />
female teachers in independent<br />
Upper Primary schools has been<br />
only 35.36. A few states, such<br />
as the Andaman and Nicobar<br />
Islands (72.73 percent),<br />
Chandigarh (92.86 percent),<br />
Delhi (52.35 percent), Goa<br />
(60.17 percent), Gujarat (56.18<br />
percent), Karnataka (52.70<br />
percent), Kerala (70.59 percent),<br />
Jharkhand (69.29 percent) and<br />
Tamil Nadu (71.16 percent), have more female teachers<br />
in such schools than male teachers. Punjab too has a<br />
high percentage (49.65 percent) of female teachers in<br />
“A few states, such as the<br />
Andaman and Nicobar Islands,<br />
Chandigarh, Delhi, Goa,<br />
Gujarat, Karnataka, Kerala,<br />
Jharkhand and Tamil Nadu<br />
have more female teachers<br />
in Primary schools than<br />
male teachers”<br />
this school category. In Upper Primary attached to<br />
Secondary and Higher Secondary schools, the<br />
percentage of female teachers has been about 37.91<br />
(Rural, 30.96 percent and Urban, 53.58 percent).<br />
Gujarat (65 percent), Karnataka (50 percent), Kerala (70<br />
percent), Chandigarh (84 percent) and the Andaman<br />
and Nicobar Islands (56 percent) have a very high<br />
percentage of female teachers in this category of schools.<br />
So far as Primary schools are concerned, more than one<br />
out of every three teachers is female (42.30 percent).<br />
However, in the states of Arunachal Pradesh (37.32<br />
percent), Bihar (38.78 percent against 28.41 percent in<br />
2006-07), Chhattisgarh (31.05 percent), Jharkhand<br />
(26.99 percent), Madhya Pradesh (32.12 percent),<br />
Rajasthan (29.29 percent), Uttar<br />
Pradesh (39.83 percent) and<br />
West Bengal (29.36 percent),<br />
female teachers are in minority<br />
and their number is much lower<br />
than that of their male<br />
counterparts. On the other<br />
hand, in states like Kerala (74.37<br />
percent) and Tamil Nadu (78.48<br />
percent), the majority of Primary<br />
school teachers is female. The<br />
Andaman and Nicobar Islands (57.66 percent), Daman<br />
and Diu (73.10 percent), Goa (83.72 percent),<br />
Chandigarh (78.88 percent), Delhi (68.60 percent),<br />
157
Part IV<br />
Elementary Education in India : Analytical Report<br />
Punjab (65.10 percent, Puducherry (64.859 percent),<br />
Uttarakhand (54.36 percent) and Meghalaya (51.66<br />
percent) have a high percentage of female teachers in<br />
their Primary schools.<br />
percent of schools, no female teacher has been posted.<br />
The percentage of schools without female teachers is<br />
as high as 21.05 (against 38.07 in 2006-07) in the state<br />
of Bihar, 37.17 in Madhya Pradesh, 36.23 in<br />
Figure 4.3<br />
Percentage of Female <strong>Teacher</strong>s in Primary & All Schools<br />
Despite significant improvement in the availability<br />
of female teachers in Elementary schools, there may be<br />
a few schools without female teachers. Percentage of<br />
such schools has been analysed, based on schools having<br />
two and more teachers. As many<br />
as 27.16 percent of the<br />
Elementary schools, did not have<br />
any female teacher in 2007-08,<br />
compared to 28.26 percent such<br />
schools in the year 2006-07. The<br />
percentage of such schools in<br />
urban areas has been low at 8.61<br />
against 29.84 in rural areas.<br />
About 96 percent of schools<br />
without female teachers are<br />
located in rural areas. A<br />
significant difference is also noticed in the case of schools<br />
managed by government (28.69 percent) and private<br />
management (21.03 percent). Again, in the case of<br />
Primary schools, it is noticed that in as many as 28.57<br />
“As many as 27.16 percent of<br />
the Elementary schools, did<br />
not have any female teacher in<br />
2007-08, compared to 28.26<br />
percent such schools in the<br />
year 2006-07. The percentage<br />
of such schools in urban areas<br />
has been low at 8.61 against<br />
29.84 in rural areas”<br />
Chhattisgarh, 36.25 in Jammu & Kashmir, 49.07 in<br />
Jharkhand, 60.45 in Tripura and 35.11 in West Bengal.<br />
Rajasthan (31.45 percent) and Uttar Pradesh (19.11<br />
percent) too have a large number of Primary schools<br />
without female teachers. Except<br />
Delhi, Kerala, Puducherry,<br />
Lakshadweep, Punjab, Sikkim<br />
and Tamil Nadu, in most of the<br />
other states, the number of<br />
Primary schools without female<br />
teachers is above 20 percent.<br />
The percentage of such schools<br />
is only 0.67 in Kerala and 8.15<br />
in Tamil Nadu. Chandigarh did<br />
not have any Primary school<br />
without female teacher in 2007-<br />
08, which is also true for other types of schools. So far<br />
as independent Upper Primary schools are concerned,<br />
in as many as 37.51 percent schools, no female teacher<br />
is posted. Further, it has been observed that irrespective<br />
158
<strong>Teacher</strong>-<strong>Related</strong> <strong>Indicators</strong><br />
Part IV<br />
of the type of school, a large number of schools in the<br />
country do not have female teacher. This is applicable<br />
to Elementary schools (19.90 percent) and integrated<br />
Higher Secondary schools (13.83<br />
percent).<br />
The total number of<br />
teachers presented above is not<br />
expected to provide information<br />
on teachers in an individual type<br />
of school. For this purpose, the<br />
average number of teachers by<br />
school category is analysed. Its<br />
data is presented in Table D-3.<br />
Average Number of <strong>Teacher</strong>s<br />
The average number of teachers in a school<br />
imparting elementary education has shown consistent<br />
improvement over a period of time. Such schools/sections<br />
have had more teachers in 2007-08 than in the previous<br />
year. This also applies to all types of schools. By and large,<br />
this is also true for rural and urban areas, barring<br />
School<br />
Category<br />
“Average number of teachers<br />
in a school imparting<br />
elementary education has<br />
shown consistent improvement<br />
over a period of time. Such<br />
schools/sections have had<br />
more teachers in 2007-08<br />
than in the previous year”<br />
significant difference is noticed in the availability of<br />
teachers in rural (4.0) and urban areas (7.9). Schools in<br />
rural areas have fewer teachers than schools in urban<br />
areas and the difference is<br />
significant. A wide difference is<br />
also seen between schools<br />
managed by government (3.9)<br />
and private management (7.2).<br />
The average number of teachers<br />
in government schools is a little<br />
less than half of the average in<br />
private managed schools. The<br />
average number of teachers by<br />
school category reveals that the<br />
highest number of teachers per school is observed in<br />
integrated Higher Secondary schools (11.5), followed by<br />
Upper Primary attached to Secondary and Higher<br />
Secondary schools (10.2), independent Elementary (7.1),<br />
and Upper Primary (4.4) schools. However, despite<br />
improvement, the lowest percentage is noticed in Primary<br />
schools (3.0 teachers) which is almost as much as in the<br />
previous year (2.9 teachers per school).<br />
Table D5<br />
Average Number of <strong>Teacher</strong>s by School Category: 2004-05 to 2007-08<br />
All Areas Rural Areas Urban Areas<br />
2004 2005 2006 2007 2004 2005 2006 2007 2004 2005 2006 2007<br />
-05 -06 -07 -08 -05 -06 -07 -08 -05 -06 -07 -08<br />
Primary Only 2.7 2.8 2.9 3.0 2.6 2.7 2.8 2.8 4.6 4.6 4.7 4.8<br />
Primary with 6.6 6.7 6.9 7.1 6.2 6.3 6.4 6.6 8.6 8.4 8.6 8.9<br />
Upper Primary<br />
Primary with 10.9 10.3 10.7 11.5 9.2 8.9 8.8 9.7 13.4 12.5 13.7 14.4<br />
Upper Primary<br />
& Secondary/<br />
Hr. Secondary<br />
Upper Primary 4.0 4.6 5.1 4.4 3.8 4.1 4.5 4.0 5.5 9.1 10.1 7.9<br />
Only<br />
Upper Primary 9.0 9.1 9.4 10.2 8.0 8.0 8.4 9.2 12.1 12.4 12.6 13.2<br />
& Secondary/<br />
Hr. Secondary<br />
All Schools 4.0 4.2 4.4 4.5 3.6 3.8 3.9 4.0 7.3 7.4 7.7 7.9<br />
independent Upper Primary schools which had a slightly<br />
less number of teachers in 2007-08 than in the previous<br />
year. The all-India average of all states reveals that in<br />
2007-08, there were 4.5 teachers (4.4 teachers in 2006-<br />
07) in a school that imparts elementary education. A<br />
It is interesting to note that all the states have<br />
reported an average of three and more teachers in<br />
schools that impart elementary education across the<br />
county, but the same is not true for all types of schools.<br />
On the other hand, none of the major states reported<br />
159
Part IV<br />
Elementary Education in India : Analytical Report<br />
fewer than two teachers. This is true for all types of<br />
schools, including Primary schools. Among the states,<br />
Delhi has the highest average number of teachers<br />
(21.5) and Chhattisgarh (3.1),<br />
the lowest average. Madhya<br />
Pradesh too has a low (3.3)<br />
average number of teachers in<br />
its Elementary schools. Kerala<br />
with 13 teachers and<br />
Chandigarh with 31 teachers<br />
too have a very high average<br />
number of teachers, compared<br />
to 4.8 teachers in Bihar (4.3 in<br />
previous year). All the states in<br />
the north-eastern region have<br />
adequate number of teachers in their schools. The<br />
states, such as Gujarat (6.0), Maharashtra (6.6),<br />
“A ll-India average of all<br />
states reveals that in<br />
2007-08, there were<br />
4.5 teachers in a school<br />
that imparts elementary<br />
education. A significant<br />
difference is noticed in the<br />
availability of teachers in<br />
rural and urban areas”<br />
Figure 4.4<br />
Average Number of <strong>Teacher</strong>s by School Category<br />
Like teachers in other types of schools, the average<br />
number of teachers in Primary schools also has shown<br />
an increasing trend during the period from 2004-05 to<br />
2007-08. On an average,<br />
Primary schools in India have<br />
now more than two teachers.<br />
This is also true for rural areas<br />
and also such schools under the<br />
government management. This<br />
clearly reflects the effect of the<br />
initiatives made under the SSA.<br />
This is likely to improve further<br />
as a number of teachers’<br />
positions under the SSA have<br />
been recently approved by the<br />
PAB. In addition, the states have also initiated the process<br />
of filling up of vacant positions.<br />
Manipur (6.2), Mizoram (5.9) and Sikkim (7.3), have<br />
on an average more than 5 teachers. Tamil Nadu<br />
reported an average of 5.9 teachers and West Bengal,<br />
3.9 teachers in schools that impart Elementary<br />
education. Lakshadweep too reported an average of<br />
14.9 teachers and has a high average across school<br />
categories.<br />
Primary schools have had an average of 3.0<br />
teachers per school in 2007-08 against 2.9 teachers per<br />
school in 2006-07 and 2.8 teachers in 2005-06. Schools<br />
located in rural areas had an average of 2.8 teachers,<br />
compared to 4.8 teachers in schools located in urban<br />
areas. The disparity noticed in rural and urban areas and<br />
also in government and private managed schools is also<br />
160
<strong>Teacher</strong>-<strong>Related</strong> <strong>Indicators</strong><br />
Part IV<br />
true for all other types of schools. Except Arunachal<br />
Pradesh (1.89), all other states have an average of more<br />
than 2 teachers per school in Primary classes. In Kerala,<br />
the average per school is as high<br />
as 6.7 teachers at this level; in<br />
Chandigarh it is 14.7, and in<br />
Delhi 12.2. Lakshadweep also<br />
reported a high average of 12.7<br />
teachers in its Primary schools<br />
which is also true for all other<br />
types of schools, as also for rural<br />
and urban areas. In Jharkhand,<br />
the average number of Primary<br />
teachers per school is 2.2,<br />
compared to 2.5 in Goa. All<br />
Primary schools in Bihar have had an average of 3.7<br />
teachers (3.4 in previous year), compared to 2.2 teachers<br />
in Rajasthan and 3.0 in Andhra Pradesh. The average is<br />
as high as 5.9 in Nagaland, 6.1 in Puducherry, 5.0 in<br />
Sikkim and 4.0 in Tripura. West Bengal also reported an<br />
average of about 3 teachers in its Primary schools.<br />
the average number of teachers in governmentmanaged<br />
Primary schools has been lower than the<br />
national average of 2.8 teachers. In the states of<br />
Chhattisgarh (2.5 teachers),<br />
Dadra and Nagar Haveli (2.0<br />
teachers), Goa (2.1 teachers),<br />
Himachal Pradesh (2.5 teachers),<br />
Jammu and Kashmir (2.4<br />
teachers), Jharkhand (2.2<br />
teachers), Karnataka (2.2<br />
teachers), Madhya Pradesh (2.4<br />
teachers), Rajasthan (2.0<br />
teachers), Uttarakhand (2.1<br />
teachers), etc, the average<br />
number of teachers is lower than<br />
2.8 in government managed Primary schools. Except<br />
Arunachal Pradesh and Meghalaya, all other states in<br />
the north-eastern region have higher number of teachers<br />
in their Primary schools than the national average. The<br />
private managed Primary schools in these states and all<br />
other states have had more than two teachers. Rajasthan<br />
Table D6<br />
Average Number of <strong>Teacher</strong>s by School Category and Management: 2004-05 to 2007-08<br />
School<br />
Category<br />
“On an average, Primary<br />
schools in India have more<br />
than two teachers. This is<br />
also true for rural areas<br />
and also such schools under<br />
the government management.<br />
This clearly reflects the<br />
effect of the initiatives<br />
made under the SSA”<br />
Percentage<br />
All Government Managements<br />
All Private Managements<br />
2004-05 2005-06 2006-07 2007-08 2004-05 2005-06 2006-07 2007-08<br />
Primary Only 2.5 2.6 2.7 2.8 4.8 4.7 4.4 4.5<br />
Primary with 6.2 6.3 6.4 6.7 8.1 7.9 8.0 8.1<br />
Upper Primary<br />
Primary with Upper 10.6 10.1 10.3 11.2 11.1 10.4 11.0 11.7<br />
Primary & Secondary/<br />
Hr. Secondary<br />
Upper Primary Only 3.8 4.0 4.2 3.8 4.8 6.8 7.8 6.5<br />
Upper Primary with 8.0 7.9 8.4 9.5 10.3 10.7 10.6 11.2<br />
Secondary & Higher<br />
Secondary<br />
All Schools 3.5 3.6 3.7 3.9 7.1 7.1 7.1 7.2<br />
The analysis further reveals that, irrespective of<br />
the type of school and state, private managed schools<br />
have generally better average number of teachers per<br />
school than government managed schools. Compared<br />
to 2.8 teachers in government managed Primary schools,<br />
the corresponding number in private managed schools<br />
is as high as 4.5 teachers. In about 18 States and UTs,<br />
has significantly high average number of teachers, i.e.,<br />
4.4 teachers in every private managed Primary school.<br />
The average number of teachers in Primary schools in<br />
Tripura has been high at 8.3 which is the fourth highest<br />
among all the states that reported the <strong>DISE</strong> data in 2007-<br />
08. Kerala too has an average of 7.3 teachers in the<br />
private managed Primary schools, compared to 9.8 in<br />
161
Part IV<br />
Elementary Education in India : Analytical Report<br />
Delhi and 18.3 in Chandigarh. Maharashtra also reported<br />
an average of almost 7.5 teachers in its Primary schools.<br />
Arunachal Pradesh which reported a low overall average<br />
of 2.0 teachers has had an average of 7.0 teachers in<br />
private managed Primary schools when only 1.8 percent<br />
of schools under government management reported<br />
such an average.<br />
teacher ratio in 2007-08 is observed to be in the case of<br />
Primary schools (37: 1), followed by Elementary schools<br />
(34:1), integrated Higher Secondary schools and<br />
independent Upper Primary schools (29:1), and Upper<br />
Primary attached to Secondary & Higher Secondary<br />
schools (27:1). It is important to note that the PTR at<br />
Primary and Upper Primary levels of education is 34:1<br />
Figure 4.5<br />
Average Number of <strong>Teacher</strong>s in Primary School<br />
Pupil-<strong>Teacher</strong> Ratio<br />
“Average number of teachers<br />
in Primary schools in Tripura<br />
has been high at 8.3 which<br />
is the fourth highest among<br />
all the states that reported<br />
<strong>DISE</strong> data in 2007-08. Kerala<br />
too has an average of 7.3<br />
teachers in the private<br />
managed Primary schools”<br />
One of the important indicators that influence<br />
classroom transaction is the<br />
pupil-teacher ratio. The data is<br />
presented by school category in<br />
Table D-7 to D-9. Irrespective of<br />
the type of school, an<br />
improvement in pupil-teacher<br />
ratio has been noticed during the<br />
period 2004-05 to 2007-08.<br />
However, there are about 151<br />
districts which still have a pupilteacher<br />
ratio above 40:1 most of<br />
the districts of Bihar and<br />
Jharkhand falls under this category. The highest pupiland<br />
31:1 respectively, compared to 36:1 and 32:1 during<br />
the previous year. At Primary level, there are only four<br />
states (Bihar, Jharkhand, Uttar Pradesh and West Bengal)<br />
which reported a PTR above 40;<br />
in the rest of the states the<br />
position is quite comfortable. At<br />
Upper Primary level, the PTR<br />
varies from 14 students per<br />
teacher in Mizoram to 59<br />
students per teacher in Bihar.<br />
Bihar too has a high (54:1) PTR<br />
at Primary level of education.<br />
The state has a high pupilteacher<br />
ratio of 51:1 even in the<br />
case of schools managed by<br />
Private aided managements. The corresponding ratio<br />
162
<strong>Teacher</strong>-<strong>Related</strong> <strong>Indicators</strong><br />
Part IV<br />
for Uttar Pradesh has also been high at 51:1. In Bihar, it<br />
is not only the PTR that is high but it has also reported<br />
School<br />
Category<br />
the state, pupil-teacher ratio is expected to improve in<br />
the year that follows.<br />
Table D7<br />
Pupil-<strong>Teacher</strong> Ratio by School Category: 2004-05 to 2007-08<br />
All Areas Rural Areas Urban Areas<br />
2004 2005 2006 2007 2004 2005 2006 2007 2004 2005 2006 2007<br />
-05 -06 -07 -08 -05 -06 -07 -08 -05 -06 -07 -08<br />
Primary Only 42 40 39 37 44 41 39 37 37 36 36 35<br />
Primary with 36 35 34 34 37 35 35 34 35 34 33 33<br />
Upper Primary<br />
Primary with 31 30 29 27 31 30 30 26 32 30 29 27<br />
Upper Primary<br />
& Secondary/<br />
Hr. Secondary<br />
Upper Primary 31 30 29 31 32 31 30 31 29 26 26 31<br />
Only<br />
Upper Primary 31 30 27 25 33 31 28 25 28 27 25 24<br />
& Secondary/<br />
Hr. Secondary<br />
All Schools 38 36 34 33 39 37 35 33 33 32 31 31<br />
Figure 4.6<br />
Pupil-<strong>Teacher</strong> Ratio in Primary Schools<br />
a high student-classroom ratio of 96. With the<br />
appointment of a large number of teachers recently in<br />
On the other hand, all category schools together<br />
had a pupil-teacher ratio of 33 in 2007-08, compared<br />
163
Part IV<br />
Elementary Education in India : Analytical Report<br />
Map 4.2<br />
164
<strong>Teacher</strong>-<strong>Related</strong> <strong>Indicators</strong><br />
Part IV<br />
Sl.<br />
No.<br />
Table D8<br />
Pupil-<strong>Teacher</strong> Ratio at Primary and Upper Primary Levels of Education: 2006-07 and 2007-08<br />
State/UT<br />
Primary Level<br />
Upper Primary<br />
Level<br />
All<br />
Category<br />
Schools<br />
Number<br />
of<br />
Districts<br />
where<br />
PTR is<br />
Above<br />
40 : All<br />
Schools<br />
2006-07 2007-08 2006-07 2007-08 2007-08 2007-08<br />
1 A & N Islands 15 15 15 16 15 0<br />
2 Andhra Pradesh 25 24 19 19 21 0<br />
3 Arunachal Pradesh 22 20 22 22 20 0<br />
4 Assam 28 27 19 19 24 0<br />
5 Bihar 65 54 67 59 54 36<br />
6 Chandigarh 24 25 23 24 24 0<br />
7 Chhattisgarh 29 30 21 22 28 0<br />
8 D & N Haveli 45 36 46 38 36 0<br />
9 Daman & Diu 31 31 41 31 30 0<br />
10 Delhi 26 25 21 20 24 0<br />
11 Goa 25 20 26 20 19 0<br />
12 Gujarat 35 33 36 33 33 0<br />
13 Haryana 36 32 28 23 28 1<br />
14 Himachal Pradesh 19 18 18 17 17 0<br />
15 Jammu & Kashmir 16 16 17 16 16 0<br />
16 Jharkhand 49 47 48 45 45 17<br />
17 Karnataka 32 30 34 33 30 2<br />
18 Kerala 26 23 28 22 22 0<br />
19 Lakshadweep 18 21 23 19 20 0<br />
20 Madhya Pradesh 39 37 32 31 36 14<br />
21 Maharashtra 27 27 31 30 27 0<br />
22 Manipur 21 20 20 19 19 0<br />
23 Meghalaya 19 18 17 16 17 0<br />
24 Mizoram 16 16 12 14 14 0<br />
25 Nagaland 24 20 25 24 19 0<br />
26 Orissa 32 26 39 35 29 0<br />
27 Puducherry 25 20 24 19 18 0<br />
28 Punjab 36 38 27 29 32 3<br />
29 Rajasthan 32 30 29 28 29 1<br />
30 Sikkim 12 14 18 19 14 0<br />
31 Tamil Nadu 31 30 26 34 31 0<br />
32 Tripura 23 22 23 23 22 0<br />
33 Uttar Pradesh 55 52 48 45 50 60<br />
34 Uttarakhand 27 28 26 23 25 1<br />
35 West Bengal 45 45 62 57 48 16<br />
All States 36 34 32 31 33 151<br />
165
Part IV<br />
Elementary Education in India : Analytical Report<br />
to 34 in 2006-07. The corresponding figures in rural<br />
and urban areas are 33 and 31 respectively. This also<br />
shows an improvement over the previous year. The<br />
Table D10<br />
Percentage of Schools having PTR Above 100 by School Category: 2004-05 to 2007-08<br />
School<br />
All Areas Rural Areas Urban Areas<br />
Category 2004 2005 2006 2007 2004 2005 2006 2007 2004 2005 2006 2007<br />
-05 -06 -07 -08 -05 -06 -07 -08 -05 -06 -07 -08<br />
Primary Only 8.32 5.93 5.21 4.11 8.66 6.05 5.20 4.13 4.94 4.68 5.38 3.89<br />
Primary with 4.82 3.76 4.49 3.31 5.08 3.69 4.15 3.09 3.73 4.09 5.89 4.24<br />
Upper Primary<br />
Primary with 4.46 3.98 5.27 3.39 4.39 4.02 4.65 2.87 4.58 3.94 6.23 4.22<br />
Upper Primary<br />
& Secondary/<br />
Hr. Secondary<br />
Upper Primary 4.96 4.90 4.95 4.65 5.08 5.10 5.07 4.77 3.80 3.08 3.89 3.50<br />
Only<br />
Upper Primary 5.32 4.62 3.11 1.93 6.05 5.15 3.26 2.07 3.19 3.03 2.64 1.51<br />
& Secondary/<br />
Hr. Secondary<br />
All Schools 7.14 5.30 4.94 3.86 7.61 5.49 4.91 3.88 4.33 4.16 5.17 3.72<br />
Note: Totals may not add to hundred because of missing values and rounding of figures.<br />
a pupil-teacher ratio of 24: 1 and Puducherry, 18:1. All<br />
the states from the north-eastern region also have a<br />
comfortable pupil-teacher ratio of 25: 1.<br />
Table D9<br />
Pupil-<strong>Teacher</strong> Ratio by School Category and by Management: 2004-05 to 2007-08<br />
School All Government Managements All Private Managements<br />
Category 2004-05 2005-06 2006-07 2007-08 2004-05 2005-06 2006-07 2007-08<br />
Primary Only 44 4 1 39 37 35 34 35 34<br />
Primary with 39 3 6 36 35 31 31 31 31<br />
Upper Primary<br />
Primary with Upper 29 3 0 28 25 31 30 30 27<br />
Primary & Secondary/<br />
Hr. Secondary<br />
Upper Primary Only 30 3 0 29 31 35 32 29 31<br />
Upper Primary with 30 2 7 24 27 28 32 29 22<br />
Secondary & Hr.<br />
Secondary<br />
All Schools 40 3 7 36 34 31 32 31 29<br />
government managed schools have a slightly higher<br />
pupil-teacher ratio (34) than the same in the private<br />
managed schools (29). The states like Arunachal Pradesh<br />
(20: 1), Himachal Pradesh (17: 1), Jammu and Kashmir<br />
(16: 1), Karnataka (30: 1), Kerala (22:1) and Tamil Nadu<br />
(31:1), have an ideal pupil-teacher ratio. Delhi reported<br />
Despite improvement in pupil-teacher ratio across<br />
school types, there are still a few schools that have<br />
reported a PTR of more than 100. About 3.88 percent<br />
schools located in rural areas have the PTR above 100,<br />
compared to 3.72 percent in urban areas. In as many as<br />
4.11 percent of Primary schools, the pupil-teacher ratio<br />
166
<strong>Teacher</strong>-<strong>Related</strong> <strong>Indicators</strong><br />
Part IV<br />
is above 100 (rural 4.13 and urban 3.89 percent). The<br />
percentage in government schools (3.98 percent) having<br />
Elementary schools, 3.39 percent integrated Higher<br />
Secondary schools and 1.93 percent Upper Primary<br />
Figure 4.7<br />
Percentage of Schools with PTR Above 100<br />
Table D11<br />
Percentage of Schools having PTR Above 100 by<br />
School Category and Management: 2004-05 to 2007-08<br />
Percentage<br />
School<br />
Category All Government Managements All Private Managements<br />
2004-05 2005-06 2006-07 2007-08 2004-05 2005-06 2006-07 2007-08<br />
Primary Only 8.51 5.94 5.07 3.98 6.37 5.80 6.24 5.04<br />
Primary with Upper 5.06 3.59 3.95 2.65 4.03 4.27 5.91 4.91<br />
Primary<br />
Primary with Upper 4.05 3.51 4.29 2.73 4.69 4.29 5.84 3.71<br />
Primary & Secondary/<br />
Hr. Secondary<br />
Upper Primary Only 4.20 4.48 4.62 4.40 8.28 6.53 6.03 5.54<br />
Upper Primary with 4.54 3.42 2.67 2.28 6.44 6.13 3.61 1.47<br />
Secondary & Hr.<br />
Secondary<br />
All Schools 7.39 5.33 4.76 3.72 5.73 5.28 5.70 4.44<br />
the PTR more than 100 and is lower than in private<br />
managed schools (5.04 percent). On the other hand,<br />
4.65 percent Upper Primary schools, 3.31 percent<br />
attached to Higher Secondary schools also have had<br />
pupil-teacher ratio above 100 (Tables D-10 and D-11).<br />
It is also observed that 11.40 percent Primary schools in<br />
167
Part IV<br />
Elementary Education in India : Analytical Report<br />
Uttar Pradesh have a PTR of 100 and above compared<br />
to only 0.07 percent schools in Kerala. Bihar (10.21<br />
group 18-25 years across all types of school has been<br />
low compared to the same in other age groups.<br />
Figure 4.8<br />
Percentage of Primary Schools with PTR Above 100: 2007-08<br />
percent) and Jharkhand (4.43 percent) too have a large<br />
number of such schools. Himachal and all the states from<br />
the north-eastern region have negligible number of such<br />
schools. A few states/UTs such as the Andaman &<br />
Nicobar Islands, Daman and Diu, Dadra and Nagar<br />
Haveli, Lakshadweep and Sikkim<br />
reported no such schools.<br />
Age Profile of <strong>Teacher</strong>s<br />
The percentage distribution<br />
of teachers by age groups<br />
(below 18, 18-25, 26-35, 36-45,<br />
46-55 and above 55 years) has<br />
been presented in Tables D-12<br />
and D-13.<br />
The average age of<br />
teachers across states suggests<br />
that majority of teachers in<br />
Primary schools are in the age group of 26-45 years.<br />
This also applies to other types of schools. A few teachers<br />
across all types of school are found to be below 18 years<br />
of age; both male and female teachers. Further, it has<br />
been noticed that the percentage of teachers in the age<br />
“In Bihar, it is not only the<br />
PTR that is high but it<br />
has also reported a high<br />
student-classroom ratio of 96.<br />
With the appointment of a<br />
large number of teachers<br />
recently in the state,<br />
pupil-teacher ratio is<br />
expected to improve in<br />
the year that follows”<br />
However, their percentage in the current year has<br />
improved over the previous year. In 2006-07, the<br />
percentage of male and female teachers (all categories)<br />
of age between 18 to 25 years was 12.94 and 19.67,<br />
respectively, compared to 15.29 and 22.65 percent in<br />
2007-08. The percentage is<br />
quite similar to the same in the<br />
case of teachers in Primary<br />
schools. The improvement in the<br />
percentage of young teachers<br />
(18-25 years) is because of their<br />
recruitment initiated in a few<br />
states, recently. A number of<br />
regular posts of teachers have<br />
been lying vacant across states<br />
while fresh recruitments have<br />
been initiated only in a few<br />
states. A few others have instead<br />
appointed para-teachers against<br />
regular positions. This is evident in the statistics<br />
presented in the following section.<br />
It is observed that the percentage of male teachers<br />
in the age group of above 55 years has been 4.08 and<br />
that of female teachers 2.09. All these teachers are<br />
168
<strong>Teacher</strong>-<strong>Related</strong> <strong>Indicators</strong><br />
Part IV<br />
Table D12<br />
Percentage of <strong>Teacher</strong>s Aged 55 Years and Above: 2007-08<br />
Sl. All All All All<br />
No. State/UT Schools Government Aided Unaided<br />
Schools Schools Schools<br />
1 Andaman & Nicobar Islands 1.87 2.01 0.00 1.01<br />
2 Andhra Pradesh 0.83 0.45 0.96 1.56<br />
3 Arunachal Pradesh 1.37 1.40 1.36 1.06<br />
4 Assam 2.16 2.68 0.56 1.01<br />
5 Bihar 3.98 3.93 7.22 2.06<br />
6 Chandigarh 2.61 3.00 1.34 2.07<br />
7 Chhattisgarh 5.48 6.20 7.52 1.57<br />
8 Dadra & Nagar Haveli 1.61 1.79 0.00 0.74<br />
9 Daman & Diu 3.55 4.16 6.67 0.90<br />
10 Delhi 3.89 4.68 6.48 1.73<br />
11 Goa 3.87 4.35 3.55 2.13<br />
12 Gujarat 1.13 1.01 1.81 1.56<br />
13 Haryana 1.01 0.78 1.91 1.67<br />
14 Himachal Pradesh 0.95 0.71 1.78 1.80<br />
15 Jammu & Kashmir 1.04 0.14 5.41 2.63<br />
16 Jharkhand 5.04 5.03 7.74 3.16<br />
17 Karnataka 2.64 1.16 3.61 7.02<br />
18 Kerala 0.61 0.60 0.43 2.66<br />
19 Lakshadweep 1.64 1.64 0.00 0.00<br />
20 Madhya Pradesh 4.09 4.95 10.27 2.14<br />
21 Maharashtra 1.11 1.10 1.07 1.33<br />
22 Manipur 1.99 2.25 4.69 1.06<br />
23 Meghalaya 1.44 1.84 1.26 1.12<br />
24 Mizoram 26.52 24.85 44.47 29.69<br />
25 Nagaland 0.77 0.60 0.00 1.07<br />
26 Orissa 1.03 1.03 0.90 1.12<br />
27 Puducherry 3.72 5.42 2.09 1.08<br />
28 Punjab 0.94 0.72 2.02 2.47<br />
29 Rajasthan 2.41 2.73 2.45 1.93<br />
30 Sikkim 1.12 1.15 1.60 0.87<br />
31 Tamil Nadu 0.92 0.72 1.07 1.13<br />
32 Tripura 1.73 1.47 8.59 1.90<br />
33 Uttar Pradesh 8.78 11.21 9.19 2.05<br />
34 Uttarakhand 3.60 4.05 4.35 1.86<br />
35 West Bengal 6.87 6.86 7.45 2.35<br />
All States 3.23 3.71 2.15 2.12<br />
169
Part IV<br />
Elementary Education in India : Analytical Report<br />
expected to retire in the next 2-3 years. In the case of<br />
government schools, this percentage is 3.71 (Table D-<br />
12). In the case of aided schools, the percentage is 2.15<br />
compared to 2.12 in un-aided schools. In a few states,<br />
such as Mizoram, the percentage of teachers of 55 and<br />
above is much higher than the national average i.e. 3.23<br />
percent. In view of their large number (5.63 million),<br />
the number of teachers retiring soon is also very high<br />
and the majority of them is from rural areas. The states<br />
should, therefore, undertake a thorough analysis of data<br />
on teachers and initiate steps for timely recruitment.<br />
Secondary and below. These figures are quite similar to<br />
those in the previous year (44.27 and 45.32 percent).<br />
Altogether 43.54 percent (44.71 percent in 2006-07)<br />
(all categories) of teachers, who impart elementary<br />
education in the country, are Higher Secondary and<br />
below. It may be recalled that in many states the<br />
minimum qualification that has been prescribed for a<br />
teacher is Secondary. However, a few of them with below<br />
Secondary level (2.58 percent) qualifications are also<br />
appointed. The percentage of teachers with Higher<br />
Secondary level qualification is higher in rural areas (total<br />
Table D13<br />
Percentage Distribution of <strong>Teacher</strong>s by Age Group: 2007-08<br />
Age Group<br />
All Category <strong>Teacher</strong>s<br />
All <strong>Teacher</strong>s in<br />
Total Male Female Primary Schools<br />
Below 18 1.11 0.68 1.69 1.30<br />
18 to 25 18.43 15.29 22.65 20.77<br />
26 to 35 34.11 34.21 33.98 34.97<br />
36 to 45 25.64 26.41 24.60 23.64<br />
46 to 55 16.53 18.25 14.24 15.17<br />
Above 55 3.23 4.08 2.09 3.51<br />
Note: Total may not add to hundred because of no responses and rounding of figures.<br />
Academic and Professional Qualifications of<br />
<strong>Teacher</strong>s<br />
Educational as well as professional qualifications<br />
of teachers across school types have been presented in<br />
Tables D-14 to D-16. Irrespective<br />
of the type of schools,<br />
qualifications of a good number<br />
of teachers (2.58 percent against<br />
2.92 percent in 2006-07) are<br />
below Secondary level. This is<br />
also applicable even to<br />
integrated Higher Secondary<br />
schools (2.20 percent) and<br />
Upper Primary attached to<br />
Secondary and Higher Secondary<br />
schools (1.32 percent). The<br />
distribution of all categories of<br />
teachers by educational<br />
qualifications reveals that 42.82 percent of male teachers<br />
and 44.51 percent of female teachers are Higher<br />
“About 11.40 percent Primary<br />
schools in Uttar Pradesh<br />
have a PTR of 100 and above<br />
compared to only 0.07 percent<br />
schools in Kerala. Bihar and<br />
Jharkhand too have a large<br />
number of such schools.<br />
Himachal and all the states<br />
from the north-eastern<br />
region have negligible<br />
number of such schools”<br />
46.39 percent; male 44.69 percent; and female 49.47<br />
percent) than the same in urban areas (total 34.17<br />
percent; male 31.46 percent; and female 35.60 percent).<br />
On the other hand, about 56 percent (54 percent in<br />
2006-07) male and 54 percent (53 percent in 2006-07)<br />
female teachers are Graduates<br />
and Post-Graduates (total 53.97<br />
percent). Urban areas (64.32<br />
percent against 63.16 percent in<br />
2006-07) have more Graduate<br />
and Post- Graduate teachers<br />
than the same in rural areas<br />
(52.65 percent against 51.14<br />
percent in 2006-07). Only 49.36<br />
percent female teachers are<br />
Graduates and above in rural<br />
areas, compared to 62.89<br />
percent in urban areas.<br />
Irrespective of the school type,<br />
a few teachers have even M.Phil and Ph.D degrees (total<br />
0.46 percent; male 0.41 percent; and female 0.52<br />
170
<strong>Teacher</strong>-<strong>Related</strong> <strong>Indicators</strong><br />
Part IV<br />
percent). In urban areas, the percentage of such teachers<br />
is 0.68, 0.62 and 0.64 respectively in case of male,<br />
female and all teachers together.<br />
The distribution of Primary school teachers in<br />
position by qualifications (Table<br />
D-15) reveals that majority of<br />
the teachers are Higher<br />
Secondary and below (total<br />
54.91 percent against 55.77<br />
percent in 2006-07, male 55.65<br />
percent, and female 53.89<br />
percent). About 3.54 percent<br />
male and 3.62 percent female<br />
teachers are below Secondary<br />
level and another 31.71 percent<br />
male and 30.21 percent female<br />
teachers have completed<br />
Secondary level of education.<br />
Not much difference is noticed<br />
in percentages of teachers below Secondary level in rural<br />
areas and urban areas but the same is not true in the<br />
case of teachers having Graduate and Post-Graduate<br />
degrees. Further, it is observed that percentage of female<br />
Table D14<br />
Academic Qualification of All Category Regular <strong>Teacher</strong>s: 2007-08<br />
Qualification All Areas Rural Areas Urban Areas<br />
Male Female Total Male Female Total Male Female Total<br />
Below Secondary 2.56 2.61 2.58 2.57 2.74 2.63 2.52 2.39 2.44<br />
Secondary 16.11 17.75 16.81 16.72 18.84 17.47 12.39 15.79 14.61<br />
Higher Secondary 24.15 24.15 24.15 25.40 27.89 26.29 16.55 17.42 17.12<br />
Up to Higher 42.82 44.51 43.54 44.69 49.47 46.39 31.46 35.60 34.17<br />
Secondary Level,<br />
2007-08<br />
Up to Higher 44.27 45.32 44.71 46.28 50.39 47.71 32.10 36.55 34.99<br />
Secondary Level,<br />
2006-07<br />
Graduate 37.72 35.55 36.80 36.79 32.54 35.29 43.41 40.93 41.80<br />
Post Graduate 18.50 18.65 18.56 17.66 16.82 17.36 23.59 21.96 22.52<br />
Graduate & Post 56.22 54.20 55.36 54.45 49.36 52.65 67.00 62.89 64.32<br />
Graduates, 2007-08<br />
Graduate & Post 54.49 53.25 53.97 52.61 48.38 51.14 65.91 61.68 63.16<br />
Graduates, 2006-07<br />
M.Phil/ Ph.D 0.41 0.52 0.46 0.37 0.47 0.40 0.68 0.62 0.64<br />
Others 0.44 0.64 0.52 0.38 0.53 0.43 0.76 0.83 0.80<br />
No Response 0.11 0.13 0.12 0.11 0.17 0.13 0.10 0.06 0.07<br />
Note: Totals may not add to hundred because of rounding of figures.<br />
“It is observed that<br />
percentage of female teachers<br />
having Graduate and Post-<br />
Graduate degrees is a bit<br />
higher than their male<br />
counterparts, which is true<br />
for both rural and urban<br />
areas. Only 30.27 percent of<br />
the total Primary school male<br />
teachers are Graduates<br />
against 30.62 percent such<br />
female teachers”<br />
teachers having Graduate and Post-Graduate degrees<br />
is a bit higher than their male<br />
counterparts, which is true for<br />
both rural and urban areas. Only<br />
30.27 percent of the total<br />
Primary school male teachers are<br />
Graduates against 30.62 percent<br />
such female teachers. Another<br />
13.66 percent male and 14.57<br />
percent female teachers are<br />
Post-Graduates. A few of them<br />
have even M.Phil and Ph.D<br />
degrees (0.31 percent). About<br />
54 percent Primary school<br />
teachers in urban areas have<br />
Graduate and Post-Graduate<br />
degrees against about 43 percent in rural areas. It has<br />
171
Part IV<br />
Elementary Education in India : Analytical Report<br />
also been observed that compared to teachers in Primary<br />
schools, teachers in other types of schools are better<br />
Secondary level (all teachers, 1.98 percent). About 54<br />
percent male and 46 percent female teachers in such<br />
Figure 4.9<br />
Percentage of <strong>Teacher</strong>s by Academic Qualification: All Category Regular <strong>Teacher</strong>s: 2007-08<br />
Table D15<br />
Academic Qualification of Primary School <strong>Teacher</strong>s (Regular): 2007-08<br />
Qualification All Areas Rural Areas Urban Areas<br />
Male Female Total Male Female Total Male Female Total<br />
Below Secondary 3.54 3.62 3.57 3.52 3.71 3.59 3.75 3.37 3.48<br />
Secondary 20.40 20.06 20.26 20.77 20.59 20.70 16.42 18.62 17.95<br />
Higher Secondary 31.71 30.21 31.08 32.30 32.87 32.52 25.29 22.97 23.67<br />
Up to Higher 55.65 53.89 54.91 56.59 57.17 56.81 45.46 44.96 45.10<br />
Secondary Level,<br />
2007-08<br />
Up to Higher 56.82 54.23 55.77 57.76 57.43 57.64 46.67 46.04 46.23<br />
Secondary Level,<br />
2006-07<br />
Graduate 30.02 30.62 30.27 29.40 28.03 28.90 36.73 37.67 37.39<br />
Post Graduate 13.66 14.57 14.04 13.36 13.92 13.56 16.89 16.33 16.50<br />
Graduate & Post 43.68 45.19 44.31 42.76 41.95 42.46 53.62 54.00 53.89<br />
Graduates, 2007-08<br />
Graduate & Post 42.40 44.83 43.38 41.47 41.69 41.55 52.22 52.84 52.65<br />
Graduates, 2006-07<br />
M.Phil/Ph.D 0.28 0.35 0.31 0.27 0.35 0.30 0.33 0.35 0.35<br />
Others 0.28 0.44 0.35 0.26 0.37 0.30 0.49 0.61 0.58<br />
No Response 0.11 0.14 0.12 0.12 0.16 0.13 0.10 0.08 0.08<br />
Note: Totals may not add to hundred because of rounding of figures.<br />
qualified. Only 1.98 percent male and 2.18 percent<br />
female teachers in Elementary schools are below<br />
schools are Graduates and Post-Graduates, compared<br />
to 48 percent of all teachers. In addition, about 0.29<br />
172
<strong>Teacher</strong>-<strong>Related</strong> <strong>Indicators</strong><br />
Part IV<br />
percent of total teachers in such schools possess M.Phil<br />
and Ph.D degrees. Majority of teachers in integrated<br />
Higher Secondary schools are either Graduates (male<br />
47.97 percent; and female 45.89 percent) or Post-<br />
Graduates (male 26.72 percent,<br />
and females 29.96 percent). The<br />
majority of teachers in<br />
independent Upper Primary<br />
schools is either Graduates<br />
(38.54 percent) or Post-<br />
Graduates (28.63 percent).<br />
Similar pattern is observed in the<br />
case of Upper Primary integrated with Higher Secondary<br />
schools as about 70 percent of the total teachers in such<br />
schools are either Graduates or Post Graduates.<br />
a few states, such as Assam (10.32 percent), Daman &<br />
Diu 7.07 percent), Goa (6.12 percent), Gujarat (6.98<br />
percent), Haryana (6.97 percent); Meghalaya (14.46<br />
percent); Mizoram (24.31 percent); Nagaland (14.30<br />
percent); Punjab (12.24<br />
percent); Sikkim (7.33 percent);<br />
and Tripura (30.99 percent),<br />
have a significant percentage of<br />
teachers below Secondary level.<br />
The majority of primary teachers<br />
in these and a few other states,<br />
such as Assam (56.58 percent),<br />
Daman and Diu (44.17 percent), Goa (54.73 percent),<br />
Gujarat (45.14 percent), Himachal Pradesh (40.62<br />
percent), Lakshadweep (81.77 percent), Maharashtra<br />
Table D16<br />
Professional Qualification of All Category <strong>Teacher</strong>s (Regular): 2007-08<br />
Professional All Areas Rural Areas Urban Areas<br />
Qualification Male Female Total Male Female Total Male Female Total<br />
J.B.T or Equivalent 22.99 18.87 20.94 24.54 21.59 23.26 13.71 14.05 13.57<br />
S.B.T or Equivalent 20.32 27.08 22.90 20.33 27.69 22.75 20.25 26.00 23.39<br />
B.Ed or Equivalent 33.07 31.28 31.87 31.68 27.67 29.95 41.36 37.68 37.95<br />
M.Ed or Equivalent 2.14 2.17 2.12 1.95 1.80 1.88 3.28 2.82 2.91<br />
Others 2.76 3.56 3.06 2.61 3.26 2.82 3.66 4.09 3.84<br />
No Response 18.72 17.04 19.10 18.89 17.98 19.34 17.74 15.35 18.33<br />
Note: Totals may not add to hundred because of rounding of figures.<br />
“About 54 percent Primary<br />
school teachers in urban<br />
areas have Graduate and<br />
Post-Graduate degrees<br />
against 43 percent<br />
in rural areas”<br />
Table D17<br />
Professional Qualification of Primary School <strong>Teacher</strong>s (Regular): 2007-08<br />
Qualification<br />
All Areas Rural Areas Urban Areas<br />
Male Female Total Male Female Total Male Female Total<br />
J.B.T or Equivalent 35.29 27.20 31.86 35.89 28.80 33.27 28.96 22.97 24.78<br />
S.B.T or Equivalent 19.39 27.76 22.94 19.31 27.51 22.34 20.28 28.41 25.97<br />
B.Ed or Equivalent 22.08 21.64 21.90 21.54 19.36 20.74 27.76 27.68 27.71<br />
M.Ed or Equivalent 1.13 1.30 1.20 1.08 1.14 1.10 1.70 1.70 1.70<br />
Others 2.03 3.13 2.50 1.99 2.83 2.30 2.44 3.93 3.48<br />
No Response 20.07 18.98 19.60 20.18 20.36 20.25 18.86 15.30 16.37<br />
Note: Totals may not add to hundred because of rounding of figures.<br />
Further, the state-specific distribution of teachers<br />
in Primary schools by academic qualifications reveals that<br />
(38.14) and Orissa (44.98 percent), has Secondary level<br />
qualification; this is also true for a few north-eastern<br />
173
Part IV<br />
Elementary Education in India : Analytical Report<br />
Table D18<br />
Percentage of Regular and Para-<strong>Teacher</strong>s with Professional Qualifications: 2007-08<br />
All <strong>Teacher</strong>s Only Para-<strong>Teacher</strong>s<br />
(Regular & Regular Under Under Under Under<br />
Para-<strong>Teacher</strong>s) <strong>Teacher</strong>s All Govern- Govern- All<br />
State/UT Managements ment ment Private<br />
Manage- Aided Manage-<br />
2006-07 2007-08 2006-07 2007-08 2006-07 2007-08 ments Manage- ments<br />
ments<br />
Andaman & Nicobar 97.87 97.44 97.93 97.52 94.12 90.24 91.67 100.00 80.00<br />
Islands<br />
Andhra Pradesh 85.23 85.68 92.68 93.50 39.21 42.03 41.47 72.72 57.27<br />
Arunachal Pradesh 35.02 27.78 37.21 31.97 21.42 7.78 7.15 40.00 15.74<br />
Assam 39.77 37.23 41.54 39.15 15.72 15.23 15.35 9.14 11.94<br />
Bihar 62.78 49.65 64.78 50.68 51.51 36.23 36.08 57.00 49.61<br />
Chandigarh 99.14 99.96 99.17 99.96 96.72 100.00 100.00 100.00 100.00<br />
Chhattisgarh 56.66 61.84 58.81 63.21 46.39 48.15 53.67 42.27 27.78<br />
Dadra & Nagar Haveli 86.80 95.00 87.05 94.99 79.41 100.00 100.00 100.00 100.00<br />
Daman & Diu 68.29 78.02 69.92 77.48 37.50 95.24 100.00 100.00 88.89<br />
Delhi 99.14 93.39 99.17 93.31 98.53 96.20 96.07 96.30 97.44<br />
Goa 92.34 93.59 92.48 93.78 82.29 78.57 72.73 91.18 86.05<br />
Gujarat 96.03 96.56 96.05 96.59 94.12 94.14 98.37 94.04 90.26<br />
Haryana 88.85 91.07 88.90 90.20 84.75 97.20 98.38 58.93 55.37<br />
Himachal Pradesh 92.99 91.92 95.68 94.66 77.77 77.75 78.26 100.00 67.91<br />
Jammu & Kashmir 50.72 48.67 53.18 51.55 42.10 38.69 38.76 100.00 34.61<br />
Jharkhand 67.14 63.82 86.65 84.21 36.19 38.44 38.41 48.31 40.13<br />
Karnataka 99.85 100.00 99.86 100.00 92.00 100.00 100.00 100.00 100.00<br />
Kerala 96.97 96.56 96.95 96.54 97.89 97.37 97.92 97.24 96.85<br />
Lakshadweep 88.73 98.55 88.65 98.91 100.00 33.33 33.33 100.00 100.00<br />
Madhya Pradesh 60.09 75.08 60.17 65.29 59.33 42.74 85.35 47.87 28.28<br />
Maharashtra 87.95 89.12 87.86 89.04 97.49 96.94 97.74 96.97 96.30<br />
Manipur 39.43 37.86 39.64 38.17 23.86 18.04 31.45 6.90 11.46<br />
Meghalaya 33.81 29.54 34.52 30.47 22.35 15.85 28.85 14.02 13.33<br />
Mizoram 60.48 56.62 70.61 70.33 16.61 14.61 23.20 12.20 3.77<br />
Nagaland 15.92 19.70 15.93 19.69 13.82 21.47 22.86 100.00 17.65<br />
Orissa 89.74 85.89 89.82 88.84 65.82 77.07 77.10 80.69 76.27<br />
Puducherry 93.92 89.50 94.11 89.59 86.10 84.95 90.08 100.00 75.38<br />
Punjab 93.27 96.91 93.64 97.20 74.51 79.28 79.95 79.41 74.15<br />
Rajasthan 86.00 85.04 86.10 85.16 84.99 83.59 86.45 62.90 57.53<br />
Sikkim 37.09 39.82 37.22 39.93 11.76 23.21 21.28 0.00 33.33<br />
Tamil Nadu 95.40 94.33 95.46 94.38 90.35 87.10 93.90 91.73 84.84<br />
Tripura 38.47 40.25 39.11 40.85 19.75 20.90 20.76 20.00 22.73<br />
Uttar Pradesh 75.25 73.29 88.73 86.70 35.71 34.91 34.63 55.30 58.29<br />
Uttarakhand 71.13 76.69 73.96 79.58 29.27 38.44 37.86 53.12 41.90<br />
West Bengal 71.02 66.37 75.71 74.29 22.24 18.62 18.38 22.09 22.35<br />
All States* 78.21 77.68 81.85 80.90 44.88 45.54 45.06 60.09 52.99<br />
* Percentage is computed based on all teachers including those who have not responded and reported not having professional qualification.<br />
174
<strong>Teacher</strong>-<strong>Related</strong> <strong>Indicators</strong><br />
Part IV<br />
states. On the other hand, in a few states, such as Andhra<br />
Pradesh, Chandigarh, Delhi, Puducherry, Punjab,<br />
Rajasthan, Uttar Pradesh and Uttarakhand, the majority<br />
(above 50 percent) of Primary school teachers is<br />
Graduates and above. Uttarakhand has more Post-<br />
Graduate Primary school teachers (35.92 percent) than<br />
teachers having Graduate degrees (31.47 percent) and<br />
the percentage of such female teachers is more than<br />
their male counterparts.<br />
Percentage of teachers by professional qualification<br />
(excluding para-teachers) presented in Tables D-16 and<br />
D-17 suggests that about 41.36<br />
percent male and 37.68 percent<br />
female teachers (all categories)<br />
in urban areas are B.Ed or<br />
equivalent, compared to 31.68<br />
percent male and 27.67 percent<br />
female teachers in rural areas.<br />
The total of these two shows<br />
that 38 and 30 percent teachers,<br />
respectively, in urban and rural<br />
areas have such degrees. It has<br />
also been noticed that<br />
percentage of such teachers in<br />
urban areas is higher than the<br />
same in rural areas. The<br />
corresponding figures in the case<br />
of teachers at Primary level are<br />
27.76 percent male and 27.68 percent female (total<br />
27.71 percent). In the case of integrated Higher<br />
Secondary schools, as many as 44.44 percent male and<br />
47.32 percent female teachers had B.Ed or equivalent<br />
degree in 2007-08, compared to 46.05 percent in the<br />
case of all teachers. Upper Primary attached to<br />
Secondary and Higher Secondary schools also have<br />
61.35 percent (61.14 male and 61.71 female) teachers<br />
with B.Ed degree. Further, it is noticed that compared<br />
to teachers having B.Ed degree, the percentage of<br />
teachers having M.Ed degree across school types is low.<br />
On the other hand, a good number of teachers are J.B.T<br />
or equivalent which is true for all categories and Primary<br />
teachers. Considering all teachers together, only 1.20<br />
percent teachers in Primary schools have M.Ed or<br />
equivalent degree compared to 1.84 percent in<br />
independent Elementary, 3.88 percent in integrated<br />
Higher Secondary, 2.98 percent in Upper Primary and<br />
“Percentage of teachers by<br />
professional qualification<br />
suggests that about<br />
41.36 percent male and<br />
37.68 percent female<br />
teachers in urban areas<br />
are B.Ed or equivalent,<br />
compared to 31.68 percent<br />
male and 27.67 percent<br />
female teachers in<br />
rural areas”<br />
3.97 percent in Upper Primary attached to Secondary<br />
and Higher Secondary schools.<br />
The percentage of no response in each school<br />
category indicates that a fairly good number of regular<br />
teachers do not possess any professional qualification.<br />
The percentage of such teachers (both regular and parateachers)<br />
is 22.32, compared to 19.10 percent in the<br />
case of regular teachers of all categories. The state-wise<br />
percentage of teachers with professional qualifications<br />
is presented in Table D-18. It reveals that about 78<br />
percent of the total teachers at Elementary level possess<br />
one or the other professional<br />
qualification, compared to 45<br />
percent in the case of parateachers.<br />
In the case of regular<br />
teachers alone, the percentage<br />
is as high as 81. The statespecific<br />
percentages reveal that<br />
the majority of regular teachers<br />
in all the north-eastern states,<br />
including Assam as well as in<br />
Jammu and Kashmir and in a few<br />
other states is yet to attain<br />
professional qualification. This is<br />
also true for para-teachers. On<br />
the other hand, in a few states,<br />
like Delhi, Kerala, Karnataka,<br />
Maharashtra, Rajasthan and<br />
Tamil Nadu, the majority of para-teachers are<br />
professionally trained; the majority of regular teachers<br />
in such states are also trained.<br />
In-Service Training of <strong>Teacher</strong>s<br />
As many as 2.07 million teachers had undergone<br />
in-service training in 2006-07 compared to 1.69 million<br />
in 2005-06. In other words, about 38.32 percent male<br />
and 35.80 percent female teachers (all categories) were<br />
imparted in-service training during the year 2006-07,<br />
compared to 33.22 percent male and 32.30 percent<br />
female teachers in 2005-06. In percentage terms, more<br />
female teachers were imparted in-service training than<br />
their male counterparts in both rural and urban areas.<br />
More than 71 percent of teachers in Gujarat (males<br />
79.13 percent and females, 64.03 percent) underwent<br />
in-service training, the highest amongst all the states.<br />
175
Part IV<br />
Elementary Education in India : Analytical Report<br />
The percentage of such teachers in Sikkim was the lowest<br />
(0.31 percent). Their percentage was as high as 63.77<br />
percent in Kerala, 51.57 percent<br />
in Uttarakhand, 53.81 in Tamil<br />
Nadu, 55.07 percent in Himachal<br />
Pradesh and 55.58 percent in<br />
Punjab, and as low as 8.25<br />
percent in Arunachal Pradesh<br />
and 8.52 percent in Manipur.<br />
Delhi (26.62 percent),<br />
Chandigarh (15.00 percent),<br />
Puducherry (8.14 percent), etc.,<br />
too have a very low percentage<br />
of teachers who were imparted in-service training during<br />
the previous year.<br />
About 44 percent teachers in the Primary schools,<br />
both male and female, received in-service training during<br />
the previous academic year. The<br />
percentage of such teachers has<br />
been much higher in rural areas<br />
(46.54 percent) than in urban<br />
areas (29.15 percent). Further, it<br />
has also been observed that a<br />
good number of Primary school<br />
teachers in government<br />
managed schools received inservice<br />
training (43.84 percent),<br />
compared to only 13.24 percent<br />
teachers in private managed schools. A few states, such<br />
as Andhra Pradesh (54 percent), Goa (68 percent),<br />
Table D19<br />
Percentage of <strong>Teacher</strong>s Received In-Service Training: 2007-08*<br />
School All Areas Rural Areas Urban Areas<br />
Category Male Female Total Male Female Total Male Female Total<br />
Primary only 45.89 41.53 44.05 47.14 45.55 46.54 30.64 28.50 29.15<br />
Primary with Upper 41.77 38.65 40.36 45.46 47.65 46.30 20.28 22.35 21.66<br />
Primary<br />
Primary with Upper 14.39 15.21 14.85 17.15 23.05 19.74 9.10 9.82 9.60<br />
Primary & Secondary/<br />
Hr. Secondary<br />
Upper Primary only 32.71 32.50 32.64 33.39 36.16 34.21 26.56 24.03 24.98<br />
Upper Primary 23.59 26.64 24.75 26.24 34.00 28.64 14.73 17.07 15.98<br />
& Secondary/<br />
Hr. Secondary<br />
All Schools 38.32 35.80 36.81 41.02 42.88 41.36 20.40 21.45 20.57<br />
* In previous academic year 2006-07.<br />
“More female teachers were<br />
imparted in-service training<br />
than their male counterparts<br />
in both rural and urban areas.<br />
More than 71 percent of<br />
teachers in Gujarat underwent<br />
in-service training, the highest<br />
amongst all the states”<br />
The highest percentage of teachers imparted inservice<br />
training is noticed in the case of teachers in<br />
Primary schools (total 44.05 percent; male 45.89<br />
percent, and female 41.53 percent), followed by<br />
independent Elementary schools (total 40.36 percent;<br />
male 41.77 percent; and females 38.65 percent), Upper<br />
Primary schools (total 32.64 percent; male 32.71<br />
percent; and female 32.50 percent), Upper Primary<br />
attached to Secondary and Higher Secondary schools<br />
(total 24.75 percent; male 23.59 percent; and female<br />
26.64 percent) and integrated Higher Secondary schools<br />
(total 14.85 percent; male 14.39 percent; and female<br />
15.21 percent) (Table D-19).<br />
Gujarat (72 percent), Himachal Pradesh (71 percent),<br />
Kerala (67 percent), Tamil Nadu (65 percent),<br />
Uttarakhand (51 percent) and West Bengal (69 percent),<br />
have had a much higher percentage of trained teachers<br />
(Primary) than the average of all districts (44.05 percent).<br />
On the other hand, the percentage of trained teachers<br />
in the states of Arunachal Pradesh (10 percent), Bihar<br />
(45 percent), Chhattisgarh (46 percent), Delhi (19<br />
percent), Karnataka (39 percent), Maharashtra (21<br />
percent), Meghalaya (24 percent), Nagaland (20<br />
percent) and Uttar Pradesh (18 percent) has been low<br />
as the majority of Primary school teachers in these states<br />
were not provided in-service training during the pervious<br />
176
<strong>Teacher</strong>-<strong>Related</strong> <strong>Indicators</strong><br />
Part IV<br />
year. All the north-eastern states too have a lower<br />
percentage of teachers who were imparted in-service<br />
training than the all-India average of 44.05.<br />
para-teachers are not confined to Primary and Upper<br />
Primary schools but a good number of them have also<br />
been posted in other types of schools. Further, in as many<br />
Figure 4.10<br />
Percentage Distribution of <strong>Teacher</strong>s Received In-Service Training<br />
From the <strong>DISE</strong> database, it is possible to locate all<br />
such schools where teachers were imparted in-service<br />
training. Together with information on schools with<br />
availability of infrastructure, or independent students’<br />
assessment in terminal grades can also be identified; all<br />
of which are factors that influence quality of education<br />
and examination results. While planning for in-service<br />
training in the following year, institutions like the SCERT<br />
may like to use the rich <strong>DISE</strong> database to identify training<br />
needs.<br />
Para-<strong>Teacher</strong>s<br />
The comprehensive data on para-teachers is being<br />
collected through the <strong>DISE</strong> operations every year. It reveals<br />
that all the states (except Karnataka) have reported<br />
information on para-teachers though in a few states<br />
(Chandigarh, Dadra and Nagar Haveli, Lakshadweep etc.)<br />
their number is negligible. It has also been observed that<br />
as 68,186 schools (5.45 percent of total schools) only<br />
para-teachers were working in 2007-08 against 70,338<br />
(5.88 percent) in 2006-07. The number of such schools<br />
in Rajasthan, Jharkhand and Assam, has been as high as<br />
13,097, 16,408 and 12,436 schools, respectively, their<br />
corresponding percentages being 12.68, 39.12 and 18.64<br />
of the total schools in these states. It may be recalled<br />
that the total number of such schools in Madhya Pradesh<br />
has come down to 898 in 2007-08 from 7,423 in 2006-<br />
07 and from 37,285 schools reported in 2005-06 as the<br />
state has recently upgraded most of its EGS into formal<br />
Primary schools and teachers in such schools has shown<br />
under regular teachers category. Still it may possible that<br />
all these teachers in the state may not draw full salary of<br />
a regular teacher. In other states such schools are only a<br />
few but in states such as Arunachal Pradesh (2,086, 45.75<br />
percent) and Jammu and Kashmir 3,716 (17.87 percent),<br />
in percentage term, it is quite high.<br />
177
Part IV<br />
Elementary Education in India : Analytical Report<br />
Across the country, as many as 584,000 parateachers<br />
were working in 2007-08 which is 10.48<br />
It may also be of interest to know that 92.62 percent<br />
of the total para-teachers have been posted in rural areas.<br />
Table D20<br />
Distribution of Para-<strong>Teacher</strong>s by School Category: 2007-08<br />
Number of Para-<strong>Teacher</strong>s<br />
School Category<br />
Male<br />
Female<br />
Total<br />
Rural Areas<br />
2007-08 2006-07 Number % to Total<br />
Primary only 212683 171082 383765 351236 366508 95.50<br />
Primary with Upper Primary 66380 47513 113893 89788 103151 90.57<br />
Primary with Upper Primary 5303 5721 11024 10898 7235 65.63<br />
& Secondary/Hr. Secondary<br />
Upper Primary only 9378 5959 15337 21031 13904 90.66<br />
Upper Primary & 29795 26555 56350 40644 46611 82.72<br />
Secondary/Hr. Secondary<br />
No Response 2388 1067 3455 41 3335 96.53<br />
All Schools (2007-08) 325927 257897 583824 – 540744 92.62<br />
All Schools (2006-07) 292831 220807 513638 513638 475859 92.64<br />
All Schools (2005-06) 305973 192971 498944 498944 464535 93.10<br />
All Schools (2004-05) 241926 135740 379385 379385 346824 91.42<br />
All Schools (2003-04) 167730 91369 259099 259099 240734 92.91<br />
Note: Rural and urban totals may not add to total number of para-teachers because of no responses in these areas and also in male and female<br />
categories.<br />
percent of total teachers, compared to 514,000 (9.86<br />
percent) in 2005-06. During 2006-07 and 2007-08, as<br />
many as 70,186 additional parateachers<br />
were appointed. This<br />
shows an increase of 13.66<br />
percent over the total parateachers<br />
in the previous year. Of<br />
the total para-teachers, 56<br />
percent are male and the<br />
remaining 44 percent are female<br />
teachers. The respective<br />
percentage of male and female<br />
para-teachers to total male and<br />
female teachers works out to<br />
10.22 and 10.84, which is quite<br />
similar to the corresponding<br />
figures in the previous year. In<br />
other words, about 10.48<br />
percent of total teachers (all<br />
categories) are para-teachers compared to 10 percent<br />
in the previous year.<br />
“Across the country, as many<br />
as 584,000 para-teachers<br />
were working in 2007-08<br />
which is 10.48 percent of<br />
total teachers, compared<br />
to 514,000 in 2005-06.<br />
During 2006-07 and 2007-08,<br />
as many as 70,186 additional<br />
para-teachers were appointed.<br />
This shows an increase of<br />
13.66 percent over the<br />
total para-teachers in<br />
the previous year”<br />
Urban areas had only 43,100 para-teachers in 2007-08,<br />
compared to 540,700 in rural areas (Table D-20). In<br />
percentage terms, the share of<br />
para-teachers is very high in rural<br />
areas (12.39 percent) than in<br />
urban areas (3.58 percent). In<br />
rural areas, the percentage of<br />
female para-teachers has been<br />
very high in a few school types,<br />
such as Primary (20.40 percent)<br />
but it is not the case in urban<br />
areas. The percentage of female<br />
para-teachers in Primary schools<br />
in urban areas has been as low as<br />
4.88. Further, it has also been<br />
observed that in both schools<br />
under Government (14.10<br />
percent) as well as Government<br />
Aided (2.21 percent)<br />
managements, a large number of para-teachers have<br />
been appointed across the country.<br />
178
<strong>Teacher</strong>-<strong>Related</strong> <strong>Indicators</strong><br />
Part IV<br />
The state-specific number of para-teachers reveals<br />
that majority of para-teachers have been appointed in<br />
Chhattisgarh (14,110; 9.11 percent), Jharkhand<br />
(66,100; 44.57 percent), Orissa (55,785, 25.09 percent),<br />
Table D21<br />
Percentage of Para-<strong>Teacher</strong>s to Total <strong>Teacher</strong>s: 2007-08<br />
School All Areas Rural Areas Urban Areas<br />
Category Male Female Total Male Female Total Male Female Total<br />
Primary only 15.25 16.74 15.88 16.07 20.40 17.70 5.22 4.88 4.98<br />
Primary with Upper 7.90 6.88 7.44 8.74 9.09 8.87 3.02 2.85 2.91<br />
Primary<br />
Primary with Upper 2.96 2.53 2.72 3.49 3.40 3.45 1.95 1.93 1.94<br />
Primary & Secondary/<br />
Hr. Secondary<br />
Upper Primary only 2.86 3.32 3.02 2.98 4.07 3.30 1.78 1.58 1.65<br />
Upper Primary 7.22 10.54 8.48 8.23 14.36 10.13 3.84 5.57 4.77<br />
& Secondary/<br />
Hr. Secondary<br />
All Schools (2007-08) 10.22 10.84 10.48 11.23 14.41 12.39 3.51 3.61 3.58<br />
All Schools (2006-07) 9.81 10.28 9.86 10.78 13.87 11.87 3.47 3.30 3.36<br />
All Schools (2005-06) 11.21 10.47 10.91 12.29 14.00 12.87 3.81 3.42 3.27<br />
All Schools (2004-05) 10.04 8.53 9.09 10.91 11.27 10.72 3.87 3.29 3.27<br />
Note: Total may not add to hundred because of missing values and rounding of figures.<br />
Figure 4.11<br />
Percentage of Para-<strong>Teacher</strong>s to Total <strong>Teacher</strong>s<br />
the states of Andhra Pradesh (78,829; 15.19 percent of<br />
total para-teachers), Bihar (23,487; 7.16 percent)),<br />
Rajasthan (33,287; 7.88 percent), Uttar Pradesh<br />
(1,66,923; 25.90 percent), and West Bengal (39,013;<br />
179
Part IV<br />
Elementary Education in India : Analytical Report<br />
Map 4.3<br />
180
<strong>Teacher</strong>-<strong>Related</strong> <strong>Indicators</strong><br />
Part IV<br />
14.51 percent) which together constitute a total of<br />
478,000 para-teachers, i.e. 82 percent of the total parateachers<br />
across 35 States and UTs. Compared to these,<br />
other states, except Assam (19,457 para-teachers) and<br />
Himachal Pradesh (10,292 para-teachers), have only<br />
lesser number of para-teachers.<br />
Notably, para-teachers are not confined to Primary<br />
schools. A good number of other types of schools also<br />
have para-teachers as of 2007-08. However, majority<br />
of them have been posted in Primary schools. A total of<br />
384,000 para-teachers are posted in Primary schools,<br />
which is 66 percent of total para-teachers in the country.<br />
The distribution of para-teachers by school category<br />
reveals that 15.25 percent male teachers and 16.74<br />
percent female teachers of the<br />
corresponding gender-wise total<br />
teachers posted in Primary<br />
schools are para-teachers. About<br />
56 percent of the total parateachers<br />
in Primary schools are<br />
male and the remaining 44<br />
percent female teachers. Their<br />
combined percentage is about<br />
15.88, which means 16 out of<br />
every 100 teachers in Primary<br />
schools are para-teachers, of<br />
which 18 out of 100 are in rural<br />
areas and 5 out of 100 in urban<br />
areas. Their number is more than<br />
113,900 in Elementary (Primary with Upper Primary)<br />
schools, which amounts to 7.44 percent of the total<br />
teachers in Elementary schools. On the other hand, as<br />
many as 15,337 para-teachers are posted in independent<br />
Upper Primary schools which is 3.02 percent of the total<br />
teachers in such schools. Compared to Primary schools,<br />
Upper Primary and Elementary schools, integrated<br />
Higher Secondary, and Upper Primary attached to<br />
Secondary and Higher Secondary schools have much<br />
less number of para-teachers. In both these types of<br />
schools, about 11,000 and 56,400 para-teachers were<br />
appointed in 2007-08, which works out to be 2.72 and<br />
8.48 percent, respectively, of the total teachers in these<br />
schools (Table D-21).<br />
Further, it is observed that Andhra Pradesh,<br />
Haryana, Jammu and Kashmir, Jharkhand, Mizoram,<br />
Orissa and Uttar Pradesh have an average of almost<br />
“Andhra Pradesh, Haryana,<br />
Jammu and Kashmir,<br />
Jharkhand, Mizoram, Orissa<br />
and Uttar Pradesh have an<br />
average of almost one parateacher<br />
each in all categories<br />
of schools. It is also true for<br />
Primary schools in Jammu and<br />
Kashmir, Jharkhand, Orissa<br />
and Uttar Pradesh and in<br />
schools located in rural areas”<br />
one para-teacher each in all categories of schools. It is<br />
also true for Primary schools in Jammu and Kashmir,<br />
Jharkhand, Orissa and Uttar Pradesh and in schools<br />
located in rural areas. The respective percentage of male<br />
and female para-teachers in Primary schools in Jharkhand<br />
is as high as 62.89 and 60.54. Arunachal Pradesh too<br />
has a high percentage of male para-teachers, 30.89,<br />
and female para-teachers, 40.52. Their respective<br />
percentages are 44.25 and 32.76 in Jammu and Kashmir,<br />
22.42 and 12.56 in Rajasthan, 24.20 and 15.72 in<br />
Himachal Pradesh, 19.97 and 14.98 in Haryana and<br />
27.89 and 48.96 in Uttar Pradesh. Compared to high<br />
percentage in these states, the percentage of parateachers<br />
to total teachers in the remaining states is low.<br />
Kerala has only 2.21 percent<br />
para-teachers against 0.85<br />
percent in Gujarat. The<br />
percentage of male and female<br />
para-teachers to total teachers in<br />
Delhi comes to 2.88 and 2.67.<br />
All the states in the north-eastern<br />
region of the country also<br />
reported information on parateachers<br />
in all types of schools;<br />
the percentage of para-teachers<br />
to total teachers in these states<br />
(except Mizoram and Tripura) is<br />
quite low as compared to other<br />
states. The Andaman and<br />
Nicobar Islands, Chandigarh, Goa, Daman and Diu,<br />
Dadra and Nagar Haveli, and Maharashtra hardly have<br />
any para-teacher in their Primary schools. On the other<br />
hand, Karnataka and Lakshadweep did not report any<br />
para-teacher in its Primary schools as also in most of<br />
other school types.<br />
Academic Qualifications of Para-<strong>Teacher</strong>s<br />
The distribution of para-teachers by school category<br />
reveals that they are almost equally qualified as regular<br />
teachers (Tables D-14 & 15 and Tables D-22 & 23). About<br />
42.82 percent regular male teachers, 44.51 percent regular<br />
female teachers and 43.54 percent all regular teachers have<br />
up to Higher Secondary education. The percentage in case<br />
of para-teachers is 44.84 percent male, 48.43 percent<br />
female and 46.42 all para-teachers. The distribution of<br />
teachers below Higher Secondary level further reveals that<br />
181
Part IV<br />
Elementary Education in India : Analytical Report<br />
the percentage in the case of regular teachers (2.58<br />
percent) is slightly lower than that of the para-teachers<br />
(2.86 percent). This is also true for such para-teachers in<br />
Primary schools. Only 2.86 percent (all categories) parateachers<br />
are below Secondary level, compared to 2.58<br />
percent of regular teachers. The percentage in the case of<br />
Qualification<br />
regular Primary teachers is still higher at 3.57 teachers; the<br />
corresponding percentage of<br />
primary para-teachers is 3.60<br />
teachers. About 54.40 percent<br />
male and 50.77 percent female<br />
para-teachers are Graduates and<br />
Post Graduates, compared to<br />
56.22 percent male and 54.20<br />
percent female regular (all<br />
categories) teachers. This shows<br />
that about 53 percent parateachers<br />
have Graduate and Post<br />
Graduate degrees, compared to<br />
55 percent in the case of regular teachers. In urban areas,<br />
“Distribution of teachers<br />
below Higher Secondary<br />
level further reveals that<br />
the percentage in the case<br />
of regular teachers is<br />
slightly lower than that of<br />
the para-teachers. This is also<br />
true for such para-teachers<br />
in Primary schools”<br />
the percentage of such para-teachers is much higher at<br />
65.90 compared to 51.71 in rural areas. Though the<br />
number is small, a few regular (0.46 percent) and parateachers<br />
(0.42 percent) are even M.Phil/Ph.D degree<br />
holders. This is also true in the case of teachers in Primary<br />
schools (Tables D-22 and D-23).<br />
Table D22<br />
Academic Qualification of Para-<strong>Teacher</strong>s: 2007-08, All Categories<br />
All Areas Rural Areas Urban Areas<br />
Male Female Total Male Female Total Male Female Total<br />
Below Secondary 2.98 2.71 2.86 3.01 2.78 2.91 2.33 2.16 2.22<br />
Secondary 10.60 11.69 11.08 10.71 11.93 11.23 8.16 9.72 9.19<br />
Higher Secondary 31.26 34.03 32.48 31.82 35.58 33.43 19.24 21.43 20.69<br />
Up to Higher 44.84 48.43 46.42 45.54 50.29 47.57 29.73 33.31 32.10<br />
Secondary Level,<br />
2007-08<br />
Up to Higher 45.89 50.37 47.81 46.65 52.42 49.03 30.30 33.65 32.42<br />
Secondary Level,<br />
2006-07<br />
Graduate 41.78 37.99 40.07 41.31 36.83 39.41 50.14 47.45 48.36<br />
Post Graduate 12.62 12.78 12.69 12.39 12.19 12.30 17.48 17.58 17.54<br />
Graduate & Post 54.40 50.77 52.76 53.70 49.02 51.71 67.62 65.03 65.90<br />
Graduates, 2007-08<br />
Graduate & Post 53.23 48.79 51.32 52.54 46.84 50.19 67.28 64.79 65.69<br />
Graduates, 2006-07<br />
M.Phil/Ph.D 0.41 0.43 0.42 0.40 0.41 0.40 0.63 0.57 0.59<br />
Others 0.21 0.21 0.21 0.20 0.18 0.19 0.51 0.45 0.47<br />
No Response 0.22 0.16 0.19 0.16 0.10 0.13 1.51 0.64 0.94<br />
Note: Totals may not add to hundred because of rounding of figures.<br />
The state-specific distribution of para-teachers by<br />
qualifications suggests that some<br />
states have higher percentage of<br />
teachers with qualification below<br />
Secondary level than the average<br />
of all districts (2.86 percent).<br />
Arunachal Pradesh (37.87<br />
percent), Daman and Diu (14.29<br />
percent), Meghalaya (10.90<br />
percent), Nagaland (10.47<br />
percent), Rajasthan (6.47<br />
percent) and Tripura (15.76<br />
percent) are a few such states.<br />
On the other hand, Andhra Pradesh, Bihar, Delhi,<br />
182
<strong>Teacher</strong>-<strong>Related</strong> <strong>Indicators</strong><br />
Part IV<br />
Figure 4.12<br />
Percentage of Para-<strong>Teacher</strong>s by Educational Qualification<br />
Qualification<br />
Table D23<br />
Academic Qualification of Primary School Para-<strong>Teacher</strong>s: 2007-08<br />
All Areas Rural Areas Urban Areas<br />
Male Female Total Male Female Total Male Female Total<br />
Below Secondary 3.83 3.32 3.60 3.84 3.34 3.62 3.41 3.06 3.17<br />
Secondary 12.11 12.61 12.34 12.10 12.45 12.24 12.53 14.82 14.09<br />
Higher Secondary 36.31 39.24 37.60 36.53 39.91 38.00 27.25 30.11 29.20<br />
Up to Higher 52.25 55.17 53.54 52.47 55.70 53.86 43.19 47.99 46.46<br />
Secondary Level,<br />
2007-08<br />
Up to Higher 52.19 56.29 53.93 52.40 56.65 54.19 43.35 50.21 47.73<br />
Secondary Level,<br />
2006-07<br />
Graduate 35.15 32.44 33.93 34.96 32.00 33.68 41.82 38.23 39.38<br />
Post Graduate 12.02 11.87 11.96 11.99 11.80 11.91 13.19 12.88 12.98<br />
Graduate & Post 47.17 44.31 45.89 46.95 43.80 45.59 55.01 51.11 52.36<br />
Graduates, 2007-08<br />
Graduate & Post 47.19 43.08 45.43 46.99 42.73 45.20 55.67 48.94 51.37<br />
Graduates, 2006-07<br />
M.Phil/Ph.D 0.34 0.34 0.34 0.34 0.34 0.34 0.51 0.34 0.39<br />
Others 0.13 0.12 0.13 0.12 0.11 0.12 0.38 0.32 0.34<br />
No Response 0.14 0.06 0.10 0.12 0.05 0.09 0.91 0.24 0.45<br />
Note: Totals may not add to hundred because of rounding of figures.<br />
183
Part IV<br />
Elementary Education in India : Analytical Report<br />
Haryana, Himachal Pradesh, Jammu and Kashmir,<br />
Manipur, Orissa, Sikkim, Karnataka and Uttarakhand<br />
have lower percentage of para-teachers with below<br />
Secondary level qualifications. Comparatively,<br />
percentage of such teachers in other school types is<br />
lower than Primary schools (3.60 percent). Even in<br />
integrated Higher Secondary schools, about 2.29 percent<br />
teachers are below Secondary level compared to 0.68<br />
percent such teachers in Upper Primary attached to<br />
Secondary and Higher Secondary schools. In the case<br />
Table D24<br />
Percentage of Para-<strong>Teacher</strong>s with Professional Qualification by School Category: 2007-08<br />
School Category<br />
Delhi, Haryana, Himachal Pradesh, Jammu & Kashmir,<br />
Madhya Pradesh, Punjab, Rajasthan, Tamil Nadu and<br />
Uttarakhand too have a good number of Post-Graduate<br />
para-teachers.<br />
Professional Qualifications of Para-<br />
<strong>Teacher</strong>s<br />
Para-teachers though are academically equally or<br />
better qualified than the regular teachers, but many of<br />
Percentage<br />
Male Female All Areas Rural Areas Urban Areas<br />
Primary only 44.20 37.63 41.27 40.92 48.81<br />
Primary with Upper Primary 84.37 52.74 51.18 50.93 53.57<br />
Primary with Upper Primary 99.00 69.58 64.95 63.69 67.40<br />
& Secondary/Hr. Secondary<br />
Upper Primary only 98.48 64.46 64.81 64.91 63.79<br />
Upper Primary & 93.82 48.57 52.49 51.16 58.89<br />
Secondary/Hr. Secondary<br />
All Schools 47.66 43.08 45.63 44.93 54.50<br />
Note: Percentages have been worked out taking into account the teachers not responded as well as not having any professional qualification.<br />
of Elementary and independent Upper Primary schools,<br />
the corresponding percentages are 1.49 and 1.34.<br />
On the other hand, it is<br />
observed that in a number of<br />
states, the percentage of parateachers<br />
with Secondary School<br />
qualification is much higher than<br />
the national average (11.08<br />
percent). Arunachal Pradesh,<br />
Andhra Pradesh, Assam, Daman<br />
and Diu, Goa, Gujarat, Kerala,<br />
Maharashtra, Meghalaya,<br />
Mizoram, Nagaland, Orissa,<br />
Tripura and West Bengal are a<br />
few such states. On the other<br />
hand, more than 50 percent<br />
teachers in the states of Goa,<br />
Manipur and West Bengal are Graduates compared to<br />
the national average of 40.07 percent. In Chandigarh,<br />
more than half of the total teachers that impart<br />
elementary education are Post-Graduates. Chhattisgarh,<br />
“Majority of teachers<br />
imparting elementary<br />
education across 35 States<br />
and Union Territories were<br />
not involved in non-teaching<br />
assignments in 2006-07 which<br />
is also true for the previous<br />
year. The percentage of<br />
such teachers has been as<br />
low as 10.84 compared to<br />
12.16 percent in rural and only<br />
6.17 percent in urban areas”<br />
them do not possess professional qualifications. Not<br />
much difference is observed across school types between<br />
male and female para-teachers.<br />
However, the percentage<br />
of para-teachers without<br />
professional qualification is a bit<br />
low in urban areas than in rural<br />
areas. The percentage of such<br />
teachers in urban areas in the<br />
case of male teachers is 46.42<br />
and for female teachers 45.03.<br />
The corresponding figures in<br />
rural areas are 52.62 percent for<br />
male and 58.39 percent for<br />
female teachers.<br />
It is also interesting to note<br />
that 10.89 percent male parateachers<br />
and 7.40 percent female para-teachers in<br />
Primary schools have B.Ed or equivalent degrees.<br />
Percentage of such para-teachers is a little higher in<br />
urban areas (15.45 percent male and 14.27 percent<br />
184
<strong>Teacher</strong>-<strong>Related</strong> <strong>Indicators</strong><br />
Part IV<br />
female para-teachers) than in rural areas (10.77 percent<br />
male and 6.90 percent female para-teachers). In<br />
addition, about one percent para-teachers in the Primary<br />
are yet to attain professional qualifications. However, in<br />
Chandigarh, Daman and Diu, Delhi, Gujarat, Haryana,<br />
Maharashtra, Puducherry, Rajasthan and Tamil Nadu and<br />
in a few smaller states, above 80 percent para-teachers<br />
possess professional qualifications. But the percentage<br />
of such para-teachers is as low as 36.23 percent in Bihar,<br />
Table D25<br />
Professional Qualifications of Para-<strong>Teacher</strong>s (All Categories): 2007-08<br />
Percentage<br />
Qualification All Areas Rural Areas Urban Areas<br />
Male Female Total Male Female Total Male Female Total<br />
J.B.T or Equivalent 12.21 11.62 11.95 12.36 11.99 12.20 9.08 8.65 8.80<br />
S.B.T or Equivalent 10.64 9.33 10.06 10.61 8.94 9.90 11.39 12.51 12.13<br />
B.Ed or Equivalent 16.38 14.00 15.33 15.96 12.56 14.52 25.27 25.57 25.47<br />
M.Ed or Equivalent 1.39 1.31 1.36 1.33 1.17 1.27 2.56 2.44 2.48<br />
Others 7.03 6.82 6.94 7.12 6.94 7.04 5.28 5.79 5.62<br />
No Response* 52.34 56.92 54.37 52.62 58.39 55.07 46.42 45.03 45.50<br />
* Including teachers without professional qualification.<br />
schools have M.Ed or equivalent degrees. The<br />
percentage of para-teachers with M.Ed degrees is slightly<br />
higher in the case of other school types. About 15<br />
percent para-teachers teaching in Primary schools are<br />
J.B.T or equivalent and another 9.14 percent male and<br />
6.79 percent female teachers have S.B.T or equivalent<br />
qualifications.<br />
State-specific percentages of para-teachers [Table<br />
D-18] reveal that in the majority of states all such teachers<br />
Table D26<br />
SC & ST <strong>Teacher</strong>s Employed in Government and Private Managed Schools: 2007-08<br />
(Including Para-<strong>Teacher</strong>s)<br />
Management<br />
34.91 percent in Uttar Pradesh, 38.44 percent in<br />
Uttarakhand and 18.62 percent in West Bengal.<br />
Distribution of <strong>Teacher</strong>s by Caste<br />
The caste distribution of teachers (including parateachers)<br />
is presented in Table D-26. This has also been<br />
presented in the case of all government and private<br />
managements together. The data reveals that<br />
government is the main employer of both the Scheduled<br />
Number of <strong>Teacher</strong>s<br />
Scheduled Scheduled Scheduled Other<br />
Castes Tribes Castes & Backward<br />
Scheduled Tribes Classes<br />
Government Managements 548806 417688 966494 1259495<br />
Percentage 79.53 81.17 80.23 68.22<br />
Private Managements 140091 95569 235660 584034<br />
Percentage 20.30 18.57 19.56 31.63<br />
All Managements 690072 514602 1204674 1846284<br />
% to Total <strong>Teacher</strong>s 12.25 9.14 21.39 32.76<br />
Note: Total may not add to 100 because of missing values as percentages are worked out based on total teachers.<br />
Castes and Scheduled Tribes teachers as the majority of<br />
SC and ST teachers (all categories) are employed in<br />
schools run by government managements. However, the<br />
185
Part IV<br />
Elementary Education in India : Analytical Report<br />
percentage of OBC teachers is comparatively lower than<br />
the same in the case of Scheduled Castes and Scheduled<br />
Tribes teachers. About 79.53 percent SC and 81.17<br />
percent ST teachers are employed respectively in the<br />
because they are mostly involved in non-teaching<br />
assignments. Through the <strong>DISE</strong> 2007-08 operations,<br />
information was collected from all teachers on the<br />
number of working days spent on non-teaching<br />
Figure 4.13<br />
Percentage of SC & ST <strong>Teacher</strong>s (All Schools)<br />
government managed schools. The share of the SC and<br />
ST teachers together in government schools is 80<br />
percent, compared to about 20<br />
percent in the case of private<br />
managed schools. As many as<br />
0.69 million SC and 0.51 million<br />
ST teachers are engaged in<br />
imparting elementary education,<br />
representing 12.25 percent and<br />
9.14 percent of the total<br />
teachers. Altogether, there are<br />
about 1.20 million SC and ST<br />
teachers, which is 21.39 percent<br />
of the total teachers that impart<br />
elementary education in the<br />
country. The percentage of OBC teachers in government<br />
managed schools stands at 68 percent compared to 32<br />
percent in private managed schools.<br />
<strong>Teacher</strong>s involved in Non-Teaching<br />
Assignments<br />
It is a common belief that teachers in general, and<br />
Primary schools in particular, hardly get time for teaching<br />
“Teaching-learning, if not<br />
taking place regularly may not<br />
be because of involvement<br />
of teachers in non-teaching<br />
assignments as teachers are<br />
involved in non-teaching<br />
assignments only for a few<br />
days and the percentage<br />
of such teachers has also<br />
been quite low”<br />
assignments during the previous academic year i.e.<br />
2006-07. The information thus obtained has been used<br />
to compute average number of<br />
working days spent on nonteaching<br />
assignments, which is<br />
presented by school category<br />
and also separately for all<br />
Government and Private<br />
management schools (Table D-<br />
27). While computing the<br />
average number of days, only<br />
the teachers who were involved<br />
in non-teaching assignments<br />
during the previous year, that is,<br />
in 2006-07 were considered. The<br />
percentage of such teachers is also presented separately<br />
both in the case of rural and urban areas (Table D-27).<br />
Table D-27 reveals that the majority of teachers<br />
imparting elementary education across 35 States and<br />
Union Territories were not involved in non-teaching<br />
assignments in 2006-07 which is also true for the<br />
previous year. The percentage of such teachers (all<br />
categories) has been as low as 10.84 (11.36 percent in<br />
186
<strong>Teacher</strong>-<strong>Related</strong> <strong>Indicators</strong><br />
Part IV<br />
Table D27<br />
Average Number of Working Days Spent on Non-Teaching Assignments: 2004-05 to 2006-07<br />
School Category<br />
Number of Days Involved<br />
All Rural Urban All All<br />
Areas Areas Areas Government Private<br />
Managements Managements<br />
Primary only 14 13 15 14 11<br />
Primary with Upper Primary 14 14 16 14 11<br />
Primary with Upper Primary 17 14 20 16 17<br />
& Secondary/Hr. Secondary<br />
Upper Primary only 15 15 17 15 14<br />
Upper Primary & 15 14 18 15 14<br />
Secondary/Hr. Secondary<br />
All Schools 16 14 17 14 13<br />
Percentage of <strong>Teacher</strong>s<br />
Involved in Non-Teaching<br />
Assignments to Total <strong>Teacher</strong>s<br />
2006-07 10.84 12.16 6.17 13.58 4.82<br />
2005-06 11.36 12.63 6.98 13.76 6.02<br />
2004-05 15.06 16.60 9.56 18.06 7.62<br />
the previous year) compared to 12.16 percent in rural<br />
and only 6.17 percent in urban areas. This suggests that<br />
88 out of 100 teachers in rural areas and 94 out of 100<br />
teachers in urban areas were not involved in nonteaching<br />
assignments. Comparatively, a little less than<br />
double the percentage of teachers in rural areas was<br />
involved in non-teaching assignments than teachers in<br />
the urban areas. Not much<br />
difference is observed in the<br />
number of days spent on nonteaching<br />
assignments across<br />
school types.<br />
It is further observed that<br />
the highest number of teachers<br />
involved in non-teaching<br />
assignments, among the major<br />
states, was in West Bengal (28<br />
percent), followed by Himachal<br />
Pradesh (14 percent), Kerala (21<br />
percent) and Tamil Nadu (16<br />
percent). In Lakshadweep, as<br />
many as 40.58 percent teachers (all categories) were<br />
involved in non-teaching assignments for an average<br />
“Quite a good number of<br />
schools are left to<br />
para-teachers to manage<br />
the school affairs. Studies<br />
should be conducted on the<br />
functioning of all such schools<br />
and also the quality of<br />
learner’s attainment in these<br />
schools for which the <strong>DISE</strong><br />
data can be a rich source<br />
of information”<br />
of 14 days compared to 21 percent/21 days in<br />
Chandigarh. On the other hand, the percentage of such<br />
teachers in Chhattisgarh, Karnataka, Puducherry,<br />
Rajasthan, Sikkim, Tripura, etc., was low as the majority<br />
of the teachers in these states was not involved in nonteaching<br />
assignments during the previous academic year.<br />
The teaching-learning, if not taking place regularly may<br />
not be because of involvement<br />
of teachers in non-teaching<br />
assignments as teachers are<br />
involved in non-teaching<br />
assignments only for a few days<br />
and the percentage of such<br />
teachers has also been quite low.<br />
It may, however, be noted that<br />
in a few smaller states, such as<br />
Goa and Meghalaya, the<br />
teachers involved in such<br />
assignments are more than 25<br />
percent.<br />
The data on all schools<br />
together reveals that, on an average, a teacher was<br />
involved in non-teaching assignments only for 16 days<br />
187
Part IV<br />
Elementary Education in India : Analytical Report<br />
during the pervious academic year (of the 10.84 percent<br />
of those who were involved). In rural areas, teachers<br />
were involved in assignments for 14 days compared to<br />
17 days in urban areas. <strong>Teacher</strong>s in government<br />
Delhi, Primary school teachers are reported to have been<br />
engaged for 20 days in non-teaching assignments,<br />
compared to 9 days in Chandigarh, 8 days in Tamil Nadu,<br />
7 days in Karnataka and 6 days in Kerala.<br />
Figure 4.14<br />
Average Number of Working Days Spent on Non-Teaching Assignments<br />
managed schools as well as teachers in schools run by<br />
private management were engaged for 13 to 14 days<br />
in non-teaching activities. The average number of days<br />
spent on non-teaching assignments was highest (49<br />
days) in Tripura and the lowest (6 days) in Kerala and<br />
Mizoram. The average number<br />
of days spent on such types of<br />
assignments was also high in<br />
Bihar (24 days), Assam (22 days),<br />
Delhi (24 days), Jharkhand (28<br />
days), Madhya Pradesh (21<br />
days), Manipur (28 days), Punjab<br />
(20 days), etc. So far as teachers<br />
in Primary schools/sections are<br />
concerned, only 11 states<br />
reported more than 20 days of<br />
involvement in non-teaching<br />
assignments during the previous<br />
academic year. Assam (21 days),<br />
Bihar (23 days), Daman and Diu (29 days), Jharkhand<br />
(28 days), Madhya Pradesh (21 days), Puducherry (19<br />
days) and Tripura (51 days) are some of such states. In<br />
Concluding Observations<br />
“Despite improvements, there<br />
are still locations where PTR<br />
is not satisfactory and a<br />
single classroom has to<br />
accommodate a large number<br />
of pupils. A good number<br />
of schools are single-teacher<br />
schools despite availability<br />
of an average of four<br />
teachers per school”<br />
The analyses presented above not only indicate<br />
that the number of teachers imparting elementary level<br />
of education has increased but all indicators analysed<br />
have shown consistent<br />
improvement over the previous<br />
year. The elementary schools/<br />
sections now have more<br />
average number of teachers<br />
than a few years back. The<br />
pupil-teacher ratio, the average<br />
number of students sitting in<br />
one classroom, etc, have<br />
improved over the previous<br />
years. Despite such<br />
improvements, there are still<br />
locations where PTR is not<br />
satisfactory and a single<br />
classroom has to accommodate a large number of<br />
pupils. A good number of schools are single-teacher<br />
schools despite availability of an average of four<br />
188
<strong>Teacher</strong>-<strong>Related</strong> <strong>Indicators</strong><br />
Part IV<br />
teachers per school. All these need serious intervention.<br />
May be rationalization of teachers will help in ensuring<br />
adequate number of teachers in all schools.<br />
The percentage of female teachers engaged in<br />
imparting elementary education has also improved but<br />
in a few states their number is not satisfactory and hence<br />
need improvement. The previous section on enrolmentbased<br />
indicators reveals that quality of education in<br />
terms of learners’ attainment across the country is not<br />
satisfactory. It can be improved only through the active<br />
participation of teachers. Useful in-service programmes<br />
can be of great help in improving classroom transaction.<br />
In the previous academic year, a good number of<br />
teachers across the country has undergone in-service<br />
training but efforts made are not reflected in the learners’<br />
attainment which is still a major area of concern. Without<br />
delay we should seriously identify training needs so that<br />
training commensurate with the need can be arranged.<br />
Lastly, we should initiate the process of filling-up<br />
of vacant positions of teachers. The recruitment process,<br />
which was undertaken in the recent past, suggests that<br />
many of the new teachers recruited are para-teachers.<br />
This is also evident from the growing number of such<br />
teachers engaged in imparting elementary education<br />
across the country. Quite a good number of schools are<br />
left to para-teachers to manage the school affairs.<br />
Studies should be conducted on the functioning of all<br />
such schools and also the quality of learner’s attainment<br />
in these schools for which the <strong>DISE</strong> data can be a rich<br />
source of information.<br />
189
Part V<br />
Educational Development Index<br />
Introduction<br />
Internationally, Human Development Index<br />
(HDI) and Education for All (EFA)<br />
Development Index (EFA-DI) have been used<br />
for cross-country comparisons in overall human<br />
development and universalising elementary education,<br />
respectively. Both the HDI and EFA-DI measures the<br />
outcomes. The HDI measures development by<br />
combining indicators of life expectancy, educational<br />
attainment and income. It uses adult literacy rates and<br />
combined gross enrolment ratio<br />
for primary, secondary and<br />
tertiary schooling as indicators of<br />
educational development and<br />
gives adult literacy more<br />
significance in computing the<br />
index. On the other hand, the<br />
EFA development index uses one<br />
indicator as a proxy measure for<br />
each of the four <strong>EDI</strong> components<br />
and each component is assigned<br />
equal weight in the overall index.<br />
The indicators used are: (i) total<br />
primary net enrolment ratio; (ii) adult literacy rate; (iii)<br />
survival rate to Grade V; and (iv) the average of gender<br />
parity index for primary education, secondary education<br />
and adult literacy, with each being given equal weight.<br />
The provision and use of elementary education<br />
services in India has been improving quite fast during<br />
the last decade. However, the development has not been<br />
uniform across the states and districts in the country.<br />
The elementary education related interventions have<br />
been creating and improving access and infrastructure,<br />
investing in more teachers and their quality and several<br />
processes, aimed at improving educational outcomes<br />
related to not only enrolment and retention, but also in<br />
“Based on the <strong>DISE</strong> data, an<br />
effort has been made by<br />
NUEPA and the Government of<br />
India to compute an<br />
Educational Development<br />
Index, separately for Primary<br />
and Upper Primary levels of<br />
education and also a composite<br />
index for the entire<br />
Elementary education”<br />
improving the learning levels. From the point of view of<br />
an education system that is transforming itself, it is<br />
important to look at not only the outcome indicators,<br />
but also at the input and process indicators. The purpose<br />
of an index that summarizes various aspects related to<br />
input, process and outcome indicators is to identify<br />
geographic areas that lag behind in overall education<br />
development. In India, the <strong>DISE</strong> provides information<br />
on various school-based inputs and processes as well as<br />
some indicators related to the outcomes. Based on the<br />
<strong>DISE</strong> data, an effort has been made by the National<br />
University of Educational<br />
Planning and Administration<br />
(NUEPA) and the Government of<br />
India (MHRD, Department of<br />
School Education and Literacy)<br />
to compute an Educational<br />
Development Index (<strong>EDI</strong>),<br />
separately for Primary and Upper<br />
Primary levels of education and<br />
also a composite index for the<br />
entire Elementary education 1 for<br />
which the Government of India<br />
constituted a Multi-Disciplinary<br />
Expert and Core Group on <strong>EDI</strong> in 2005-06 of which<br />
NUEPA was also a member 2 . It identified indicators and<br />
developed computation methodology. The basic purpose<br />
of computing an <strong>EDI</strong> is to know comparative status of a<br />
state vis-à-vis other states with regard to different<br />
aspects of universalisation.<br />
Variables Used<br />
The Working Group on the <strong>EDI</strong> identified a number<br />
of indicators falling under different aspects of<br />
universalisation of education, covering input, process<br />
and outcome indicators. This set of indicators take note<br />
of all aspects and is expected to present the true picture<br />
1 Elementary Education in India: Progress towards UEE: <strong>DISE</strong> Flash Statistics: 2007-08 ; NUEPA and Ministry of Human Resource Development,<br />
Government of India, New Delhi, 2009<br />
2 Contributions received from the members of the Multi-Disciplinary Expert and Core Group on <strong>EDI</strong> constituted by the MHRD, in particular<br />
Dr. Deepa Sankar, World Bank, Delhi, and Mr. Dhir Jhingran, MHRD, New Delhi in developing methodology and identification of indicators<br />
are gratefully acknowledged. Inputs received from Prof. Shri Prakash on this section is also thankfully acknowledged.<br />
191
Part V<br />
Elementary Education in India : Analytical Report<br />
of universalisation. The variables used to compute the<br />
<strong>EDI</strong> in the present exercise are presented in Table E-1. It<br />
may also be noted that the <strong>EDI</strong> in India is still evolving<br />
and each indicator used have a specific purpose.<br />
However, they are not fixed and hence a review is being<br />
undertaken periodically and new indicators are added<br />
to the existing set of indicators or a few of them may be<br />
dropped or used in the modified form. In the 2007-08<br />
<strong>EDI</strong> computation, an improved version of a few variables<br />
has been used. Percentage of access-less habitation was<br />
one such variable. Similarly, in place of schools without<br />
drinking water facility, schools with drinking water facility<br />
has been used as a positive variable. In place of Gross<br />
Enrolment Ratio of SC/ST population, percentage of SC/<br />
ST population (to total<br />
population, 2001 Census) minus<br />
percentage of SC/ST share of<br />
enrolment in Primary and Upper<br />
Primary classes has been used to<br />
assess participation of the SC/ST<br />
children. As many as 23<br />
indicators have been used in<br />
computing the <strong>EDI</strong> which are<br />
further re-grouped into the<br />
following four sub-groups:<br />
Access,<br />
<br />
<br />
<br />
Infrastructure,<br />
<strong>Teacher</strong>s, and<br />
Outcome indicators.<br />
The <strong>DISE</strong> provides information on most of these<br />
indicators that have been used to compute the <strong>EDI</strong> at<br />
Primary and Upper Primary levels of education in 2007-<br />
08. Under the access indicators, two indicators namely,<br />
percentage of un-served habitations and availability of<br />
schools per thousand child population (6-11/11-14<br />
years) have been used. The projected child population<br />
provided by the Office of the Registrar General of India<br />
has been used, while the percentage of un-served<br />
habitations has been obtained from the All-India<br />
Education Survey: 2002-03. It may be noted that the<br />
latest information on un-served habitations is available<br />
only for the year 2002-03, though a number of Primary<br />
and Upper Primary schools have been opened across<br />
the county since then. Thus the same may not present<br />
the true picture with regard to the availability of<br />
“It may be noted that the<br />
<strong>EDI</strong> in India is still evolving<br />
and each indicator used have a<br />
specific purpose. However,<br />
they are not fixed and hence a<br />
review is being undertaken<br />
periodically and new indicators<br />
are added to the existing set<br />
of indicators or a few of them<br />
may be dropped or used in the<br />
modified form”<br />
schooling facility in 2007-08. However, in view of the<br />
absence of other independent source of data on<br />
coverage of habitations, except state reports, the <strong>EDI</strong><br />
continues to use 2002-03 data, which will be updated<br />
as and when independent data becomes available. In<br />
the absence of latest data, the 2002-03 data has been<br />
corrected with reference to new schools (government)<br />
opened since 2002-03. In addition, ratio of Primary to<br />
Upper Primary schools/sections has also been used as<br />
an indicator of access at Upper Primary level of<br />
education. While computing the ratio, both Primary and<br />
Upper Primary schools as well as Primary and Upper<br />
Primary sections attached to Secondary and Higher<br />
Secondary schools have been considered.<br />
The Working Group on the<br />
<strong>EDI</strong> identified five indicators<br />
under infrastructure set of<br />
indicators. The average studentclassroom<br />
ratio, percentage of<br />
schools with student-classroom<br />
ratio 60 and above, percentage<br />
of schools with drinking water<br />
facility in school and percentage<br />
of schools with common and<br />
girls’ toilet are such indicators.<br />
The third set of indicators, six in<br />
numbers, is teacher related<br />
indicators. They are: Pupilteacher<br />
ratio, percentage of<br />
female teachers, schools with PTR 60 and above,<br />
percentage of single-teacher schools, percentage of<br />
schools with less than 3 teachers and percentage of<br />
teachers without professional qualifications.<br />
The last set of indicators is related to outcome<br />
indicators among them gross enrolment ratio is the most<br />
important one. While computing the GER, projected<br />
population figures provided by the Office of the Registrar<br />
General of India have been used to workout 6-11 and<br />
11-14 year population. As already mentioned, the GER<br />
for SC and ST population, percentage difference of SC/<br />
ST population in 2001 Census and percentage of SC/ST<br />
enrolment to total enrolment at Primary and Upper<br />
Primary level of education have been used to assess the<br />
participation of SC/ST children (in case of negative<br />
difference, the same is treated to be zero; thus meaning<br />
192
Educational Development Index<br />
Part V<br />
that all children are enrolled). Gender Parity Index<br />
(enrolment) is another important indicator which shows<br />
Component<br />
ACCESS<br />
INFRASTRUCTURE<br />
Table E1<br />
<strong>Indicators</strong> Used in Computing <strong>EDI</strong><br />
the extent of participation of girls compared to their<br />
counterpart boys in the educational programmes. One<br />
Indicator<br />
Percentage of Habitations not Served* (corrected with reference to new schools<br />
(Government) opened since 2002-03)<br />
Availability of Schools per 1000 Child Population<br />
Ratio of Primary to Upper Primary Schools/Sections (only at Upper Primary stage)<br />
Average Student-Classroom Ratio<br />
Schools with Student Classroom Ratio ≥ 60<br />
Schools with Drinking Water facility<br />
Schools with Common toilet<br />
Schools with Girls’ toilet<br />
Percentage of Female <strong>Teacher</strong>s<br />
Pupil-<strong>Teacher</strong> Ratio<br />
TEACHERS Schools with Pupil-<strong>Teacher</strong> Ratio ≥ 60<br />
OUTCOME<br />
Single-<strong>Teacher</strong> Schools (in schools with more than 15 students)<br />
Percentage of Schools with ≤ 3 teachers<br />
<strong>Teacher</strong>s without Professional Qualification<br />
Gross Enrolment Ratio – Overall<br />
Participation of Scheduled Castes Children: Percentage SC Population (2001 Census)-<br />
Percentage SC Enrolment<br />
Participation of Scheduled Tribes Children: Percentage ST Population (2001 Census)-<br />
Percentage ST Enrolment<br />
Gender Parity Index in Enrolment<br />
Repetition Rate<br />
Drop-out Rate*<br />
Ratio of Exit Class over Class I Enrolment (only at Primary stage)<br />
Percentage of Passed Children to Total Enrolment<br />
Percentage of Appeared Children passing with 60 per cent and more marks<br />
Note:<br />
For methodological details, please refer:<br />
Addressing Education Disparity: Using District Level Education Development Indices for Equitable Resource Allocation, Policy Research<br />
Working Paper 4955, The World Bank, June 2009 by Dhir Jhingran and Deepa Sankar.<br />
Educational Development Index: A Suggestive Framework for Computation by Arun C. Mehta and S. A. Siddiqui, NUEPA, New Delhi,<br />
Unpublished, 2007.<br />
<strong>Indicators</strong> used for constructing the <strong>EDI</strong> were pre-determined by the MHRD, Government of India. Contributions received from the<br />
members of the Multi-Disciplinary Expert and Core Group on the <strong>EDI</strong> constituted by the MHRD in 2005-06 is gratefully acknowledged.<br />
<strong>Indicators</strong> were normalized before the Principal Component Analysis was applied to decide the factor loadings and weights.<br />
Separate dimensional indices were constructed first before finalizing the <strong>EDI</strong>; and<br />
* Number of access-less habitations has been obtained from the Seventh All India Education Survey and drop-out rate at Upper Primary<br />
level from the Selected Educational Statistics. Wherever necessary projected child population provided by the Office of the Registrar<br />
General of India has been used.<br />
193
Part V<br />
Elementary Education in India : Analytical Report<br />
Figure 5.1<br />
<strong>EDI</strong> (Index and Rank) at Primary Level : All Managements, 2007-08<br />
194
Educational Development Index<br />
Part V<br />
of the other important outcome indicators is the ratio<br />
of exit class over Class I enrolment which has been used<br />
only at the Primary level. A few states reported this to<br />
be above 100 percent which is treated as hundred in<br />
the <strong>EDI</strong> computations. The average dropout and<br />
repetition rates are other important outcome indicators<br />
which have been computed by using the <strong>DISE</strong> data based<br />
on common schools in 2006-07 and 2007-08. The states<br />
having negative dropout rate are considered as missing<br />
values. The pass percentage and percentage of appeared<br />
children passing with 60 percent and above marks in<br />
terminal Grades IV/V and VII/VIII, considered as proxy<br />
indicators of learners’ attainment, are also used in the<br />
outcome indicators in the <strong>EDI</strong>. Needless to mention that<br />
while analysing the <strong>EDI</strong>, data limitations presented above<br />
should be kept in mind.<br />
Methodology<br />
A cursory look at the set of 23 indicators (Table E-<br />
1) reveals that they have either direct or inverse<br />
relationship. Some of these<br />
indicators are in ratio form and<br />
others in percentage form. In<br />
view of this, each indicator<br />
considered in the <strong>EDI</strong><br />
computation is first required to<br />
be normalised. Normalised<br />
values range between 0 and 1<br />
and it indicates the relative<br />
position of states with reference<br />
to a selected indicator. Thus in<br />
the case of each indicator, in<br />
view of its nature, the best value<br />
and the worst value are identified which are then used<br />
to transform by using the following formula:<br />
[<br />
{Best X i<br />
– Observed X ij<br />
}<br />
]<br />
NV ij<br />
= 1– –––––––––––––––––––––<br />
{Best X i<br />
– Worst X i<br />
}<br />
“A cursory look at the set of<br />
23 indicators reveals that<br />
they have either direct or<br />
inverse relationship. Some<br />
of these indicators are in<br />
ratio form and others in<br />
percentage form. In view<br />
of this, each indicator<br />
considered in the <strong>EDI</strong><br />
computation was normalised”<br />
where NV ij<br />
represents normalized index of i th indicator<br />
of j th state and X i<br />
is the original value of the i th indicator.<br />
Unlike in the previous years, in the case of a few<br />
variables, policy options were explored to identify the<br />
best values instead of the observed values (normalized<br />
values in the case of such variables, if obtained above<br />
one are treated as one). Some of such variables are:<br />
access-less habitations (best value, zero), average pupilteacher<br />
and students-classroom ratio (best value, 40),<br />
drop out rate (best value, zero), percentage of schools<br />
having PTR and SCR 60 and above (best value, zero),<br />
percentage of single-teacher schools (best value, zero)<br />
and percentage of teachers without professional<br />
qualification (best value, zero).<br />
Upon receiving normalized values, the next step was<br />
to assign factor loadings and weights. Weights to<br />
indicators can be assigned in a number of ways. One can<br />
judge the significance of an indicator and accordingly<br />
assign weight which is based on the value judgment of<br />
an individual. On the other hand, one can assign equal<br />
weights to all the indicators or assign different weights<br />
to different indicators according to the significance of an<br />
indicator. The weightage in the computation of an <strong>EDI</strong> in<br />
the present exercise is determined by using Factor<br />
Loadings and Eigen Values from the Principal Component<br />
Analysis (PCA). The PCA helps in reducing the number<br />
of indicators (indicators/categories) without losing their<br />
significance that also simplifies analysis. The PCA helps<br />
in weighing each indicator<br />
according to its statistical<br />
significance.The components<br />
identified are known as Principal<br />
Components which explain<br />
maximum variance among a set<br />
of indicators. Therefore, the<br />
Principal Component Analysis is<br />
used to obtain factor loading and<br />
weights of the indicators in each<br />
of the four sets of indicators, that<br />
is done first at the Primary level<br />
and then at the Upper Primary<br />
level of education. Needless to mention that Primary<br />
stage/level of education consists of all Primary schools/<br />
sections irrespective of the type of schools; and Upper<br />
Primary stage/level of education consists of all the Upper<br />
Primary schools/sections irrespective of the type of<br />
schools. This means that all the schools imparting<br />
elementary education across the country irrespective of<br />
the type of school are considered in computing the <strong>EDI</strong><br />
which includes schools under the government as well as<br />
private managements. Thus, indices for all the four types<br />
of indicators have been first obtained separately for<br />
Primary and Upper Primary level of education. It is then<br />
used to compute composite <strong>EDI</strong> for Primary and Upper<br />
195
Part V<br />
Elementary Education in India : Analytical Report<br />
Primary levels of education separately. The composite <strong>EDI</strong><br />
for Primary and Upper Primary levels of education is used<br />
to obtain the composite <strong>EDI</strong> for the Elementary level of<br />
education.<br />
In this section, the outcome of the <strong>EDI</strong> based on<br />
the <strong>DISE</strong> 2007-08 data is presented.<br />
Analysis of the <strong>EDI</strong><br />
In view of the different sizes and geographical<br />
locations of different States and UTs, they are further<br />
re-grouped under major states (21 states), states from<br />
the north-eastern region (seven states, excluding Assam,<br />
which has been considered as a<br />
major state because of its size<br />
and experience in DPEP), and<br />
smaller states (seven states/UTs).<br />
All the three groups and states<br />
in each group are at different<br />
levels of education development.<br />
In view of spatial dimension,<br />
their need and requirement vary<br />
from state to state. For example,<br />
north-eastern states may need<br />
more new schools than in the<br />
states from the southern region.<br />
Similarly, smaller States/UTs such<br />
as the Andaman and Nicobar Islands because of their<br />
location, need to be analysed separately. Most of the<br />
major states have experience of implementing large scale<br />
programmes, such as the DPEP, but the same is not true<br />
in the case of states in the other two groups, which<br />
practically did not experience any such programme in<br />
the past. The SSA is the first major programme which<br />
has been initiated in these smaller states besides the<br />
major states. Within each state group, the <strong>EDI</strong> of each<br />
state has been used to assign fresh rankings based on<br />
each set of indicators as well as separately for Primary,<br />
Upper Primary and composite Elementary levels of<br />
education. The <strong>EDI</strong> reveals a lot about the regional<br />
variations that exist in the country which is true both<br />
for Primary and Upper Primary levels of education.<br />
North-Eastern States<br />
The seven states grouped under the north-eastern<br />
region are Arunachal Pradesh, Manipur, Meghalaya,<br />
“In view of the different<br />
sizes and geographical<br />
locations of different States<br />
and UTs, they are further<br />
re-grouped under major<br />
states, states from the<br />
north-eastern region and<br />
smaller states. All the three<br />
groups and states in each<br />
group are at different levels<br />
of education development”<br />
Mizoram, Nagaland, Sikkim, and Tripura. Assam is not<br />
included in this group because of its size and also because<br />
of the fact that it has the experience of the DPEP. The<br />
<strong>EDI</strong> presented in Table E-2 reveals that Mizoram<br />
outperformed the other six states in the region which is<br />
true for Primary, Upper Primary and composite Primary<br />
and Upper Primary (Elementary) levels of education. In<br />
the previous years, Sikkim was ranked first with regard<br />
to Primary and Composite Primary and Upper Primary<br />
levels of education. Incidentally, Mizoram is placed 16 th<br />
among all the 35 States and UTs of the country for<br />
composite Primary and Upper Primary levels of<br />
education. The state attained an overall <strong>EDI</strong> of 0.705<br />
for Elementary, 0.679 for<br />
Primary (14 th rank), and<br />
0.731(17 th rank) for Upper<br />
Primary levels of education that<br />
is treated as above average as an<br />
<strong>EDI</strong> ranges between 0.00 and<br />
1.00. On the other hand, Sikkim<br />
with an <strong>EDI</strong> of 0.639 at Primary<br />
level and Manipur with an <strong>EDI</strong><br />
of 0.686 for Upper Primary level<br />
are positioned second in Primary<br />
and Upper Primary levels of<br />
Education, respectively. In the<br />
previous year 2006-07, Sikkim<br />
was ranked first in Primary level and Mizoram, first in<br />
both Upper Primary and composite Primary and Upper<br />
Primary levels of education. Mizoram could improve its<br />
<strong>EDI</strong> values and ranks in Primary, Upper Primary and<br />
composite Primary and Upper Primary levels of<br />
education, but Arunachal Pradesh could not improve its<br />
position. It is placed 34 th in the all-India ranking in<br />
composite Primary and Upper Primary levels of education<br />
as also at the Primary level. At Upper Primary level,<br />
Arunachal Pradesh is ranked 32 nd with an <strong>EDI</strong> value of<br />
0.548 compared to 0.842 in the case of Kerala, which is<br />
ranked first at this level of education. Analysis of<br />
individual indicators across all four types reveals that it<br />
could not improve much over the previous year.<br />
Individual <strong>EDI</strong>s in each set of indicators, however,<br />
reveal that Mizoram does not stand first in all the four<br />
sets of indicators. It is true both for Primary and Upper<br />
Primary levels of education. So far as the access indicators<br />
at Primary level are concerned, it is found to be very<br />
196
Educational Development Index<br />
Part V<br />
high at 0.788 in Meghalaya, compared to 0.744 in<br />
Mizoram. The lowest <strong>EDI</strong> of access indicators is observed<br />
in Tripura, having an <strong>EDI</strong> of 0.430, followed by Manipur<br />
with an <strong>EDI</strong> of 0.432. On the other hand, Nagaland is<br />
placed third with an <strong>EDI</strong> of 0.587 in the case of access<br />
indicators, compared to an overall third rank at Primary<br />
level of education but the situation is not the same in<br />
other sets of indicators at Primary level. Nagaland is<br />
placed 23 rd (<strong>EDI</strong>, 0.653) in overall ranking in composite<br />
Primary and Upper Primary levels of education.<br />
average SCR, availability of drinking water and common<br />
toilets and girls’ toilets, are considered under<br />
infrastructural set of indicators. Sikkim is followed by<br />
Nagaland with <strong>EDI</strong> of 0.658. The lowest <strong>EDI</strong> (0.371) is<br />
observed in Meghalaya which is quite similar to the<br />
position in the previous year 2006-07. This shows a wide<br />
spread regional variations. Meghalaya also has the<br />
lowest infrastructure index (0.400) in case of Upper<br />
Primary level, indicating that by and large the majority<br />
of its schools imparting Elementary education do not<br />
Table E2(A)<br />
Indices & Ranking at Primary/Upper Primary Level: North-Eastern States (Excluding Assam)<br />
All Managements: All Schools: 2007-08<br />
State<br />
Access Index Infrastructure Index <strong>Teacher</strong>s Index<br />
Primary Upper Primary Upper Primary Upper<br />
Level Rank Primary Rank Level Rank Primary Rank Level Rank Primary Rank<br />
Level Level Level<br />
Arunachal<br />
Pradesh 0.500 4 0.171 7 0.427 6 0.646 4 0.367 7 0.701 6<br />
Manipur 0.432 6 0.582 4 0.562 5 0.665 3 0.565 5 0.752 2<br />
Meghalaya 0.788 1 0.605 3 0.371 7 0.400 7 0.521 6 0.746 3<br />
Mizoram 0.744 2 0.943 1 0.651 3 0.644 5 0.723 2 0.723 5<br />
Nagaland 0.587 3 0.573 6 0.658 2 0.690 2 0.682 3 0.733 4<br />
Sikkim 0.484 5 0.581 5 0.744 1 0.775 1 0.731 1 0.792 1<br />
Tripura 0.430 7 0.699 2 0.599 4 0.613 6 0.619 4 0.681 7<br />
State<br />
Outcome Index<br />
Composite <strong>EDI</strong><br />
Primary Upper Primary Upper Primary &<br />
Level Rank Primary Rank Level Rank Primary Rank Upper Primary Rank<br />
Level Level Level<br />
Arunachal<br />
Pradesh 0.405 7 0.613 4 0.422 7 0.548 7 0.485 7<br />
Manipur 0.573 3 0.734 1 0.537 5 0.686 2 0.611 4<br />
Meghalaya 0.483 6 0.604 5 0.527 6 0.586 6 0.556 6<br />
Mizoram 0.582 2 0.636 3 0.679 1 0.731 1 0.705 1<br />
Nagaland 0.555 4 0.690 2 0.630 3 0.676 3 0.653 3<br />
Sikkim 0.509 5 0.484 7 0.639 2 0.672 4 0.656 2<br />
Tripura 0.621 1 0.594 6 0.572 4 0.647 5 0.609 5<br />
So far as infrastructure set of indicators at Primary<br />
level is concerned, Sikkim has the highest <strong>EDI</strong> (0.744),<br />
which is also true for Upper Primary level of education<br />
(<strong>EDI</strong>, 0.775). It may be recalled that indicators, such as<br />
possess minimum facilities in schools. But the position<br />
of the state in the case of other sets of indicators is<br />
slightly better than that of the infrastructure index which<br />
is true both for Primary and Upper Primary levels of<br />
197
Part V<br />
Elementary Education in India : Analytical Report<br />
education. The schools in Arunachal Pradesh also do<br />
not have minimum facilities as the <strong>EDI</strong>s obtained at the<br />
in the Primary schools across the seven states of the<br />
north-eastern region.<br />
Figure 5.2<br />
<strong>EDI</strong> at Primary Level : North-Eastern States<br />
Table E2(B)<br />
Composite Educational Development Index: North-Eastern States (Excluding Assam)<br />
Primary and Upper Primary Levels: All Schools & All Managements<br />
<strong>EDI</strong> & Rank <strong>EDI</strong> & Rank Composite <strong>EDI</strong> & Rank<br />
State/UT Primary Level Upper Primary Level (Primary & Upper Primary)<br />
2006-07 2007-08 2006-07 2007-08 2006-07 2007-08<br />
Arunachal Pradesh 0.432 7 0.422 7 0.484 7 0.548 7 0.458 7 0.485 7<br />
Manipur 0.547 4 0.537 5 0.649 2 0.686 2 0.598 3 0.611 4<br />
Meghalaya 0.512 6 0.527 6 0.522 6 0.586 6 0.517 6 0.556 6<br />
Mizoram 0.663 2 0.679 1 0.658 1 0.731 1 0.661 2 0.705 1<br />
Nagaland 0.590 3 0.630 3 0.572 4 0.676 3 0.581 4 0.653 3<br />
Sikkim 0.686 1 0.639 2 0.637 3 0.672 4 0.662 1 0.656 2<br />
Tripura 0.542 5 0.572 4 0.547 5 0.647 5 0.545 5 0.609 5<br />
Primary and Upper Primary levels, respectively, are 0.427<br />
and 0.646. It is worth mentioning here that Arunachal<br />
Pradesh stands last in Primary level <strong>EDI</strong> (0.422) as its<br />
ranking is 34 out of 35 states included in the analysis. In<br />
2006-07, it was at 33 rd position. Arunachal Pradesh has<br />
also a lower rank in Upper Primary (32) and Elementary<br />
(34) levels as a whole. It is also interesting to further<br />
note that barring Mizoram, the infrastructure facilities<br />
are much better in Upper Primary schools than the same<br />
So far as the set of teachers’ indicators is concerned,<br />
it is Sikkim that is on top of the list with <strong>EDI</strong> of 0.731,<br />
compared to an <strong>EDI</strong> of 0.780 in the previous year. It<br />
may be recalled that six indicators concerning teachers,<br />
including percentage of female teachers and pupilteacher<br />
ratio, were used. Mizoram is placed second with<br />
an <strong>EDI</strong> value of 0.723 and Arunachal Pradesh, the last<br />
with an <strong>EDI</strong> 0.367. In the case of teachers’ indicators,<br />
Sikkim, with an <strong>EDI</strong> of 0.731, stands 12 th among all the<br />
198
Educational Development Index<br />
Part V<br />
35 States/UTs in Primary education; and with an <strong>EDI</strong> of<br />
0.792 in Upper Primary level of education, its rank is<br />
18 th . Last year, Sikkim was ranked 12 th in the case of<br />
teachers index at Upper Primary level. Likewise, the state<br />
has lower ranks in all the three levels of education<br />
compared to its ranking in 2006-07. It is also true for<br />
individual set of indicators. Like infrastructure, states in<br />
the north-eastern region are also better placed at Upper<br />
Primary level with regard to teachers’ indicators,<br />
compared to Primary level. The lowest ranked state in<br />
the north-eastern region with regard to teachers’<br />
indicators is Arunachal Pradesh with an <strong>EDI</strong> of 0.367 at<br />
Primary and Tripura with an <strong>EDI</strong> of 0.681 at Upper<br />
Primary level. The corresponding position of Arunachal<br />
Pradesh, among all the 35 States/UTs, is 33 rd at Primary<br />
(<strong>EDI</strong>, 0.367) and 24 th at Upper Primary level of education<br />
(<strong>EDI</strong>, 0.701) that shows decline in its position compared<br />
to the same in the previous year.<br />
value of 0.734 ranked first in outcome index at Primary<br />
and Upper Primary levels of education, respectively.<br />
Though Mizoram stands first with regard to its position<br />
at the Primary level, it is not true in the case of outcome<br />
index where it is ranked second with an <strong>EDI</strong> value of<br />
0.582. At the Upper Primary level, it is ranked first<br />
compared to the third position in the case of outcome<br />
index. It is observed that different states have different<br />
positions in different sets of indicators. A careful<br />
examination of all the four sets of indicators as well as<br />
individual indicators, and also computation of districtspecific<br />
<strong>EDI</strong>s in each state, will help states to identify<br />
limitations without which no improvement is expected.<br />
The provisions made under the SSA can also be best<br />
used if such an analysis is carried out district-wise and<br />
within the district, block-wise.<br />
Smaller States<br />
The last set of indicators used is the outcome<br />
indicators. As many as nine indicators are used to see<br />
the position of all the 35<br />
states, including seven states<br />
from the north-eastern region.<br />
The list of indicators used is<br />
quite comprehensive through<br />
which the true picture of<br />
universalisation can be obtained.<br />
Barring Sikkim and Tripura, all the<br />
other states in the north-eastern<br />
region reported a higher <strong>EDI</strong> for<br />
Upper Primary level compared<br />
to Primary level of education,<br />
which is just like the teachers<br />
and infrastructure indicators<br />
presented above. Among all the<br />
states at Primary level, Sikkim is<br />
ranked 31 st (in 2007-08) compared to 35 th position of<br />
Arunachal Pradesh. It shows no improvement in the case<br />
of Arunachal Pradesh and deterioration in the case of<br />
Sikkim over the previous year in outcome indicators.<br />
Correspondingly, they stand 7th and 5th within the<br />
north-eastern states with respective <strong>EDI</strong> values of 0.405<br />
and 0.509. The <strong>EDI</strong> at Upper Primary level in the case<br />
of Sikkim being lower than Primary level is 0.484, which<br />
may be termed as far below the average <strong>EDI</strong>. However,<br />
Tripura with an <strong>EDI</strong> of 0.621 and Manipur with an <strong>EDI</strong><br />
“It is observed that different<br />
states have different<br />
positions in different sets of<br />
indicators. A careful<br />
examination of all the four<br />
sets of indicators as well as<br />
individual indicators, and also<br />
computation of districtspecific<br />
<strong>EDI</strong>s in each state,<br />
will help states to identify<br />
limitations without which no<br />
improvement is expected”<br />
The States/UTs, such as Andaman and Nicobar<br />
Islands, Chandigarh, Dadra and Nagar Haveli, Daman<br />
and Diu, Goa, Lakshadweep, and<br />
Puducherry, are the seven states/<br />
UTs which have been grouped<br />
under smaller states, based on<br />
the total number of schools and<br />
population they have (Table E-<br />
3). May be these states are small<br />
in size but a cursory look at the<br />
<strong>EDI</strong> values indicates that a few<br />
of them are doing much better<br />
than a number of major states,<br />
both in Primary and Upper<br />
Primary levels of education. The<br />
<strong>EDI</strong> values and rankings during<br />
2006-07 and 2007-08 indicate<br />
a marked improvement in the<br />
case of Lakshadweep and Puducherry in composite<br />
Primary and Upper Primary levels of education.<br />
Puducherry is not only ranked first within the set of<br />
smaller states but is also ranked first with an <strong>EDI</strong> value<br />
of 0.808 among the States and UTs of the country in<br />
the case of composite Primary and Upper Primary levels<br />
of education. The corresponding <strong>EDI</strong> value of Bihar<br />
which is ranked 35 th is as low as 0.406; thus showing a<br />
significant regional deviation in the <strong>EDI</strong> values revealing<br />
that states are a different pace of educational<br />
199
Part V<br />
Elementary Education in India : Analytical Report<br />
development in general and elementary education in<br />
particular. Among all states, Puducherry is ranked first<br />
in the case of Primary (<strong>EDI</strong>, 0.799) and third in the case<br />
of Upper Primary (<strong>EDI</strong>, 0.816) level of education. Not<br />
of 0.816 followed by Chandigarh (<strong>EDI</strong>, 0.795) and<br />
Daman and Diu (<strong>EDI</strong>, 0.789). With an <strong>EDI</strong> value of<br />
0.723, Dadra and Nagar Haveli is ranked seventh within<br />
the seven smaller states.<br />
Table E3(A)<br />
Indices & Ranking at Primary/Upper Primary Level: Smaller States/UTs<br />
All Managements: All Schools, 2007-08<br />
Access Index Infrastructure Index <strong>Teacher</strong>s Index<br />
State/UT Primary Rank Upper Rank Primary Rank Upper Rank Primary Rank Upper Rank<br />
Level Primary Level Primary Level Primary<br />
Level Level Level<br />
A & N Islands 0.127 7 0.544 7 0.888 1 0.871 2 0.850 5 0.900 4<br />
Chandigarh 0.500 4 0.760 3 0.785 5 0.808 3 0.991 1 0.998 1<br />
D & N Haveli 0.633 1 0.741 4 0.607 7 0.683 7 0.606 7 0.848 7<br />
Daman & Diu 0.381 6 0.809 1 0.787 4 0.824 4 0.876 3 0.858 6<br />
Goa 0.458 5 0.607 6 0.708 6 0.866 6 0.732 6 0.911 2<br />
Lakshadweep 0.535 2 0.795 2 0.836 3 0.849 1 0.874 4 0.867 5<br />
Puducherry 0.528 3 0.736 5 0.880 2 0.890 5 0.880 2 0.910 3<br />
Outcome Index<br />
<strong>EDI</strong><br />
State/UT Primary Rank Upper Rank Primary Rank Upper Rank Composite (Primary Rank<br />
Level Primary Level Primary & Upper Primary)<br />
Level Level Level<br />
A & N Islands 0.580 5 0.669 3 0.652 6 0.762 5 0.707 6<br />
Chandigarh 0.509 6 0.561 7 0.730 3 0.795 3 0.763 3<br />
D & N Haveli 0.480 7 0.602 5 0.588 7 0.723 7 0.656 7<br />
Daman & Diu 0.722 3 0.640 4 0.712 4 0.789 4 0.750 4<br />
Goa 0.798 2 0.563 6 0.677 5 0.754 6 0.716 5<br />
Lakshadweep 0.701 4 0.756 1 0.756 2 0.821 1 0.788 2<br />
Puducherry 0.860 1 0.685 2 0.799 1 0.816 2 0.808 1<br />
only that it could improve its position in composite<br />
Primary and Upper Primary index but it has also<br />
advanced from second (<strong>EDI</strong>, 0.761) position in 2006-07<br />
to first (<strong>EDI</strong>, 0.799) position with regard to Primary level<br />
of education. Irrespective of its educational level,<br />
Puducherry is ranked first among the smaller set of states<br />
but it is not true in the case of all the four individual sets<br />
of indicators used in computing the <strong>EDI</strong>, both at the<br />
Primary and Upper Primary levels of education. The<br />
second among these states is Lakshadweep with an <strong>EDI</strong><br />
of 0.756 at Primary and 0.788 in composite Primary and<br />
Upper Primary level of education. In case of Upper<br />
Primary level, Puducherry is ranked second with an <strong>EDI</strong><br />
It may be of interest to note that Chandigarh’s<br />
overall ranking is 6 th (<strong>EDI</strong> 0.730) at the Primary and 4 th<br />
(<strong>EDI</strong> 0.795) at Upper Primary level of education. The other<br />
smaller state doing better in overall all-India ranking is<br />
Lakshadweep, which has only 37 schools under its<br />
administration. It stands third at Primary level (<strong>EDI</strong>, 0.756)<br />
and second (<strong>EDI</strong>, 0.821) at Upper Primary level of<br />
education. Except teachers index, it has outperformed<br />
other states in all other sets of indices. Irrespective of the<br />
states, the <strong>EDI</strong> value at Upper Primary level of education<br />
is much higher than at the Primary level of education<br />
that is quite similar to the states in the north-eastern<br />
region and also during the previous year. Further, it is<br />
200
Educational Development Index<br />
Part V<br />
observed that except Dadra and Nagar Haveli (23 rd rank),<br />
all smaller states have rankings within the first 16 states<br />
at the Primary level. With regard to ranking at Upper<br />
Primary level, all of them except Dadra and Nagar Haveli<br />
(18 th rank) stands within the first 14 states.<br />
0.795) of education. Even within a set of indicators, the<br />
states have not provided equal measure of Primary and<br />
Upper Primary schooling facilities. Further, it is observed<br />
that by and large states have a higher <strong>EDI</strong> value at Upper<br />
Primary level than at Primary level.<br />
Figure 5.3<br />
<strong>EDI</strong> at Primary Level : Smaller States/UTs<br />
Like the states in the north-eastern region, separate<br />
analysis is also carried out in the case of each of the<br />
four sets of indicators. It is observed that <strong>EDI</strong> value for<br />
access indicators is much lower than for the other sets<br />
of indicators, which is true for both Primary and Upper<br />
Primary levels. The highest <strong>EDI</strong> for access indicators at<br />
Primary level is observed in Dadra and Nagar Haveli (<strong>EDI</strong>,<br />
0.633) and the lowest (<strong>EDI</strong>, 0.127) in the Andaman and<br />
Nicobar Islands. At Upper Primary level, the lowest <strong>EDI</strong><br />
is also observed in the Andaman and Nicobar Islands<br />
(<strong>EDI</strong>, 0.544) and the highest in Daman and Diu (<strong>EDI</strong>,<br />
0.809). Lakshadweep stands second among seven<br />
smaller states included in the analysis which is true for<br />
both Primary (<strong>EDI</strong>, 0.535) and Upper Primary levels (<strong>EDI</strong>,<br />
It may be recalled that only two indicators, namely,<br />
access-less habitations and the number of schools per<br />
thousand population, were used under access indicators<br />
at Primary level. Since the <strong>DISE</strong> does not collect<br />
information according to habitations, the number of<br />
access-less habitations in each state, as mentioned<br />
above, is taken from the All India School Education<br />
Survey (AISES). It is also true that a good number of<br />
habitations have been provided with schooling facilities<br />
since 2002-03, the year for which the AISES data is the<br />
latest available. This is also true in view of the SSA under<br />
which activities in terms of opening of new schools<br />
picked-up in 2002-03 onwards; this is not reflected in<br />
school-less habitations. In the light of these observations,<br />
201
Part V<br />
Elementary Education in India : Analytical Report<br />
the percentage of access-less habitations has been<br />
corrected with reference to new schools opened since<br />
2002-03. In addition, the ratio of Primary to Upper<br />
Primary schools/sections has also been used as an<br />
indicator of access at the Upper Primary level of<br />
education to assess the availability of Upper Primary<br />
schooling facilities which, like other indicators, is<br />
computed based on the <strong>DISE</strong> data.<br />
The next set of indicators<br />
analysed is infrastructure<br />
indicators. The highest <strong>EDI</strong> value<br />
at Primary level is observed in the<br />
Andaman and Nicobar Islands<br />
(<strong>EDI</strong>, 0.888) and lowest (<strong>EDI</strong>,<br />
0.607) in the case of Dadra and<br />
Nagar Haveli. The Andaman and<br />
Nicobar Islands attained fifth<br />
position among 35 States/UTs in<br />
this respect and Dadra and Nagar<br />
Haveli, 25th. Puducherry’s overall<br />
position in infrastructure index at<br />
Upper Primary level is fourth with<br />
an <strong>EDI</strong> value of 0.890 compared<br />
to 0.880 (sixth rank) at Primary level. Except Dadra & Nagar<br />
Haveli (<strong>EDI</strong>, 0.607 and rank 25), other six smaller states<br />
ranked high and are within the first 17 amongst all the 35<br />
“Percentage of access-less<br />
habitations has been<br />
corrected with reference<br />
to new schools opened since<br />
2002-03. In addition, the<br />
ratio of Primary to Upper<br />
Primary schools/sections has<br />
also been used as an indicator<br />
of access at the Upper<br />
Primary level of education”<br />
states. It may be recalled that Dadra and Nagar Haveli is<br />
among the lowest ranked states having an overall rank of<br />
23 rd at Primary level (<strong>EDI</strong>, 0.588). However, it has improved<br />
its position at Upper Primary level from 24 th (<strong>EDI</strong>, 0.568)<br />
in 2006-07 to eighth (<strong>EDI</strong>, 0.723) in 2007-08. Further, it<br />
has also been observed that at these levels, the <strong>EDI</strong> values<br />
of infrastructure indicators rather than access indicators<br />
are much higher except in Dadra and Nagar Haveli. This is<br />
similar to the situation in 2006-07.<br />
Table E3(B)<br />
Composite Educational Development Index: Smaller States/UTs<br />
Primary and Upper Primary Levels: All Schools & All Managements<br />
The <strong>EDI</strong> also suggests that Upper<br />
Primary schools/sections are<br />
better placed with regard to<br />
infrastructure than in Primary<br />
schools/sections. This is quite<br />
similar to the states (barring a few<br />
states) in the north-eastern region.<br />
It is good to have better<br />
infrastructure in Upper Primary<br />
schools but it is equally important<br />
to provide better infrastructure<br />
also in all Primary schools for<br />
which provisions made under the<br />
SSA can be best utilised.<br />
The next set of indicators that have been analysed<br />
is indicators concerning teachers among which pupilteacher<br />
ratio and percentage of single-teacher schools<br />
<strong>EDI</strong> & Rank <strong>EDI</strong> & Rank Composite <strong>EDI</strong> & Rank<br />
State/UT Primary Level Upper Primary Level (Primary & Upper Primary)<br />
2006-07 2007-08 2006-07 2007-08 2006-07 2007-08<br />
A & N Islands 0.670 4 0.652 6 0.683 4 0.762 5 0.676 4 0.707 6<br />
Chandigarh 0.709 2 0.730 3 0.752 2 0.795 3 0.731 2 0.763 3<br />
D & N Haveli 0.502 7 0.588 7 0.568 7 0.723 7 0.535 7 0.656 7<br />
Daman & Diu 0.601 6 0.712 4 0.660 5 0.789 4 0.631 6 0.750 4<br />
Goa 0.636 5 0.677 5 0.654 6 0.754 6 0.645 5 0.716 5<br />
Lakshadweep 0.672 3 0.756 2 0.713 3 0.821 1 0.692 3 0.788 2<br />
Puducherry 0.761 1 0.799 1 0.780 1 0.816 2 0.771 1 0.808 1<br />
states in the case of Primary level of education. Almost<br />
similar positions are observed at Upper Primary level<br />
wherein the position of Dadra and Nagar Haveli is 23 rd<br />
and the rest of the six states are ranked among the first 14<br />
are the most prominent ones. In a good number of<br />
smaller states, the <strong>EDI</strong> values for teacher’s indicators<br />
are higher than for access and infrastructure indicators.<br />
It may be recalled that smaller states as well as states<br />
202
Educational Development Index<br />
Part V<br />
from the north-eastern region are better placed with<br />
regard to PTR, both at Primary and Upper Primary levels<br />
of education. This is also true in the case of a few other<br />
states, like Himachal Pradesh. However, in the process<br />
of normalization, 40:1 is considered to be the best PTR.<br />
The highest <strong>EDI</strong> at Primary level is observed in<br />
Chandigarh (<strong>EDI</strong>, 0.991) and the lowest (<strong>EDI</strong>, 0.606) in<br />
Dadra and Nagar Haveli, which is exactly similar to the<br />
ranking in 2006-07. The second ranked state for this<br />
set of indicators at Primary level is Puducherry with an<br />
<strong>EDI</strong> of 0.880, followed by Daman and Diu (<strong>EDI</strong>, 0.876)<br />
and Lakshadweep (<strong>EDI</strong>, 0.874). On the other hand, at<br />
Upper Primary level, Chandigarh with an <strong>EDI</strong> of 0.998<br />
is ranked first, followed by Goa (<strong>EDI</strong>, 0.911). Though<br />
small in size, Chandigarh is ranked first with regard to<br />
teacher indicators among all the 35 States/UTs. It applies<br />
to both Primary and Upper Primary levels of education.<br />
Further, it is observed that<br />
the ranking of smaller states,<br />
except Dadra and Nagar Haveli,<br />
both in case of Primary and<br />
Upper Primary levels, is very high<br />
with regard to teacher indicators<br />
analysed among the 35 states/<br />
UTs. Chandigarh UT is ranked<br />
first, both at Primary and Upper<br />
Primary levels, and Puducherry<br />
fourth at Primary and fifth at<br />
Upper Primary level of education. Another UT from this<br />
group, i.e. Lakshadweep, is also ranked high at sixth at<br />
Primary and eighth at Upper Primary levels of education.<br />
However, many of these states are not comfortably<br />
placed in other sets of indicators wherein their positions<br />
are much lower than the same in case of teacher-based<br />
indicators.<br />
Making available schooling facilities, infrastructure<br />
and teachers in schools should also be reflected in the<br />
outcome indicators. That is why outcome indicators are<br />
analysed at the last. It is noticed to have much lower<br />
<strong>EDI</strong> values than the infrastructure and teacher indicators<br />
and it is true for both Primary and Upper Primary levels<br />
of education. The highest <strong>EDI</strong> is observed in Puducherry<br />
at Primary (<strong>EDI</strong>, 0.860) and Lakshadweep at Upper<br />
Primary (<strong>EDI</strong>, 0.756) levels of education. It may be<br />
observed that Puducherry is not ranked first among other<br />
“It is good to have better<br />
infrastructure in Upper<br />
Primary schools but it is<br />
equally important to provide<br />
better infrastructure also in<br />
all Primary schools for which<br />
provisions made under the<br />
SSA can be best utilised”<br />
sets of indicators used in computation of the <strong>EDI</strong>. It is<br />
also of interest to note that in four out of seven states,<br />
the <strong>EDI</strong> values are much lower at Upper Primary level<br />
than at Primary level, which is just the reverse when<br />
other sets of indictors are considered. Infrastructure and<br />
teacher indicators are better placed in the Upper Primary<br />
level but the same is not true of outcome indicators<br />
that play the most important role in achieving the goal<br />
of universalisation of elementary education. Unlike in<br />
other sets of indicators, most of the smaller states<br />
(barring Goa and Puducherry) are not placed within the<br />
first 10 states at Primary level so far as outcome<br />
indicators are concerned. However, Puducherry is placed<br />
second among the 35 States/UTs with regard to outcome<br />
indicators at Primary level and 10 th at Upper Primary<br />
level. The fifth ranked state at Primary level is Goa but<br />
the state is ranked 26 th at Upper Primary level (<strong>EDI</strong>,<br />
0.563). The <strong>EDI</strong> for Chandigarh at Primary (<strong>EDI</strong>, 0.509)<br />
and at Upper Primary level (<strong>EDI</strong>,<br />
0.561) is much lower than the<br />
same in the case of Lakshadweep<br />
(ranked first at Primary level) and<br />
Puducherry (ranked second at<br />
Upper Primary level) with regard<br />
to outcome indicators within<br />
smaller states. Incidentally,<br />
Dadra and Nagar Haveli is one<br />
of the lowest ranked states with<br />
regard to outcome indicators at<br />
Primary level (ranked 34th).<br />
Major States<br />
As mentioned above, the seven states of the northeastern<br />
region and seven other smaller states have been<br />
clubbed in two separate groups, and the remaining 21<br />
states, including the national capital of Delhi, have been<br />
grouped under major states. Except Delhi, all the other<br />
states in the group have experience of initiating major<br />
programmes like the District Primary Education<br />
Programme (DPEP).<br />
So far as the composite Primary and Upper Primary<br />
<strong>EDI</strong> amongst 21 major states is concerned, the top five<br />
ranking states are Kerala (<strong>EDI</strong>, 0.791), Delhi (<strong>EDI</strong>, 0.780),<br />
Tamil Nadu (<strong>EDI</strong>, 0.771), Haryana (<strong>EDI</strong>, 0.755) and<br />
Gujarat (<strong>EDI</strong>, 0.748); the first three ranks are similar to<br />
the rankings in the previous year. Kerala, Delhi and Tamil<br />
203
Part V<br />
Elementary Education in India : Analytical Report<br />
Nadu maintained their first, second and third positions<br />
but Himachal Pradesh conceded its fourth position (<strong>EDI</strong>,<br />
0.695) to Haryana (<strong>EDI</strong>, 0.755). Karnataka has also<br />
moved to sixth position from the fifth position in 2006-<br />
07. However, Karnataka’s <strong>EDI</strong> value (0.743) in 2007-08<br />
its fourth position to Haryana. The <strong>EDI</strong> at Primary level<br />
in the case of Kerala is slightly lower in 2007-08 (0.741)<br />
than the same in 2006-07 (0.756). Kerala and Tamil<br />
Nadu are seen as educationally advanced states and are<br />
respectively placed at first (<strong>EDI</strong>, 0.842) and third (<strong>EDI</strong>,<br />
Table E4(A)<br />
Indices & Ranking at Primary/Upper Primary Level: Major States<br />
All Managements: All Schools, 2007-08<br />
State<br />
Access Index Infrastructure Index <strong>Teacher</strong>s Index<br />
Primary Upper Primary Upper Primary Upper<br />
Level Rank Primary Rank Level Rank Primary Rank Level Rank Primary Rank<br />
Level Level Level<br />
Andhra Pradesh 0.631 5 0.676 14 0.690 13 0.797 9 0.674 8 0.851 4<br />
Assam 0.701 1 0.607 17 0.316 20 0.386 20 0.328 21 0.659 13<br />
Bihar 0.556 8 0.481 20 0.233 21 0.343 21 0.334 20 0.412 20<br />
Chhattisgarh 0.673 3 0.783 4 0.555 16 0.570 17 0.448 16 0.473 19<br />
Delhi 0.515 13 0.784 3 0.909 2 0.871 4 0.937 2 0.935 2<br />
Gujarat 0.574 7 0.820 1 0.762 7 0.789 10 0.794 4 0.818 5<br />
Haryana 0.525 12 0.766 6 0.903 3 0.945 1 0.727 6 0.763 11<br />
Himachal Pradesh 0.445 20 0.803 2 0.684 14 0.724 14 0.660 10 0.803 8<br />
Jammu & Kashmir 0.676 2 0.743 7 0.540 17 0.627 15 0.648 11 0.798 9<br />
Jharkhand 0.636 4 0.482 19 0.339 19 0.495 18 0.379 19 0.555 16<br />
Karnataka 0.540 10 0.775 5 0.691 11 0.765 12 0.711 7 0.795 10<br />
Kerala 0.257 21 0.687 13 0.894 4 0.920 2 0.950 1 0.950 1<br />
Madhya Pradesh 0.554 9 0.694 12 0.721 9 0.764 13 0.446 17 0.501 18<br />
Maharashtra 0.477 19 0.709 11 0.739 8 0.821 6 0.732 5 0.807 7<br />
Orissa 0.485 17 0.634 16 0.616 15 0.626 16 0.536 13 0.615 14<br />
Punjab 0.487 15 0.720 10 0.917 1 0.917 3 0.663 9 0.810 6<br />
Rajasthan 0.586 6 0.737 8 0.716 10 0.817 8 0.471 15 0.685 12<br />
Tamil Nadu 0.505 14 0.605 18 0.808 5 0.819 7 0.811 3 0.876 3<br />
Uttar Pradesh 0.487 16 0.640 15 0.691 12 0.838 5 0.414 18 0.265 21<br />
Uttarakhand 0.537 11 0.731 9 0.772 6 0.769 11 0.543 12 0.572 15<br />
West Bengal 0.481 18 0.269 21 0.521 18 0.458 19 0.508 14 0.539 17<br />
Continued...<br />
is higher than the same in the previous year (0.680).<br />
The first three ranked states maintained their rankings<br />
both in case of Primary and Upper Primary levels of<br />
education but swapped each other within the first three<br />
positions. Delhi with an <strong>EDI</strong> value of 0.767 is ranked<br />
second at Primary level which is similar to its position in<br />
2006-07. However, Kerala at Primary level conceded its<br />
second position to Tamil Nadu, and Himachal Pradesh<br />
0.790) at Upper Primary level of education. As<br />
mentioned above, no major difference is observed in<br />
composite <strong>EDI</strong> of the first three states. However,<br />
irrespective of an educational level, the difference in<br />
<strong>EDI</strong> values between the highest and lowest ranked states<br />
is significant, showing that states are at different levels<br />
of educational development but the <strong>EDI</strong> values show<br />
that they have improved over the pervious year. This is<br />
204
Educational Development Index<br />
Part V<br />
also true for all the four sets of indicators used in<br />
computing the <strong>EDI</strong>.<br />
On the other hand, Bihar, Arunachal Pradesh and<br />
West Bengal are ranked 35, 34 and 33 in composite<br />
Primary and Upper Primary levels of education with an<br />
<strong>EDI</strong> as low as 0.406, 0.485 and 0.488 respectively, which<br />
is much lower than that of the top ranked states. However,<br />
these states have a slightly higher <strong>EDI</strong> values in 2007-08<br />
than the same in 2006-07 which is true (barring Arunachal<br />
ranked third, fourth and fifth, in composite Primary and<br />
Upper Primary levels of education among the 21 major<br />
states. Karnataka (0.743), Andhra Pradesh (0.740),<br />
Punjab (0.732) and Maharashtra (0.727), closely follow<br />
the first five ranked states (Table E-4) in composite<br />
Primary and Upper Primary levels of education.<br />
The individual <strong>EDI</strong> values of each of these states<br />
in four sets of indicators have also been analysed<br />
critically. First, the index of access indicators is discussed<br />
Figure 5.4<br />
<strong>EDI</strong> at Primary Level : Major States<br />
Pradesh at primary level) for Primary, Upper Primary and<br />
composite Primary and Upper Primary levels of education.<br />
In the overall ranking, Jharkhand is placed at 32 nd in<br />
composite <strong>EDI</strong> at Primary and Upper Primary levels<br />
compared to 34 th position in<br />
2006-07. Its <strong>EDI</strong> value has also<br />
improved from 0.381 in 2006-07<br />
to 0.491 in 2007-08 which is an<br />
encouraging sign.<br />
Like smaller states and<br />
states from the north-eastern<br />
region, the top ranked five states<br />
have higher <strong>EDI</strong> values at Upper<br />
Primary than at Primary level of<br />
education. For example, the <strong>EDI</strong>s<br />
in the case of Kerala are 0.741<br />
at Primary and 0.842 at Upper Primary levels compared<br />
to 0.767 and 0.793 respectively for Delhi. This is also<br />
true for Tamil Nadu, Haryana and Gujarat, which are<br />
“So far as the composite<br />
Primary and Upper Primary<br />
<strong>EDI</strong> amongst 21 major states<br />
is concerned, the top five<br />
ranking states are Kerala,<br />
Delhi, Tamil Nadu, Haryana and<br />
Gujarat; the first three ranks<br />
are similar to the rankings in<br />
the previous year”<br />
which reveals that none of the top three ranked states<br />
maintained their respective positions at Primary level,<br />
as well as at Upper Primary level of education. At Primary<br />
level, Assam (<strong>EDI</strong>, 0.701), Jammu and Kashmir (<strong>EDI</strong>,<br />
0.676) and Chhattisgarh (<strong>EDI</strong>,<br />
0.673) are ranked first, second<br />
and third, respectively, in access<br />
set of indicators which is much<br />
better than their over-all position<br />
in composite index.<br />
The top ranked Kerala lost its<br />
position to Assam at Primary<br />
level and to Gujarat at Upper<br />
Primary level. Needless to<br />
mention that Gujarat is ranked<br />
fifth (<strong>EDI</strong>, 0.718) at Primary level<br />
among the 21 major states but it is ranked at eighth, if<br />
all the 35 states are considered. The respective indices<br />
in the case of Kerala are as low as 0.257 (rank 21) at<br />
205
Part V<br />
Elementary Education in India : Analytical Report<br />
Primary and 0.687 (rank 13) at Upper primary level.<br />
Despite Kerala doing well in other sets of indicators, the<br />
state is not well placed with regard to access indicators.<br />
May be the state has achieved the goal of universal<br />
access and does not need more schools to open. Access<br />
index of Tamil Nadu is also low (<strong>EDI</strong>, 0.505 and 0.605)<br />
first at Upper Primary level. Further, it has been observed<br />
that like other groups of states, namely, north-eastern<br />
and smaller states, the <strong>EDI</strong> values of major states in<br />
access indicators is far below than that of the other sets<br />
of indicators which is by and large true for both Primary<br />
as well as Upper Primary levels of education.<br />
Table E4(A)<br />
Indices & Ranking at Primary/Upper Primary Level: Major States<br />
All Managements: All Schools, 2007-08<br />
Outcome Index<br />
<strong>EDI</strong><br />
State<br />
Primary Upper Primary Upper Composite<br />
Level Rank Primary Rank Level Rank Primary Rank (Primary & Rank<br />
Level Level Upper Primary)<br />
Level<br />
Andhra Pradesh 0.826 3 0.780 3 0.698 8 0.781 5 0.740 7<br />
Assam 0.622 15 0.648 9 0.461 19 0.568 17 0.515 18<br />
Bihar 0.530 21 0.485 17 0.389 21 0.424 21 0.406 21<br />
Chhattisgarh 0.675 13 0.461 20 0.573 14 0.567 18 0.570 17<br />
Delhi 0.570 17 0.525 15 0.767 1 0.793 2 0.780 2<br />
Gujarat 0.698 11 0.672 7 0.718 5 0.778 7 0.748 5<br />
Haryana 0.692 12 0.605 12 0.730 4 0.780 6 0.755 4<br />
Himachal Pradesh 0.777 5 0.648 10 0.642 12 0.747 10 0.695 10<br />
Jammu & Kashmir 0.791 4 0.662 8 0.648 10 0.708 12 0.678 11<br />
Jharkhand 0.551 19 0.578 14 0.456 20 0.527 19 0.491 19<br />
Karnataka 0.880 1 0.819 2 0.699 7 0.787 4 0.743 6<br />
Kerala 0.732 7 0.764 4 0.741 3 0.842 1 0.791 1<br />
Madhya Pradesh 0.546 20 0.451 21 0.572 15 0.607 14 0.590 14<br />
Maharashtra 0.767 6 0.720 5 0.685 9 0.770 8 0.727 9<br />
Orissa 0.563 18 0.463 19 0.554 17 0.589 16 0.572 16<br />
Punjab 0.721 8 0.498 16 0.712 6 0.751 9 0.732 8<br />
Rajasthan 0.589 16 0.593 13 0.593 13 0.714 11 0.653 13<br />
Tamil Nadu 0.859 2 0.833 1 0.752 2 0.790 3 0.771 3<br />
Uttar Pradesh 0.700 10 0.690 6 0.568 16 0.603 15 0.586 15<br />
Uttarakhand 0.711 9 0.634 11 0.643 11 0.677 13 0.660 12<br />
West Bengal 0.666 14 0.469 18 0.536 18 0.441 20 0.488 20<br />
and the state is ranked 14 th and 18 th respectively in<br />
Primary and Upper Primary levels of education. The<br />
indices in the case of Assam with regard to access<br />
indicators is as high as 0.701 at Primary level but the<br />
same is as low as 0.607 at Upper Primary level where it<br />
is ranked 17th. Gujarat with an <strong>EDI</strong> of 0.820 is ranked<br />
So far as infrastructure indicators are concerned,<br />
none of the first three ranked states could maintain their<br />
respective positions. Delhi is ranked second in composite<br />
Primary and Upper Primary index and first in the case of<br />
Primary level. Delhi is ranked second (<strong>EDI</strong>, 0.909) at<br />
Primary and fourth at Upper Primary level (<strong>EDI</strong>, 0.871)<br />
206
Educational Development Index<br />
Part V<br />
in the infrastructure index. Higher infrastructure index<br />
indicates that most of the schools in Delhi have got<br />
drinking water, common toilets and girls’ toilet facility,<br />
which is also true for other top ranking states. It may be<br />
recalled that Assam has very high ranking with respect<br />
to access indicators at Primary level but the same is not<br />
Table E4(B)<br />
Composite Educational Development Index<br />
Primary and Upper Primary Level: Major States<br />
All Schools: All Managements<br />
overall rank regarding infrastructure indicators, that is,<br />
it is ranked fifth (<strong>EDI</strong>, 0.808) at Primary and seventh<br />
(<strong>EDI</strong>, 0.819) at Upper Primary level, compared to its<br />
overall third rank (<strong>EDI</strong>, 0.771). It may be observed that<br />
infrastructure index in Bihar is as low as 0.233 at Primary<br />
and 0.343 at Upper Primary levels of education. This<br />
<strong>EDI</strong> & Rank <strong>EDI</strong> & Rank Composite <strong>EDI</strong> & Rank<br />
State/UT Primary Level Upper Primary Level (Primary & Upper Primary)<br />
2006-07 2007-08 2006-07 2007-08 2006-07 2007-08<br />
Andhra Pradesh 0.639 9 0.698 8 0.700 7 0.781 5 0.670 8 0.740 7<br />
Assam 0.433 19 0.461 19 0.521 15 0.568 17 0.477 18 0.515 18<br />
Bihar 0.309 21 0.389 21 0.334 21 0.424 21 0.321 21 0.406 21<br />
Chhattisgarh 0.517 16 0.573 14 0.526 14 0.567 18 0.521 15 0.570 17<br />
Delhi 0.767 1 0.767 1 0.747 3 0.793 2 0.757 2 0.780 2<br />
Gujarat 0.655 5 0.718 5 0.699 8 0.778 7 0.677 6 0.748 5<br />
Haryana 0.591 12 0.730 4 0.632 12 0.780 6 0.612 12 0.755 4<br />
Himachal Pradesh 0.675 4 0.642 12 0.739 4 0.747 10 0.707 4 0.695 10<br />
Jammu & Kashmir 0.599 11 0.648 10 0.667 9 0.708 12 0.633 10 0.678 11<br />
Jharkhand 0.360 20 0.456 20 0.402 20 0.527 19 0.381 20 0.491 19<br />
Karnataka 0.653 6 0.699 7 0.708 6 0.787 4 0.680 5 0.743 6<br />
Kerala 0.756 2 0.741 3 0.788 1 0.842 1 0.772 1 0.791 1<br />
Madhya Pradesh 0.478 18 0.572 15 0.483 17 0.607 14 0.481 17 0.590 14<br />
Maharashtra 0.644 8 0.685 9 0.710 5 0.770 8 0.677 7 0.727 9<br />
Orissa 0.529 15 0.554 17 0.445 18 0.589 16 0.487 16 0.572 16<br />
Punjab 0.649 7 0.712 6 0.659 10 0.751 9 0.654 9 0.732 8<br />
Rajasthan 0.532 14 0.593 13 0.632 13 0.714 11 0.582 13 0.653 13<br />
Tamil Nadu 0.724 3 0.752 2 0.757 2 0.790 3 0.741 3 0.771 3<br />
Uttar Pradesh 0.538 13 0.568 16 0.514 16 0.603 15 0.526 14 0.586 15<br />
Uttarakhand 0.615 10 0.643 11 0.643 11 0.677 13 0.629 11 0.660 12<br />
West Bengal 0.500 17 0.536 18 0.416 19 0.441 20 0.458 19 0.488 20<br />
true for infrastructure index. The state ranked 20 th both<br />
at Primary (<strong>EDI</strong>, 0.316) and Upper Primary level (<strong>EDI</strong>,<br />
0.386) in this aspect. Punjab with an overall rank of<br />
eighth (composite Primary and Upper Primary) is placed<br />
first (<strong>EDI</strong>, 0.917) at Primary level and third at Upper<br />
Primary level (<strong>EDI</strong>, 0.917) with regard to infrastructure<br />
index. By and large, Tamil Nadu could also maintain its<br />
clearly reveals that schools in the state are not better<br />
placed. This is also true for a few other states, such as<br />
Assam, Jharkhand, West Bengal and Jammu and<br />
Kashmir. It may be recalled that Jammu and Kashmir<br />
which is ranked second in the case of Access index at<br />
Primary level is ranked 17 th in the case of infrastructure<br />
index. Further, infrastructure index reveals that by and<br />
207
Part V<br />
Elementary Education in India : Analytical Report<br />
Map 5.1<br />
208
Educational Development Index<br />
Part V<br />
large, it is higher in Upper Primary level compared to<br />
Primary level. The same was also observed in the case<br />
of smaller states and states in the north-eastern region.<br />
infrastructure index in Upper Primary level of education.<br />
On the other hand, with regard to teacher index, Assam<br />
(<strong>EDI</strong>, 0.328), Bihar (<strong>EDI</strong>, 0.334) and Jharkhand (<strong>EDI</strong>,<br />
Figure 5.5<br />
<strong>EDI</strong> at Primary & Upper Primary Level, Ten Bottom Ranked States: 2007-08<br />
The next sets of indicators that have been discussed<br />
fall under the category of teacher<br />
and outcome indicators. By and<br />
large, Kerala, Delhi and Tamil<br />
Nadu maintained their high<br />
rankings with regard to teachers’<br />
index at Primary level which is<br />
also true for Upper Primary level<br />
of education. Gujarat is ranked<br />
fourth at Primary and fifth at<br />
Upper Primary level which is in<br />
line with its over all ranking in<br />
composite Primary and Upper<br />
Primary index. Kerala with an <strong>EDI</strong><br />
of 0.950, both at the Primary and<br />
Upper Primary levels, is ranked<br />
first so far as teachers’ index is<br />
concerned. Kerala is followed by<br />
Delhi (<strong>EDI</strong> 0.937; rank 2 nd ) and Tamil Nadu (<strong>EDI</strong> 0.811;<br />
rank 3rd) at the Primary level which is also true for<br />
“Analysis of the <strong>EDI</strong> clearly<br />
reveals that different states<br />
are at different levels of<br />
educational development in<br />
general, and Primary and<br />
Upper Primary levels of<br />
education in particular. A few<br />
states with high <strong>EDI</strong> values<br />
are termed better than the<br />
rest of the states but still<br />
they may not be well placed<br />
with regard to all the four<br />
sets of indicators used in<br />
computation of the <strong>EDI</strong>”<br />
0.379) are respectively placed at 21 st , 20 th and 19 th<br />
position. In view of low <strong>EDI</strong><br />
values, they need significant<br />
improvement in most of their<br />
teacher related indictors.<br />
Further, it is observed that in<br />
most of the 21 major states,<br />
teachers’ index is observed to be<br />
higher for Upper Primary level<br />
compared to Primary level.<br />
However, the same is not true<br />
for outcome index, consisting of<br />
GER, examination results, GPI,<br />
dropout and repetition rates, etc.<br />
Karnataka is ranked first with an<br />
<strong>EDI</strong> value as high as 0.880 at<br />
Primary level and is ranked<br />
second (<strong>EDI</strong>, 0.819) at Upper<br />
Primary level of education. It may be noted that its<br />
ranking in access, infrastructure and teachers indices is<br />
209
Part V<br />
Elementary Education in India : Analytical Report<br />
much lower than that in outcome index. Next to<br />
Karnataka is Tamil Nadu at Primary (<strong>EDI</strong>, 0.859) level.<br />
However, at Upper Primary level, Tamil Nadu (<strong>EDI</strong>,<br />
0.833) is ranked first followed by Andhra Pradesh (<strong>EDI</strong>,<br />
0.780) and Kerala (<strong>EDI</strong>, 0.764) with regard to outcome<br />
index.<br />
The analysis of the <strong>EDI</strong> clearly reveals that different<br />
states are at different levels of educational development<br />
in general, and Primary and Upper Primary levels of<br />
education in particular. A few states with high <strong>EDI</strong> values<br />
are termed better than the rest of the states but still<br />
they may not be well placed with regard to all the four<br />
sets of indicators used in computation of the <strong>EDI</strong>. Even<br />
if a state is ranked first, it may need further improvement<br />
for which individual <strong>EDI</strong> value should be critically<br />
analyzed. In addition, there is<br />
also need to analyse each<br />
indicator separately and identify<br />
states that need improvement.<br />
For instance, Bihar (21), West<br />
Bengal (20), Jharkhand (19),<br />
Assam (18), Chhattisgarh (17)<br />
and Orissa (16), are a few low<br />
ranking states on composite<br />
Primary and Upper Primary<br />
levels. This is also almost true<br />
separately for Primary and Upper<br />
Primary levels. The composite<br />
rank of Bihar and West Bengal<br />
among 21 major states remained<br />
the same both in 2006-07 and<br />
2007-08 whereas Uttar Pradesh slipped to 27th position<br />
from 26th in 2006-07. Among the 35 States and UTs,<br />
overall ranking of Bihar, West Bengal and Jharkhand is<br />
35, 33 and 32 respectively, all of which are traditionally<br />
seen as educationally backward states. Irrespective of<br />
sets of indicators, rank of Bihar varies between 7 and<br />
21 among the 21 major states considered in analysis<br />
under major group of states. However, in the case of<br />
access index, it is ranked eighth at Primary level.<br />
A careful analysis would reveal that in a state like<br />
Bihar, more than 96 pupils are made to sit in one<br />
classroom imparting elementary education. At the same<br />
time, pupil-teacher ratio in Bihar is high (54 pupils per<br />
teacher), and in a good number of schools (11.39<br />
percent) PTR is above 100. This is also true for another<br />
“Among the 35 States and<br />
UTs, overall ranking of Bihar,<br />
West Bengal and Jharkhand<br />
is 35, 33 and 32 respectively,<br />
all of which are traditionally<br />
seen as educationally backward<br />
states. Irrespective of sets<br />
of indicators, rank of Bihar<br />
varies between 7 and 21<br />
among the 21 major states<br />
considered in analysis under<br />
major group of states”<br />
educationally backward state, Jharkhand. The studentclassroom<br />
ratio in Jharkhand is as high as 60:1. There<br />
are still 11.24 percent single-teacher primary schools<br />
across the state. On the other hand, in a state like West<br />
Bengal, the ratio of Primary to Upper Primary schools/<br />
sections is above five; barring Arunachal Pradesh, it is<br />
the only state in the county to have the ratio above<br />
five, meaning availability of an Upper Primary school/<br />
section per set of five Primary schools/sections. In many<br />
of these educationally backward states, enrolment is<br />
noticed to be on the rise but at the same time a good<br />
number of pupils drop out and those who continue do<br />
not reach the terminal grade. Bihar also has low<br />
percentage of girls both at Primary (46.56 percent) and<br />
Upper Primary (43.04 percent) levels. In Bihar, the<br />
average dropout rate is as high<br />
as 13.79 percent in Primary<br />
classes compared to 12.82<br />
percent drop out rate in<br />
Jharkhand. On the other hand,<br />
retention rate at Primary level in<br />
Bihar is around 53 percent. Over<br />
time, transition rate has<br />
improved but still a good<br />
number of pupils drop out from<br />
the system before the<br />
completion of an educational<br />
level and those who continue do<br />
not necessarily attain education<br />
that can be called satisfactory. All<br />
districts together reveal that only<br />
48.67 percent boys and 48.80 percent girls pass with<br />
60 percent and above marks in the terminal Grade IV/<br />
V, suggesting the need for careful identification of<br />
problems. The <strong>DISE</strong> database can be used to identify all<br />
such locations and schools which need immediate<br />
attention.<br />
Concluding Observations<br />
Based on the composite <strong>EDI</strong> at Primary level, states<br />
can be grouped into four clusters: Cluster I: <strong>EDI</strong> up to<br />
0.50, Cluster II: 0.51 to 0.60, Cluster III: 0.61 to 0.70<br />
and Cluster IV: 0.71 and above. Four states have found<br />
place in the first cluster having <strong>EDI</strong> value up to 0.50;<br />
the states are Bihar, Jharkhand, Arunachal Pradesh, and<br />
Assam. Except Arunachal Pradesh, remaining states are<br />
210
Educational Development Index<br />
Part V<br />
big in size (population) and important for the country<br />
to achieve the goal of UEE. On the other hand, 10 states<br />
are placed in the second cluster having an <strong>EDI</strong> value<br />
between 0.51 and 0.60. Small as well as major states<br />
are placed in this cluster. States like West Bengal,<br />
Chhattisgarh, Orissa, Rajasthan, Uttar Pradesh and<br />
Madhya Pradesh are in this cluster. On the other hand,<br />
smaller states like Dadra and Nagar Haveli, Meghalaya,<br />
Tripura and Manipur are also placed in the second cluster<br />
with an <strong>EDI</strong> value between 0.51<br />
and 0.60. All the 14 states from<br />
the first and second group need<br />
immediate attention. To improve<br />
their overall position, these<br />
states should compute districtspecific<br />
<strong>EDI</strong>s and analyse <strong>EDI</strong><br />
values separately in the case of<br />
access, infrastructure, teachers<br />
and outcome indicators. On the<br />
other hand, eleven states are<br />
placed in the third cluster with<br />
an <strong>EDI</strong> between 0.61 and 0.70<br />
and only 10 in the fourth cluster<br />
having an <strong>EDI</strong> between 0.71 and<br />
0.77. Even the five top ranking states are not perfect in<br />
all the four sets of indicators as reflected in individual<br />
<strong>EDI</strong> values. The states are Puducherry, Kerala,<br />
Lakshadweep, Delhi and Tamil Nadu. The <strong>EDI</strong> in this<br />
group varies from 0.808 in Puducherry to 0.771 in Tamil<br />
Nadu. Uttarakhand, Andhra Pradesh, Maharashtra,<br />
Karnataka and Jammu and Kashmir are placed in the<br />
“All the states including the<br />
top ranking states should<br />
analyse all the indicators used<br />
in the <strong>EDI</strong> computation<br />
district-wise, and block wise<br />
within a district. It should be<br />
followed by adopting<br />
appropriate strategies without<br />
which neither their overall<br />
ranking nor status of universal<br />
elementary education in the<br />
state is expected to improve”<br />
third cluster with an <strong>EDI</strong> between 0.61 and 0.70. All the<br />
states including the top ranking states should analyse<br />
all the indicators used in the <strong>EDI</strong> computation districtwise,<br />
and block wise within a district. It should be<br />
followed by adopting appropriate strategies without<br />
which neither their overall ranking nor status of universal<br />
elementary education in the state is expected to<br />
improve. Variables found to have higher weightage than<br />
others should be accorded the top most priority while<br />
adopting strategies in the year<br />
that follows. Some of such<br />
variables are:<br />
Primary Level: Percentage of<br />
schools with drinking water<br />
facility, percentage of schools<br />
with girls’ toilet, percentage of<br />
female teachers, percentage of<br />
schools with PTR and SCR above<br />
60, percentage of single-teacher<br />
schools, GER and GPI, dropout<br />
rate, and students passing with<br />
60 percent and above marks in<br />
Grade IV/V.<br />
Upper Primary Level: Schools with SCR and PTR 60<br />
and above, percentage of single-teacher schools,<br />
percentage of schools with girls’ toilet, percentage of<br />
schools with drinking water facility, percentage of female<br />
teachers, average repetition rate, schools with less than<br />
three teachers, GER and students passing with 60<br />
percent and above marks in Grade VII/VIII.<br />
211
<strong>DISE</strong> Publications: A Few Comments<br />
<br />
<br />
<br />
<br />
<br />
<br />
<br />
<br />
<br />
<br />
<br />
<br />
<br />
<br />
I wish to compliment NUEPA for the valuable documents, very well structured to serve as valuable<br />
reference material. Dr. M. Anandakrishnan, Chairman, Indian Institute of Technology, Kanpur.<br />
I must compliment NUEPA for producing such an informative well led out document which will give<br />
opportunity to researchers and policy makers to access vital information pertaining to various facets of<br />
elementary education. Maj. Gen. S.N. Mukharjee, Lakshmibai National University of Physical Education,<br />
Gwalior.<br />
It is a valuable document which will be useful to people from all walks of life. In fact I was searching for<br />
some data which is found in the publication. Prof. Geetha Bali, Vice-Chancellor, Karnataka State Women’s<br />
University, Mysore.<br />
I just browsed through the publications and found that they are quite useful and informative. Prof. R.S.<br />
Deshpande, Director, Institute for Social and Economic Change, Bangalore.<br />
Both these publications will be of immense help for the department. Dr. R.G. Kothari, Professor of Education,<br />
The Maharaja Sayajirao University of Baroda, Vadodara.<br />
These documents are useful for the users of our library. Professor In-charge (Library), Maharshi Dayanand<br />
University Library, Rohtak.<br />
The publications are very informative and would be used widely by researchers and policy makers engaged<br />
in the field of elementary education in India. Prof. R. Sambasiva Rao, Special Director General, Ministry of<br />
Health and Family Welfare, New Delhi<br />
The data complied and presented in the publication are of immense value for research work on education<br />
and gender, and commendable. I congratulate NUEPA for bringing out such a useful publication. Swamy<br />
Swarupanand, Secretary, Ramakrishna Ashrama, Ramakrishnapuri, Gwalior.<br />
These publications are very useful and we will definitely share it with the interested organizations and<br />
individuals. Mr. Patwari, Akshara Foundation, E-mail: aksharadwd@gmail.com.<br />
Time has come that it should be accepted as sole authorized data of Government of India and also be<br />
extended to secondary level. NUEPA deserves compliments for the sustained effort and contribution.<br />
Prof. B.P. Khandelwal, NOIDA.<br />
I agree that the reports would of great value from the point of view of planning experiments in<br />
universalization of the education. Dr. Ragini Prem, Secretary, Banwasi Seva Ashram, Sonbhadra.<br />
It looks a very useful collection of data. Mr. Sabtasachi Bhattacharya, Chairman, Indian Council of<br />
Historical Research, New Delhi.<br />
The documents are of great use to the students and faculty members of our Department. Please convey<br />
our complements to <strong>DISE</strong> team for bringing out such an important statistics. Dr. A.K. Kundu, Deputy<br />
Librarian, North-Eastern Hill University, Meghalaya.<br />
On behalf of our students and faculty, I would like to congratulate NUEPA for producing such valuable<br />
publications. Indeed, our faculty, researchers and students will benefit from the scholarly work that provides<br />
deeper insight into elementary education in India. Dr. Muhammad, The Aga Khan University, Karachi<br />
(Pakistan).
We shall process and display it in our library for scholars and researchers. Mrs. Savitri Devi, Deputy<br />
Director, Indian Council of Social Science Research, New Delhi.<br />
I am sure the reports will be of immense use in our own research work. Mr. A.J. Philip, Director, Pratichi,<br />
Delhi.<br />
Analytical Report is extremely useful for our research scholars. Dr. P.P. Singh, Head, Library & Documentation<br />
Division, A.N. Sinha Institute of Social Studies, Patna.<br />
This will be useful to our library users. Librarian, National Institute of Technology Hamirpur, Himachal<br />
Pradesh.<br />
The material is useful and informative for us. Dr. P.D. Kaushik, Associate Director, Rajiv Gandhi Foundation,<br />
New Delhi.<br />
We are sure that the publication will be of immense interest to our members. Ms. Bhavna Sharma, Library<br />
& Resource Centre, India Habitat Centre, New Delhi.<br />
I am sure it will be very useful reference material for me. Prof. Neerja Shukla, Professor & Head, Department<br />
of Education of Special Needs, NCERT, New Delhi.<br />
This will surely help us in understanding the latest status of education in India in general and particularly<br />
in Gujarat. I would share this with my colleagues and all concerned. Dr. Pushopa Wadhwani, State Head,<br />
Azim Premji Foundation, Gujarat.<br />
I would like to mention that I am pursuing M. Phil in elementary education in Himachal Pradesh. The data<br />
provided in this publication would be of immense use in my thesis. Ms. Masooma Singha, Shimla.<br />
It is indeed an informative and useful document to monitor universalisation of elementary education.<br />
The compilation is very exhaustive and comprehensive effort. The work being put in is truly remarkable<br />
and commendable. Col. H Dharmarajan, Rashtriya Indian Military College, Dehradun.<br />
It is a massive work magnificently executed. Mr. Marmar Mukhopadhyay, Director, Educational Technology<br />
and Management Academy, New Delhi.<br />
I am sending these publications to our Library for the benefit of researchers and students of JNU.<br />
Prof. B.B. Bhattacharya, Vice-Chancellor, JNU, New Delhi.<br />
These publications have been forwarded to the University Library for wide publicity and use by the<br />
students and faculty members. University Librarian, Chaudhary Devi Lal University, Sirsa, Haryana.<br />
The hard work done by NUEPA in bringing out these volumes without much time-lag is commendable.<br />
The quality of publication is excellent. I am sure that the material given in these volumes will be widely<br />
used. Prof. A.B.L. Srivastava, Chief Consultant, Technical Support Group, Ed. CIL.<br />
This report will great reference material for our work and will be referred by researchers and students<br />
who come to visit our centre. Prof. Virgil D’Sami, Executive Director, Arunodhaya Centre for Street and<br />
Working Children, Chennai.<br />
These publications containing useful data are being placed in the library for the information of readers.<br />
Prof. Jai Rup Singh, Vice-Chancellor, Guru Nanak Dev University, Amritsar.<br />
The document indeed provided a wealth of information pertaining to various facets of elementary<br />
education. Mr. Mervyn D’Sousa, Chairman, Goa Board of Secondary & Higher Secondary Education,<br />
Goa.
We are sure that these documents will be of immense help to our work. Mr. Naren Sankranthi, MV<br />
Foundation, Secunderabad.<br />
It is a very useful document for our faculty. Our library will be richer by this addition. Dr. S.R. Hashim,<br />
Director, Institute for Studies in Industrial Development, New Delhi.<br />
The publications will be of great reference to our teachers as well as students and hence a very useful<br />
addition to our library. Ms. Nandi Nailwal, Librarian, Lal Bhahdur Shastri Institute of Management, Delhi.<br />
These documents will be of great value for our University specially for the faculty and students of the<br />
School of Education. Prof. Mana Prasad Wagley, Dean, School of Education, Kathmandu University,<br />
Nepal.<br />
We have found the data very useful and interesting. Mr. Gururaj K. S., Azim Premji foundation, Bangalore.<br />
I find the data and information presented very useful. Mr. V.G. Das, E-mail: dbei@sancharnet.in.<br />
The copies have been kept in our library for wider readership. Prof. Pankaj Chandra, Director, Indian<br />
Institute of Management, Bangalore.<br />
This publication will be very useful to our library users. Mr. B. Ganapathi, Librarian, Entrepreneurship<br />
Development Institute of India, Gandhi Nagar, Gujarat.<br />
We will keep this publication in our library collection for its wider use by researchers. I am sure the<br />
publication will help them in their research and study. Mr. Mustahsan Usmani Raja, Librarian, Indian<br />
Institute of Management, Lucknow.<br />
We find this report useful to our library. Mrs. P.S. Sharma, Central Library, Indian Institute of Technology<br />
Bombay, Mumbai.<br />
This is very useful and valuable document and I hope that all the faculty members of my department will<br />
benefit from this publication. Prof. Santosh Sharma, Head, Curriculum Group, NCERT, New Delhi.<br />
I browsed through the report and found it very useful and informative and gives plenty of information on<br />
elementary education. I am sending the report to our library for wider circulation. Prof. R.S. Deshpande,<br />
Director, Institute for Social and Economic Change, Bangalore.<br />
The publication will prove excellent source of information for students and researchers in the field of<br />
education. Mr. Cima M. Yeole, Shivaji University, Kolhapur, Maharashtra.<br />
This will herald a new era for the academicians and researchers in the field of education to embark on<br />
fresh research and analysis. Prof. Rajendra Menaria, Jaipur.<br />
We feel pleasure to say that the documents contain useful information about the elementary education in<br />
India. Mr. Swami Swarupanand, Secretary, Ramakrishna Ashram, Gwalior.<br />
It is a laudable effort. Congratulations for bring out the publication, which provides latest information<br />
pertaining to various facets of elementary education. It would be wonderful to get school-specific raw<br />
data for various research processes. Dr. Savita Sinha, Professor & Head, DESSH, NCERT, New Delhi.<br />
I am sure that the publications shall be valuable addition to our library and hope that our readers will be<br />
greatly benefited by these publications. Prof. Shabahat Hussain, Librarian-in-charge, Maulana Azad<br />
Library, Aligarh Muslim University, Aligarh.<br />
These would indeed be a valuable addition to our library collection. Ms. Anju Vyas, Librarian, Central for<br />
Women’s Development Studies , Library, New Delhi.
It is very useful in our research work. Mr. Fidelis Tirkey, Coordinator, Development of Library &<br />
Documentation Centre, Indian Social Institute, New Delhi.<br />
This publication is very interactive and will be very useful to our research students and academic staff. Dr.<br />
D.D. Pednekar, Officer-in-charge, Homi Bhabha Centre for Science Education, Tata Institute of Fundamental<br />
Research, Mumbai.<br />
It is very useful for our faculty members. Mr. Bharat Kumar, Librarian, Management Development Institute,<br />
Gurgaon.<br />
I am happy to state that your publications are becoming more value added and superior over the years.<br />
I congratulate NUEPA for theses outstanding publications which will not only benefit researchers but also<br />
the people at large. Prof. Ajit Kumar Jain, Visiting Professor, IHMR, Jaipur.<br />
The publications are very informative. Dr. Shayama Chona, Principal, Delhi Public School, New Delhi.<br />
The document is really the need of the hour and I am sure that your tremendous work will certainly be<br />
appreciated by all researchers and policy makers. Dr. B. Yashovarma, Principal, Shri D.M. College, Ujire,<br />
Karnataka.<br />
These kind of publications are very useful both for teaching and research work. Prof. N. Rajagopala Rao,<br />
Head, DOE, SSSU, Prasanthi Nailayam, Andhra Pradesh.<br />
This report is immense helpful for the research students as well as for their guides to access vital information<br />
about elementary education in India. Dr. Surendra Nath Banerjee, Retired Professor, Indian Statistical<br />
Institute, Kolkata.<br />
It is certainly useful for our advocacy purposes. Mr. R. Sachin Kumar Jain, Development Journalist, Vikad<br />
Samvad, Bhopal.<br />
These publications would be of immense use to my students, research scholars and colleagues in our<br />
research work. Dr. Nityanda Pradhan, Head, P.G. Department of Education, D.A.V. College, Koraput,<br />
Orissa.<br />
I am sure the publication will be of immense use to many in the field of school education. Mr. S. Sathyam,<br />
Chairman, HRD Ministry’s Review Committee on Educational Statistics, New Delhi.<br />
I assure, these publications will be brought to the notice of our collegeus in the SCERT. Mr. S. Suresh<br />
Babu, E-mail: sugoorusuresh@gmail.com.<br />
These reports will be very much valuable for me and for my research scholars. Dr. Siba Charan Subudhi,<br />
Department of Education, North-Eastern Hill University, Tura Campus, Meghalaya.<br />
We assure you that, the publication will be prominently displayed in our library for its best use.<br />
Dr. Muttayaa Koganuramath, University Librarian, Tata Institute of Social Sciences, Mumbai.<br />
I would like to congratulate NUEPA on producing a valuable report, which provides an analytical landscape<br />
of elementary education in India. We will keep the report in our library for sharing it with our faculty and<br />
students who will benefit from the material for their research work. Dr. Hamid-ud-din Al Kirmani, Professor<br />
and Director, The Aga Khan University, Karachi, Pakistan.<br />
The report and the data compiled are very useful to our projects in designing, comparing the progress<br />
and fixing the future target activities. Mr. K. Balakrishna Moorthy, General Secretary, People’s Action for<br />
Social Service, Andhra Pradesh.
As the publication is quite informative and useful, I hope the teacher participants will be really benefited.<br />
Dr. H.S. Bhatia, Director, UGC Academic Staff College, Guru Nanak Dev University, Amritsar.<br />
This is very useful addition to our library. I am sure the educationists and the research scholars will make<br />
good use of it. Ms. N. Seetharambhai, Secretary, Andhra Mahila Sabha, Literacy House, Hyderabad.<br />
The publications are bound to help in my working on legal aspects of right to elementary education.<br />
Mr. Ashok Aggarwal, Social Jurist, New Delhi.<br />
I shall be able to make better use of the reports in planning for our state. Mr. M. Alphonse, Tamil Nadu.<br />
These publications will help us immensely in planning different activities for improving the state of education<br />
in Orissa. Mr. Anil Pradhan, Member Secretary, Sikshasadhan, Orissa.<br />
It provides a great input to our faculty and researchers in teaching and research. Mr. Bibhuti Kumar Singh,<br />
SRD, Tuljapur, E-mail: bibhuti1069@rediffmail.com.<br />
This publication will definitely helpful for us in drawing out our strategy of implementation educational<br />
programmes in our programme areas. Mr. Ravi Nayse, Regional Programme Coordinator, Chandrapur.<br />
We are adding document to our collection and are sure that these will be of immense interest to our<br />
members. Ms. Bhavna, Manager, Habitat Library & Resource Centre, India Habitat Centre, Delhi.<br />
The publication will be of great help to government and policy makers institutions. Mr. Yaqoon Memon,<br />
Director-al-Hira Public School, Indore, Madhya Pradesh.<br />
We have added the material to the collection of our library. Ms. Kanchan Vasudev, Documentation<br />
Officer, National Social Science documentation Centre, ICSSR, New Delhi.<br />
Analysis of data has been done very nicely and presented very well using coloured and graphical figures.<br />
I am sure the publications will be widely used by planners and researchers. Dr. J.C. Goyal, Former, Reader,<br />
NCERT, New Delhi.<br />
Both reports are very useful for us because we are now in the process of improving our data collection.<br />
Mr. Sam Sereyrath, Director of Planning, MoEYS, Cambodia.<br />
The reports show the mirror of the district scenario and it will be quite useful to achieve the goals in the<br />
field of education. Dr. T. S. Joshi, Principal, District Institute of Education & Training, Gandhinagar, Gujarat.<br />
The report has not only been well documented but it will be really useful for us those who are working on<br />
child education in collaboration with the various state governments. The detailed information provided in<br />
the report, supported by data, will certainly help us to design and plan our education intervention<br />
accordingly. Ms. Mumtaz Masood, Ambuja Cement Foundation, Okhla, New Delhi.<br />
The publication has been added to the holdings of the library for consultation. Mr. Naveen Mahajan,<br />
Deputy Library and Information Officer, Nehru Memorial Museum & Library, New Delhi.<br />
I whole heartedly congratulate and appreciate NUEPA for its outstanding efforts in bringing out Analytical<br />
Report. The <strong>DISE</strong> data will definitely help multi national companies to make their efforts to improve<br />
information about elementary school education in rural areas. Prof. Nagesh Shinde, Professor & Head,<br />
School of Studies in Continuing Education, Vikram University, Ujjain.<br />
The publication is of immense help to our institute and is being displayed in the library. Mr. Challang R<br />
Marak, Lecturer, DIET, Tura.
The documents are highly useful research activities and in regular classroom interactions. Prof. M. Nirmala<br />
Jyothi, Professor & Head, Sri Padmavati Mahila Visvavidyalayam, Andhra Pradesh.<br />
This document will be of great help and benefit to us. Ms. Ranjana Sharma, Assistant Co-ordinator,<br />
Research Monitoring & Evaluation, E-mail: r8.ranjana@gmail.com.<br />
It will be displayed in our library and made available to the policy makers, researchers, faculty and our<br />
students. Mr. M.P. Deshpande, Principal DIET, Dharwad.<br />
These are quite helpful for our research. Ms. Supriya Mallik, Principal DIET, Dolipur.<br />
I convey my congratulations to NUEPA for having prepared so useful data which renders the work of the<br />
administrators and researchers easy and authentic. Dr. S. Kumar, General Secretary, Forum of Senior<br />
Citizens in Education, Panchkula.<br />
Really these volumes present a comprehensive analysis about the status of elementary education in India,<br />
which will be quite useful to research scholars and related faculty of the Institute. Dr. Dinesh Kumar,<br />
E-mail: anilupadhyaya2008@gmail.com.<br />
This document has been forwarded to the university library for wide publicity and use by the students<br />
and faculty members. Librarian, Chaudhary Devi Lal University, Sirsa.<br />
The publication contains a wealth of meaningful information. Certainly it will be immensely useful for<br />
researchers, teachers and district administration. Prof. Beena Shah, Vice-Chancellor, M.J.P. Rohilkhand<br />
University, Bareilly.<br />
This will no doubt be a valuable addition to our library to benefit our faculty members, research scholars<br />
and students. Mr. N. Choudhary, Librarian, LBN Library, Dibrugarh University, Dibrugarh.<br />
It will be of great help to the students and researchers at large. I must say that your research team must<br />
be congratulated for the wonderful work that they have done. Dr. Vandana Upadhyay, Department of<br />
Economics, Rajiv Gandhi University, Arunachal Pradesh, Itanagar.<br />
I am in the process of reading intently the publication and find it exceedingly informative. The schoolspecific<br />
raw material will undoubtedly help us in the administrative and academic purpose. Dr. Indu<br />
Khetarpal, Principal, Salwan Public School, Gurgaon, Haryana.<br />
The publications have been added to our college library and made known to the staff members.<br />
Dr. Mahabaleshwara Rao, Professor cum Principal, Dr. T.M.A. Pai College of Education, Udupi.<br />
We researchers are able to know both a bird’s-eye view at national level and the detailed report regarding<br />
each district in India. I highly appreciate your hard efforts and analysis. Hisako Akai, Fukuoka, Japan.<br />
The District Report Cards provide ample information for making critical analysis of various states in India<br />
especially on elementary education. Dr. R.S. Sharma, Ex-Fellow, NUEPA, New Delhi.<br />
Thanks for sending me this invaluable volume, Prof. Anil Sadgopal, Sahkar Nagar, Bhopal.<br />
Indeed the publications are valuable addition to our library. Dr. Renuka Narang, Education Consultant,<br />
Mumbai Transformation Support Unit, All India Institute of Local Self Government, Mumbai.<br />
I find the publication useful for strengthening Education Management Information System in India.<br />
Prof. Bharati Bhaveja, Head and Dean, Department of Education, University of Delhi.<br />
We will place documents in the teacher education section of the library where it will be used by visitors as<br />
well teacher trainees. Ms. Radhika Herzberger, E-mail: radhika@rishivalley.org.
I had a quick glance of the contents and the work reported is very high quality. I wish you all success in<br />
dissemination this report. Dr. S. Sadagopan, Director, International Institute of Information Technology,<br />
Bangalore.<br />
It will be very useful for our faculty and students. Some of our students are working on education for their<br />
M.A/M.Phil dissertation. Dr. M. Indira, Associate Professor, Department of Studies in Economics and<br />
Co-operation, University of Mysore, Mysore.<br />
Congratulations on all your good work with <strong>DISE</strong> data. It is really a fantastic achievement to get increasingly<br />
reliable data on 1.25 million elementary schools in India. I think a lot can be done in terms of district level<br />
analysis of the data. Dr. Geeta Kingdon, Department of Economics, University of Oxford, Oxford.<br />
We are delighted to see that the new District Report Cards using <strong>DISE</strong> data are already online as they<br />
have wealth of interesting information, Dr. Vandana Sipahimalani Rao, Human Development Economist,<br />
Manila, Philippines.<br />
Thanks for sending me two volumes of your valuable publications, Elementary Education in India: District<br />
Report Cards, Prof. Ashish Bose, Leading Demographer and Former Professor, Institute of Economic Growth,<br />
Delhi.<br />
I am sure it would be of great help. Dr. Sharada Jain, Director, Sandhan (Society for Education &<br />
Development), New Delhi.<br />
This is what we have been waiting for. Ms. Varsha Hooja, Director, Technical Operations, National Resource<br />
Centre for Inclusion Spastics Society of India.<br />
Rest assured that our education team in India will make full use of this publication, and will encourage<br />
others to do so well. Mr. Sam Carlson, Lead Education Specialist for India.<br />
The report is a rich source of data and useful for our research students. Prof. Geetha B. Nambissan,<br />
Chariman, Zakir Hussain Centre for Educational Studies, Jawaharlal Nehru University, New Delhi.<br />
Your publications are surely useful and informative, always gives me a great encouragement to my further<br />
studies, Ms. Hisako Akai, Fukuoka, Japan.<br />
I am sure the document will be of great help to all those who are committed to universal elementary<br />
education. Mr. Prakash Karat, General Secretary, Communist Party of India (Marxist), New Delhi.<br />
Congratulations for launching over one million school report cards - this is wonderful achievement.<br />
Dr. Michael Ward, Senior Education Adviser, DFID India, British High Commission, New Delhi.<br />
This is really amazing to see the remote village schools information on your website. The site will be very<br />
useful in understanding the status of the Indian schools. Mr. R. Venkat Reddy, venkatmvf@yahoo.com.<br />
Thanks for felicitations for your monumental publication, Elementary Education in India: Progress towards<br />
UEE, Analytical Report. Mr. Saiyid Hamid, former Vice-Chancellor, Aligarh Muslim University, Chancellor,<br />
Jamia Hamdard and Secretary, Hamdard Education Society, New Delhi.<br />
The data provided by <strong>DISE</strong> would be of immense help to the people who are working in the field of<br />
primary education. It would have been of great help to government to properly plan for the school level<br />
education for Muslims. Mr. Kamal Faruqui, Chariman, Delhi Minorities Commission, Vikas Bhawan, New<br />
Delhi.<br />
It was great to learn about the progress made regarding <strong>DISE</strong>. Dr. Deepa Sankar, Education Economist,<br />
The World Bank, New Delhi.
<strong>DISE</strong> publications annually produce a vast wealth of educational statistics and I am so happy that NUEPA<br />
has kept up the standards in generating periodic information so useful for all of us. Dr. Preet Rustagi,<br />
Senior Fellow, Institute for Human Development, New Delhi.<br />
I must confess that after the monumental work of J.P.Naik on the history of Indian education your work<br />
related to elementary education in India is the most comprehensive data-base published so far. It will be<br />
an invaluable for all researchers and policy makers on education in the coming decades. Prof. Gautam<br />
Sen, Director General, Indian Institute of Education, Pune.<br />
We hope to benefit from the publication. Dr. Montek Singh Ahluwalia, Deputy Chairman, Planning<br />
Commission, New Delhi.<br />
Congratulations on the excellent production of the two volumes of the District Report Cards.<br />
Prof. Amitabh Kundu, Centre for Studies in Regional Development, Jawaharlal Nehru University,<br />
New Delhi.<br />
The publication is very useful containing considerable amount of data and analysis, which will be useful<br />
for researchers in the field of education. Prof. Anandakrishnan, Chairman, Madras Institute of Development,<br />
Chennai.<br />
Thank you for sending me very useful publications. Shri J. Veeraraghavan, Director, Bhartiya Vidya Bhavan,<br />
New Delhi.<br />
I have placed the publication in our library for wider consultation by our scholars. Prof. C.H. Hanumantha<br />
Rao, Chairman, Centre for Economic and Social Studies, Hyderabad.<br />
NUEPA’s success in operationalising the nationally acclaimed <strong>DISE</strong> has been one such landmark,<br />
revolutionizing the role of education planners, who can now address local developmental needs from an<br />
informed perspective, armed with statistical and situational data. Mr. Samphe Lhalungpa, Ex-Chief,<br />
Education Section, UNICEF India Country Office, New Delhi.<br />
A great piece of work, congratulation for putting everything in black and white. Dr. Maheswar Lal, Asha<br />
for Education, Philadelphia.<br />
The publications (Elementary Education in Rural and Urban India) would be very useful addition to our<br />
library. Mr. Mohammad Hamid Ansari, Chairperson, National Commission for Minorities, Government of<br />
India, New Delhi.<br />
The publications containing valuable recent data on the state of elementary education in India will no<br />
doubt be found most useful by myself and my students at JNU. Prof. D.N. Rao, Centre for Economic<br />
Studies & Planning School of Sciences, Jawaharlal Nehru University, New Delhi.<br />
The data provided in the Analytical Tables are of immense utility. Prof. P.M. Kulkarni, Centre for the Study<br />
of Regional Development, Jawaharlal Nehru University, New Delhi.<br />
The <strong>DISE</strong> Flash Statistics is becoming smarter with more and more information. I congratulate <strong>DISE</strong> team<br />
for their total dedication in compiling the data. Mr. S.S. Rajagopalan, Chennai.<br />
This is a welcome step and I appreciate the efforts undertaken by NUEPA. Dr. Lokesh K. Shekhawat,<br />
Vice-Chancellor, Jai Narain Vyas University, Jodhpur.<br />
We are extremely thankful to you for sending such a valuable publication. Librarian, Tilak Maharashtra<br />
University Library, Pune.
We have kept the publication in the Central Library of the institute, which will be useful for our readers.<br />
Dr. Yogendra Singh, Ex-Scientist, Indian Institute of Technology, Roorkee Central Library, Roorkee.<br />
I find the publication well prepared, quite useful and informative. Dr. B.N. Yugandhar, Member, Planning<br />
Commission of India, Yojana Bhawan, New Delhi.<br />
I write to appreciate the efforts NUEPA has been making for the last several years in strengthening EMIS<br />
in the country. The amount of data being disseminated regularly through <strong>DISE</strong> publications, enormous<br />
and rich in contents, attests to the significant achievement of NUEPA. Dr. Raman P. Singh, Deputy Advisor<br />
(Education), Planning Commission, Yojana Bhawan, New Delhi.<br />
Just received the two volumes of elementary education in India. Should I say I am privileged I have just<br />
leafed through the pages and have had a sensation. What a tremendous job done! Really grateful for the<br />
prompt dispatch. Mr. Soumen Hom, Kolkotta.<br />
District Report Cards will be of immense help in the activities in school education at CII. Ms. Alka Chaudhary,<br />
Director, Confederation of Indian Industry, New Delhi.<br />
The information would help us in many ways. Mr. Sunil Gautam, Indian Institute of Dalit Studies,<br />
New Delhi.<br />
I have gone through documents on the web, they are immensely useful for my research. I want to<br />
congratulate you and also convey my thanks for providing such vast information. Prof. Amulya<br />
Chagapuram, ICFAI University, Hyderabad.<br />
The http://schoolreportcards.in is nice move. It helps if you are an academician, it helps if you are a<br />
policy maker, and it helps even if you are a common citizen. The data will help the process of empowerment<br />
and strengthen the democracy. Dr. Ram Manohar Vikas, Indian Institute of Technology, Kanpur.


