

Teacher Related Indicators & EDI - DISE
Teacher Related Indicators & EDI - DISE
Teacher Related Indicators & EDI - DISE

Create successful ePaper yourself
Turn your PDF publications into a flip-book with our unique Google optimized e-Paper software.
Part IV<br />
Elementary Education in India : Analytical Report<br />
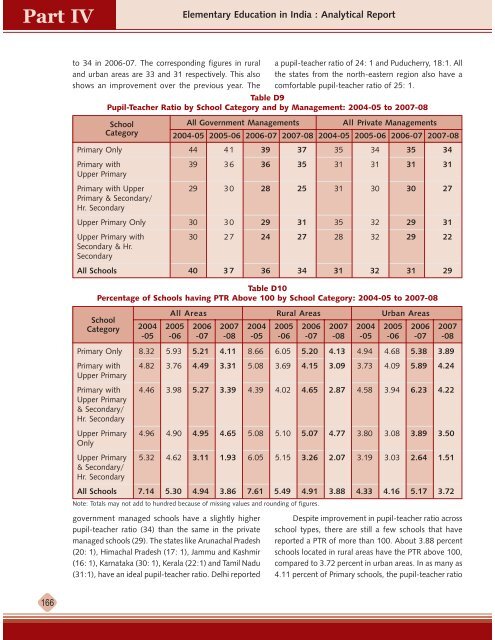
to 34 in 2006-07. The corresponding figures in rural<br />
and urban areas are 33 and 31 respectively. This also<br />
shows an improvement over the previous year. The<br />
Table D10<br />
Percentage of Schools having PTR Above 100 by School Category: 2004-05 to 2007-08<br />
School<br />
All Areas Rural Areas Urban Areas<br />
Category 2004 2005 2006 2007 2004 2005 2006 2007 2004 2005 2006 2007<br />
-05 -06 -07 -08 -05 -06 -07 -08 -05 -06 -07 -08<br />
Primary Only 8.32 5.93 5.21 4.11 8.66 6.05 5.20 4.13 4.94 4.68 5.38 3.89<br />
Primary with 4.82 3.76 4.49 3.31 5.08 3.69 4.15 3.09 3.73 4.09 5.89 4.24<br />
Upper Primary<br />
Primary with 4.46 3.98 5.27 3.39 4.39 4.02 4.65 2.87 4.58 3.94 6.23 4.22<br />
Upper Primary<br />
& Secondary/<br />
Hr. Secondary<br />
Upper Primary 4.96 4.90 4.95 4.65 5.08 5.10 5.07 4.77 3.80 3.08 3.89 3.50<br />
Only<br />
Upper Primary 5.32 4.62 3.11 1.93 6.05 5.15 3.26 2.07 3.19 3.03 2.64 1.51<br />
& Secondary/<br />
Hr. Secondary<br />
All Schools 7.14 5.30 4.94 3.86 7.61 5.49 4.91 3.88 4.33 4.16 5.17 3.72<br />
Note: Totals may not add to hundred because of missing values and rounding of figures.<br />
a pupil-teacher ratio of 24: 1 and Puducherry, 18:1. All<br />
the states from the north-eastern region also have a<br />
comfortable pupil-teacher ratio of 25: 1.<br />
Table D9<br />
Pupil-<strong>Teacher</strong> Ratio by School Category and by Management: 2004-05 to 2007-08<br />
School All Government Managements All Private Managements<br />
Category 2004-05 2005-06 2006-07 2007-08 2004-05 2005-06 2006-07 2007-08<br />
Primary Only 44 4 1 39 37 35 34 35 34<br />
Primary with 39 3 6 36 35 31 31 31 31<br />
Upper Primary<br />
Primary with Upper 29 3 0 28 25 31 30 30 27<br />
Primary & Secondary/<br />
Hr. Secondary<br />
Upper Primary Only 30 3 0 29 31 35 32 29 31<br />
Upper Primary with 30 2 7 24 27 28 32 29 22<br />
Secondary & Hr.<br />
Secondary<br />
All Schools 40 3 7 36 34 31 32 31 29<br />
government managed schools have a slightly higher<br />
pupil-teacher ratio (34) than the same in the private<br />
managed schools (29). The states like Arunachal Pradesh<br />
(20: 1), Himachal Pradesh (17: 1), Jammu and Kashmir<br />
(16: 1), Karnataka (30: 1), Kerala (22:1) and Tamil Nadu<br />
(31:1), have an ideal pupil-teacher ratio. Delhi reported<br />
Despite improvement in pupil-teacher ratio across<br />
school types, there are still a few schools that have<br />
reported a PTR of more than 100. About 3.88 percent<br />
schools located in rural areas have the PTR above 100,<br />
compared to 3.72 percent in urban areas. In as many as<br />
4.11 percent of Primary schools, the pupil-teacher ratio<br />
166


