

Teacher Related Indicators & EDI - DISE
Teacher Related Indicators & EDI - DISE
Teacher Related Indicators & EDI - DISE

Create successful ePaper yourself
Turn your PDF publications into a flip-book with our unique Google optimized e-Paper software.
<strong>Teacher</strong>-<strong>Related</strong> <strong>Indicators</strong><br />
Part IV<br />
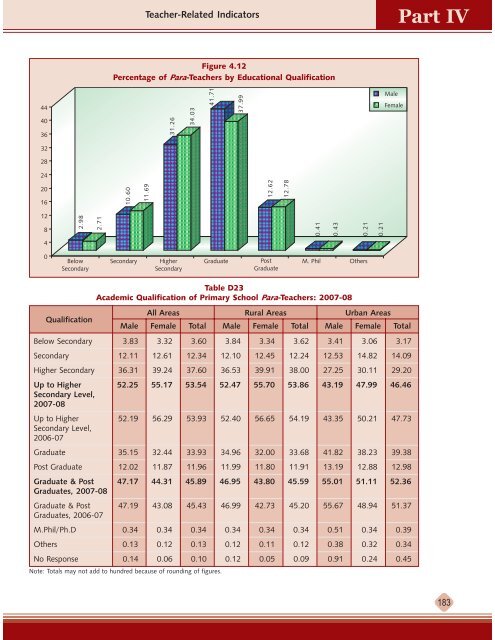
Figure 4.12<br />
Percentage of Para-<strong>Teacher</strong>s by Educational Qualification<br />
Qualification<br />
Table D23<br />
Academic Qualification of Primary School Para-<strong>Teacher</strong>s: 2007-08<br />
All Areas Rural Areas Urban Areas<br />
Male Female Total Male Female Total Male Female Total<br />
Below Secondary 3.83 3.32 3.60 3.84 3.34 3.62 3.41 3.06 3.17<br />
Secondary 12.11 12.61 12.34 12.10 12.45 12.24 12.53 14.82 14.09<br />
Higher Secondary 36.31 39.24 37.60 36.53 39.91 38.00 27.25 30.11 29.20<br />
Up to Higher 52.25 55.17 53.54 52.47 55.70 53.86 43.19 47.99 46.46<br />
Secondary Level,<br />
2007-08<br />
Up to Higher 52.19 56.29 53.93 52.40 56.65 54.19 43.35 50.21 47.73<br />
Secondary Level,<br />
2006-07<br />
Graduate 35.15 32.44 33.93 34.96 32.00 33.68 41.82 38.23 39.38<br />
Post Graduate 12.02 11.87 11.96 11.99 11.80 11.91 13.19 12.88 12.98<br />
Graduate & Post 47.17 44.31 45.89 46.95 43.80 45.59 55.01 51.11 52.36<br />
Graduates, 2007-08<br />
Graduate & Post 47.19 43.08 45.43 46.99 42.73 45.20 55.67 48.94 51.37<br />
Graduates, 2006-07<br />
M.Phil/Ph.D 0.34 0.34 0.34 0.34 0.34 0.34 0.51 0.34 0.39<br />
Others 0.13 0.12 0.13 0.12 0.11 0.12 0.38 0.32 0.34<br />
No Response 0.14 0.06 0.10 0.12 0.05 0.09 0.91 0.24 0.45<br />
Note: Totals may not add to hundred because of rounding of figures.<br />
183


