

Teacher Related Indicators & EDI - DISE
Teacher Related Indicators & EDI - DISE
Teacher Related Indicators & EDI - DISE

Create successful ePaper yourself
Turn your PDF publications into a flip-book with our unique Google optimized e-Paper software.
<strong>Teacher</strong>-<strong>Related</strong> <strong>Indicators</strong><br />
Part IV<br />
percent of total teachers in such schools possess M.Phil<br />
and Ph.D degrees. Majority of teachers in integrated<br />
Higher Secondary schools are either Graduates (male<br />
47.97 percent; and female 45.89 percent) or Post-<br />
Graduates (male 26.72 percent,<br />
and females 29.96 percent). The<br />
majority of teachers in<br />
independent Upper Primary<br />
schools is either Graduates<br />
(38.54 percent) or Post-<br />
Graduates (28.63 percent).<br />
Similar pattern is observed in the<br />
case of Upper Primary integrated with Higher Secondary<br />
schools as about 70 percent of the total teachers in such<br />
schools are either Graduates or Post Graduates.<br />
a few states, such as Assam (10.32 percent), Daman &<br />
Diu 7.07 percent), Goa (6.12 percent), Gujarat (6.98<br />
percent), Haryana (6.97 percent); Meghalaya (14.46<br />
percent); Mizoram (24.31 percent); Nagaland (14.30<br />
percent); Punjab (12.24<br />
percent); Sikkim (7.33 percent);<br />
and Tripura (30.99 percent),<br />
have a significant percentage of<br />
teachers below Secondary level.<br />
The majority of primary teachers<br />
in these and a few other states,<br />
such as Assam (56.58 percent),<br />
Daman and Diu (44.17 percent), Goa (54.73 percent),<br />
Gujarat (45.14 percent), Himachal Pradesh (40.62<br />
percent), Lakshadweep (81.77 percent), Maharashtra<br />
Table D16<br />
Professional Qualification of All Category <strong>Teacher</strong>s (Regular): 2007-08<br />
Professional All Areas Rural Areas Urban Areas<br />
Qualification Male Female Total Male Female Total Male Female Total<br />
J.B.T or Equivalent 22.99 18.87 20.94 24.54 21.59 23.26 13.71 14.05 13.57<br />
S.B.T or Equivalent 20.32 27.08 22.90 20.33 27.69 22.75 20.25 26.00 23.39<br />
B.Ed or Equivalent 33.07 31.28 31.87 31.68 27.67 29.95 41.36 37.68 37.95<br />
M.Ed or Equivalent 2.14 2.17 2.12 1.95 1.80 1.88 3.28 2.82 2.91<br />
Others 2.76 3.56 3.06 2.61 3.26 2.82 3.66 4.09 3.84<br />
No Response 18.72 17.04 19.10 18.89 17.98 19.34 17.74 15.35 18.33<br />
Note: Totals may not add to hundred because of rounding of figures.<br />
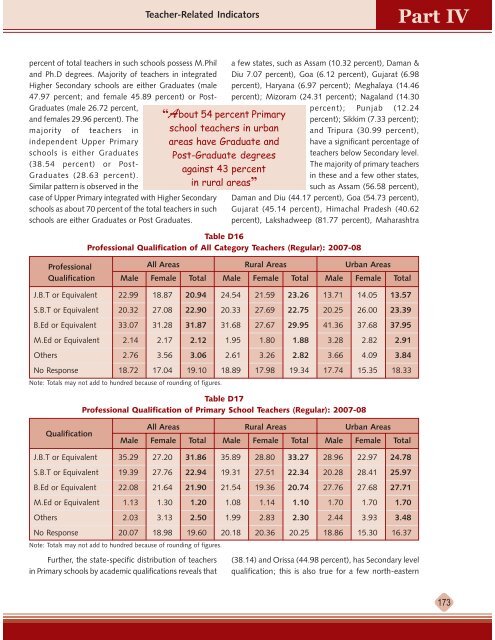
“About 54 percent Primary<br />
school teachers in urban<br />
areas have Graduate and<br />
Post-Graduate degrees<br />
against 43 percent<br />
in rural areas”<br />
Table D17<br />
Professional Qualification of Primary School <strong>Teacher</strong>s (Regular): 2007-08<br />
Qualification<br />
All Areas Rural Areas Urban Areas<br />
Male Female Total Male Female Total Male Female Total<br />
J.B.T or Equivalent 35.29 27.20 31.86 35.89 28.80 33.27 28.96 22.97 24.78<br />
S.B.T or Equivalent 19.39 27.76 22.94 19.31 27.51 22.34 20.28 28.41 25.97<br />
B.Ed or Equivalent 22.08 21.64 21.90 21.54 19.36 20.74 27.76 27.68 27.71<br />
M.Ed or Equivalent 1.13 1.30 1.20 1.08 1.14 1.10 1.70 1.70 1.70<br />
Others 2.03 3.13 2.50 1.99 2.83 2.30 2.44 3.93 3.48<br />
No Response 20.07 18.98 19.60 20.18 20.36 20.25 18.86 15.30 16.37<br />
Note: Totals may not add to hundred because of rounding of figures.<br />
Further, the state-specific distribution of teachers<br />
in Primary schools by academic qualifications reveals that<br />
(38.14) and Orissa (44.98 percent), has Secondary level<br />
qualification; this is also true for a few north-eastern<br />
173


