Annual Report - Glenmark
Annual Report - Glenmark
Annual Report - Glenmark

Create successful ePaper yourself
Turn your PDF publications into a flip-book with our unique Google optimized e-Paper software.
<strong>Glenmark</strong> Pharmaceuticals Limited<br />
<strong>Annual</strong> <strong>Report</strong><br />
2004 - 2005
Our Vision<br />
To emerge as a leading<br />
integrated research-based global<br />
pharmaceutical company
Consolidated Financial Highlights<br />
Year Mar-02 Mar-03 Mar-04 Mar-05<br />
Rs./Mn. USD/Mn. Rs./Mn. USD/Mn. Rs./Mn. USD/Mn. Rs./Mn. USD/Mn.<br />
Turnover 2,859.56 59.06 3,703.35 77.97 3,806.61 87.37 6,120.53 139.87<br />
Other Income 40.18 0.83 30.57 0.64 34.66 0.80 52.29 1.19<br />
PBIDT 513.09 10.60 659.34 13.88 725.73 16.66 1,609.80 36.79<br />
Interest 132.26 2.73 123.43 2.60 100.57 2.31 172.63 3.95<br />
Depreciation 89.97 1.86 106.57 2.24 110.93 2.55 164.23 3.75<br />
PBT 290.86 6.01 429.34 9.04 514.23 11.80 1,272.94 29.09<br />
Tax 58.02 1.20 103.83 2.19 100.89 2.31 201.53 4.61<br />
PAT 232.84 4.81 325.51 6.85 413.34 9.49 1,071.41 24.48<br />
Note: Rs. to USD conversion is at the rate existing at the end of the respective financial years.<br />
12%<br />
India API<br />
India Formulations<br />
50% 13% NCE<br />
Turnover 2004-05<br />
25%<br />
Exports Formulations & API
Contents<br />
2<br />
Global. Reaserch-focused. Integrated<br />
10<br />
Highlights, 2004-05<br />
11<br />
Objectives, 2005-2006<br />
12<br />
Interview with the CEO<br />
16<br />
Business Divisional Analysis<br />
18<br />
Domestic Formulations<br />
22<br />
Active Pharmaceutical Ingredients<br />
26<br />
International Formulations<br />
30<br />
Research and Development<br />
36<br />
Global Management Team<br />
37<br />
Management's Discussion and Analysis<br />
43<br />
Risk Management<br />
45<br />
Five-year Financial Summary<br />
47<br />
Ratios<br />
49<br />
Profile of Directors<br />
50<br />
Director's <strong>Report</strong><br />
61<br />
<strong>Report</strong> on Corporate Governance<br />
71<br />
Auditor's <strong>Report</strong><br />
74<br />
The Financial Statements
Global. Research-focused. Integrated.
Objective<br />
To position the Company<br />
for growth and value<br />
creation in the global<br />
pharmaceutical industry<br />
<strong>Annual</strong> <strong>Report</strong> 2004-2005<br />
3<br />
Tenure<br />
The long-term and<br />
post-GATT [post-2005]<br />
scenario<br />
Driver<br />
A global market strategy, a<br />
strong research focus and<br />
an integrated business<br />
model for risk-mitigating<br />
delivery
Global<br />
accounts for half the global<br />
pharmaceutical market, while Europe<br />
and Japan together make up almost<br />
40 percent. The emerging Asian, African<br />
and Latin American markets, too,<br />
present very bright prospects and are<br />
worth several billion dollars.<br />
Approaching the regulated markets<br />
by establishing a presence in the USA<br />
and the UK. While efforts are on to<br />
establish the sales and marketing frontend<br />
by in-licensing and acquiring<br />
products in the USA; the UK has been<br />
identified as an entry point into the<br />
European Union.<br />
Strengthening its brand portfolio<br />
across markets in Asia, Africa, CIS/Russia<br />
and more, recently, Latin America<br />
through its wholly-owned subsidiary in<br />
Brazil.<br />
Continuing to build front-end and<br />
customer-facing distribution systems in<br />
territories where it intends to market<br />
products under its own brand name.<br />
Out-licensing NCE compounds<br />
discovered by the Company's research<br />
team for development and<br />
commercialisation in the developed<br />
markets. The deals struck for the<br />
Company's lead molecule for<br />
asthma/COPD for the North American<br />
and Japanese markets are cases in<br />
point.<br />
4<br />
The pharmaceutical industry is<br />
undergoing a significant change:<br />
Even as the world becomes a global<br />
village, companies are increasingly<br />
adopting an international outlook and<br />
approach.<br />
With recognition of product patents<br />
having become a reality, India has to<br />
explore avenues for growth outside the<br />
domestic setup.<br />
Companies have realised that it is<br />
through product innovation that they<br />
have an opportunity to be long-term<br />
players in a global context.<br />
Sustainable growth is possible only<br />
through globalisation as the sizeable<br />
international markets are developing at<br />
a rapid pace. This is primarily due to the<br />
large number of generic molecules that<br />
are going off patent within the next few<br />
years. It is estimated that the US alone<br />
Indian companies stand to gain greatly<br />
due to their distinguishing benefits of<br />
low manufacturing and labour costs.<br />
Furthermore, not only Indian<br />
corporations, but global players also can<br />
profit from these advantages. Apart<br />
from exploring options like contract<br />
research and manufacturing with Indian<br />
organisations, they can also consider<br />
potential partners in joint IPR<br />
development.<br />
In recent years, a few leading Indian<br />
companies have also demonstrated the<br />
ability and willingness to undertake<br />
development of novel drugs, also called<br />
NCE research. As pipelines of many<br />
global majors have run dry and cost of<br />
discovering new drugs has gone up,<br />
these developments, if successful, can<br />
help Indian companies evolve to the<br />
next level through partnerships with<br />
global majors to develop original drugs.<br />
<strong>Glenmark</strong>'s Initiatives<br />
<strong>Glenmark</strong>, over the years, has built a<br />
global business strategy to capitalise on<br />
these emerging opportunities through<br />
the initiatives outlined below:<br />
<strong>Glenmark</strong>'s global-focused business<br />
model has been directed to fulfil a<br />
number of corporate objectives, among<br />
them being increasing revenue and<br />
enhancing profitability. As it increases<br />
its international presence, <strong>Glenmark</strong>'s<br />
dependence on its revenues from an<br />
increasingly competitive Indian industry<br />
will reduce, thereby mitigating risk for its<br />
shareholders and stabilising cash flows.
Growing competition<br />
characterises the<br />
constantly evolving<br />
international<br />
pharmaceutical industry<br />
<strong>Annual</strong> <strong>Report</strong> 2004-2005<br />
5
Research-focused<br />
6<br />
In the post-GATT era, the growing<br />
importance of research is reflected at<br />
two levels. To begin with, there is the<br />
need to create new revenue inflows<br />
through innovation and new product<br />
development in the generics segment.<br />
Furthermore, this should be<br />
complemented by developing<br />
commercially-viable, proprietary<br />
products so that organisations can<br />
enjoy their competitive benefits for a<br />
longer period of time.<br />
Responding proactively to these<br />
imperatives, <strong>Glenmark</strong> had drawn out a<br />
dynamic three-pronged R&D initiative<br />
that covers the following:<br />
New chemical entity [NCE] research:<br />
The Company is focused on selecting<br />
targets with a strong possibility of<br />
success and having a high commercial<br />
potential. It has targeted development<br />
of new molecules in the asthma,<br />
diabetes and obesity therapeutic<br />
segments. This approach has yielded<br />
exciting results with one of the drug<br />
candidates successfully completing<br />
Phase I of clinical trials and a few others<br />
expected to move into the clinical trial<br />
stage in FY 2006.<br />
enhancing the value of its existing<br />
formulation therapies by developing<br />
patentable drug delivery systems that<br />
would help create strong differentiated<br />
products. These research teams are<br />
housed across its two research facilities<br />
at Sinnar and Mahape. This work has led<br />
to a patented controlled-release<br />
technology through which <strong>Glenmark</strong> is<br />
planning to commercialise several<br />
products in the future.<br />
Strong process chemistry research:<br />
The third initiative of reverse<br />
engineering bulk drugs is a recent, but<br />
significant contributor to the R&D vision.<br />
The Company filed patents on thirty<br />
nine processes in FY 2005. In addition,<br />
the process research teams also<br />
contribute to the NCE activity by<br />
developing and scaling up APIs for<br />
novel drugs discovered by <strong>Glenmark</strong>.<br />
These R&D initiatives have already<br />
commenced in generating returns and<br />
are expected to continue to translate<br />
into a more valuable product basket,<br />
stronger revenues, enhanced margins<br />
and higher profits.<br />
Formulations and new drug delivery<br />
systems [NDDS]:<br />
In addition to creating new<br />
formulations, the Company is also
A committed research and<br />
development focus has<br />
emerged as a differentiator for<br />
success in the pharmaceutical<br />
industry today<br />
<strong>Annual</strong> <strong>Report</strong> 2004-2005<br />
7
Integrated<br />
8<br />
<strong>Glenmark</strong>'s business strategy is<br />
balanced by a comprehensive<br />
risk management approach<br />
that extends from the top of the<br />
pyramid [business blueprint] to the<br />
bottom [individual product baskets].<br />
The model comprises a keen research<br />
focus, diverse geographic presence,<br />
wider product basket, superior<br />
manufacturing facilities, quicker<br />
regulatory approvals and an ongoing<br />
investment in human competencies.<br />
The Company's integrated business<br />
model, itself, exemplifies its fundamental<br />
risk management initiative, which has<br />
translated into a lower cost structure<br />
and a direct control over an increasing<br />
number of links in the value chain.<br />
Additionally, this approach also creates a<br />
revenue source from each of these links,<br />
viz. potential licensing opportunities for<br />
new drugs, a growing presence as a bulk<br />
supplier and formulations player in<br />
various markets.<br />
of the international markets.<br />
Gradual reduction in the<br />
dependence on the Indian formulations<br />
business [from almost 100 percent of<br />
turnover in 2000 to 50 percent in 2005].<br />
Concentration on strengthening the<br />
Company's product basket with new<br />
value-added therapies and product<br />
introductions across more territories<br />
globally.<br />
Acceleration of product launches and<br />
DMF/ANDA filings through enhanced<br />
quality systems and a strong regulatory<br />
focus to drive revenues.<br />
Profiting from local know-how by<br />
recruitment of local management in<br />
several of its key markets.<br />
It is this combination of sound risk<br />
management and rapid revenue and<br />
profit growth that will help the<br />
Company improve value for its<br />
shareholders.<br />
This integrated method of business has<br />
also been enhanced by the following<br />
means:<br />
Creation of world-class<br />
manufacturing facilities to address<br />
quality demands and strict regulations
Success in a competitive global<br />
environment is achieved by<br />
anticipating the perils and meeting<br />
them with a risk-mitigation strategy.<br />
<strong>Annual</strong> <strong>Report</strong> 2004-2005<br />
9
Highlights, 2004-05<br />
Consolidated revenue and PAT<br />
The US subsidiary, <strong>Glenmark</strong><br />
10<br />
Revenue 2004-05<br />
12%<br />
50%<br />
13%<br />
25%<br />
Contribution [%]<br />
Business Segments<br />
India Formulations<br />
India API<br />
Exports Formulations & API<br />
NCE<br />
increased by 60.79 percent and 159.21<br />
percent respectively.<br />
NCE research made substantial<br />
progress with the Company's lead<br />
molecule for asthma/COPD<br />
successfully completing the Phase I<br />
clinical trials and also being outlicensed<br />
for the North American and<br />
Japanese markets. Its lead molecule<br />
for diabetes is presently in the<br />
pre-clinical testing stage.<br />
The Company incorporated a<br />
wholly-owned subsidiary in<br />
Switzerland to help manage NCE<br />
clinical trials as well as build research<br />
skills that complement R&D activities<br />
in India.<br />
Domestic formulations<br />
demonstrated a volume growth of 7.5<br />
percent and value growth of 8.3<br />
percent respectively. [ORG IMS MAT -<br />
Mar 2005]<br />
Construction of a new plant<br />
Pharmaceuticals Inc, USA [GPI],<br />
inaugurated its sales and marketing<br />
front-end as well as in-licensed and<br />
acquired a basket of products to<br />
commence and accelerate its<br />
operations.<br />
<strong>Glenmark</strong> has also filed 6 ANDA<br />
dossiers in FY 2005.<br />
The Company established<br />
headquarters for the UK & EU in the<br />
Thames Valley with a wholly-owned<br />
subsidiary, <strong>Glenmark</strong> Pharmaceuticals<br />
[UK] Ltd.<br />
Operations of the recently<br />
acquired company, Klinger<br />
Laboratories [Brazil], were integrated<br />
with those of <strong>Glenmark</strong> Farmacêutica<br />
Ltda. [Brazil]. The Company also<br />
acquired a leading contraceptive<br />
brand in Brazil in the last quarter of FY<br />
2005 and added 3 more brands to its<br />
existing basket of 19 products.<br />
The newly-acquired API<br />
commenced at Baddi, Himachal<br />
Pradesh in order to meet the demands<br />
of the domestic formulations<br />
segment.<br />
manufacturing plant at Ankleshwar,<br />
Gujarat obtained US FDA approval.<br />
The Company filed 13 DMFs and<br />
Formulation exports to semiregulated<br />
markets recorded a robust<br />
growth and operations were<br />
expanded to cover around 70 semiregulated<br />
countries.<br />
39 process patents during the year<br />
and initiated API supplies to the US<br />
market.
headed<br />
for the future<br />
Objectives, 2005-06<br />
Achieve revenue growth of<br />
approximately 40 percent and a net<br />
profit growth of 100 percent over<br />
2004-05.<br />
Obtain US FDA approval for the<br />
newly upgraded formulations facility in<br />
Goa.<br />
Expand capacity at current API<br />
sites and comments construction for a<br />
new plant.<br />
Strengthen presence in the semiregulated<br />
markets, especially Latin<br />
America.<br />
Register 14 ANDAs and 14 DMFs.<br />
Successfully launch and drive the<br />
growth of the eight new divisions in<br />
the domestic business. In addition,<br />
continue to launch strong molecules<br />
in the Indian formulations business<br />
and strengthen flagship brands.<br />
Projected 2005-06<br />
20%<br />
36%<br />
35%<br />
8%<br />
Contribution [%]<br />
Business Segments<br />
India Formulations<br />
11<br />
<strong>Annual</strong> <strong>Report</strong> 2004-2005<br />
Accelerate the development of the<br />
front-end sales and marketing<br />
networks for selling generics in<br />
the USA.<br />
Take GRC 3886, <strong>Glenmark</strong>'s lead<br />
molecule for asthma/COPD,<br />
successfully into Phase II clinical trials<br />
along with development partners and<br />
initiate Phase I trials for the diabetes<br />
lead molecule. Also take an additional<br />
PDE-4 into clinical trials for other<br />
inflammatory conditions.<br />
Commission a new formulations<br />
manufacturing facility at Baddi.<br />
Explore acquisitions in Europe and<br />
selected, less regulated markets in<br />
Latin America, Africa and Asia Pacific.<br />
India API<br />
Exports Formulations & API<br />
NCE Research
Interview with MD & CEO<br />
12<br />
Glenn Saldanha,<br />
Managing Director and<br />
CEO reviews the year<br />
How would you rate the<br />
Company's performance in<br />
2004-05<br />
The financial year under review has<br />
been an eventful year for <strong>Glenmark</strong>. The<br />
out-licensing of GRC 3886 to Forest<br />
Laboratories and Teijin Pharma Ltd. has<br />
changed the playing field for the<br />
Company. Not only does the deal<br />
present us the necessary cash flow for<br />
future expansion and growth, but it also<br />
validates our business model, and<br />
demonstrates that India can indeed<br />
deliver on its potential of discovering<br />
new molecules at significantly low costs.<br />
Financially, the Company reported a<br />
consolidated revenue growth of<br />
60.79 percent and a net profit growth of<br />
159.21 percent over 2003-04. However,<br />
profits from the generics business<br />
showed a marginal growth compared to<br />
the previous year; the bulk of the<br />
increase in profits was on account of<br />
milestone payments from the NCE<br />
business segment.<br />
Conversely, the low growth in<br />
profitability in the generics business<br />
belies the successful initiatives<br />
undertaken by the Company in building<br />
strength and capability in several<br />
business segments and markets.<br />
Furthermore, the Company successfully<br />
launched its sales and marketing frontend<br />
targeting the US generics<br />
opportunity while investing in building<br />
its bulk and formulation product<br />
pipelines to address the generics<br />
opportunity in regulated markets. The<br />
operational integration of Klinger<br />
Laboratories, a private company<br />
acquired by <strong>Glenmark</strong> in April 2004, was<br />
completed and several new products<br />
were filed for approval in Brazil. The<br />
Company entered 9 new export<br />
markets across Africa and Asia and also<br />
registered over 200 products in around<br />
70 overseas markets. These efforts have<br />
positioned the Company well to grow<br />
rapidly across all its business segments<br />
over the next few years.<br />
Despite a successful effort at improving<br />
efficiencies in various business<br />
segments, these firm-building activities<br />
led to an increase in costs. This was<br />
compounded by pressures brought<br />
about by structural amendments in the<br />
Indian Pharmaceutical Industry such as<br />
continued price erosion due to<br />
competitive pressures, introduction of<br />
MRP-based excise duties and<br />
uncertainty surrounding the<br />
introduction of VAT [Value Added Tax]<br />
which, in turn, led to a drop in off-take<br />
by channel partners.<br />
What were the other achievements<br />
We continued investing in a number of<br />
initiatives to migrate up the value chain.<br />
For instance, we filed six ANDAs from<br />
our state-of-art manufacturing facility at<br />
Goa. We carried out various modules of<br />
expansion and upgrade programmes at<br />
our other manufacturing facilities. We<br />
completed filing thirteen DMFs till<br />
March 2005 and also commenced sales<br />
of some of these bulk drugs to<br />
customers in regulated markets during<br />
the year. On one hand, we introduced<br />
new drugs to counter declining prices in<br />
the Indian market with enhanced<br />
revenues, while on the other; we<br />
consolidated our domestic formulation<br />
business by strengthening key brands<br />
and deepening our product basket. In<br />
the API business, our Ankleshwar plant<br />
was inspected and approved by the US<br />
FDA and we also enhanced the capacity<br />
of our bulk drug manufacturing facility
The Company successfully launched its<br />
sales and marketing front-end targeting<br />
the US generic opportunity while investing<br />
in building its bulk and formulation<br />
product pipelines to address the generic<br />
opportunity in regulated markets.<br />
<strong>Annual</strong> <strong>Report</strong> 2004-2005<br />
13
Our lead compound for Asthma and<br />
COPD, GRC 3886, commenced and<br />
successfully completed Phase I trials in<br />
the UK. The Company collaborated with<br />
two partners, Forest Laboratories for<br />
North America [September 2004] and<br />
Teijin Pharmaceuticals Ltd. for Japan<br />
[April 2005], for developing and<br />
commercialising the molecule. We were<br />
also able to build a good portfolio of<br />
new drug molecules in addition to GRC<br />
3886. Some of these programmes have<br />
led to drug candidates that are currently<br />
in pre-clinical testing and are likely to<br />
result in additional Phase I candidates<br />
during FY 2005-06 and further on.<br />
Strategy<br />
Wider and deeper global<br />
presence<br />
Strong NCE and NDDS focus<br />
and stronger therapeutic<br />
presence through new<br />
molecule introduction<br />
Backward integration into<br />
APIs - high DMF filings<br />
Better leverage of the lowcost<br />
India-manufacturing<br />
advantage<br />
Building capabilities for US<br />
FDA and other regulatory<br />
approvals<br />
How did the Management strengthen<br />
the Company's R&D thrust<br />
<strong>Glenmark</strong> continued to focus on two<br />
broad disease areas - inflammatory<br />
conditions and metabolic diseases. As<br />
mentioned earlier, GRC 3886 which is<br />
our lead PDE-4 inhibitor compound for<br />
Asthma and COPD successfully<br />
concluded Phase I human trials and has<br />
shown substantial therapeutic potential.<br />
The Diabetes programme has resulted<br />
in a lead DPP-IV inhibitor, GRC 8200. The<br />
molecule is an oral, long-acting, oncedaily-dosing<br />
drug that is currently in<br />
pre-clinical testing. We expect to take<br />
GRC 8200 into Phase I testing by<br />
August-September 2005. Even though<br />
the molecules will be commercialised<br />
only over the next five years, subject to<br />
their success in the subsequent phases<br />
of clinical trials, the Company will be<br />
able to out-license or co-develop them<br />
with global pharmaceutical majors. Such<br />
collaboration deals have already been<br />
signed for GRC 3886 for the territories of<br />
North America and Japan. Work on<br />
several new targets commenced during<br />
the year and the Company has also<br />
done significant work on additional<br />
indications in the inflammatory diseases<br />
area, viz. those targeting the central<br />
nervous system, topical ailments, gastrointestinal<br />
inflammatory disorders, RA<br />
[rheumatoid arthritis], etc.<br />
Our R&D strategy has been carefully<br />
designed and is re-aligned regularly to<br />
de-risk the organisation: we are<br />
concentrating on more than one<br />
therapeutic segment, multiple targets<br />
and a pipeline of drug compounds with<br />
a view to strengthen our success<br />
prospects. Dedicated teams are working<br />
on formulation development and API<br />
process research for launch across our<br />
various markets. Filing patents will<br />
constitute an integral part of our<br />
endeavour to differentiate our products<br />
across the domestic and international<br />
markets. Thus our research efforts span<br />
the entire risk-reward spectrum in the<br />
pharmaceutical chain and will drive<br />
growth as <strong>Glenmark</strong> evolves along the<br />
value chain.<br />
How did the Company respond to the<br />
pressures in the Indian formulations<br />
business<br />
The Indian formulations business<br />
continues to be under pressure from<br />
challenges in the environment spanning<br />
severe price competition, several “metoo”<br />
launches in each segment, and fast<br />
diminishing opportunities for launching<br />
new products as India has started<br />
recognising product patents since<br />
January 2005. In addition, during the last<br />
year the industry faced a challenging<br />
fourth quarter due to changes in the<br />
excise regime and the uncertainty<br />
surrounding the implementation of VAT.<br />
This can be witnessed in the meagre<br />
increase in volume [4.3 percent] and<br />
value [4.17 percent] exhibited by the<br />
Indian Pharmaceutical Market [IPM]<br />
[ORG IMS MAT, March 2005]. We expect<br />
this sluggish value growth to sustain for<br />
the next 2-3 years as companies expand<br />
their therapeutic segment coverage in<br />
response to the challenge of 2005 and<br />
diminishing new product options,<br />
thereby increasing competition.<br />
In 2004-05 <strong>Glenmark</strong> continued to<br />
follow its multi-pronged strategy to<br />
counter this impact. Aggressive new<br />
product development being one; where<br />
we have focused on the rapid launch of<br />
powerful products like Altacef OD,<br />
Carbonyl Iron and Mignar to replace<br />
older therapies. The Company also<br />
launched several line and brand<br />
extensions to bridge the therapy gaps in<br />
many of its segments. Finally, in a bid to<br />
improve focus, better manage its<br />
portfolio of brands and relationships<br />
with prescribers, the Company<br />
restructured its domestic sales team into<br />
six divisions catering to different<br />
specialties and prescriber bases. Two<br />
other divisions were launched in April<br />
2005 to cater to family physicians and<br />
government tender opportunities. We<br />
are confident that these initiatives will<br />
translate into robust growth across the<br />
foreseeable future and help us combat<br />
some of the challenges in the industry.<br />
How does the Company expect to<br />
strengthen its presence in the API<br />
business<br />
Our presence in the API business will be<br />
strengthened through an ongoing<br />
investment in our manufacturing<br />
facilities and research capabilities and<br />
expansion into newer markets. For<br />
instance, we are expanding and<br />
upgrading our API manufacturing<br />
plants; we are strengthening our inhouse<br />
research team with a view to<br />
accelerate the drug engineering process<br />
and consequently, their introduction; we
<strong>Glenmark</strong> Pharmaceuticals Limited<br />
are filing DMFs in the US and EU to<br />
supply API to companies in these<br />
markets.<br />
At <strong>Glenmark</strong>, we view the API business<br />
from a two-way perspective. Firstly, API<br />
manufacture serves as a backward<br />
integration into our formulation-centric<br />
value chain, which helps us rationalise<br />
cost and get increasingly competitive.<br />
Secondly, API products are not intended<br />
for captive use alone but are marketed<br />
to users in India and abroad so that they<br />
represent a standalone business for the<br />
company.<br />
In view of this, the API division gives us a<br />
competitive cost foundation that<br />
enables our formulations to compete in<br />
the domestic and global markets, in<br />
addition to enhancing our revenues.<br />
What are the significant strengths of<br />
the Company<br />
Primarily, it is our responsiveness to the<br />
external environment. This is reflected<br />
in our ability to rapidly evolve from<br />
being an India-centric formulations<br />
company to one that is diversified with<br />
a growing presence in APIs, a focused<br />
and balanced R&D initiative which has<br />
already started paying rich dividends in<br />
the form of licensing deal payments,<br />
and a presence in over 70 countries<br />
across the globe including the regulated<br />
markets of the EU and the USA.<br />
Moreover, <strong>Glenmark</strong> has always believed<br />
in building on its strengths, which is<br />
reflected in the investments it has made<br />
in its people resulting in a strong<br />
management and scientific team.<br />
What are the significant<br />
opportunities ahead of the<br />
Company<br />
Going forward, the Company is now set<br />
to benefit significantly from efforts in<br />
three areas that will unfold in the short<br />
to medium term.<br />
Partnering opportunities for its<br />
rapidly developing NCE pipeline that<br />
commenced with GRC 3886 and which<br />
now includes a lead compound for<br />
diabetes, several programmes for<br />
identifying PDE-4 inhibitors for other<br />
inflammatory conditions, etc. The<br />
Company has set a target of having 4-6<br />
compounds in clinical trials within 3<br />
years.<br />
Growth in revenues from the<br />
regulated market generic business that<br />
is rapidly taking shape with the settingup<br />
of a commercial sales' front-end in<br />
the US, a subsidiary in the UK and the<br />
acquisition of a company in Brazil<br />
during the year under review.<br />
Acquisitions in select growth markets<br />
across the world to establish sales and<br />
marketing front-ends for generics and<br />
branded generics.<br />
In addition, the Company is also<br />
targeting significant growth in its<br />
branded generic formulations business<br />
in around 70 countries across the globe<br />
[including India] as well as in the API<br />
business. The latter will also benefit from<br />
the rapidly developing pipeline of DMFs<br />
starting with the 13 that have been filed<br />
till March 2005.<br />
How does the Company expect to<br />
significantly enhance shareholder<br />
value<br />
<strong>Glenmark</strong> is adding significant value to<br />
the shareholders by delivering stellar<br />
growth in revenues and profits year on<br />
year. Correspondingly, there is a strong<br />
commitment to mitigate risks by<br />
establishing a growing presence in<br />
several markets and business segments<br />
that will help improve asset productivity<br />
and allow quicker returns on<br />
investment. Our firm commitment to<br />
develop a pipeline of NCE compounds<br />
will provide significant upside to the<br />
shareholders in the years to come. We<br />
are of the opinion that the GATT<br />
challenge of 2005 is not going to pose a<br />
threat until 2008-10 by which time our<br />
NCE strategy will start delivering results.<br />
As a result, our various initiatives,<br />
coupled with our integration and active<br />
risk management, will not only help us<br />
multiply our revenues but also buffer<br />
our profits, resulting in superior returns<br />
to our shareholders.<br />
Agenda for 2005-06<br />
Build an ANDA pipeline of 22-24 products,<br />
including products developed in partnership<br />
Obtain regulatory approval for the Goa facility and<br />
commence manufacture of formulations for sale in<br />
regulated markets<br />
Identify a European partner for GRC 3886<br />
Take two NCE molecules into Phase I clinical trials<br />
and seek licensing/co-development alliances for them<br />
Deepen the domestic market formulation focus by<br />
introducing products that will replace existing<br />
therapies<br />
Strengthen systems and processes, increase<br />
efficiencies and reduce costs<br />
Look for acquisitions to accelerate growth and<br />
global reach<br />
15<br />
<strong>Annual</strong> <strong>Report</strong> 2004-2005
Business Divisional Analysis<br />
16<br />
India<br />
Formulations<br />
Active<br />
Pharmaceutical<br />
Ingredients<br />
<strong>Glenmark</strong><br />
Pharmaceuticals<br />
Limited<br />
NCE Research<br />
International<br />
Formulations<br />
India Formulations<br />
The oldest group in the Company,<br />
it handles all formulation sales<br />
within India.<br />
Active Pharmaceutical<br />
Ingredients [APIs]<br />
This group supplies API for the<br />
Company's captive consumption in<br />
addition to catering to varied<br />
requirements, both, within and outside<br />
India. Moreover, it co-markets valueadded<br />
formulations along with APIs to<br />
other pharmaceutical companies.<br />
International Formulations<br />
This group, comprises subsidiaries that<br />
address developed markets, drives sales<br />
of formulations in the semi-regulated<br />
and regulated countries.<br />
NCE Research<br />
This segment has started yielding<br />
financial results only this fiscal year. It<br />
started off with the landmark deal for<br />
the Company's lead compound for<br />
asthma/COPD for North America and<br />
was followed by another agreement<br />
towards the beginning of FY 2006 for<br />
the Japanese market for the same<br />
molecule.<br />
An integrated business<br />
model<br />
<strong>Glenmark</strong> has worked towards creating<br />
a comprehensive and integrated<br />
business model. To illustrate, the model<br />
covers the entire gamut from drug<br />
discovery to the development of API to<br />
the marketing of formulations within, as<br />
well as out of, India. Furthermore, each<br />
element in this value pyramid is a<br />
revenue generator across an increasing<br />
number of markets, which has resulted<br />
in improved performances and better<br />
growth targets for the Company.<br />
Since, the Company's IPO in 1999,<br />
<strong>Glenmark</strong> has been able to establish its<br />
presence across a number of semiregulated<br />
markets which share its<br />
demographic and regulatory profile,<br />
namely, Africa, South and South East<br />
Asia, the Middle East and more recently,<br />
Latin America. Its Brazilian subsidiary<br />
has also successfully integrated the<br />
company it acquired a year ago and has<br />
added four more products to its basket.<br />
<strong>Glenmark</strong>'s efforts to establish itself in<br />
the developed markets of USA and<br />
Europe gained momentum in FY 2005<br />
with the launch of its sales and<br />
marketing front-end in the US.<br />
The following section reviews the<br />
operations and the growth strategy of<br />
each of the Company's market-focussed<br />
divisions.
<strong>Glenmark</strong> has responded to challenges in<br />
the environment by segregating its<br />
business for better focus and impact<br />
<strong>Annual</strong> <strong>Report</strong> 2004-2005<br />
17
Domestic Formulations<br />
Performance Highlights, 2004-05<br />
<br />
<br />
<br />
<br />
<br />
<br />
The domestic formulations group reported a value growth of 8.33 percent,<br />
outperforming the Indian market growth rate of 4.17 percent. [ORG IMS<br />
MAT, March 2005]<br />
Yet again, the volume growth of the formulations group was higher, but its<br />
impact was stunted by a sharp price decline.<br />
The domestic formulations business was ranked number one in its<br />
operating market [comprising therapeutic segments that account for<br />
95 percent of revenues as per ORG IMS MAT, March 2005 figures].<br />
The Company consolidated its position in the pain management and antidiabetics<br />
segments; while gaining strength in dermatology, cardiology and<br />
anti-infective categories with new product launches.<br />
The Group strengthened its field force to around 1300 field sales officers.<br />
The Company also commenced construction of a plant at Baddi, Himachal<br />
Pradesh which will primarily cater to the Indian and select semi-regulated<br />
markets.<br />
Company's largest revenue generator,<br />
contributing to 50 percent of the total<br />
turnover, with revenues of Rs 3027.74<br />
million in 2004-05 [Rs 2892.00 million in<br />
2003-04]. Compared to the IPI's growth<br />
of 4.17 percent, the Company's<br />
domestic formulation revenues<br />
recorded a growth of 8.33 percent, while<br />
the volumes indicated a corresponding<br />
increase of 7.5 percent.<br />
Therapy Segments<br />
In FY 2005 the formulation business's<br />
three divisions, <strong>Glenmark</strong>, Gracewell and<br />
Healtheon helped the Company<br />
strengthen its focus on defined<br />
therapeutic segments as well as<br />
associated practitioners/specialists.<br />
18<br />
Introduction<br />
The Indian Pharmaceutical<br />
Industry [IPI] has witnessed rapid<br />
growth in the past few years.<br />
Presently, the Indian Pharmaceutical<br />
Market [IPM] constitutes around 1.5<br />
percent of the global pharma industry<br />
in terms of value and 8 percent on the<br />
basis of volume. Valued at<br />
approximately USD 5 billion, the IPM, is<br />
heavily fragmented, comprising over<br />
21,000 companies of which only 10,700<br />
are registered units. Thirty five per cent<br />
of the market is dominated by the top<br />
10 companies. Furthermore, the<br />
industry is extremely price-sensitive,<br />
augmented by a low consumer<br />
purchasing power and an underevolved<br />
health insurance sector.<br />
Traditionally, India has made a mark for<br />
itself in the field of reverse engineering<br />
and is recognised for supplying the<br />
market with the lowest priced drugs.<br />
But all that is set to change, as India<br />
having signed GATT, is obliged to<br />
recognise product patents, starting from<br />
2005.<br />
Amidst this scenario, <strong>Glenmark</strong>'s<br />
domestic formulations business<br />
segment continued to be the<br />
<strong>Glenmark</strong>: It is the Group's oldest<br />
division and is focused on specialties<br />
like gynaecology, physicians and<br />
orthopaedics, handling several flagship<br />
brands of the Company.<br />
Gracewell: This division focuses on<br />
dermatological, pain management,<br />
antibiotics and respiratory therapy<br />
segments.<br />
Healtheon: A relatively new division,<br />
Healtheon's focus is on lifestyle-related<br />
products and markets anti-diabetic,<br />
cardiovascular and lipid-lowering drugs.<br />
In FY 2005, the dermatological and<br />
respiratory therapy segments
<strong>Annual</strong> <strong>Report</strong> 2004-2005<br />
19<br />
A multi-tiered strategy for driving<br />
growth, sustaining organisational<br />
revenue and increasing profitability<br />
in the India Formulations Business
20<br />
accounted for almost 50 percent of the<br />
domestic revenue pie. Additionally, the<br />
newly introduced anti-diabetic and<br />
cardiovascular segments showed an<br />
upward movement over the previous<br />
years. This change can be witnessed in<br />
the industry as a whole, where<br />
traditionally, acute therapies have<br />
dominated the market; the trend is<br />
movement towards chronic<br />
therapies. While acute therapies still<br />
constitute 77 percent of the market,<br />
they are growing at half the pace of<br />
chronic therapies. [ORG IMS MAT, Nov<br />
2004]<br />
Divisional Strategy<br />
<strong>Glenmark</strong>'s attractive growth in the<br />
formulations segment is a result of the<br />
sustained introduction of improved<br />
drugs and an entry into new growth<br />
segments.<br />
Expanding into newer segments:<br />
<strong>Glenmark</strong> appreciates that in order to<br />
profitably sustain growth in the<br />
domestic arena, it is vital to expand the<br />
business to cover more therapy areas.<br />
This diversification has taken place over<br />
the past five years and is yielding rich<br />
dividends.<br />
Launching new products and<br />
establishing first-mover advantage:<br />
Apart from developing an extensive<br />
therapeutic presence, <strong>Glenmark</strong> has also<br />
been the first to launch new generation<br />
drugs and capture a first-mover's<br />
advantage in these segments. The<br />
products launched last year under this<br />
category are:<br />
Adapalene + Clindamycin<br />
[Dermatological - Acne],<br />
Atorvastatin + Ezetimibe<br />
[Lipid-lowering],<br />
Aztreonam [Antibiotic],<br />
Therapeutic Segment Share in Revenues [Percentages]<br />
Therapeutic segments<br />
Dermatologicals<br />
Respiratory<br />
Pain Management<br />
Anti-Infectives<br />
Anti-Diabetics<br />
Gastrointestinal<br />
Gynaecologicals<br />
Cardiovascular<br />
Others<br />
Total<br />
Source: ORG IMS MAT[Mar 2005]<br />
2005 2004 2003 2002 2001<br />
33 34 35 36 37<br />
15 18 18 21 22<br />
13 10 7 3 4<br />
11 11 12 12 11<br />
8 7 7 4 0<br />
7 8 11 11 10<br />
5 6 6 7 9<br />
5 3 0 0 0<br />
3 4 4 5 6<br />
100 100 100 100 100<br />
Diversified Specialty Segment<br />
Portfolio<br />
Specialty<br />
Segments<br />
Gynaecology<br />
Respiratory<br />
Internal Medicine<br />
Dermatology 49%<br />
Cardiac<br />
Gynaecology<br />
Diabetes<br />
Pain Management<br />
Respiratory<br />
Internal Medicine<br />
Dermatology<br />
Percentage<br />
5%<br />
Source: ORG IMS MAT [Feb 1998]<br />
Source: ORG IMS MAT [Mar 2005]<br />
21%<br />
25%<br />
4%<br />
5%<br />
8%<br />
13%<br />
16%<br />
21%<br />
33%<br />
Carbonyl iron [Hematinics],<br />
Cefuroxime OD [Antibiotic],<br />
Esomeprazole + Domperidone<br />
.....[Gastrointestinal],<br />
Etoricoxib [Pain Management],<br />
Metformin SR [Anti-diabetic],<br />
Miglitol [Anti-diabetic] and<br />
Tazarotene [Dermatological -<br />
Psoriasis]<br />
Replacing older therapies:<br />
<strong>Glenmark</strong> has also replaced older and<br />
inferior molecules with newer therapies<br />
and combination drugs, a strategy more<br />
profitable than the launch of me-too<br />
brands. These new molecules /<br />
combination therapies have redefined<br />
the dominant therapy in their segments<br />
and led to an increase in sales. Once<br />
again, this trend has been seen in the<br />
domestic industry where combination<br />
therapies have driven the growth in the<br />
market [ORG IMS MAT, 2004]. Please<br />
refer to the new products stated earlier.<br />
The Company's revenues in 2004-05<br />
from new molecules [launched in the<br />
preceding two years in each case] are<br />
detailed in the table on the next page.<br />
The table illustrates, that the<br />
replacement of older therapies with<br />
new drugs as well as expansion into<br />
newer segments have benefited the<br />
bottom line.<br />
These new product launches have not<br />
only enhanced revenues, but they have<br />
also helped the Company reduce its<br />
dependence on its older brands and<br />
establish a broader brand basket.<br />
Leveraging technology assets:<br />
<strong>Glenmark</strong> recognises the limited run<br />
that even successful products enjoy and<br />
hence has sought to extend their<br />
lifecycle through novel drug delivery<br />
systems.<br />
Striving to build brands:<br />
<strong>Glenmark</strong>'s strategy is to maximise<br />
revenue from formulations by focusing<br />
on brands. This is integral to the<br />
Company's growth for a number of<br />
reasons: robust brands enhance revenue
<strong>Glenmark</strong> Pharmaceuticals Limited<br />
New products launched by <strong>Glenmark</strong> in last two years<br />
Brand Molecule FY 2005 Growth FY 2004<br />
[Rs./Mn.] [%] [Rs./Mn.]<br />
Kretos Etoricoxib 40.1 5786.5 0.7<br />
Ebov Etoricoxib 37.5 6467.7 0.6<br />
Tacroz Tacrolimus 35.9 63.3 22.0<br />
Telma H Telmisartan + Hydrochlorothiazide 25.8 528.5 4.1<br />
Valus XT Valdecoxib + Tizanidine 22.5 628.5 3.1<br />
Razel Rosuvastatin 20.9 108.0 10.0<br />
Deriva-C Clindamycin + Adapalene 17.8 656.1 2.4<br />
Zetitor Atorvastatin + Ezetimibe 13.6 - -<br />
Tazret Tazarotene 10.2 71.1 5.9<br />
Vorth XT Valdecoxib + Tizanidine 9.2 577.4 1.4<br />
Kefpod Suspn. Cefpodoxime Suspn. 7.4 254.0 2.1<br />
Valus Insta Gel Valdecoxib Gel 6.7 224.4 2.1<br />
Carboflot Carbonyl Iron Solid 6.0 - -<br />
Mucaryl-AX Cough Preparation 5.8 - -<br />
Esoz D Esomeprazole + Domperidone 5.0 - -<br />
Mignar Miglitol 4.8 - -<br />
Glevo [Injection] Levofloxacin 4.5 8.2 4.2<br />
Maclar Suspn. Clarithromycin Suspn. 4.0 13.5 3.5<br />
Vorth Insta Gel Valdecoxib Gel 3.0 112.2 1.4<br />
Altacef OD Cefuroxime 2.26 - -<br />
L-Cetridoc Levocetrizine 1.6 - -<br />
Ezzicad Ezetimibe 0.7 451.2 1.0<br />
Lerez AT Lercanidipine + Atenolol 0.3 374.6 0.1<br />
Valus Plus Valdecoxib + Paracetamol 0.2 - -<br />
Trezam Aztreonam 0.1 - -<br />
Source: ORG IMS MAT [Mar 2005]<br />
Revenue contribution from new products [
Active Pharmaceutical Ingredients<br />
22<br />
Highlights, 2004-05<br />
The Ankleshwar plant, obtained from GSK in 2003, was successfully<br />
inspected and approved by the US FDA for the following two<br />
products, Amiodarone Hydrochloride and Cilostazole.<br />
The Company filed 13 DMFs by March 2005.<br />
Sixteen new products were introduced across segments which included<br />
Dermatological, Cardiovascular, Pain Management and CNS therapeutic<br />
segments.<br />
Significant contributions to revenues were made by newly added<br />
markets in Asia Pacific, South America, Middle East and Canada.<br />
The Company also filed 39 process patents.<br />
Introduction<br />
The role of suppliers of active<br />
ingredients, often referred to as<br />
building blocks, in the<br />
pharmaceutical industry, is rapidly<br />
changing in response to the changing<br />
needs of its customers and can be<br />
expected to evolve even more in the<br />
future. The generics industry is<br />
expected to witness significant growth<br />
in the following 5-6 years and the<br />
derived demand for quality APIs is<br />
projected to grow rapidly. The share of<br />
regulated markets in the export<br />
revenues of Indian API manufacturers is<br />
expected to rise sharply; in FY 2005,<br />
Indian pharmaceutical players have filed<br />
more than 200 DMFs with the US FDA.<br />
In the fourth quarter of FY 2005 alone,<br />
the US FDA is reported to have received<br />
74 filings from Indian companies and<br />
this figure has been the highest<br />
achieved by the Asian sub-continent in<br />
the past 2 years.<br />
A number of factors contribute to India<br />
becoming the most sought after<br />
destination for the sourcing of bulk<br />
drugs, viz.<br />
Low development costs.<br />
Strong process chemistry capabilities<br />
to undertake complex synthesis.<br />
High quality certified manufacturing<br />
facilities. At present, India has over 70<br />
bulk drugs manufacturing units<br />
approved by the US FDA and several<br />
other regulatory agencies. Further, this<br />
number is likely to move up in the near<br />
future.<br />
Growing skill levels in developing<br />
low cost API's through non-infringing<br />
routes to assist in the timely launch of<br />
generic formulations in regulated<br />
markets, thereby acting as a catalyst for<br />
the growth of the generics industry.<br />
<strong>Glenmark</strong> Pharmaceuticals Ltd is an<br />
emerging, global pharmaceutical<br />
company with proven research<br />
capabilities. The Company's API
developing<br />
low cost routes to<br />
manufacture drugs<br />
going off patent to serve<br />
the generics industry<br />
<strong>Annual</strong> <strong>Report</strong> 2004-2005<br />
23
Therapeutic segment<br />
contribution in FY 2005<br />
Anti-inflammatory<br />
33.62 %<br />
business was developed four years ago<br />
in keeping with its vision of emerging as<br />
an integrated pharmaceutical player.<br />
Today, the Company's manufacture of<br />
API not only serves its captive<br />
requirement but is also marketed to<br />
third parties within India and abroad.<br />
The API Advantage<br />
From a strategic perspective, a<br />
backward integration into the synthesis<br />
and manufacture of APIs helps<br />
manufacturers in three ways:<br />
The API skills have also contributed to<br />
<strong>Glenmark</strong>'s pace of development of<br />
NCEs as <strong>Glenmark</strong> is equipped to<br />
develop and patent processes to<br />
manufacture the bulk required by its<br />
novel drugs. In the recently concluded<br />
collaboration agreements for its<br />
Asthma/COPD lead molecule GRC 3886<br />
with Forest Laboratories [North<br />
America] and Teijin Pharma Ltd. [Japan],<br />
<strong>Glenmark</strong> has committed to produce<br />
and meet the API needs of its partners<br />
during drug development and after<br />
commercialisation.<br />
Anti-diabetic<br />
Cholesterol and<br />
triglyceride reducer<br />
Angiotensin II antagonist<br />
ACE Inhibitor<br />
Others<br />
15.52 %<br />
8.92 %<br />
5.89 %<br />
5.47 %<br />
30.58 %<br />
The potential to augment revenues<br />
and profits by addressing the fastgrowing<br />
API demand.<br />
A significant cost and pricing<br />
advantage in the manufacture of<br />
formulations especially when APIs<br />
manufactured in-house are used.<br />
An ability to rapidly launch new<br />
formulations due to an easy access to<br />
the required APIs, resulting in a firstmover's<br />
advantage and higher-thannormal<br />
initial revenues.<br />
Lastly, API competencies will provide a<br />
source of partnering advantage to<br />
explore in-licensing opportunities for<br />
novel drugs under development. In<br />
return for rights to market the drug<br />
under development in less regulated<br />
markets including India, <strong>Glenmark</strong> can<br />
provide partners with a low cost<br />
manufacturing base and also help<br />
optimise the API resources.
<strong>Glenmark</strong> Pharmaceuticals Limited<br />
Growth Strategy<br />
In the short time that <strong>Glenmark</strong><br />
commenced manufacturing APIs, it has<br />
developed significant strengths. These<br />
comprise:<br />
1. An ability to develop low cost<br />
processes and manufacture quality<br />
generic products that are delivered on<br />
time and at competitive prices in target<br />
markets.<br />
2. A capacity to develop and<br />
manufacture complex multi-step<br />
molecules and build value-added<br />
therapies for higher and sustainable<br />
growth.<br />
3. A capability for deriving economies of<br />
scale.<br />
4. A comprehensive understanding of<br />
global regulatory and IPM requirements.<br />
Over the years, the Company has<br />
strengthened its API presence through a<br />
four-pronged strategy:<br />
1. Exploration of opportunities in the<br />
growing lifestyle segment:<br />
Changing lifestyles and food habits<br />
have given rise to a new set of ailments.<br />
The IPM which has until recently,<br />
focused on acute therapies, has started<br />
shifting towards the chronic segment.<br />
<strong>Glenmark</strong> has recognised and captured<br />
the growing opportunities offered by<br />
this lifestyle segment across its various<br />
business units.<br />
2. Rapid launch of new molecules:<br />
In recent times, the industry has been<br />
plagued by shorter product life cycles<br />
and declining returns. <strong>Glenmark</strong> has<br />
countered this by introducing new<br />
molecules with an increasing frequency.<br />
Over the years, new product launches<br />
have contributed to an increasing<br />
proportion of revenues and has also<br />
served to de-risk the business from<br />
being affected by lowering prices across<br />
its existing products.<br />
3. Building strong process research<br />
capabilities:<br />
<strong>Glenmark</strong>'s research centre at Mahape<br />
houses six laboratories dedicated to API<br />
research. Manned by a qualified team of<br />
around 70 scientists and process<br />
chemists, these laboratories are<br />
equipped with state-of-the-art<br />
equipment and analytical tools. This,<br />
coupled with strong, dedicated process<br />
research capabilities, has helped reduce<br />
costs and product development time to<br />
a significant extent.<br />
The research strength has also been<br />
reinforced by a sophisticated<br />
information centre that provides<br />
relevant scientific data, guiding the<br />
efforts in the development of a pipeline<br />
of high opportunity drugs. The research<br />
facilities specialise in stereo chemistry,<br />
heterocyclic chemistry, resolution<br />
chemistry and carbohydrate chemistry.<br />
The research team is currently working<br />
on over 40 projects and has<br />
commercialised 35 products over the<br />
last three years. The Company has filed<br />
patents on processes for thirty nine<br />
products and has also filed thirteen<br />
DMFs in FY 2005. Work on its future<br />
pipeline is progressing at a rapid pace<br />
and the Company expects to file 14<br />
DMFs in FY 2005 and also commercialise<br />
over 10 products in the less regulated<br />
markets in the same time-frame. The<br />
novel drugs [NCEs] being developed by<br />
the Company have also drawn upon the<br />
process skills of the research team for<br />
development and scale-up.<br />
4. Low cost, high quality<br />
manufacturing:<br />
The division has three plants one at<br />
Kurkumbh, a recently acquired plant at<br />
Mohol [near Solapur], both in<br />
Maharashtra, and another at Ankleshwar<br />
[Gujarat]. The Ankleshwar plant was<br />
acquired from GlaxoSmithKline and has<br />
been approved by the USF DA for two<br />
products in FY 2005.<br />
Outlook<br />
The API division expects to drive<br />
revenue growth in FY 2005-06 through<br />
the following initiatives:<br />
Tie-ups and co-marketing initiatives<br />
to increase the target number of<br />
products from 50 to 65.<br />
Development of 14 Drug Master Files<br />
[DMFs] for the US market to further<br />
develop the API and generic<br />
formulation businesses.<br />
Focus on the US market in addition<br />
to those in Asia-Pacific, South America,<br />
Eastern Europe and parts of Western<br />
Europe.<br />
Development of commercial batches<br />
of DMF-grade APIs to supply customers<br />
in North America and Europe for<br />
products already filed till date. At the<br />
same time, develop an additional 14<br />
DMFs for the regulated markets.<br />
Capacity upgrade for the Ankleshwar<br />
and Kurkumbh facilities.<br />
Commence construction of a new<br />
manufacturing facility.<br />
End Note<br />
<strong>Glenmark</strong> will continue to focus on<br />
strengthening its API operations and<br />
transplanting its experience into the<br />
advanced generic markets of USA and<br />
Europe.<br />
25<br />
<strong>Annual</strong> <strong>Report</strong> 2004-2005
International Formulations<br />
Performance Highlights, 2004-05<br />
<br />
<br />
<br />
<br />
<br />
<br />
<br />
The Company's international operations in the semi-regulated markets<br />
recorded revenues of Rs. 819.16 million in 2004-05, a growth of 74 percent<br />
over the previous year [Rs. 469.28 million in 2003-04].<br />
Revenues from Africa and Asia grew by 61 percent and 62 percent<br />
respectively, while Russia and CIS demonstrated an 80 percent growth.<br />
Latin America, the newest market, recorded an exponential growth of 231<br />
percent.<br />
The Company's US subsidiary launched its marketing and sales' front-end<br />
in the last quarter with two generic products in-licensed from companies<br />
in the US. The Subsidiary also entered into an agreement for the joint<br />
development, filing and marketing of twelve generic pharmaceutical<br />
products with a Chennai-based company and acquired two generic<br />
dossiers from a subsidiary of Stada Pharmaceuticals.<br />
The UK subsidiary of <strong>Glenmark</strong> is in the process of establishing<br />
partnerships for the Company in Europe and also evaluating acquisition<br />
opportunities for front-ends in select markets.<br />
<strong>Glenmark</strong>'s Brazilian subsidiary filed 3 formulation dossiers and acquired<br />
exclusive trademark, global manufacturing and marketing rights for a<br />
leading contraceptive. In addition, Klinger Laboratories, a company<br />
acquired in Brazil in April 2004, was successfully integrated into the<br />
Group's operations and closed the year with sales of USD 5.36 million and<br />
profits of USD 0.7 million.<br />
The Company expanded its operations to cover around 70 semi-regulated<br />
country markets by March 2005. The new countries that were added to<br />
the portfolio are Eritrea, Botswana, Central African Republic, Bolivia, Haiti,<br />
Dominican Republic, Guyana, Kazakhastan and Iraq.<br />
The marketing and sales network was expanded to several countries and<br />
the Company appointed additional country managers and sales teams<br />
across the semi-regulated markets to directly market the <strong>Glenmark</strong> brand<br />
and its formulations.<br />
Introduction<br />
T<br />
his is <strong>Glenmark</strong>'s fastest growing<br />
segment and its operations are<br />
spread across the regulated<br />
markets along with the rapidly growing<br />
markets of Asia, Africa, Caribbean<br />
islands, Latin America, Russia and the CIS<br />
states. The business recorded a<br />
turnover of Rs. 819.16 million, which<br />
is a 74 percent growth over the<br />
previous year [Rs. 469.28 million].<br />
Regulated Markets: The US<br />
Initiative<br />
In 2003, North America alone accounted<br />
for nearly half of the global<br />
pharmaceutical sales at USD 229.5<br />
billion, with a growth of 12.4 percent<br />
over the previous year. It is estimated<br />
that the US pharmaceutical market will<br />
continue to grow at a rate of 12 to 14<br />
percent after 2003. [Executive Insight,<br />
Global Pharmaceuticals, Nov 2004]<br />
The retail generics market in the USA is<br />
valued at USD 62 billion and accounted<br />
for 13.3 percent of the pharmaceutical<br />
market in 2003 with a corresponding<br />
volume share of 30 percent. This<br />
segment which had been growing at a<br />
steady rate ranging between 4-5
partnering for<br />
growth<br />
<strong>Annual</strong> <strong>Report</strong> 2004-2005<br />
27
28<br />
percent evinced a growth spurt in 2003.<br />
This accelerated growth of nearly 9<br />
percent is expected to continue for a<br />
few more years in view of the number<br />
of drugs that are expected to go offpatent.<br />
[Executive Insight, Global<br />
Pharmaceuticals, Nov 2004]<br />
<strong>Glenmark</strong> Pharmaceuticals Inc., USA<br />
[GPI] was established in 2003 to utilise<br />
<strong>Glenmark</strong>'s expertise in formulation<br />
development, vertical integration and<br />
trade relations, and leverage these core<br />
competencies into the North American<br />
market. Through a multi-pronged<br />
approach of in-licensing, core product<br />
development, and focus on niche<br />
opportunities, GPI is poised to become a<br />
significant generics company by 2007.<br />
In an effort to accelerate the growth of<br />
the US sales and marketing front-end<br />
and enter the US market more quickly,<br />
GPI has aggressively sought and found<br />
several opportunities to in-license and<br />
acquire products from other<br />
manufacturers around the globe. In<br />
August of 2004, GPI acquired two<br />
ANDAs from Clonmel Healthcare Ltd, a<br />
US subsidiary, of Stada Pharmaceuticals.<br />
These two products are limited-source<br />
generics with approximately USD 50<br />
million in sales. In addition, GPI has also<br />
in-licensed two ANDAs, Naproxen<br />
tablets and Nitroglycerin Sublingual<br />
tablets, and commenced shipping these<br />
products in February and May 2005,<br />
respectively. The products were<br />
collaborations with Interpharm Inc. of<br />
Long Island, New York [Naproxen], and<br />
Konec Laboratories of Tucson, Arizona<br />
[Nitroglycerin]. GPI has also announced<br />
a collaboration deal with India's Shasun<br />
Chemicals and Drugs Ltd [Shasun]. The<br />
agreement, which covers 12 generic<br />
products, was a landmark deal between<br />
two Indian pharmaceutical companies.<br />
In accordance with the deal, Shasun will<br />
develop and license to GPI twelve<br />
generic products that GPI would file<br />
with the US FDA and market under a<br />
<strong>Glenmark</strong> ANDA [2 of the 12 products<br />
would be under the Shasun label].<br />
Products under the agreement are<br />
expected to be filed over a three year<br />
period, with the first filing being<br />
expected in FY 2006.<br />
<strong>Glenmark</strong> enjoys a distinct competitive<br />
edge that will drive its success in the US<br />
markets:<br />
Its status as a speciality company with<br />
deep skills in select therapeutic<br />
segments helping it better leverage<br />
opportunities in those areas, viz.<br />
dermatology.<br />
A team that has prior experience in<br />
establishing and running US operations<br />
for other Indian pharmaceutical<br />
companies, offering it a home-player's<br />
advantage.<br />
An ability to match competitive prices<br />
for its formulations due to vertical<br />
integration.<br />
Strong generic and formulation<br />
development competencies enabling it<br />
to turn out products at a quicker pace.<br />
Excellent trade relations into the<br />
chains, wholesalers and distributors in<br />
the US market.<br />
Strong IP advantage owing to a<br />
dedicated team.<br />
The Company has completed filing 7<br />
ANDAs to date and expects to file an<br />
additional 13 ANDAs by the end of FY<br />
2006. Its current portfolio also includes<br />
two ANDAs acquired in FY 2005 from<br />
Clonmel Healthcare. <strong>Glenmark</strong> also<br />
plans to commercially launch five to six<br />
of its products under its label by March<br />
2006.<br />
Regulated Markets: The UK<br />
Division<br />
In 2002, Europe constituted over 30<br />
percent of the global pharmaceutical<br />
market, making it the second largest<br />
market in the world. The European<br />
Union, along with the USA and Japan<br />
made up 85 percent of the audited<br />
worldwide pharmaceutical sales in 2003,<br />
USD 466 billion in value. [Executive<br />
Insight, Global Pharmaceuticals, Nov<br />
2004]<br />
<strong>Glenmark</strong> Pharmaceuticals [UK] Ltd. was<br />
set up in 2004 to establish and expand<br />
<strong>Glenmark</strong>'s business in the European<br />
Union. The Subsidiary will spearhead<br />
<strong>Glenmark</strong>'s activities in Europe and is<br />
currently working on establishing the<br />
Company's front-end. With UK as the<br />
headquarters, GP [UK] L is building<br />
<strong>Glenmark</strong>'s product portfolio in the EU<br />
and is exploring opportunities for<br />
partnerships with various European<br />
companies to establish licensing and<br />
sales contracts. The subsidiary will also<br />
look for appropriate opportunities for<br />
inorganic growth in Europe. The team is<br />
being expanded this year to include<br />
Regulatory Affairs, IP, Business<br />
Development and Sales professionals.<br />
Regulated Markets: The<br />
Brazil Subsidiary<br />
Currently valued at USD 5.4 billion, the<br />
pharmaceutical industry in Brazil is<br />
considered the tenth largest in the<br />
world and the second largest in Latin<br />
America. With 553 companies, it<br />
functions as a manufacturing hub for<br />
South America, of which nearly 40<br />
percent are foreign and account for<br />
approximately 75 percent of the internal<br />
market. The country's pharmaceutical<br />
industry employs about 47,000 people<br />
directly in addition to 130 wholesalers,<br />
50,000 pharmacies and 280,000 active<br />
doctors.<br />
Pharmaceutical spending is a key costcontainment<br />
target in all seven<br />
countries, with a variety of strategies<br />
being considered, notably<br />
encouragement of generics. The market<br />
for generic drugs in Brazil was formally<br />
regulated in 1999 in a government<br />
effort to reduce prices of medicines. The
<strong>Glenmark</strong> Pharmaceuticals Limited<br />
first bioequivalent generics were<br />
approved in 2000, and growth has<br />
exceeded expectations even in the retail<br />
market. Though prices have dropped to<br />
a large extent, only 25-30 percent of the<br />
population has regular access to<br />
medicines, at present. The introduction<br />
of generic drugs created a dynamic<br />
investment option in this market. While<br />
generics have been growing, branded<br />
generics have held their place in the<br />
market and command justifiable<br />
premiums in the pharmacy. This is in<br />
contrast to most other markets where<br />
the advent of generics severely<br />
impacted the sales of branded generics.<br />
This also implies that strong marketing<br />
led companies have a definite<br />
opportunity to define their place in the<br />
market and create brands that shall<br />
continue to justify the premium in the<br />
future as well.<br />
<strong>Glenmark</strong> Farmacêutica Limitada [GFL],<br />
a wholly owned Brazilian subsidiary of<br />
<strong>Glenmark</strong> Pharmaceuticals Ltd, was set<br />
up in Sao Paulo towards the end of 2003<br />
with the objective of spearheading the<br />
Company's entry into the Latin-<br />
American market. Brazil is the most<br />
regulated market in Latin America and<br />
offers immense business opportunities<br />
for pharmaceutical companies like<br />
<strong>Glenmark</strong>.<br />
To assist in building a strong presence in<br />
the Brazilian market, GFL acquired<br />
Laboratorios Klinger in FY 2004 for a<br />
consideration of USD 6.25 million.<br />
Klinger is a leading, privately owned<br />
Brazilian company with a work force of<br />
176 employees, including a sales force<br />
of 91 sales representatives. It has 21<br />
approved product registrations in Brazil,<br />
to which 3 more brands were added in<br />
FY 2005. Klinger also has its own<br />
ANVISA approved manufacturing facility<br />
in Greater Sao Paulo that manufactures<br />
oral solids [tablets, coated tablets, etc],<br />
semi solids [creams, gels, lotions] and<br />
liquids [oral suspensions, solutions, etc].<br />
At the time of the acquisition, the<br />
company's main business was<br />
generated from branded generics, with<br />
some OTC presence in the form of<br />
Ceklin [vitamin C], which was one of the<br />
top products of the Company.<br />
In March 2005, GFL purchased a leading<br />
hormonal brand, Uno-Ciclo from<br />
Instituto Biochimico Indústria<br />
Farmacêutica Ltda. [Biochimico] for USD<br />
4.6 million. The brand generated sales<br />
of USD 3.1 million in Brazil in the 12<br />
months prior to the acquisition. GFL has<br />
acquired the trademark along with<br />
exclusive manufacturing and marketing<br />
rights globally. As part of the agreement,<br />
Biochimico will contract manufacture<br />
the product for GFL. which will initially<br />
market the brand in Brazil and will work<br />
on extending the coverage to other<br />
Latin American markets in the course of<br />
time.<br />
While FY 2005 was spent in integrating<br />
Klinger with <strong>Glenmark</strong>'s operations, the<br />
true benefits will accrue in FY 2006.<br />
Apart from generating a full year's sale<br />
for the three brands registered in the<br />
fourth quarter and the contraceptive<br />
brand acquired, the Company is poised<br />
to launch an additional basket of over 6<br />
products in the first half of FY 2006.<br />
Coupled with this, the Company is<br />
strengthening its field sales force in<br />
Brazil. With these various initiatives,<br />
<strong>Glenmark</strong>'s Brazil operation is expected<br />
to grow significantly starting from FY<br />
2006. It will also provide the company a<br />
strategic entry vehicle into the markets<br />
of Latin America.<br />
Semi-Regulated /<br />
Developing Markets<br />
A number of semi-regulated markets<br />
are extremely price-sensitive and for<br />
low-cost players like <strong>Glenmark</strong>, they<br />
offer huge generic opportunities to<br />
capture market share by meeting<br />
existing therapy inadequacies.<br />
Capitalising on these prospects,<br />
<strong>Glenmark</strong> has worked on building a<br />
significant presence and brand image in<br />
these select markets over the past few<br />
years. Drawing from its experiences in<br />
other countries, the Company has<br />
progressed significantly in a short span<br />
of time. Additionally, taking a long-term<br />
perspective when commencing<br />
operations, <strong>Glenmark</strong> has invested in<br />
establishing a strong brand and<br />
marketing presence in these key<br />
markets.<br />
The Company's international presence<br />
has been strengthened through a<br />
judicious mix of strategies, which<br />
include the engagement of local sales<br />
teams to promote its products in these<br />
markets. In FY 2005, <strong>Glenmark</strong> got over<br />
200 product approvals and achieved a<br />
growth of 74 percent in revenues over<br />
that of the previous year. It has plans to<br />
file between 250 and 300 more dossiers<br />
in FY 2006. <strong>Glenmark</strong> dominates the<br />
dermatological, gynaecological,<br />
gastrointestinal and cough & cold<br />
therapy segments in most of the<br />
markets where it is present; while also<br />
making a significant impact in the antiinfective<br />
category. It now plans to build<br />
its equity in the anti-diabetic area.<br />
In the fiscal year under review, <strong>Glenmark</strong><br />
commenced operations in nine new<br />
markets. The Company promotes its<br />
brands directly to the healthcare<br />
fraternity, building a strong franchise<br />
and ensuring a steady demand; while its<br />
product pipeline effectively fills gaps in<br />
existing therapies in the markets where<br />
it is present. It is the Company's ability<br />
to adapt to varying international<br />
conditions that has enhanced its image<br />
as a customer-centric pharmaceutical<br />
player.<br />
29<br />
<strong>Annual</strong> <strong>Report</strong> 2004-2005
Research and Development<br />
30<br />
JANUARY 1, 2005 was an important<br />
day for the Indian Pharmaceutical<br />
Industry for it marked the date on<br />
which it became mandatory for India to<br />
comply with the Trade Related<br />
Intellectual Property Rights [TRIPS]<br />
Patent regime by passing the third<br />
amendment to the Indian Patent Act.<br />
Under the new law, India has to comply<br />
with the TRIPS agreement and start<br />
recognising product patents, like its<br />
global counterparts, as opposed to<br />
acknowledging process patents alone.<br />
This hitherto existing disparity between<br />
Indian and global patent laws had led to<br />
the rise of a pharmaceutical industry<br />
that has highly developed<br />
manufacturing and reverse engineering<br />
capabilities.<br />
However, following the decision to<br />
respect product patents from 2005 and<br />
the resultant approval of the patent<br />
ordinance, the scenario is set to change.<br />
Add to that, a drying generic pipeline<br />
and imminent competition from multinationals,<br />
a number of Indian<br />
companies, including <strong>Glenmark</strong>, have<br />
invested in developing capabilities in<br />
original research, targeting new<br />
chemical entities [patentable drug<br />
options] and novel drug delivery<br />
systems. This decision has been aided<br />
by the significant cost and skill<br />
New Chemical Entities<br />
New Chemical Entity [NCE] research<br />
focuses on developing chemicals /<br />
molecules that can selectively address<br />
molecular targets of certain specific<br />
diseases and provide a cure with<br />
minimal side effects.<br />
NCEs offer the highest reward for<br />
research, with correspondingly high<br />
risks. A successful NCE, following the<br />
relevant approvals, can be marketed<br />
with a 12-14 year product exclusivity<br />
period during which it can recover its<br />
investment a number of times over.<br />
However, to tap this opportunity,<br />
companies are required to invest in a<br />
multitude of skill sets, a development<br />
time-frame of 6-8 years, and<br />
considerable risk of irrecoverable<br />
research costs and morale at different<br />
stages in development.<br />
As such, successful NCE research has<br />
almost become the prerogative of large<br />
and well-funded MNCs and institutions,<br />
supported by heavy research budgets.<br />
Indian firms do not invest in the target<br />
identification exercise; instead, they<br />
adopt an approach called 'analogue<br />
research', which entails working on<br />
certain pre-identified targets for specific<br />
diseases to develop molecules that alter<br />
the target's mechanism in the diseased<br />
person. Analogue NCE research is also<br />
time-consuming, risky and expensive.<br />
The Licensing Opportunity<br />
The Indian advantage is not limited to<br />
manufacturing; the country offers an<br />
arbitrage opportunity even when it<br />
comes to the cost of intellectual capital<br />
and facility overheads. The nation also<br />
possesses a deep inventory of requisite<br />
competencies required to engage in<br />
original research. The cost of<br />
developing a drug from scratch in India<br />
could be as low as USD 100 million<br />
which is estimated to be a tenth of the<br />
expenses that are incurred in the west.<br />
Hence it's not surprising that in FY 2004,<br />
Indian pharmaceutical companies filed<br />
close to 900 drug patents as opposed to<br />
zero, a decade ago [Indian Ministry of<br />
Science and Technology].<br />
There has been an increase in the<br />
research spends by Indian companies<br />
which have doubled over the past five<br />
years, comprising 8 percent of revenues<br />
today. However, Indian companies face a<br />
resource crunch to fund even a tenth of<br />
the absolute original research cost of<br />
USD 800-1000 million. As a result, the<br />
Indian research industry is inadequately<br />
equipped to sustain the time and cost<br />
implications of a start-to-finish research<br />
model.<br />
In the light of the high research costs, an<br />
alternative collaborative route in NCE<br />
research is being increasingly favoured.<br />
In this arrangement, the lead
Research has been integral to<br />
<strong>Glenmark</strong>'s growth strategy<br />
<strong>Annual</strong> <strong>Report</strong> 2004-2005<br />
31
32<br />
compounds are licensed to global<br />
majors at an early stage of<br />
development. The payback in the<br />
licensing model is lower than a do-italone<br />
strategy but faster through<br />
milestone and royalty payments. Most<br />
importantly, it offers Indian players the<br />
opportunity to partner with a player<br />
with complementary skills in clinical<br />
development and higher risk-appetites.<br />
The licensing approach has been<br />
successfully adopted in the 1980s by<br />
countries like Japan, where companies<br />
have since graduated to taking<br />
molecules through development to<br />
market on their own. Currently several<br />
Indian companies, including <strong>Glenmark</strong>,<br />
have a stated objective of developing<br />
molecules to be licensed to developed<br />
market players.<br />
<strong>Glenmark</strong>'s Vision<br />
Original research, together with process<br />
chemistry and reverse-engineering<br />
generics, plays a critical role in<br />
<strong>Glenmark</strong>'s ongoing initiatives to<br />
execute its vision of being a research-led<br />
company.<br />
<strong>Glenmark</strong> recognises the value of<br />
investing in original research for<br />
generating valuable Intellectual<br />
Property Rights [IPR] assets that will<br />
sustain its revenues and earnings in a<br />
post-GATT regime. These IPR assets will<br />
also enable the Company to establish its<br />
brand name in regulated overseas<br />
markets and realise its vision of<br />
becoming a truly global company.<br />
<strong>Glenmark</strong> NCE R&D<br />
Highlights<br />
In view of the significant captive access<br />
cutting-edge research would assume,<br />
the Company made a strategic decision<br />
to invest in state-of-the-art R&D<br />
infrastructure and competencies about<br />
five years ago. The positive results<br />
attained in the short period, have more<br />
than justified the investments.<br />
<strong>Glenmark</strong> has made considerable<br />
progress in the discovery and<br />
development of a drug targeting the<br />
asthma/COPD segment, drugs for other<br />
inflammatory conditions and a drug for<br />
Type II Diabetes. These therapeutic<br />
areas for research were selected on the<br />
basis of distinct ground realities:<br />
Global growth potential:<br />
The incidence of asthma/COPD,<br />
diabetes and obesity are growing<br />
rapidly; collectively these segments are<br />
expected to generate more than USD 44<br />
billion by 2007.<br />
Potential for pioneering research:<br />
Since the existing therapies for these<br />
ailments have undesirable side effects,<br />
replacement opportunities can find a<br />
prominent therapeutic position. For<br />
example, steroids used currently in<br />
treating asthma are non-selective and<br />
report significant side-effects on the<br />
human body.<br />
Licensing opportunity:<br />
<strong>Glenmark</strong>'s selected research areas are<br />
of interest to several international<br />
majors because of their high revenue<br />
potential, and hence they present<br />
significant partnership opportunities in<br />
licensing at the late pre-clinical or early<br />
clinical stages.<br />
Research skill-sets:<br />
<strong>Glenmark</strong>'s senior scientists, responsible<br />
for directing its research programme,<br />
enjoy significant exposure, interest and<br />
experience in the selected areas for NCE<br />
focus. To reinforce their effort, the<br />
Company has appointed an advisory<br />
board of eminent scientists, who have<br />
experience in the molecular targets<br />
selected for research.<br />
Progress in NCE R&D<br />
Asthma/COPD<br />
Incidence<br />
Asthma, a chronic debilitating disease<br />
characterised by 'airway hyperactivity'<br />
and inflammation, has an expeditious<br />
growth rate worldwide with the existing<br />
medications unable to meet the<br />
increasing needs and incidence. The<br />
disease, affecting more than 23 million<br />
people in the U.S., is the sixth most<br />
common chronic condition overall. The<br />
chronic nature of the ailment requires<br />
therapy over a long period, sometimes<br />
spanning the patient's lifetime. Asthma<br />
is responsible for approximately 5,000<br />
deaths per year. The global market for<br />
asthma medication is estimated at USD<br />
8-12 billion.<br />
Treatment and Role of PDE-4<br />
Inhibitors<br />
Current medications include inhaled<br />
beta- agonists, bronchial steroids and<br />
anti-leukotriene antagonists. They aim<br />
to treat asthma by producing antiinflammatory<br />
and/or broncho-dialatory<br />
effect. However, none of them are able<br />
to effectively control the disease and<br />
some of the treatments, such as steroids,<br />
have potential side-effects.<br />
Research on PDE-4 inhibitors has been<br />
initiated over the last ten years. This<br />
research aims at developing<br />
compounds that selectively inhibit<br />
Phospodiesterase Enzyme [PDE-4], an<br />
enzyme that catalyses metabolism of<br />
cyclic-AMP [cAMP], a secondary<br />
messenger in cellular functions.<br />
Elevation of intracellular cAMP levels is<br />
known to have both broncho-dialatory<br />
and anti-inflammatory activities. Hence,<br />
selective PDE-4 inhibitors present an<br />
attractive alternative for asthma therapy.<br />
While several PDE-4 inhibitors have<br />
entered clinical trials in the past, most of<br />
them have exhibited dose limiting sideeffects<br />
that range from the most<br />
common issue of emesis/nausea to<br />
cardiac toxicity. Even the most<br />
advanced PDE-4 inhibitor, Roflumilast<br />
from Altana which is completing Phase<br />
III development in Europe is reported to<br />
have shown emetic side-effects at<br />
elevated dosages. Hence, though the<br />
drug candidate appears promising, the<br />
need and search for safer medication is<br />
far from complete.<br />
GRC 3886<br />
<strong>Glenmark</strong> has been studying PDE-4
<strong>Glenmark</strong> Pharmaceuticals Limited<br />
NCE Programmes in Pre-clinical and Clinical Development<br />
Target Lead Therapeutic Area Status<br />
PDE-4 GRC 3886 Asthma / COPD Completed Phase I in UK<br />
Exhibited excellent safety profile<br />
Sep '04: Licensed to Forest Labs for North America<br />
Apr '05: Licensed to Teijin Pharma for Japan<br />
Phase II to commence in the US in early 2006.<br />
In process of identifying collaboration partner for Europe<br />
<strong>Glenmark</strong> to retain marketing rights to rest of the world<br />
DPP-IV GRC 8200 Diabetes In pre-clinical testing<br />
Long acting, oral, once-daily drug; promising results<br />
in pre-clinical testing<br />
Could be filed for Phase I in Q2 FY 2006<br />
PDE-4 Not disclosed CNS [Alzheimer's Disease,<br />
inhibitors for over three years. The<br />
research has delivered a very promising<br />
lead candidate GRC 3886, a highly<br />
selective PDE-4 inhibitor with no emetic<br />
side-effects demonstrated in animal<br />
models. It has excellent in-vitro and invivo<br />
pharmacological activity against<br />
the target. As per the pre-clinical<br />
studies conducted by <strong>Glenmark</strong>, GRC<br />
3886 has also shown equivalent activity<br />
to that of Roflumilast. Based on its high<br />
selectivity, low side-effect profile and<br />
favourable pharmaco-kinetic profile, the<br />
molecule was selected as a lead<br />
candidate for clinical development.<br />
The compound recently completed<br />
Phase I clinical trials in UK [conducted<br />
by Quintiles]. Early results of Phase I<br />
studies have demonstrated that GRC<br />
3886 is well tolerated with predictable<br />
pharmaco-kinetics in human volunteers.<br />
The molecule is non-emetic and does<br />
not display cardiovascular effects at the<br />
highest doses tested in the study. An<br />
exhibited long half-life suggests the<br />
possibility of a once-daily-dosing<br />
regimen. An ex-vivo experiment<br />
conducted to study LPS-induced TNFalpha<br />
reduction in human whole blood<br />
demonstrated that after dosing with<br />
GRC 3886, TNF-alpha levels were<br />
Cognitive Disorders, etc.]<br />
PDE-4 Not disclosed Other topical inflammatory<br />
indications such as Atopic<br />
Dermatitis and Uveitis<br />
In pre-clinical testing<br />
decreased to a significant level<br />
compared to subjects given placebo<br />
treatment. The inhibition of TNF-alpha is<br />
a surrogate marker indicating a high<br />
likelihood of efficacy in subsequent<br />
human trials. It also implies the<br />
potential use of the compound to treat<br />
rheumatoid arthritis [RA]. Animal<br />
models to test the efficacy of the<br />
compound for RA are currently<br />
underway. The compound is expected<br />
to enter Phase II trials in the US for<br />
asthma/COPD indications in the early<br />
part of calendar 2006.<br />
As per its policy of licensing out<br />
compounds to partners for regulated<br />
markets, <strong>Glenmark</strong>, through its whollyowned<br />
Swiss subsidiary, <strong>Glenmark</strong><br />
Pharmaceutical S.A. [GPSA], has already<br />
concluded a deal with Forest<br />
Laboratories, USA for development and<br />
commercialisation of GRC 3886 for the<br />
North American market. This has been a<br />
landmark deal for <strong>Glenmark</strong> and India,<br />
involving milestone payments<br />
cumulating up to USD 190 million by<br />
the time the molecule is<br />
commercialised. Of this <strong>Glenmark</strong> has<br />
already received USD 20 mn and<br />
expects to receive another USD 30<br />
million by the time Phase II commences.<br />
One of these is expected to enter Phase I by end FY 2006<br />
Forest will be responsible for<br />
conducting all trials beyond Phase I<br />
clinical trials and for commercialising<br />
and marketing the compound in North<br />
America.<br />
Following this, <strong>Glenmark</strong> closed a deal<br />
for GRC 3886 for the Japanese territory<br />
with Teijin Pharma Limited in early FY<br />
2006 for a cumulative value of USD 53<br />
million. As per this agreement, Teijin has<br />
the exclusive right to develop, register<br />
and commercialise the molecule for all<br />
potential indications for which the<br />
product might receive approval in the<br />
Japanese market. <strong>Glenmark</strong> will receive<br />
milestone payments on the successful<br />
completion of each stage in addition to<br />
annual sums that are marginally higher<br />
than the first quartile of net sales of the<br />
product in Japan, towards supply of the<br />
Active Pharmaceutical Ingredient [API]<br />
and royalties.<br />
<strong>Glenmark</strong> intends to partner out rights<br />
to Europe to collaborators during the<br />
course of FY 2006. The Company will<br />
retain rights to other markets across the<br />
continents of Asia, Africa, CIS and Latin<br />
America and will commercialise the<br />
molecule in these markets on its own.<br />
33<br />
<strong>Annual</strong> <strong>Report</strong> 2004-2005
Diabetes/Obesity<br />
Incidence<br />
Globally, Diabetes Mellitus, or Type II<br />
Diabetes as it is better known, is one of<br />
the most common chronic diseases. The<br />
'Metabolic Syndrome' of the disease<br />
includes obesity, hypertension, hyperlipidemia<br />
and cardiovascular diseases.<br />
Presently diabetes causes significant<br />
morbidity and mortality due to longterm<br />
micro and macro vascular<br />
complications. At current estimates, the<br />
global prevalence of Type II Diabetes<br />
will double from 171 million patients in<br />
2000 to 334 million patients in 2025.<br />
The existing incidence of Type II<br />
Diabetes in US is estimated to be 7<br />
percent of the population. Spend on<br />
related treatment accounts for as much<br />
as 10 percent of all healthcare dollars in<br />
the US. Furthermore, the incidence of<br />
Type II Diabetes is increasing globally at<br />
a rapid rate especially in Africa, South<br />
America and Asia leading to the disease<br />
now being considered a worldwide<br />
'epidemic'.<br />
of Diabetes-estimates for the year 2000<br />
and projections for 2030; Diabetes Care;<br />
27:1047-1053] The country's<br />
environmental and genetic factors,<br />
influenced by the changing<br />
socioeconomic scenario, have made an<br />
increasing number of Indians<br />
susceptible to this deadly epidemic.<br />
Based on recent epidemiological data,<br />
the growth rate of Type II Diabetes is<br />
estimated to be 12-16 percent in India,<br />
which is much higher than the global<br />
rate.<br />
Treatment and DPP-IV<br />
Type II Diabetes is associated with<br />
insulin resistance in peripheral tissues<br />
such as muscles and fat, impaired<br />
glucose-stimulated insulin secretion<br />
from pancreatic beta-cells and elevated<br />
hepatic gluconeogenesis. Though<br />
certain drugs are available to treat the<br />
pathological conditions associated with<br />
Type II Diabetes, current<br />
pharmacotherapy does not adequately<br />
address the metabolic defects<br />
underlying this disease.<br />
has established proof of concept and is<br />
currently being pursued by various<br />
multinational pharmaceutical majors<br />
including Merck, Novartis, Glaxo and<br />
Bristol-Myers Squibb, which have<br />
compounds at different stages in clinical<br />
development.<br />
GRC 8200<br />
<strong>Glenmark</strong> has discovered a lead<br />
compound GRC 8200, a potent, specific<br />
and orally bio-available inhibitor of the<br />
human DPP-IV enzyme. The compound<br />
is currently undergoing pre-clinical<br />
studies being coordinated by<br />
<strong>Glenmark</strong>'s wholly-owned Swiss<br />
subsidiary, GPSA, and has shown a<br />
selectivity in animal models that is many<br />
times greater than the comparable DPP-<br />
IV inhibitors in clinical development.<br />
<strong>Glenmark</strong> expects to commence Phase I<br />
studies on GRC 8200 in the second<br />
quarter of FY 2006. The research centre<br />
plans to communicate the pre-clinical<br />
profiles of this lead molecule at the<br />
following world scientific fora:<br />
India leads the top 10 countries<br />
estimated to have the highest number<br />
of people with diabetes in 2000 and<br />
2030, with China and the US following<br />
closely. It is predicted that the projected<br />
number of cases of diabetes in India will<br />
more than double from 31.7 million in<br />
2000 to 79.4 million in 2030. [Source:<br />
Wild S., Roglic G. et al; Global Prevalence<br />
<strong>Glenmark</strong> Research Centre has been<br />
working on the Dipeptidylpeptidase-IV<br />
[DPP-IV] target associated with glucosedependent<br />
insulin secretion and<br />
peripheral insulin resistance. This target<br />
was selected because it contributes<br />
alternative pharmacological approaches<br />
to treat the distinct deficits existing in<br />
the therapy of Type II Diabetes. DPP-IV<br />
4th International Metabolic Diseases<br />
Drug Discovery World Summit<br />
held in April 2005 at San Diego,<br />
California, USA<br />
2nd International Conference on<br />
Dipeptidylaminopeptidases Basic<br />
Science and Clinical Applications held in<br />
April 2005 at Magdeburg, Germany.<br />
65th Scientific Session of American
<strong>Glenmark</strong> Pharmaceuticals Limited<br />
Diabetes Association to be held in June<br />
2005 at San Diego, California, USA.<br />
41st <strong>Annual</strong> Meeting of EASD<br />
[European Association for Study of<br />
Diabetes] to be held in September 2005<br />
at Athens, Greece.<br />
Other inflammatory<br />
conditions<br />
As mentioned earlier, <strong>Glenmark</strong> has<br />
been working on the PDE-4 target for<br />
the past three years. This has led to the<br />
creation of a library of compounds and<br />
novel structures while discovering and<br />
developing GRC 3886. This library of<br />
compounds is of immense potential<br />
since PDE-4 iso-enzymes are expressed<br />
very early in the inflammatory pathway<br />
in different organ systems of the human<br />
body.<br />
<strong>Glenmark</strong> has now commenced work<br />
on other inflammatory conditions as<br />
represented in the table on the previous<br />
page. Apart from GRC 3886 which is<br />
being studied for the RA indication, two<br />
of the programmes have molecules in<br />
pre-clinical studies and <strong>Glenmark</strong> is<br />
working to have lead compounds from<br />
these programmes in Phase I clinical<br />
trials by the end of FY 2006.<br />
Risk management in NCE<br />
research<br />
Risk management of the NCE research<br />
initiative operates at two levels within<br />
<strong>Glenmark</strong>.<br />
Firstly, the Company has selected a mix<br />
of targets for drug development in the<br />
areas of inflammation and metabolic<br />
disorders. The focus is on targets that<br />
are validated in pre-clinical and clinical<br />
research. This will help reduce the<br />
probability of failure of such leads<br />
compared to those developed for early<br />
stage targets. In addition, working on<br />
several targets in parallel will insulate<br />
the pipeline from failure in any one<br />
programme.<br />
Secondly, despite having promising lead<br />
compounds in any area, the <strong>Glenmark</strong><br />
research team continues to identify<br />
backup molecules through parallel<br />
research initiatives. This risk-mitigating<br />
strategy is important till such time the<br />
drug candidates advance to late clinical<br />
trials.<br />
These initiatives will help the Company<br />
rapidly scale up the number of lead<br />
compounds in clinical trials in a<br />
relatively short period of time, allowing<br />
diversification of risk of failure.<br />
Novel Drug Delivery<br />
Systems [NDDS]<br />
NDDS products offer a technological<br />
advantage over simple existing<br />
therapeutic solutions. These products<br />
achieve their desired effects by altering<br />
the availability, release and safety<br />
profiles of the drug. Even though the<br />
risk profile and the cost of development<br />
are less than that of NCEs, these<br />
products play an important role in the<br />
post-GATT era as they require a new<br />
drug application process and are<br />
protected through longer patent<br />
exclusivity periods. NDDS provide<br />
pharmaceutical companies with a<br />
pipeline of products that can be<br />
marketed at a premium over simple<br />
therapies or generic products.<br />
<strong>Glenmark</strong>'s NDDS R&D highlights<br />
Historically, <strong>Glenmark</strong> has encouraged<br />
developing patentable technologies,<br />
specifically related to drug delivery in<br />
the human body and adaptable to its<br />
oral and dermal range of products. The<br />
rationale being to integrate a generic<br />
drug with a patent-protected delivery<br />
system in order to counter declines in<br />
margins and realisations that generics<br />
usually face. Additionally, NDDS also<br />
helps in positioning the Company as a<br />
speciality organisation in domestic and<br />
international markets.<br />
<strong>Glenmark</strong> continues to develop<br />
patentable technologies and its efforts<br />
have resulted in several patents<br />
spanning areas such as controlled<br />
release and matrix technologies. It now<br />
plans to advance six sustained release<br />
products in the near future.<br />
Infrastructure and Skill<br />
Assets<br />
The <strong>Glenmark</strong> Research Centre employs<br />
315 scientific staff engaged in drug<br />
discovery, drug delivery systems, process<br />
development and analytical research.<br />
This team of talented and dedicated<br />
scientists includes 35 PhDs, several of<br />
them with post-doctoral experience<br />
from universities in the US and Europe.<br />
The individual research divisions are<br />
headed by people with rich experience<br />
in their respective research areas.<br />
<strong>Glenmark</strong> has made adequate<br />
investments in equipping its research<br />
team with requisite modern scientific<br />
equipment, which is at par with any<br />
international research facility, to carry<br />
out drug discovery and development as<br />
per national / international standards<br />
and regulations, which include:<br />
<br />
<br />
<br />
<br />
<br />
<br />
<br />
Liquid Chromatography / Mass<br />
Spectrometer [LC / MS]<br />
Nuclear Magnetic Resonance<br />
Spectrometer [NMR]<br />
43 HPLCs equipped with variety of<br />
detection systems<br />
Fluid Bed Dryer-GLATT<br />
Formulation equipment for lab-scale<br />
development<br />
Gas Chromatographs and other<br />
analytical equipment<br />
X-ray Diffractometer, FTIR, Elemental<br />
Analyzer and DSC<br />
These scientists also represent <strong>Glenmark</strong><br />
Research Centre in various national /<br />
international seminars and meetings to<br />
present the results of their in-house<br />
research efforts [please refer to the<br />
section on 'Progress in NCE R&D].<br />
Moreover, results of their research<br />
activities are also published in peerreviewed<br />
international journals on a<br />
continuous basis.<br />
35<br />
<strong>Annual</strong> <strong>Report</strong> 2004-2005
Global Management Team<br />
Name<br />
Glenn Saldanha<br />
Responsibility<br />
Managing Director & CEO<br />
A. S. Mohanty Director - Domestic Formulations<br />
Rajesh Desai<br />
Cheryl Pinto<br />
Dr. V. Swaroop<br />
Terrance Coughlin<br />
Ailton Wiliczinski<br />
Director - Finance, IT & Legal<br />
Director - Corporate Affairs<br />
Head - New Drug Discovery<br />
President - US Operations & Head - API Sales<br />
CEO - Brazil Subsidiary<br />
36<br />
K. Anand Sr. Vice President - Regulatory Affairs & QA<br />
Avadhut Sukhtankar<br />
Sr. Vice President - Operations<br />
Vithal Dhamankar<br />
Arun Narayan<br />
Dr. Vijay Soni<br />
Alind Sharma<br />
Vice President - Semi Regulated Markets [Formulations]<br />
Executive Vice President - EU Business<br />
Global Head - IPM<br />
Vice President - Human Resources
Management's Discussion and Analysis<br />
Industry Structure<br />
Presently, the IPM's contribution to<br />
the global drug industry is<br />
sizeable in terms of volume [8<br />
percent]; yet its corresponding value<br />
share is very restricted at 1percent.<br />
However, with the advent of the GATT<br />
regime and the new Indian Patents Act<br />
coming into force, the outlook for<br />
growth is optimistic. In view of the<br />
current trends, it is predicted that the<br />
market will grow at a constant CARG of<br />
8 to 10 percent, taking the IPM from<br />
USD 4.6 billion in 2004 to USD 7.8 billion<br />
in 2008.<br />
The IPM has also been characterised by:<br />
A need for product patent<br />
recognition, which served as an entry<br />
impediment for large global players.<br />
Domination by local companies [77<br />
percent] which have shown twice as<br />
much growth as that of their global<br />
counterparts in the country.<br />
High price-sensitivity with the<br />
government playing a role of<br />
moderator.<br />
Fragmented market-place, which has<br />
moved towards consolidation especially<br />
in light of the new patent act.<br />
A nascent health insurance sector<br />
where an overwhelming majority of<br />
people cannot afford insurance.<br />
Shift in the growth of therapy areas.<br />
While acute illnesses still dominate, the<br />
growth rate of chronic illnesses has<br />
more than doubled in comparison.<br />
Within the chronic category,<br />
cardiovascular and diabetes segments<br />
have demonstrated the fastest growth.<br />
The upcoming implementation of the<br />
VAT has raised issues of apprehension<br />
amongst stockists and wholesalers,<br />
signalling a possible negative impact in<br />
the initial stages.<br />
Operational Overview<br />
<strong>Glenmark</strong> constantly reviews its<br />
product-market portfolio with a view to<br />
strengthen sustainable growth. To drive<br />
fiscal growth, the Company continued<br />
to focus on the following areas<br />
internally:<br />
Investing in revenue generating<br />
assets<br />
Building a stronger manufacturing<br />
and supply chain management<br />
Creating a superior system to improve<br />
the information quality available to the<br />
management<br />
In the five years leading to the post-<br />
GATT era, <strong>Glenmark</strong> has worked towards<br />
strengthening its competitive status by<br />
investing in long-term value assets.<br />
Work on the formulations plant in Goa,<br />
which was commissioned last year, was<br />
completed while construction on the<br />
plant in Baddi, Himachal Pradesh<br />
commenced this year. While Goa has<br />
been built according to US FDA<br />
specifications to service the regulated<br />
markets, Baddi will primarily cater to the<br />
demands of the domestic formulations<br />
market as well as select semi-regulated<br />
markets.<br />
Likewise, research continues to remain<br />
an area of focus and the beneficiary of<br />
substantial investments. Similarly,<br />
manufacturing facilities across the<br />
country have been upgraded or<br />
expanded to efficiently meet the<br />
anticipated demands. Vendor<br />
management is another area that<br />
receives continual attention to garner<br />
enhanced service and economical costs.<br />
To ensure superior control of operations,<br />
the Company has instituted a topquality<br />
managerial and executive<br />
information system, which has started<br />
delivering the desired results and<br />
consequently, the Company has been<br />
able to better monitor its operations<br />
and costs.<br />
The above initiatives have resulted in<br />
greater operating margins in 2004-05<br />
[21.10 percent] over 2003-04 [18.52<br />
percent].<br />
37<br />
<strong>Annual</strong> <strong>Report</strong> 2004-2005
38<br />
Revenues<br />
<strong>Glenmark</strong>'s turnover for 2004-05 for its<br />
India operations was Rs. 5364.31 million<br />
compared to Rs. 3806.61 million in 2003-<br />
04, resulting in an increase of 40.92<br />
percent, with each of its business<br />
segments making their contribution.<br />
Domestic Formulations<br />
Despite stiff competition and realisation<br />
declines, this business segment<br />
remained a strong contributor and<br />
added Rs. 3027.74 million in 2004-05,<br />
4.69 percent over that in 2003-04 [Rs.<br />
2892.00 million]. This was largely aided<br />
by strong performances by flagship<br />
brands, new product introductions and<br />
effective marketing activities.<br />
Exports<br />
Revenue from the export of branded<br />
formulations, API, sale of molecules, etc.<br />
to overseas markets added Rs. 1623.08<br />
million to the revenues in 2004-05 [Rs.<br />
469.28 million in 2003-04].<br />
International Subsidiaries<br />
Klinger Laboratories, a wholly-owned<br />
subsidiary of <strong>Glenmark</strong> in Brazil, has<br />
achieved in its first year of operation<br />
sales revenue of Rs. 236.76 million and<br />
has also filed 3 formulation dossiers for<br />
ANVISA approval. This was<br />
supplemented by the purchase of a<br />
leading contraceptive brand, Uno-Ciclo,<br />
from Instituto Biochimico for USD 4.6<br />
million for the Brazilian market.<br />
The wholly-owned subsidiary, <strong>Glenmark</strong><br />
Philippines, has achieved revenues of Rs.<br />
8.25 million in its first year of operations.<br />
<strong>Glenmark</strong> Pharmaceuticals SA<br />
[Switzerland], a wholly-owned<br />
subsidiary of <strong>Glenmark</strong> incorporated<br />
during the year, has earned revenues of<br />
Rs. 899.95 million for out-licensing the<br />
Company's lead molecule, GRC 3886 to<br />
Forest Laboratories, Inc. USA.<br />
The Company also inaugurated its<br />
marketing and sales' front-end in North<br />
America by entering into two inlicensing<br />
agreements with US<br />
manufacturing companies, thereby<br />
achieving small revenues of Rs. 13.08<br />
million. At the same time, efforts to set<br />
up the front-end for the UK subsidiary<br />
continued; this Subsidiary will function<br />
as a hub for Company's activities in the<br />
UK and the European Union.<br />
India API and Co-Marketing<br />
The API and co-marketing division<br />
showed an increase of 60.22 percent by<br />
recording revenues of Rs. 713.49 million<br />
in 2004-05 from sales to customers in<br />
India, compared to Rs. 445.32 million in<br />
2003-04. This was in addition to<br />
providing for a part of the captive<br />
requirement for bulk actives from the<br />
Company's formulation division.<br />
Cost of Sales<br />
The cost of sales showed a marginal<br />
increase from 47.11percent in 2003-04<br />
to 48.80 percent in 2004-05 mainly on<br />
account of a general decline in the<br />
realisations of bulk actives and<br />
increased competition in the domestic<br />
market.<br />
Selling and Operating<br />
Expenses<br />
Selling and operating expenses were Rs.<br />
1289.27 million in 2004-05, an increase<br />
of 21.60 percent against Rs. 1060.26<br />
million in 2003-04. Selling and<br />
operating expenses as a percentage of<br />
sales in 2004-05 were 24.03 percent<br />
compared with 27.85 percent in 2003-<br />
04, a decline of 3.82 percent.<br />
Promotional costs, including incentives<br />
and commission, increased by 29.12<br />
percent compared to the previous year<br />
mainly towards achieving the targeted<br />
revenue growth.<br />
Salary, travelling and welfare expenses<br />
increased by 25.01 percent compared to<br />
the previous year on account of<br />
recruitments and revisions to support<br />
expansion in the manufacturing and<br />
marketing activities.<br />
Freight and distribution costs increased<br />
by 39.01 percent compared to the<br />
previous year due to an increase in sales<br />
by 40.92 percent.<br />
The other expenses including<br />
administrative costs like telephone, rates<br />
and taxes, insurance, etc. have shown a<br />
marginal increase of 5.59 percent due to<br />
a rise in the overall activities.<br />
Depreciation<br />
The provision for depreciation was Rs.<br />
149.84 million in 2004-05 compared<br />
with Rs. 108.89 million in 2003-04. This<br />
rise is mainly due to the increase in fixed<br />
assets of the Company.<br />
Interest<br />
The expenditure on account of interest<br />
was Rs. 167.31 million in 2004-05<br />
compared with Rs. 100.58 million in<br />
2003-04. The interest expenditure<br />
increased due to increase in the<br />
borrowing during the year whilst<br />
implementing various capital-intensive<br />
projects as well as increase in the<br />
working capital requirements for the<br />
business.
<strong>Glenmark</strong> Pharmaceuticals Limited<br />
Figures in Rs. /Mn.<br />
Head 2004-05 2003-04 2002-03 2001-02 2000-01<br />
Interest 167.31 100.58 106.88 129.13 83.23<br />
EBITDA 1186.50 734.89 645.43 502.13 320.33<br />
Interest cover [times] 7.09 7.31 6.04 3.89 3.85<br />
Research and Development<br />
Expenses<br />
The Research and Development<br />
expenditure was Rs. 325.82 million in<br />
2004-05 compared with Rs. 248.07<br />
million in 2003-04, a rise of 31.34<br />
percent. The R&D revenue expenditure<br />
was 6.07 percent of the turnover in<br />
2004-05 compared with 6.52% in 2003-<br />
04. The increase was in line with the<br />
growth of the R&D staff strength and<br />
increase in research activity. The<br />
detailed break up of the R&D<br />
expenditure is as below:<br />
Figures in Rs. /Mn.<br />
Head March 2005 March 2004<br />
Salaries and other benefits 124.77 78.48<br />
Chemicals and consumables 85.64 80.56<br />
Other expenses 115.41 89.03<br />
325.82 248.07<br />
Provision for Taxation<br />
The taxation charge for the financial<br />
year 2004-05 was Rs. 143.28 million<br />
compared with Rs. 90.30 million in 2003-<br />
04.<br />
Provision for Deferred<br />
Taxation<br />
A provision for deferred tax of Rs. 91.27<br />
million was made as per Accounting<br />
Standard 22 'Accounting for Taxes on<br />
Income' issued by the Institute of<br />
Chartered Accountants of India. The<br />
deferred tax provision for the future tax<br />
consequences was attributable to<br />
timing differences between the financial<br />
statement, determination of income,<br />
and its recognition for tax purposes.<br />
Dividend<br />
The Company paid an interim dividend<br />
of 35 percent on the enhanced equity<br />
capital after issue of bonus shares of 1:1<br />
for 2004-05 and a dividend of 7 percent<br />
on preference shares.<br />
Equity Capital<br />
The equity capital has been increased<br />
from Rs.118.49 million in 2003-04 to Rs.<br />
237.24 million in FY 2004-05 due to<br />
allotment of 59,310,570 equity shares of<br />
Rs. 2.00 each by way of bonus shares<br />
and conversion of 65,000 stock options<br />
into equity shares of Rs. 2.00 each.<br />
Preference Shares<br />
The Company has redeemed 1,000,000<br />
preference shares of Rs. 100.00 each<br />
issued to UTI Bank Ltd. and issued<br />
2,000,000, 7 percent preference shares<br />
of Rs. 100.00 each to IDBI Bank.<br />
Securities Premium Account<br />
Securities premium account has been<br />
decreased to Rs. 758.69 million from Rs.<br />
991.97 million mainly due to debit of<br />
the FCCB issue expenses and<br />
redemption premium of Rs. 116.92<br />
million and issue of bonus shares of Rs.<br />
118.62 million.<br />
General Reserves<br />
The general reserves increased from Rs.<br />
610.77 million to Rs. 705.69 million due<br />
to transfer of Rs. 65 million from the<br />
Profit & Loss Account and Rs. 29.92<br />
million from Debenture Redemption<br />
Reserves Account.<br />
Profit and Loss Account<br />
The balance of Profit and Loss Account<br />
has been increased from Rs. 496.94<br />
million to Rs. 964.08 million on account<br />
of the profit earned during the year.<br />
39<br />
<strong>Annual</strong> <strong>Report</strong> 2004-2005
40<br />
Secured Loans<br />
Secured loans increased to Rs. 1293.03<br />
million in 2004-05 compared with Rs.<br />
1029.43 million in 2003-04. The other<br />
major component of the secured loan<br />
was the Term Loans from State Bank of<br />
India, State Bank of Patiala and IDBI<br />
Bank, which were secured by<br />
mortgaging the land, building,<br />
equipment and machinery at<br />
Ankleshwar, Mahape and Goa.<br />
Unsecured Loans<br />
Unsecured loans increased to Rs.<br />
3080.58 million in 2004-05 compared<br />
with Rs. 119.31 million in 2003-04 due<br />
to the issue of:<br />
i) 20,000 Zero Coupon Foreign<br />
Currency Convertible Bonds of USD<br />
1,000 each [Rs. 873.20 million at issue]<br />
convertible at the option of the<br />
bondholder at any time on or after 28th<br />
March 2005 but prior to the close of<br />
business on 2nd January 2010 at a fixed<br />
exchange rate of Rs. 43.66 per 1 USD<br />
and price of Rs. 862.394 per share of par<br />
value of Rs. 2.00 per share subject to<br />
adjustment in certain events, i.e. issue of<br />
bonus shares, division, consolidation,<br />
reclassification of shares etc. and<br />
redeemable on maturity date on 16th<br />
February 2010 at 133.74 percent of its<br />
principal amount if not redeemed or<br />
converted earlier. The redemption<br />
premium of 33.74 percent payable on<br />
maturity of the bond, if there is no<br />
conversion of the bond, to be debited to<br />
Securities Premium account evenly over<br />
the period of 5 years from the date of<br />
issue of bonds and<br />
ii) 50,000 Zero Coupon Foreign Currency<br />
Convertible Bonds of USD 1,000 each<br />
[Rs. 2183.00 million at issue] convertible<br />
at the option of the bondholder at any<br />
time on or after 15th November 2006<br />
but prior to the close of business on 2nd<br />
January 2010 at a fixed exchange rate of<br />
Rs. 43.66 per 1 USD and the price<br />
greater of 35 percent of the average of<br />
the order book volume-weightedaverage-price<br />
of a share on each Trading<br />
Day during the period commencing on<br />
15th September and ending on 14th<br />
November 2006 and the Floor Price [Rs.<br />
500.00] of par value of Rs. 2.00 per share,<br />
and redeemable in whole but not in<br />
part at the option of the company on or<br />
after 15th February 2009, if closing price<br />
of the share for each of the 25<br />
consecutive trading days immediately<br />
prior to the date upon which notice of<br />
such redemption is given was at least<br />
130 percent of the applicable Early<br />
Redemption Amount divided by the<br />
conversion ratio and redeemable on<br />
maturity date on 16th February 2010 at<br />
134.07 percent of its principal amount if<br />
not redeemed or converted earlier. The<br />
redemption premium of 34.07 percent<br />
payable on maturity of the bond, if there<br />
is no conversion of the bond, to be<br />
debited to Securities Premium account<br />
evenly over the period of 5 years from<br />
the date of issue of bonds.<br />
Fixed Assets<br />
The Company's gross asset block<br />
increased from Rs. 1723.53 million as at<br />
31st March 2004 to Rs. 2586.23 million<br />
as at 31st March 2005 on account of<br />
modernisation of the plants at Nasik,<br />
Kurkumbh, Mohol and Ankleshwar,<br />
capitalisation of the Goa plant and<br />
additions made in the R&D division.<br />
Capital work-in-progress and capital<br />
advances worth Rs. 129.05 million were<br />
made towards the Baddi, Mohol and<br />
Goa plants.<br />
Investment<br />
Investments declined from Rs. 299.37<br />
million in 2003-04 to Rs. 264.56 million<br />
in 2004-05. The Company's investment<br />
in its wholly-owned subsidiaries,<br />
<strong>Glenmark</strong> Pharmaceuticals Inc., USA and<br />
<strong>Glenmark</strong> Farmacêutica Ltda., Brazil<br />
have been transferred to <strong>Glenmark</strong><br />
Pharmaceuticals SA, Switzerland a<br />
wholly-owned subsidiary of the<br />
Company.<br />
Inventory<br />
Materials inventory increased from Rs.<br />
310.10 million in 2003-04 to Rs. 360.36<br />
million in 2004-05, mainly to service a<br />
larger product basket for the domestic,<br />
export and API businesses. Finished<br />
goods and work-in-process inventory<br />
increased from Rs. 508.93 million in<br />
2003-04 to Rs. 746.56 million in 2004-05<br />
largely due to changes in the indirect<br />
taxation, i.e. MRP-based Excise and VAT<br />
implementation.<br />
Receivables<br />
Receivables increased from Rs. 1304.81<br />
million in 2003-04 to Rs. 1821.05 million<br />
in 2004-05.<br />
Loans and Advances<br />
Loans and advances increased from Rs.<br />
392.54 million in 2003-04 to Rs. 1871.87<br />
million in 2004-05 primarily on account<br />
of advances of Rs. 1324.05 million to the<br />
wholly-owned subsidiary, <strong>Glenmark</strong><br />
Pharmaceuticals SA, Switzerland.<br />
Cash and Bank Balance<br />
Cash and bank balance increased to Rs.<br />
1092.79 million from Rs. 67.69 million<br />
mainly due to short term deposits of the<br />
FCCB issue proceeds.<br />
Current Liabilities<br />
Current liabilities and provisions<br />
increased from Rs. 745.12 million in<br />
2003-04 to Rs. 781.43 million in 2004-05.
<strong>Glenmark</strong> Pharmaceuticals Limited<br />
Figures in Rs. /Mn.<br />
Head March 2005 March 2004<br />
Creditors 556.23 464.60<br />
Other Liabilities 130.52 192.29<br />
Dividend and Dividend Tax 94.68 88.23<br />
781.43 745.12<br />
Net Working Capital<br />
The net working capital has increased<br />
from Rs. 1841.53 million to Rs. 5114.87<br />
million due to an increase in the<br />
receivables by Rs. 516.23 million, cash<br />
and bank balance by Rs. 1025.10 million,<br />
and loans and advances by Rs. 1479.33<br />
million.<br />
Opportunities<br />
Low per capita expenditure on<br />
pharmaceuticals<br />
India has one of the lowest per capita<br />
health care expenditures in the world,<br />
which is likely to correct over the<br />
coming years. For instance, India's per<br />
capita expenditure on pharmaceuticals<br />
is only USD 4, well below USA [USD<br />
1992], Canada [USD 1483], Germany<br />
[USD 1819] and United Kingdom [USD<br />
1415].<br />
Privatisation of insurance<br />
Presently, only two million Indians - 0.2<br />
percent of the population - are<br />
medically insured even as a recent study<br />
indicates that 75 percent are potentially<br />
insurable. Insurance companies have<br />
estimated that household healthcare<br />
spending will rise from 2 per cent to 6<br />
percent in the coming years, translating<br />
into attractive growth for India's<br />
pharmaceutical industry.<br />
Rising income levels<br />
Rising incomes and an increase in the<br />
geriatric population, sustained by<br />
advances in hygiene and medicine, are<br />
driving a shift in the market away from<br />
vitamins, anti-infectives and<br />
gastrointestinal treatments towards<br />
products that treat cardiovascular<br />
problems, central nervous system<br />
disorders, diabetes and other complex<br />
ailments. By 2010, cardiovascular and<br />
central nervous system treatments will<br />
account for a higher share of remedies<br />
provided. This is expected to result in a<br />
faster growth for companies like<br />
<strong>Glenmark</strong> that specialise in related<br />
niches.<br />
Rural opportunity<br />
Presently, 76 percent of the Indian<br />
pharmaceutical off-take transpires in<br />
urban centres. The four metros namely<br />
Delhi, Mumbai, Kolkata and Chennai<br />
account for about a fourth of the entire<br />
IPM. Within rural India, the market is<br />
concentrated in areas where the level of<br />
infrastructure development is relatively<br />
high. According to the World<br />
Development <strong>Report</strong> 2000, only 50<br />
percent of the population in India has<br />
access to healthcare facilities. In rural<br />
areas, this percentage is lower. As<br />
penetration levels improve, a broader<br />
growth for India's pharmaceutical<br />
industry is expected.<br />
Generics opportunity<br />
This has been discussed in detail earlier.<br />
Threats<br />
The implementation of GATT from 2005<br />
represents the biggest threat facing the<br />
IPI. India will recognise product patents,<br />
thus reducing process reverse<br />
engineering opportunities. Indian<br />
companies that have not prepared for<br />
this reality will face intense competition<br />
and perhaps even de-grow over the<br />
coming years.<br />
Outlook<br />
<strong>Glenmark</strong>'s short-term and long-term<br />
outlook appears encouraging for the<br />
following reasons:<br />
An integrated approach with a<br />
presence in R&D, bulk actives and<br />
formulations along with an increasing<br />
coverage of markets with its own sales<br />
force.<br />
A strong focus on establishing each<br />
element in its integrated chain as a<br />
revenue generator.<br />
A commitment to expand to new<br />
global markets with customised<br />
strategies.<br />
A horizontal and vertical expansion in<br />
therapeutic segments in all target<br />
markets.<br />
A reputation for being a first-mover in<br />
target markets and launching drugs in<br />
different therapeutic segments with low<br />
cycle times.<br />
An aggressive and adaptable<br />
marketing approach to widen its doctor<br />
reach, e.g. creation of 8 new divisions,<br />
each having its own marketing focus.<br />
A variety of investments ranging from<br />
upgrading manufacturing capabilities,<br />
understanding regulatory requirements,<br />
alliances, and building IPR assets, like<br />
new drugs and delivery systems for the<br />
future.<br />
Human Resources<br />
Development<br />
The successes and rate of expansion<br />
seen by <strong>Glenmark</strong> have raised unique<br />
challenges for the human resources (HR)<br />
function. The main among these are:<br />
Management of sourcing processes in<br />
countries of operation and the<br />
assimilation of the diverse work-force<br />
into a <strong>Glenmark</strong> work ethic. Additionally,<br />
the development of processes and<br />
systems that cater to a global audience.<br />
Continually adding to the skill<br />
inventory of the organization to help<br />
fuel its growth and value addition to<br />
41<br />
<strong>Annual</strong> <strong>Report</strong> 2004-2005
existing employees to keep them in<br />
tune with the increasing complexity of<br />
their job and ahead of competition.<br />
Identification, recruitment and<br />
retention of the best scientific talent to<br />
keep <strong>Glenmark</strong> at the cutting-edge of<br />
innovation.<br />
During the year under review, the<br />
Company embarked on several<br />
initiatives to ensure it kept pace with<br />
the demand on its people systems. A<br />
constant endeavour of the HR team was<br />
to partner with business by clearly<br />
understanding the business<br />
environment and company strategy.<br />
Bringing systemic maturity to the<br />
performance management system and<br />
the compensation process,<br />
development of need-based<br />
programmes for germination of leaders,<br />
broad-basing the reach of training and<br />
development processes, a well defined,<br />
data-backed process for talent<br />
acquisition, devising employee-friendly<br />
policies and ensuring compliance across<br />
all areas of operation were the main<br />
focus for the team during this year.<br />
Notable achievements include<br />
successful partnering with premier<br />
business schools across the country,<br />
strategic recruitment of key talent,<br />
optimal management of the Brazilian<br />
recruitment and facilitating a business<br />
focussed structure for the organisation.<br />
Regulatory Compliance<br />
Systems<br />
Since pharmaceutical products affect<br />
human lives directly, the corresponding<br />
raw material quality is stringently<br />
regulated by the health authorities of<br />
the various countries. These authorities<br />
govern each aspect of bringing a drug<br />
to the market; moreover, these<br />
regulatory agencies keep raising their<br />
quality benchmarks in response to<br />
consumer concerns. In view of this, a<br />
manufacturer seeking to serve these<br />
countries requires to invest in, closely<br />
track and comply with this evolving<br />
regulatory environment. Any delay in<br />
compliance could potentially lead to a<br />
staggered market entry and lost<br />
business opportunities.<br />
Over the years, <strong>Glenmark</strong> has built a<br />
dedicated Regulatory Affairs team<br />
engaged in tracking and building<br />
protocols to comply with the stringent<br />
regulatory requirements across<br />
geographies. It has also extended this<br />
ability into a confidence-building<br />
documentation system, which proves<br />
the quality of the Company's products<br />
as safe for consumption and customised<br />
to the precise requirements of these<br />
geographies. Recent sales to regulated<br />
markets like Canada as well as the rapid<br />
development of product dossiers for<br />
registration in the European Union and<br />
US are examples of how the Company<br />
has translated its capability into a<br />
growing market presence.<br />
The Company has also initiated several<br />
steps to make its plants ready for global<br />
inspections and certification by USF DA,<br />
MHRA [UK], MCC [South Africa], ANVISA<br />
[Brazil], etc.<br />
Internal Control and<br />
Systems<br />
<strong>Glenmark</strong>'s adequate controls cover a<br />
comprehensive definition of individual<br />
roles and responsibilities, an effective<br />
feedback flow to facilitate effective<br />
monitoring and a responsible internal<br />
audit process.<br />
Segmental Analysis<br />
<strong>Glenmark</strong> has only one segment,<br />
pharmaceuticals.<br />
Cautionary Statement<br />
Statements in the Management's<br />
Discussion and Analysis <strong>Report</strong><br />
describing the Company's objective,<br />
projections and estimates are forwardlooking<br />
statements and progressive<br />
within the meaning of applicable<br />
Security Laws and Regulations. Actual<br />
results may vary from those expressed<br />
or implied depending upon economic<br />
conditions, government policies and<br />
other incidental factors.
Risk Management<br />
Strategy Risk<br />
Astrategy that is not thought out<br />
in its entirety could result in<br />
serious losses for the Company.<br />
Risk management<br />
The senior management team driving<br />
<strong>Glenmark</strong>'s growth and development is<br />
backed by a rich industry experience. It<br />
is confident that its strategy, which has<br />
been tailored to cater to the new<br />
pharmaceutical era, will enable the<br />
Company to enhance shareholder value<br />
on a sustainable basis through a<br />
number of initiatives, viz.<br />
Emerge as a cost-effective, integrated<br />
manufacturer of products directed at<br />
the advanced markets in growing<br />
therapeutic areas.<br />
Carefully research its target markets<br />
and provide adequate support through<br />
significant alliances and acquisitions<br />
and a go-getting marketing team.<br />
Commission state-of-the-art plants<br />
that are built to meet important<br />
international regulatory approvals.<br />
License successful NCE products<br />
following early clinical trials, which result<br />
in a faster inflow of revenues.<br />
Expand the basket of NCEs in clinical<br />
trials.<br />
Business Portfolio Risk<br />
There is a risk of having too many<br />
business interests than what can be<br />
competently managed.<br />
Risk management<br />
<strong>Glenmark</strong>'s business mix has been<br />
judiciously selected keeping in mind the<br />
increasing pressures its domestic<br />
business currently faces, and is likely to<br />
encounter in the future. To respond to<br />
this impending impact, the Company<br />
has proactively strengthened and<br />
established leadership in key segments<br />
like dermatology and entered<br />
new/growing segments.<br />
Moreover, the decline in domestic<br />
revenues has been offset by the<br />
Company's growing presence in<br />
international markets. There, the<br />
Company has invested in forming<br />
competent local management teams<br />
43<br />
<strong>Annual</strong> <strong>Report</strong> 2004-2005
44<br />
who are geared to respond to and<br />
tackle their respective market<br />
requirements. Since these markets are a<br />
focus for development, they are backed<br />
by strong internal systems as well as<br />
adequate resources.<br />
Research Risk<br />
Original research is characterised by<br />
huge investments of time and money<br />
and compounded by an uncertainty of<br />
realisations. However, in the present<br />
scenario that respects product patents;<br />
original drug research assumes critical<br />
importance.<br />
Risk management<br />
<strong>Glenmark</strong> is balancing the risk involved<br />
in its drug discovery programme by<br />
taking a prudent approach:<br />
Selecting target segments after<br />
exhaustive research across the following<br />
parameters, viz. the existing and<br />
projected size of the therapeutic<br />
segment, prospective competition in an<br />
unprotected patent environment, the<br />
size of the potential demand as well as<br />
the scope latent in the products for<br />
attractive value-addition. Presently,<br />
<strong>Glenmark</strong> is conducting work in the<br />
asthma/COPD and diabetes/obesity<br />
segments.<br />
Working on parallel targets to<br />
maximise success prospects. The efforts<br />
of its talented NCE research team have<br />
delivered promising results in a short<br />
period with its lead molecule for asthma<br />
/COPD having successfully cleared the<br />
Phase I clinical trials and & a few others<br />
expected to move into the clinical trial<br />
stage in FY 2006. Another outcome of<br />
the Company's R&D initiative has been<br />
the development of several patentprotected<br />
platform technologies for<br />
Drug Delivery Systems, which will<br />
contribute strongly to future growth.<br />
Competition Risk<br />
Performing in a highly competitive<br />
arena like the Indian Pharmaceutical<br />
Market has its share of perils that could<br />
impact the Company's revenues and<br />
profits.<br />
Risk management<br />
Notwithstanding price fluctuations, the<br />
IPM holds tremendous potential in the<br />
long term. Here is why:<br />
Even though India has one of the<br />
lowest health spends in the world, with<br />
the imminent changes in urban<br />
lifestyles and increased spending power,<br />
it is expected that the Indian<br />
Pharmaceutical Industry's CAGR will also<br />
shift into a higher gear.<br />
With a rich human resource pool of<br />
technically qualified graduates, high<br />
skills in synthetic chemistry, expertise in<br />
product engineering and a low-cost<br />
manufacturing base, on one hand and<br />
with billions of dollars worth of<br />
products going off patent from 2005 on<br />
the other, India is poised to grow<br />
internationally as well.<br />
<strong>Glenmark</strong> will benefit by leveraging its<br />
local advantage and competing in the<br />
global generics markets, and thereby<br />
make up for any revenue dips in India.<br />
Currency Risk<br />
The Company hazards suffering losses<br />
arising from currency fluctuations.<br />
Risk management<br />
<strong>Glenmark</strong> has selectively circumvented<br />
its forex positions in order to limit the<br />
impact due to volatile forex movements<br />
and has supported it by instituting a<br />
competent forex management system.<br />
Environment Risk<br />
Effluents released by pharmaceutical<br />
companies could harm the environment<br />
if adequate pollution control measures<br />
are not observed.<br />
Risk management<br />
<strong>Glenmark</strong> is committed to managing its<br />
waste in a sound and responsible<br />
manner and adhering to norms<br />
stipulated by the regulatory authorities.<br />
This is reflected in its investments in<br />
world-class pollution-mitigating plants<br />
and practices, which have helped treat<br />
its solid, liquid and gaseous waste<br />
effectively.
Four year financial summary<br />
Balance Sheet (Rs. in ‘000)<br />
2001-02 2002-03 2003-04 2004-05<br />
Share Capital<br />
Equity capital 101,404 101,811 118,546 237,286<br />
Preference Capital 100,000 100,000 100,000 200,000<br />
Share Capital 201,404 201,811 218,546 437,286<br />
Total Reserve 1,081,872 1,323,944 2,132,109 2,429,774<br />
Capital & Reserve 1,283,276 1,525,755 2,350,655 2,867,060<br />
Secured Loans 697,711 1,193,564 1,029,429 1,293,032<br />
Unsecured Loans 73,385 53,864 119,314 3,080,580<br />
Total Loans 771,096 1,247,428 1,148,743 4,373,612<br />
Deferred Tax Liability 204,873 269,856 293,181 386,111<br />
Total 2,259,245 3,043,039 3,792,579 7,626,783<br />
Gross Block 1,416,755 1,246,518 1,723,534 2,586,231<br />
Less: Depreciation 175,581 243,340 346,864 493,221<br />
Net Block 1,241,174 1,003,178 1,376,670 2,093,010<br />
Capital work-in-progress 61,784 232,471 244,966 129,050<br />
Investments 26,158 161,126 299,647 264,564<br />
Current Assets<br />
Inventories 322,280 444,371 821,601 1,110,593<br />
Sundry Debtors 742,102 1,236,691 1,304,813 1,821,047<br />
Cash & Bank 45,342 40,518 67,694 1,092,793<br />
loans & Advances 246,545 502,704 392,263 1,871,872<br />
Total Current Assets 1,356,269 2,224,284 2,586,371 5,896,305<br />
Current Liabilities<br />
Sundry Creditors 191,620 325,585 371,758 485,817<br />
provisions 64,872 11,717 39,772 2,420<br />
Others 228,657 280,177 333,591 293,196<br />
Total Current Liabilities 485,149 617,479 745,121 781,433<br />
Net Current Assets (Working Capital) 871,120 1,606,805 1,841,250 5,114,872<br />
Misc. Expenses 59,009 24,076 6,419 –<br />
Deferred Tax Assets – 15,383 23,627 25,287<br />
Total 2,259,245 3,043,039 3,792,579 7,626,783<br />
45
Profit & loss Account (Rs. in ‘000)<br />
46<br />
2001-02 2002-03 2003-04 2004-05<br />
Turnover 2,607,555 3,336,365 3,806,606 5,364,310<br />
less: Sales Tax 177,928 251,600 255,771 288,020<br />
Less: Excise Duty paid 250,824 327,169 308,398 426,865<br />
Net Sales 2,178,803 2,757,596 3,242,437 4,649,425<br />
Other Income 60,695 42,823 34,573 54,856<br />
Total Income 2,239,498 2,800,419 3,277,010 4,704,281<br />
Salary, Wages & Labour charges 51,808 90,698 120,547 182,604<br />
Consumption of raw materials 605,091 712,886 966,088 1,447,949<br />
Purchase of trading goods 224,898 306,895 286,013 322,761<br />
Power & Fuel 6,059 7,462 31,365 74,059<br />
(Increase)/Decrease in Inventory 64,757 (77,942) (218,758) (237,632)<br />
Others 20,435 25,312 43,767 112,954<br />
Cost of sales 973,048 1,065,311 1,229,022 1,902,695<br />
Employee Cost 214,195 269,585 349,932 411,332<br />
Promotion Expenses 112,714 184,292 184,386 245,247<br />
Other Selling & Operating Exps 359,303 488,540 530,708 632,691<br />
Total selling & operating exps 686,212 942,417 1,065,026 1,289,270<br />
Research & Development 78,110 147,257 248,073 325,819<br />
Total Expenses 1,737,370 2,154,985 2,542,121 3,517,784<br />
EBIDT 502,128 645,434 734,889 1,186,497<br />
Interest 129,134 106,884 100,578 167,308<br />
EBDT 372,994 538,550 634,311 1,019,189<br />
Depreciation 88,226 103,326 108,891 149,836<br />
PBT 284,768 435,224 525,420 869,353<br />
Current Tax 22,607 35,300 90,298 143,275<br />
Deferred Tax 34,396 49,600 15,081 91,271<br />
PAT before extraordinary items 227,765 350,324 420,041 634,807<br />
Prior period and Extraordinary items – 18,429 – –<br />
PAT 227,765 331,895 420,041 634,807
Financial Ratios<br />
1.8<br />
1.2<br />
0.6<br />
0.77<br />
0.96<br />
Debt Equity<br />
0.56<br />
1.64<br />
160<br />
140<br />
120<br />
100<br />
80<br />
60<br />
40<br />
103.88<br />
Debtors cycle (Turnover)<br />
135.29<br />
125.11 123.91<br />
20<br />
0<br />
2001-02 2002-03 2003-04 2004-05<br />
0<br />
2001-02 2002-03 2003-04 2004-05<br />
47<br />
Balance Sheet<br />
2001-02 2002-03 2003-04 2004-05<br />
Return on net worth 20.26 23.68 18.72 23.80<br />
Return on Capital Employed (avg. cap. Emp.) 24.67 26.74 23.43 22.09<br />
Debt Equity 0.77 0.96 0.56 1.64<br />
Debtors Cycle (turnover) 103.88 135.29 125.11 123.91<br />
Creditors Cycle (cost of goods sold) 71.88 111.55 110.41 93.20<br />
Inventory Cycle (Net Sale) 53.99 58.82 92.49 87.19<br />
Inventory Turnover (net turnover) 6.76 6.21 3.95 4.19<br />
Gross Turnover/Capital employed 1.27 1.20 1.09 0.74<br />
Gross Turnover/Gross Block(in %) 184.05 267.65 220.86 207.42<br />
Net Block/Cap Emp. (in %) 60.42 36.17 39.34 28.91<br />
W.cap/Cap Emp. 42.40 57.94 52.62 70.64
PAT Margin<br />
Research and development/Net sales<br />
16<br />
14<br />
12<br />
10<br />
10.45<br />
12.04<br />
12.95<br />
13.65<br />
8.00<br />
6.25<br />
5.34<br />
7.65<br />
7.01<br />
8<br />
6<br />
4.50<br />
3.58<br />
4<br />
2.75<br />
2<br />
0<br />
2001-02 2002-03 2003-04 2004-05<br />
1.00<br />
2001-02 2002-03 2003-04 2004-05<br />
Profit & loss Account<br />
48<br />
2001-02 2002-03 2003-04 2004-05<br />
Revenue<br />
Domestic Sales / Turnover (%) 95.76 94.62 87.22 69.74<br />
Export Sales / Turnover (%) 4.24 5.38 12.78 30.26<br />
Excise / Turnover (%) 9.62 9.81 8.10 7.96<br />
Margin (Basis - Turnover )<br />
EBDIT Margin 23.05 23.41 22.66 25.52<br />
Cash profit margin 14.50 15.77 16.30 16.88<br />
Pretax profit margin 13.07 15.78 16.20 18.70<br />
PAT Margin 10.45 12.04 12.95 13.65<br />
Expenses<br />
Cost of sales /Total expenses 56.01 49.43 48.35 54.09<br />
Selling & Operating expenses / Total expenses. (%) 39.50 43.73 41.90 36.65<br />
R&D expenses/ Total expenses.(%) 4.50 6.83 9.76 9.26<br />
Cost of sales /Net Sales 44.66 38.63 37.90 40.92<br />
Selling & Operating expenses / Net sales (%) 31.49 34.18 32.85 27.73<br />
R&D expenses./ Net sales(%) 3.58 5.34 7.65 7.01<br />
Interest cover 3.89 6.04 7.31 7.09<br />
Cost of debt (%) 16.75 8.57 8.76 3.83<br />
Shareholder value * **<br />
EPS (FV Rs.10/-) 22.46 34.41 7.09 5.29<br />
EPS ( Net of extraordinary income) 22.46 32.60 7.09 5.29<br />
CEPS (FV Rs.10/-) 31.16 42.75 8.92 6.62<br />
CEPS ( Net of extraordinary income) 31.16 40.94 8.92 6.62<br />
Book value 110.87 137.67 37.86 22.48<br />
* Notes : During the financial year 2003-04, each paid up share of Rs.10 has been sub-divided into a paid up share of Rs.2 each.<br />
** During the financial year 2004-05,Company has allotted bonus shares in the ratio of 1:1 for each paid up share of Rs.2 each.
Profiles of the Directors<br />
Mr. Gracias Saldanha (Chairman)<br />
Mr. Gracias Saldhana, 68, is the founder of the company. He has<br />
over 35 years experience in the industry. His educational<br />
qualifications includes an M.Sc. from Bombay University with a<br />
Diploma in Management studies from Jamnalal Bajaj Institute of<br />
Management Studies, Mumbai. He has worked with leading<br />
pharmaceutical companies like Abbott Laboratories and E.<br />
Merck.<br />
Mrs. B. E. Saldanha (Director – Exports)<br />
Mrs. B. E. Saldanha, 65, has done her B.Sc., B.Ed. from Bombay<br />
University and has been Working Director since 1982. She has<br />
taken keen interest in developing the Company’s export<br />
business.<br />
Mr. Glenn Saldanha (Managing Director & CEO)<br />
Mr. Glenn Saldanha, 35, is a B.Pharma from Bombay University<br />
and was awarded the Watumall Foundation Award for overall<br />
excellence. His other educational qualifications include an MBA<br />
from New York University’s Leonard N. School of Business (US). He<br />
has worked for Eli Lilly in the US and was a Management<br />
Consultant with Price Waterhouse Coopers. His Services have<br />
been used by Smthkline Beecham, Rhorer, Astra, Merck and<br />
Johnson and Johnson, among others.<br />
Mrs. Cheryl Pinto (Director – Corporate Affairs)<br />
Mrs. Cheryl Pinto, 38, is a graduate in Pharmacy from the<br />
University of Bombay. She has over 12 years experience in the<br />
pharmaceuticals business.<br />
Mr. A. S. Mohanty (Director–Domestic<br />
Formulations)<br />
Mr. A. S. Mohanty, 51, is an M.Sc. in-charge of domestic<br />
Formulations, he has over 28 years experience in<br />
pharmaceutical sales and marketing as well as healthcare<br />
sectors.<br />
Mr. R. V. Desai (Director – Finance/IT/Legal)<br />
Mr. R. V. Desai, 47, is a Science Graduate and a Chartered<br />
Accountant, in-charge of Finance/IT/Legal, he has over 23 years<br />
experience.<br />
Mr. Julio F. Ribeiro (Non-Executive)<br />
Mr. Julio Ribeiro, 75, is a retired government official and has<br />
served the country under various assignments. Amongst the<br />
major positions held, he has been the Ex-commissioner of Police,<br />
Mumbai, Former Special Secretary to Government of India,<br />
Ministry of Home Affairs, former Director General of Police,<br />
Punjab, Ex-adviser to the Governor of Punjab, Ex-Ambassador of<br />
India to Romania and is currently a Director in IIT Corporate<br />
Services Ltd.<br />
Dr. Prasanna R. Gore (Non-Executive)<br />
Dr. Prasanna R. Gore, 40, is a Ph.D and M.S. in Pharmaceutical<br />
Marketing from University of West Virginia, Morgantown, WV<br />
and a B.Sc. from University of Bombay, India. He has over<br />
12 years experience in the pharmaceutical and healthcare<br />
sectors ranging from pharmaceutical sales, academic faculty<br />
and strategic consulting. He was elected Vice-Chairman of<br />
the American Association of Pharmaceutical Scientists –<br />
Economic, Management and Marketing section for the year<br />
2000.<br />
Mr. Sridhar Gorthi (Non-Executive Director)<br />
Mr. Sridhar Gorthi, 32 is a B.A., LL.B., (Hons.) from the National<br />
Law School of India University. Mr. Sridhar Gorthi is presently<br />
a partner in Trilegal and has worked with Arthur Anderson<br />
and Lax Inde, Mumbai. He was involved in legal advisory<br />
services to various multinational and domestic corporations<br />
on restructuring, debt finance, joint ventures,acquisition/<br />
mergers etc.<br />
Mr. Natvarlal B. Desai (Non-Executive)<br />
Mr. Natvarlal B. Desai, 78, is a retired General Manager of Bank<br />
of Baroda. He has over 45 years experience in the Banking<br />
Sector. He has worked in India and overseas. He was Chairman<br />
of Bank of Baroda Uganda Ltd. He was the founder and<br />
Managing Director of Equitorial Bank PLC, UK from which he<br />
retired in 1992.<br />
Mr. M. Gopal Krishnan (Non-Executive)<br />
Mr. M. Gopal Krishnan, 70, worked with Bank of India for over 25<br />
years, most of which were spent overseas in Kenya and UK.<br />
Thereafter, he worked with Equitorial Bank PLC, UK as Founder<br />
Director until he retired.<br />
49
Directors’ <strong>Report</strong><br />
Your Directors have pleasure in presenting their 27th <strong>Annual</strong> <strong>Report</strong> and Audited Accounts<br />
of the Company for the year ended March 31, 2005.<br />
FINANCIAL RESULTS<br />
Rs. in million<br />
2004-2005 2003-2004<br />
Profit before Interest, Depreciation & Tax 1186.50 734.89<br />
Less: Interest 167.31 100.58<br />
Less: Depreciation 149.84 108.89<br />
Less: Tax (Current Year & Deferred Tax) 234.55 105.38<br />
Profit after Tax 634.80 420.04<br />
Surplus brought forward from earlier years 496.94 235.88<br />
Profit available for appropriations 1131.74 655.92<br />
APPROPRIATIONS<br />
Interim Dividend on Preference Shares 7.06 10.50<br />
Interim Dividend on Equity Shares 83.03 77.02<br />
Dividend Tax 12.57 11.21<br />
Transfer to Debenture Redemption Reserve – 0.25<br />
Transfer to General Reserves 65.00 60.00<br />
Balance carried to Balance Sheet 964.08 496.94<br />
1131.74 655.92<br />
50<br />
DIVIDEND<br />
Your Company has paid interim dividend @ 35 per cent (65%) on<br />
the increased paid-up Equity Share Capital of the Company after<br />
issue of Bonus Shares in the ratio of 1:1 and @ 7 per cent (10.5%)<br />
on the paid up Preference Share Capital of the Company. The<br />
total outflow on account of Dividend inclusive of Dividend Tax, is<br />
Rs. 102.66 million (Rs. 98.73 million). Your Directors recommend<br />
that the interim dividend already paid be confirmed as final<br />
dividend for the year ended 31st March, 2005.<br />
RESULTS OF OPERATIONS<br />
Your Directors are pleased to report satisfactory performance<br />
for the year under review. The Company achieved gross<br />
revenue of Rs. 5419.17 million (Rs. 3836.41 million),<br />
registering an increase of 41.26 per cent over the previous<br />
year. The increase in revenue is due to the launching of new<br />
products, growth in the existing products and expansion in<br />
new markets.<br />
PROFITS<br />
The operating profit before interest, depreciation and tax<br />
increased to Rs. 1186.50 million from Rs. 734.89 million, an<br />
increase of 61.45 per cent over the previous year.
OPERATIONS:<br />
PHARMA DIVISION<br />
Domestic sales at Rs. 3027.74 million (Rs. 2892 million)<br />
registered an increase of 4.69 per cent over the previous year.<br />
The growth in the domestic segment during the period was<br />
affected mainly due to the introduction of VAT in the last<br />
quarter of the financial year. As per ORG report, your Company’s<br />
ranking has improved to 23 among the top 50 pharmaceutical<br />
companies. Your Company introduced new brands, which were<br />
well received in the market.<br />
Your Company is setting up a manufacturing facility at Baddi,<br />
Himachal Pradesh for manufacturing solid oral, liquid oral and<br />
semi-solids facilities, which is expected to be commissioned by<br />
August 2005. It will largely focus on meeting the Company’s<br />
growth requirements for formulation production to cater to the<br />
domestic market.<br />
INTERNATIONAL BUSINESS:<br />
Revenue from the export of branded formulation, active<br />
pharmaceutical ingredients (API) and sale of molecules etc. to<br />
overseas markets increased to Rs. 1623.08 million in FY 2005 from<br />
Rs. 469.28 million for the corresponding period of the previous<br />
year, recording a growth of 245.86%.<br />
Your Company has obtained registration for over 200<br />
formulation products and also filed over 100 additional<br />
registrations in several of its export markets. Your Company also<br />
commenced new business operations in the Central African<br />
Republic, Eritrea, Guyana, Peru, Dominican Republic, Botswana &<br />
Congo.<br />
A portfolio of over 45 active pharmaceutical ingredients was sold<br />
across 40 markets, this included sales of validation quantities of<br />
APIs in the regulated markets of USA and Europe<br />
• USA / North America:<br />
<strong>Glenmark</strong> Pharmaceuticals Inc., USA [GPI], the wholly<br />
owned subsidiary of <strong>Glenmark</strong> Pharmaceuticals SA<br />
[GPSA], launched its commercial sales front end for the<br />
US market in January 2005 with the signing of two<br />
partnership agreements with US based companies,<br />
Interpharm and Konec for Naproxen and Nitroglycerin,<br />
respectively. The Company has started supplies of<br />
Naproxen in the US market.<br />
Your company has also entered into a collaboration<br />
agreement for the joint development, filing and marketing<br />
of twelve generic pharmaceutical products with a Chennaibased<br />
company, Shasun Chemicals and Drugs Ltd. The<br />
product list includes a mixture of off-patent and patentprotected<br />
molecules with cumulative annual sales in the<br />
US of about USD 8 bn. Your Company also completed filing 6<br />
ANDAs with three more dossiers in advanced stages of<br />
completion for filing by 2006.<br />
• Latin America / Brazil:<br />
Laboratories Klinger Do Brasil Ltda, [Klinger] a wholly owned<br />
Brazilian subsidiary of <strong>Glenmark</strong> Farmaceutica Ltda, filed 3<br />
formulation dossiers for ANVISA approval for Mupirocin,<br />
Adapalene and Mometasone.<br />
In March 2005, Klinger purchased a leading oral contraceptive<br />
brand, Uno-Ciclo from Instituto Biochimico Indústria<br />
Farmacêutica Ltda. [Biochimico] for USD 4.6 million. The<br />
Company has acquired the trademark along with exclusive<br />
global manufacturing and marketing rights. This brand is<br />
expected to yield significant revenues and income for the<br />
business in the next financial year.<br />
• Switzerland:<br />
<strong>Glenmark</strong> Pharmaceuticals SA [GPSA], a wholly owned Swiss<br />
subsidiary of your company, successfully completed Phase 1<br />
single and multiple dosing studies on its novel oral PDE4<br />
inhibitor GRC 3886 for the indications of asthma and COPD.<br />
During the year, GPSA has licensed NCE GRC-3886 to Forest<br />
Laboratories Inc and received the upfront and milestone<br />
payment of USD 20 million from Forest Labs following the<br />
completion of Phase I studies. GPSA has also signed an<br />
agreement with Teijin Pharma of Japan for licensing its<br />
rights in Japan for which it has received an upfront<br />
down payment of US$ 6 million in the current financial<br />
year.<br />
DOMESTIC API AND CO-MARKETING<br />
Revenues from the Domestic API and Co-marketing business in<br />
FY05 grew to Rs. 713.49 million against Rs. 445.32 million for<br />
the corresponding period of the previous year recording a<br />
growth of 60.22%.<br />
Your Company has already filed DMFs for Amiodarone<br />
Hydrochloride, Cilostazol, Fluconazole, Glimepiride, Perindopril<br />
Erbumine, Topiramate, Simvastatin, Zonisamide, Itraconazole,<br />
Zolpidem tartrate, Terbinafine hydrochloride, Buproprion HCI<br />
and Trandolapril taking the count of total DMFs filed to 13 as of<br />
31st March, 2005.<br />
EMPLOYEE STOCK OPTION SCHEME<br />
During the year, Stock Options have been issued to the employees<br />
51
52<br />
of the Company. On exercising the convertible options so granted,<br />
the paid-up equity share capital of the company will increase by a<br />
like number of shares.<br />
The details of stock options granted by the Company are disclosed<br />
in compliance with clause 12 of the Securities Exchange Board of<br />
India (Employee Stock Options Scheme and Employee Stock<br />
Purchase Scheme), 1999 and set out in the Annexure to this<br />
<strong>Report</strong>.<br />
SUBSIDIARY COMPANIES<br />
During the year, your Company has incorporated wholly owned<br />
subsidiaries in Switzerland and <strong>Glenmark</strong> Organics Ltd. became a<br />
wholly owned Subsidiary of the Company. During the year<br />
<strong>Glenmark</strong> Pharmaceuticals Inc, USA and <strong>Glenmark</strong> Farmaceutica<br />
Ltda, Brazil became wholly owned subsidiaries of <strong>Glenmark</strong><br />
Pharmaceuticals SA, Switzerland consequent to restructuring of<br />
the Company’s business. Further, <strong>Glenmark</strong> Farmaceutica Ltda, Brazil<br />
merged with Laboratoris Klinger Do Brazil Ltda to form a single<br />
entity to oversee operations in Brazil.<br />
Pursuant to the provision of Section 212 (8) of the Companies<br />
Act, 1956, the Company has obtained exemption from<br />
Department of Company Affairs, New Delhi, to attach Audited<br />
Accounts of its subsidiaries together with Directors' <strong>Report</strong> and<br />
Auditor's <strong>Report</strong>. The Audited Accounts of the subsidiaries<br />
together with its Directors' <strong>Report</strong> and Auditor's <strong>Report</strong> are<br />
available for inspection of members on any working day at<br />
the Registered Office of the Company between 10 am to<br />
12 noon.<br />
FINANCE<br />
Your Company issued Foreign Currency Convertible Bonds of US<br />
$ 70 million to foreign investors during the year. The Company<br />
intends to use the proceeds to fund acquisitions overseas, direct<br />
investment in subsidiaries, new projects and modernization and<br />
expansion of existing projects.<br />
• Bonus Shares<br />
During the year, your Company issued Bonus Shares in the<br />
ratio of 1:1 by capitalizing its Share Premium account. The<br />
share capital after issue of bonus shares now stands at<br />
Rs. 237.24 million.<br />
• Preference Shares<br />
During the year, your Company issued 200,000 7%<br />
Redeemable Cumulative Preference Shares of Rs.100/-<br />
each aggregating to Rs. 20 Crores to Industrial<br />
Development Bank of India on private placement and<br />
redeemed 10.5% Redeemable Cumulative Preference<br />
Shares of Rs.100/- each issued to UTI Bank Ltd.<br />
DIRECTORS<br />
Mr. Gracias Saldanha, Mrs. B. E. Saldanha, Mr. R. V. Desai and Mr. A. S.<br />
Mohanty retire by rotation at the ensuing <strong>Annual</strong> General<br />
Meeting being eligible offer themselves for re-appointment.<br />
Mr. Sridhar Gorthi who was acting as Alternate Director to<br />
Dr. Prasanna Gore was appointed as Additional Director of the<br />
Company on 26th April, 2005. Mr. Gorthi holds office upto the<br />
date of the ensuing <strong>Annual</strong> General Meeting. The Company has<br />
received a notice in writing pursuant to the provisions of<br />
Section 257 of the Act from a member of the Company<br />
proposing his appointment as Director of the Company.<br />
During the year, Mr. J. M. Trivedi and Mr. Steven Bates resigned<br />
from the Board of the Company with effect from 26th April,<br />
2005 and 29th July, 2005 respectively. Your Directors wish to<br />
place on record their appreciation of the valuable services<br />
rendered by them during their tenure as Directors on the<br />
Board.<br />
CORPORATE GOVERNANCE<br />
The Corporate Governance and Management’s Discussion and<br />
Analysis <strong>Report</strong> form an integral part of this <strong>Report</strong> and are set out<br />
as separate Annexures to this <strong>Report</strong>. The Certificate of the<br />
Auditors of the Company certifying compliance with the<br />
conditions of Corporate Governance as stipulated in clause 49<br />
of the Listing Agreement with Stock Exchanges is annexed with<br />
the report on Corporate Governance.<br />
AUDITORS<br />
M/s Price Waterhouse, Chartered Accountants, Auditors of the<br />
Company, retire at the conclusion of the ensuing <strong>Annual</strong><br />
General Meeting and being eligible, offer themselves for<br />
re-appointment.<br />
HUMAN RESOURCES<br />
Industrial relations continued to be cordial. Information as per<br />
Section 217(2A) of the Companies Act, 1956, read with the<br />
Company’s (Particulars of Employees, Rules, 1975) forms part of this<br />
<strong>Report</strong>.<br />
COMPANIES (DISCLOSURE OF PARTICULARS IN THE REPORT OF<br />
THE BOARD OF DIRECTORS) RULES 1988.<br />
The particulars as prescribed under the Rules appear in the<br />
Annexures forming part of the Directors <strong>Report</strong>.
DIRECTORS’ RESPONSIBILITY STATEMENT<br />
The Directors confirm that –<br />
(i)<br />
(ii)<br />
in the preparation of the annual accounts, the applicable<br />
accounting standards have been followed along with<br />
proper explanation relating to material departures;<br />
appropriate accounting policies have been selected<br />
and applied consistently and have made judgements<br />
and estimates that are reasonable and prudent so as to<br />
give a true and fair view of the state of affairs of the<br />
Company as at 31st March, 2005 and of the profit of the<br />
Company for the year ended 31st March, 2005;<br />
APPRECIATION<br />
Your Directors express their gratitude to the Company’s<br />
customers, shareholders, business partners viz. distributors and<br />
suppliers for their understanding and support.<br />
Your Directors record their appreciation and gratitude to the<br />
financial institutions and banks for their continued and timely<br />
assistance in meeting the Company’s resource requirement.<br />
Finally your Directors acknowledge the dedicated services<br />
rendered by all the employees of the Company.<br />
(iii) proper and sufficient care has been taken for<br />
maintenance of adequate accounting records in<br />
accordance with the provisions of the Companies Act,<br />
1956 for safeguarding the assets of the Company and<br />
for preventing and detecting fraud and other<br />
irregularities;<br />
(iv)<br />
the annual accounts have been prepared on a going<br />
concern basis.<br />
Mumbai.<br />
29th July, 2005.<br />
For and on behalf of the Board of Directors<br />
G. Saldanha<br />
Chairman<br />
53
Annexure to the<br />
Directors’ <strong>Report</strong><br />
ANNEXURE-A<br />
Information under Section 217(1)(e) of the CompaniesAct,1956 read with Companies (Disclosure of<br />
Particulars in the <strong>Report</strong> of the Board of Directors) Rules, 1988 and forming part of the Directors’<br />
<strong>Report</strong>.<br />
A. CONSERVATION OF ENERGY<br />
Energy Generation Measures Taken<br />
A. Power and Fuel Consumption 2004-05 2003-04<br />
1. Electricity<br />
(a) Purchased<br />
Unit (in‘000 Kwhrs) 9782.91 4947.07<br />
Total Amount (Rs. in ‘000’s) 47611.84 25510.30<br />
Rate/Unit (Rs.) 4.87 4.65<br />
(b)<br />
Own Generation<br />
(i) Through Diesel Generator<br />
Unit (in‘000 Kwhrs) 2639.75 136.28<br />
Units per Ltr. of Diesel Oil 3.70 3.19<br />
Cost/Unit (Rs.) 7.99 7.05<br />
(ii) Through Steam Turbine/Generator Nil Nil<br />
2. Coal Nil Nil<br />
Qty.<br />
Total Cost<br />
Avg. Rate<br />
54<br />
3. Furnace Oil<br />
Qty. (K. Ltr.) 167.89 183.20<br />
Total Amount (Rs. in ‘000’s) 3022.02 3297.60<br />
Avg. Rate (Rs. /K. Ltr.) 18.00 18.00<br />
4. i. Internal generation<br />
Light Diesel Oil/<br />
Qty. (In Ltr. ‘000’s) 251.58 101.41<br />
Total Cost (Rs. in ‘000’s) 6072.44 2218.80<br />
Rate/Unit (Rs.) 24.14 21.88<br />
ii. Natural Gas<br />
Qty. (M 3 ‘000’s) 1063.25 476.79<br />
Total Cost (Rs. in ‘000’s) 9653.33 4767.87<br />
Rate/Unit (Rs.) 9.07 10.00<br />
B. Consumption<br />
The Company manufactures several Drug Formulations in different pack sizes. In view of this, it is impracticable to apportion the<br />
consumption and cost of utilities to each Product/Formulation.
B. TECHNOLOGY ABSORPTION, RESEARCH &<br />
DEVELOPMENT (R&D)<br />
1. Specific areas in which R & D is carried out by the<br />
Company<br />
a) Pharmaceutical Formulation Development: Formulation of<br />
various pharmaceutical dosage forms and processes for new<br />
& existing molecules. Development of formulations as<br />
immediate release, delayed release, sustain release and<br />
various platform technologies. This includes literature<br />
survey, preformulation studies, formulation and<br />
standardisation of dosage forms for selected drug<br />
molecules on laboratory scale.<br />
b) Drug Discovery: Efforts have been continued in the area of<br />
Asthma, COPD and diabetes. Ten patents in all with<br />
provisional specifications and three patents with complete<br />
specifications have been filed. One NCE, GRC 3886 has<br />
completed advanced toxicological investigations as<br />
well as Phase–I clinical trials in UK. Lead identification<br />
in the diabetes project has also been accomplished.<br />
c) Development of technology based products like<br />
Cefuroxime Axetil ER Tablets, Levocetirizine<br />
Dihydrochloride (Effermelt) Tablets, Aztreonam For<br />
injection, Meropenem For Injection, Metoprolol Succinate<br />
ER Tablets.<br />
d) Development of ANDA for the US markets: Your Company<br />
has filed six ANDAs on its own label during this financial<br />
year. Company also has three more ANDA dossiers which<br />
are under an advanced stage of development.<br />
e) Formulation Development for Brazil Market. It includes–<br />
Development of various types of dosage forms, its<br />
standardization and execution at production site,<br />
evaluation of these batches against Brazil reference<br />
samples for pharmaceutical and bio-equivalence.<br />
2. Analytical Method Development:<br />
a) Development of new analytical test processes and their<br />
evaluation for dosage forms. This includes stability indicating<br />
methods, validation and standardisation of analytical processes.<br />
Accelerated and time lapse stability studies of Research and<br />
Development formulations under various climatic<br />
conditions.<br />
b) Development of technology based patentable platform<br />
technology. Filing of patents in the US and PCT for various<br />
dosage form including oral controlled release and topical<br />
products.<br />
3. Packaging Material Development:<br />
Development of packaging forms and their improvements for<br />
new as well as existing products.<br />
4. Technology Transfer:<br />
The products like Simvastatin, Fluvastatin, Atorvastatin Calcium<br />
were transferred to Ankleshwar plant for commercial production.<br />
5. Benefits derived as a result of the above R&D:<br />
R&D has developed the new formulations for new & existing<br />
molecules & drug combinations.<br />
i. Developed technology is transferred to commercial<br />
production for following products;<br />
<strong>Glenmark</strong> Gracewell Healtheon<br />
Cefuroxime Axetil ER Tablets 500 mg Levocetirizine Miglitol Tablets<br />
(Altacef OD) Dihydrochloride (Effermelt) (Mignar)<br />
Tablets 5 mg - ( L-Cetridoc)<br />
Valdecoxib plus Paracetamol Tablets Imiquimod Cream 5% w/w Atorvastatin plus Ezetimibe Capsules<br />
(20 mg + 500 mg) (Imiquad) (Zetitor)<br />
(Valus Plus 20)<br />
Protomeg Soft Gelatin Capsules Kojic Acid Dipalmitate + Glycolic Acid + Telmisartan Tablets 80 mg<br />
Arbutin Cream<br />
(Demelan Cream)<br />
Aloe Extract + Vitamin E Acetate Lotion<br />
(Elovera Lotion)<br />
Ambroxol Hydrochloride +<br />
Terbutaline Sulphate +<br />
Guaifenesin + Ammonium Chloride<br />
+ Menthol Expectorant<br />
(Mucaryl AX Expectorant)<br />
55<br />
ii. Development of technology based products like Aztreonam<br />
injection and also combination product such as Ezetimibe<br />
and Atorvastatin were developed for the launch in<br />
Domestic Segment.<br />
iii. In total 13 DMFs were filed for US Market.<br />
iv.<br />
GRC 3886 has been successfully licensed to<br />
Forest Laboratories of USA and Tejin Pharma of Japan.<br />
GRC 8200, the lead identified in the diabetes project<br />
has been studied for safety and toxicological<br />
properties.
v. The products launched and sold in the domestic and exports<br />
markets would earn revenues for your Company. The IPR<br />
generated can lead to profitable licensing opportunities.<br />
6. Future plan of action:<br />
R&D is working on new molecules in the following segment;<br />
- Antihypertensive molecules<br />
- Antifungal molecules<br />
- Antibacterial molecules<br />
- Antiasthmatic molecules<br />
- Antidiabetic products<br />
- Anti-aging products<br />
- Sunscreens Products<br />
- Technology – such as microspheres & aerosols.<br />
- Technology – to replace solvents used in film coating by water.<br />
- Development of formulations for Semi regulatory market.<br />
- Development of formulations for Latin American market.<br />
Your Company is targeting development and technology<br />
transfer and ANDA filing for 10-12 products for the coming year.<br />
7. Expenditure on R&D:<br />
(Rs. in’ Million)<br />
2004-05 2003-04<br />
a) Capital Expenditure 161.00 123.55<br />
b) Revenue Expenditure 325.82 248.07<br />
c) Total 489.64 371.62<br />
d) R & D Expenditure as a<br />
percentage of total turnover 9.04% 9.67 %<br />
TECHNOLOGY ABSORPTION, ADOPTION AND INNOVATION:<br />
1. Efforts in brief towards technology absorption, adoption<br />
and innovation.<br />
Most of our efforts in the area of technology absorption,<br />
adoption and innovation are based on our own efforts in R & D.<br />
They include improvement in yield and quality, improvement<br />
of processes and development of new processes with validation<br />
studies.<br />
2. Benefits derived :<br />
Benefits derived are enhanced production of our products,<br />
improvement in the yield and quality of products and<br />
introduction of new products, cost reduction of products and<br />
processes without affecting the quality of the products and<br />
process efficacy.<br />
Our R&D Centre is recognised by D.S.I.R., Ministry of Science<br />
and Technology, Government of India.<br />
3. Information regarding technology imported during the last<br />
five years – Nil.<br />
A. FOREIGN EXCHANGE EARNINGS AND OUTGO<br />
Total foreign exchange earned was Rs. 1301.34 Million and outflow<br />
was Rs. 732.56 Million.<br />
Mumbai<br />
29th July, 2005.<br />
For and on behalf of the Board of Directors<br />
G. Saldanha<br />
Chairman<br />
56
ANNEXURE-B<br />
Information of employees under Section 217 (2A) of the Companies Act, 1956 read with Companies (Particulars of Employees) Rules, 1975.<br />
Particulars of employees<br />
Sl Name Age Designation Remuneration Qualification Experience Date of Last<br />
No Yrs Received (Rs.) Yrs Commencement Employment<br />
of Employment<br />
1 K. Anand 49 Sr.V.P.– QA & 2,458,992 M.Sc. 28 17/10/2003 Nicholas Piramal India. Ltd<br />
Regulatory Affairs<br />
2 Shekhar B. Bhirud (Dr.) 43 Head – API 3,884,066 M.Sc, Ph.D (Org. Chem) 17 14/12/2000 Dai-Ichi Karkaria Ltd.,<br />
Hyderabad<br />
3 R. V. Desai 47 Director–Finance, 2,811,492 B. Sc. , C.A 23 25/03/1983 Progressive Consultants<br />
IT& Legal<br />
Limited<br />
4 B. Gopalan (Dr.) 57 Sr. VP – Chemical Research 5,137,657 M.Sc, Ph.D 23 01/12/1999 Merck Development Centre<br />
(I) Ltd.<br />
5 Mubeen Ahmed Khan (Dr.) 40 Vice President- 2,569,798 M.Sc, M.Phil, Ph.D 17 04/09/2000 Cadila Pharma Ltd.,<br />
Analytical (Analytical Chemistry) Ahmedabad<br />
6. A. S. Mohanty 51 Director–Formulations 4,204,950 M.Sc. 28 02/01/1984 Alembic Limited<br />
7 Cheryl Pinto 38 Director–Corporate Affairs 5,324,661 B.Pharm 12 01/08/2000 Cheryl Laboratories (Pvt.)<br />
Limited<br />
8 B. E. Saldanha 65 Director–Exports 8,078,954 B.Sc, B.Ed., 34 01/01/1982 Walsingham House School<br />
9 Glenn Saldanha 35 Managing Director & 20,571,888 B.Pharm, 11 01/08/1998 Price Waterhouse<br />
Chief Executive Officer MBA (USA) Coopers, USA<br />
10 Vilas Satpute* 51 VP – Manufacturing 2,297,264 B.Tech 20 07/04/2004 Lupin Laboratories Ltd.<br />
11 Krishna R. Solanki* (Dr.) 58 VP – QA 1,843,488 M.Sc, Ph.D 29 01/05/2003 Wockhardt Ltd.<br />
12 C.V. Srinivasan* (Dr.) 51 Principal Scientist 2,314,756 Ph.D 20 09/07/2001 Cadila Pharmaceuticals Ltd.<br />
(Synthetic Organic Chemistry)<br />
13 Swaroop Kumar (Dr.) 40 Head – Drug Discovery & 5,283,762 M. Pharm, Ph.D 11 18/02/2003 Sun Pharma Advanced<br />
Clinical Development<br />
Research Centre, Baroda.<br />
*Employed for part of the year.<br />
Notes:<br />
i) Remuneration includes Salary, Allowances, Bonus, Company’s Contribution to Provident Fund and Superannuation Fund, Medical Benefits, LTA, Commission and<br />
perquisites as per Income Tax Act, 1961.<br />
ii) Mrs. B. E. Saldanha, Mr. Glenn Saldanha and Ms. Cheryl Pinto are related to each other as defined under Section 6 of the Companies Act, 1956.<br />
iii) The nature of employment in all cases is contractual.<br />
For and on behalf of the Board of Directors<br />
Mumbai.<br />
29th July, 2005.<br />
G. Saldanha<br />
Chairman<br />
57
Disclosure pursuant to the provisions of Securities and Exchange Board of India (Employee Stock Option Scheme<br />
and Employee Stock Purchase Scheme) Guidelines, 1999.<br />
A. <strong>Glenmark</strong> Employee Stock Option Scheme 1999<br />
a Options Issued 875,000<br />
b The Pricing Formula • Book value as on 31st march 1999 in respect of<br />
450,000 options<br />
• Market price as on 1st January, 2001 in respect of<br />
425,000 options<br />
c Options Vested 650,000<br />
d Options Exercised 650,000<br />
e The total number of shares arising as a result of exercise of option 650,000<br />
f Options Cancelled / Forfeited 215,000<br />
g Variation of terms of options NIL<br />
h Money realised by exercise of option Rs. 14,449,100/-<br />
i Total number of options in force as on 31st March 2005 10,000<br />
j Employee wise details of options granted during the year to:<br />
i) Senior Managerial Person NIL<br />
ii) Any other employee who receives a grant in any one year of option<br />
amount to 5% or more of options granted during the year<br />
NIL<br />
iii) Identified employees who were granted option during any one year,<br />
equal to or exceeding 1% of the issued capital (excluding<br />
outstanding warrants and conversions) of the company at the time<br />
of grant<br />
NIL<br />
k Diluted Earnings Per Share (EPS) pursuant to issue of shares on<br />
exercise of option calculated in accordance with International<br />
Accounting Standard (IAS) 33 Rs. 4.81<br />
58<br />
B. <strong>Glenmark</strong> Employee Stock Option Scheme 2003<br />
a Options Issued 1,217,225<br />
b The Pricing Formula Market price of the equity shares (market price shall<br />
be as defined in the SEBI (ESOS and ESPS)<br />
Guidelines, 1999, from time to time)<br />
c Options Vested NIL<br />
d Options Exercised NIL<br />
e The total number of shares arising as a result of exercise of option NIL<br />
f Options Cancelled / Forfeited 152,050<br />
g Variation of terms of options NIL<br />
h Money realized by exercise of option NIL<br />
i Total number of options in force as on 31st March 2005 1,065,175<br />
j Employee wise details of options granted to:<br />
i) Senior Managerial Person 1. Dr. Vijay Soni<br />
2. Mr. Sanjeev Krishnan<br />
3. Mr. Terrance Coughlin<br />
4. Mr. Arun Narayan<br />
5. Mr. Jeff Glazer<br />
6. Mr. P.V. Upadhye<br />
7. Mr. Jim Brown
ii) Any other employee who receives a grant in any one year of option<br />
amount to 5% or more of options granted during the year<br />
NIL<br />
iii) Identified employees who were granted option during any one year,<br />
equal to or exceeding 1% of the issued capital (excluding outstanding<br />
warrants and conversions) of the company at the time of grant<br />
NIL<br />
k Diluted Earnings Per Share (EPS) pursuant to issue of shares on<br />
exercise of option calculated in accordance with International<br />
Accounting Standard (IAS) 33 Rs. 4.81<br />
l Method of calculation of employees compensation cost The Company has calculated the employee<br />
compensation cost using the intrinsic value of the<br />
stock options.<br />
m Difference between the employee compensation cost so computed at<br />
l) above and the employee compensation cost that shall have been<br />
recognized if it had used the fair value of the options.<br />
NIL<br />
The impact at this difference on profits and on EPS of the company<br />
Amt(Rs in lakhs)<br />
Profit After Tax (PAT) 6348.07<br />
Less: Additional employee<br />
Compensation cost based<br />
on fair value<br />
NIL<br />
Adjusted PAT 6348.07<br />
Adjusted EPS: Basic Rs. 5.29<br />
Diluted Rs. 4.81<br />
n Weighted average exercise price and fair value of Stock options<br />
granted:<br />
Stock options Weighted average Weighted average Closing market price<br />
granted on exercise price (in Rs.) Fair value (in Rs.) at NSE on preceding<br />
Face Value Rs. 2<br />
date of grant (in Rs.)<br />
05/07/2004 136.23 59.26 136.23*<br />
22/09/2004 183.75 72.58 183.75<br />
25/01/2005 464.15 196.33 464.15<br />
17/02/2005 511.10 201.35 511.10<br />
59<br />
o Description of the method and significant assumptions used during the The Black Scholes option pricing model was<br />
year to estimate the fair value of the options, including the following<br />
developed for estimating fair value of traded options.<br />
weighted average information:<br />
Since option pricing model requires use of<br />
substantive assumptions, changes therein can<br />
materially affect Fair Value of options. The option<br />
pricing models do not necessarily provide a reliable<br />
measure of fair value of options.<br />
* Two weeks high and low price of the share preceding the date of grant of option.<br />
The main assumptions used in the Black-Scholes option pricing model during the year were as follows:<br />
1. Risk free interest rate 6%<br />
2. Expected life of options from the date of grant 6 Years<br />
3. Expected Volatility 25%<br />
4. Dividend yield 1.24%
<strong>Report</strong> on<br />
Corporate Governance<br />
Pursuant to Clause 49 of the Listing Agreement, a <strong>Report</strong> on Corporate Governance is given below.<br />
1. The Company’s philosophy on Code of Governance is aimed at assisting the top management of the Company in the efficient<br />
conduct of its business and in meeting its obligations to shareholders. The Company has adopted a codified Corporate<br />
Governance Charter, inter-alia, to fulfill its corporate responsibilities and achieve its financial objectives.<br />
The Company believes in and has consistently practiced good corporate governance. The Company creates an environment for<br />
the efficient conduct of the business and to enable management to meet its obligations to all its stakeholders, including amongst<br />
others, shareholders, customers, employees and the community in which the Company operates.<br />
Given below is a <strong>Report</strong> on Corporate Governance of your Company.<br />
2. Board of Directors:<br />
A. Composition:<br />
The Board comprises of 12 Directors, of whom, five are executive, and seven are non-executive Directors. The Chairman of the<br />
Board is a non-executive Director.<br />
The non-executive Directors are professionals with experience in management, pharmaceutical industry, legal, finance, marketing<br />
and general administration who bring in a wide range of skills and experience to the Board.<br />
a) Details of the Board of Directors<br />
Name of the Director Status No. of Board No. of other No. of Committee<br />
Meetings attended Directorship held # Membership (s)<br />
Chairman Member<br />
Gracias Saldanha Non-Executive -<br />
- Chairman Promoter Group 7 4 – –<br />
B. E. Saldanha Executive - 6 4 – –<br />
Promoter Group<br />
Glenn Saldanha Executive -<br />
Managing Director & CEO Promoter Group 8 2 – 2<br />
60<br />
Cheryl Pinto Executive -<br />
Promoter Group 8 – – –<br />
J. F. Ribeiro Non-Executive -<br />
Independent 8 2 4 –<br />
R.V .Desai Executive 10 – – 1<br />
A. S. Mohanty Executive 9 – – –<br />
Prasanna Gore<br />
Non-Executive-<br />
Independent – – – 1
Name of the Director Status No. of Board No. of other No. of Committee<br />
Meetings attended Directorship held # Membership (s)<br />
Chairman Member<br />
N.B Desai Non-Executive -<br />
Independent 8 – – 3<br />
M. Gopal Non-Executive -<br />
Krishnan Independent 5 – – 1<br />
J. M. Trivedi Non-Executive -<br />
Independent 4 1 – –<br />
Sridhar Gorthi<br />
(Till 26/04/2005 alternate<br />
to Mr. Prasanna Gore and<br />
appointed as additional Non-Executive -<br />
director on 26/04/2005). Independent 6 1 – 1<br />
Steven Bates<br />
Non-Executive<br />
Independent 2 – – –<br />
# Includes Directorship(s) in Indian Companies.<br />
b) During the Financial Year ended March 31, 2005 ten board meetings were held on the following dates:<br />
22nd April, 2004; 5th July, 2004; 12th July, 2004; 22nd July, 2004; 29th September, 2004; 25th October, 2004;<br />
11th December, 2004; 6th January, 2005; 27th January, 2005 and 18th March, 2005.<br />
B. None of the non-executive Directors of the Company, have any pecuniary relationship or transactions with the Company other<br />
than sitting fees paid for attending board meeting/committee meetings and those already disclosed in the note 4 of schedule 22<br />
to the Financial Statement in the <strong>Annual</strong> <strong>Report</strong>.<br />
C. Mr. J. F. Ribeiro, Mrs. B .E. Saldanha, Mr. Glenn Saldanha, Mr. R.V. Desai, Mr. A. S. Mohanty & Mr. N.B Desai attended the last <strong>Annual</strong><br />
General Meeting of the Company held on 24th September, 2004.<br />
61<br />
3. Audit Committee:<br />
Your Company has a qualified and independent Audit Committee. During the Financial Year ended March 31, 2005, the<br />
committee met five times on 22nd April, 2004; 5th July, 2004; 22nd July, 2004; 22nd October, 2004 and 27th January, 2005.<br />
Name No. of meetings attended Remarks<br />
1. J. F. Ribeiro 5 Chairman<br />
2. Prasanna Gore – Member<br />
3. Sridhar Gorthi - Alternate to Mr. Prasanna Gore 4 Member<br />
4. N. B. Desai 4 Member<br />
5. M. Gopal Krishnan 3 Member<br />
Mr. Glenn Saldanha, Managing Director & CEO, Mr. R. V. Desai, Director-Finance, IT & Legal and Mr. Prakash Sevekari, Cost Auditor are<br />
invitees to the Meeting of the Audit Committee; Mr. M. J. Mendonza, Vice President-Legal and Company Secretary is the Secretary to<br />
the Committee. The terms of reference of this committee are wide enough covering matters specified in the Companies Act, 1956<br />
read together with Clause 49 of the Listing Agreement of the Stock Exchange. The current Charter of the Audit Committee is in line<br />
with international best practices and the regulatory changes formulated by SEBI and the listing agreements with the stock exchanges<br />
on which your company is listed.<br />
4. Remuneration of Directors:<br />
A. The remuneration of the executive and non-executive Directors of your Company is decided by the Board of Directors.
B. Given below are the details of remuneration / fees / commission paid to Directors during the financial year ended March 31,<br />
2005:<br />
Name of Director Salaries & Perquisites Commission Sitting Fees TOTAL<br />
1 Gracias Saldanha - 9,341,726 35,000 9,376,726<br />
2 B. E. Saldanha 7,088,954 990,000 – 8,078,954<br />
3 Glenn Saldanha 8,233,287 12,338,601 – 20,571,888<br />
4 Cheryl Pinto 2,157,754 3,166,908 – 5,324,661<br />
5 R. V. Desai 2,524,392 287,100 – 2,811,492<br />
6 A. S. Mohanty 3,917,850 287,100 – 4,204,950<br />
7 J. M. Trivedi – – 20,000 20,000<br />
8 J. F. Ribeiro – – 65,000 65,000<br />
9 M. Gopal Krishnan – – 40,000 40,000<br />
10 N. B. Desai – – 60,000 60,000<br />
11 Steve Bates – – 9,986 10,000<br />
12 Sridhar Gorthi – – 50,000 50,000<br />
23,922,236 26,411,435 279,986 50,613,657<br />
Notes:<br />
1. The Executive Directors have been appointed/ reappointed on May 16, 2002 for the term of five years. The service contract can<br />
be terminated with a notice of six months.<br />
2. Sitting fees in respect of Mr. J. M. Trivedi have been paid to Actis Advisors Pvt. Ltd (formerly CDC Advisors Pvt. Ltd)., of which he is a<br />
nominee.<br />
3. Sitting fees in respect of Mr. Steve Bates have been paid in GBP.<br />
4. During the Year, the following Directors acquired Shares of Company under ESOS 99:-<br />
i) A. S. Mohanty 5,000 Equity Shares of Rs. 2/- each.<br />
ii) R. V. Desai 5,000 Equity Shares of Rs. 2/- each.<br />
The options had a vesting period of three years and were issued at a premium of Rs. 12.34 per equity share.<br />
5. SHARE TRANSFER AND SHAREHOLDERS’ / INVESTORS’ GRIEVANCES COMMITTEE:<br />
The following Committees reviews shareholders’ complaints and resolution thereof.<br />
Name of committee Members No. of meetings held Attendance at the<br />
meeting<br />
Share Transfer/ 1) J. F. Ribeiro – Chairman 26<br />
Shareholders’ and 2) Glenn Saldanha – Member 30 24<br />
Investors’ Grievance 3) N. B. Desai - Member 25<br />
Committee. 4) R.V. Desai – Member 29<br />
62<br />
Share Transfer Committee 1) R. V. Desai 15 15<br />
2) M. J. Mendonza 15<br />
Shareholders’ and Investors’ 1. J. F. Ribeiro – Chairman 6<br />
Grievance Committee. 2. Glenn Saldanha – Member 6 5<br />
3. N. B. Desai - Member 6<br />
4. R.V. Desai – Member 6<br />
During the year, the Share Transfer/ Shareholders’ and Investors’ Grievance Committee was re-constituted into two different<br />
committees viz. a) Share Transfer Committee b) Shareholders’ and Investors’ Grievance Committee.
Compliance Officer: Mr. M.J. Mendonza-Vice President-Legal & Company Secretary is the Compliance Officer of the<br />
Company.<br />
• Details of investor’s complaints received during the year ended March 31, 2005:<br />
No. of complaints 2004-2005 2003-2004<br />
Received 76 172<br />
Disposed 76 172<br />
Pending Nil Nil<br />
· • The Company’s Registrars, Karvy Computershare Private Ltd, had received letters / complaints during the financial year, all of<br />
which were replied / resolved to the satisfaction of the shareholders.<br />
6. Compensation Committee:<br />
i) The Compensation Committee comprises of following members of the Board:<br />
1. J. F. Ribeiro - Chairman<br />
2. Glenn Saldanha - Member<br />
3. N. B. Desai - Member<br />
ii)<br />
During the year ended March 31, 2005, seven meetings of Compensation Committee were held on 22nd April, 2004; 5th July,<br />
2004; 17th September 2004; 16th November, 2004; 6th January, 2005; 25th January, 2005 and 17th February, 2005. All<br />
members were present in these meetings.<br />
iii) Broad terms of reference of the Compensation Committee:<br />
· To recommend and review remuneration package of Executive / Non-Executive Directors.<br />
· To present report to the Board on remuneration package of Directors and others.<br />
To approve issue of stock options to the employees.<br />
iv)<br />
Compensation Policy:<br />
The Company follows a market linked remuneration policy, which is aimed at enabling the Company to attract and retain the<br />
best talent. Compensation is also linked to individual and team performance as they support the achievement of Corporate<br />
Goals. The Company has formulated an Employee Stock Option Scheme for rewarding & retaining performers.<br />
63<br />
7. Disclosures by Management :<br />
a) No material, financial and commercial transactions were reported by the management to the Board, in which the<br />
management had personal interest having a potential conflict with the interest of the company at large.<br />
b) There are no transactions with the Director or Management, their associates or their relatives etc. that may have potential<br />
conflict with the interest of the Company at large.<br />
c) There was no non-compliance during the last three years by the Company on any matter related to capital market.<br />
Consequently, there were neither any penalties imposed nor strictures passed on the Company by Stock Exchanges, SEBI or<br />
any statutory authority.<br />
8. Shareholders information:<br />
a) The relevant information relating to the Directors appointed after last <strong>Annual</strong> General Meeting of the Company and to be<br />
re-appointed at the ensuing <strong>Annual</strong> General Meeting to be held on 27th September, 2005 are given below:<br />
i. Mr. Sridhar Gorthi, 32, is a BA. LLB (Hons) from the National Law School of India University. Mr. Sridhar Gorthi is presently a<br />
partner in Trilegal and has worked with Arthur Andersen and Lex Inde, Mumbai. He was involved in legal advisory<br />
services to various multinational and domestic corporations on restructuring, debt finance, joint ventures, acquisition/<br />
mergers etc. Mr. Sridhar Gorthi was acting as Alternate Director to Dr. Prasanna Gore. It is now proposed to appoint him<br />
as Director of the Company.
He is also a Director of following Companies/Body Corporates :-<br />
Sl. Name of Company Position<br />
No.<br />
1 Triconsult India Pvt. Ltd. Director<br />
Mr. Sridhar Gorthi is also member of Audit Committee of your company.<br />
ii.<br />
Mr. Gracias Saldanha – 68, is the founder of the Company. He has over 35 years of experience in the industry. His<br />
educational qualification includes M.Sc. from Mumbai University with a Diploma in Management from Jamnalal Bajaj<br />
Institute of Management Studies, Mumbai. He has worked with leading pharmaceutical companies like Abbott<br />
Laboratories and E. Merck.<br />
He is also director of following Companies/Body Corporates:-<br />
Sl. Name of Company Position Held<br />
No.<br />
1 <strong>Glenmark</strong> Exports Ltd. Director<br />
2 <strong>Glenmark</strong> Organics Ltd. Director<br />
3 GM Pharma Ltd. Director<br />
4 Garcia Wines Pvt. Ltd. Director<br />
iii.<br />
Ms. B. E. Saldanha - 65, is the promoter director. She has done her B.Sc., B.Ed. from Mumbai University and has been a<br />
working director since 1982. She has been the force behind achieving company’s export targets.<br />
She is also director of following Companies/Body Corporates:-<br />
Sl. Name of Company Position Held<br />
No.<br />
1 <strong>Glenmark</strong> Exports Ltd. Chairperson<br />
2 <strong>Glenmark</strong> Organics Ltd. Chairperson<br />
3 GM Pharma Ltd. Director<br />
4 Garcia Wines Pvt. Ltd. Director<br />
iv.<br />
Mr. R. V. Desai – 47, is a Science Graduate and a Chartered Accountant. He is In-charge of Finance/Income Tax/Legal and<br />
has over 23 years of experience of Finance, Accounts & Taxation.<br />
He is also director of following Companies/Body Corporates:-<br />
64<br />
vi.<br />
Sl. Name of Company Position Held<br />
No.<br />
1 <strong>Glenmark</strong> Farmaceutica Ltda, Brazil Director<br />
2 <strong>Glenmark</strong> Dominicana SA, Dominican<br />
Republic<br />
Director<br />
He is also member of Operations Committee, Share Transfer Committee and Investor Grievance Committee.<br />
Mr. Abhinna Sundar Mohanty – 51, has done Masters in Science. In-charge of Domestic Formulations, he has over 28 years<br />
of experience in pharmaceutical sales and marketing as well as healthcare sectors.<br />
He is also member of Operations Committee.<br />
b) Share Transfer Process: The shares are sent /received for physical transfer at R& T’s office and all valid transfer requests are<br />
processed and returned within a period of 30 days from the date of receipt. The Share transfers are approved on weekly basis<br />
by the Share Transfer Committee.<br />
c) Dematerialisation of shares: As of March 31, 2005, 97.93 % of shares have been dematerialised and held in electronic form<br />
through NSDL and CDSL. The shares of your company are permitted to be traded only in dematerialised form.
d) Share Holding Pattern as at March 31, 2005:<br />
Sl. Description No. of No. of Shares Shares %<br />
No. Holders held<br />
1 Promoters 20 65045902 54.84<br />
2 Resident Individuals 34082 21030854 17.73<br />
3 Foreign Institutional Investor 19 16793114 14.16<br />
4 Bodies Corporate 973 9808710 8.27<br />
5 Indian Financial Institutions/Banks 5 2486754 2.10<br />
6 Others<br />
Non Resident Indians/OCBs 386 1187922 1.00<br />
Trusts 12 16144 0.01<br />
Mutual Funds 14 1393448 1.17<br />
Employees 299 357350 0.30<br />
Clearing Members 2 109448 0.09<br />
H U F 370 289794 0.24<br />
Directors & Relatives 5 101700 0.09<br />
Total: 36187 118621140 100.00<br />
e) General Body Meetings: The last three <strong>Annual</strong> General Meetings of the Company were held at the venue and time as<br />
under:-<br />
AGM No. Date Time Venue<br />
24 September 27, 2002 11.00 a.m Sunville Banquet & Conference Hall,<br />
3rd floor, Dr. Annie Besant Road,<br />
Worli, Mumbai-400 018.<br />
25 September 26,2003 11.00a.m Sunville Banquet & Conference Hall<br />
3rd floor, Dr. Annie Besant Road,<br />
Worli, Mumbai-400 018.<br />
65<br />
26 September 24, 2004 11.00a.m Sunville Banquet & Conference Hall<br />
3rd floor, Dr. Annie Besant Road,<br />
Worli, Mumbai-400 018.<br />
All resolutions moved at the last <strong>Annual</strong> General Meeting were passed by a show of hands by requisite majority of members<br />
attended the meeting.<br />
Resolutions with requisite majority were passed through Postal Ballot on 21st January 2005 for 1) Issue of Foreign Currency<br />
Convertible Bonds, 2) Authorizing the Board to borrow in excess of paid up share capital and free reserves.<br />
The Chairman then announced the following results of the Postal Ballot as per report of Mr. Surjan Singh Rauthan, the<br />
Scrutineer.<br />
Particulars Resolution No. 1 Resolution No. 2<br />
Total number of Postal Ballot Papers received 1430 1430<br />
Number of invalid Postal Ballot Papers received 104 589<br />
Number of valid Postal Ballot Papers received 1326 841<br />
Votes in favour of the Resolution 39052894 38059665<br />
Votes against the Resolution 16488 3667<br />
Resolution passed by % of valid votes received 99.96% 99.99%
Further resolutions with requisite majority were passed through Postal Ballot on 17th February, 2005 for 1) Reclassification<br />
of unclassified share capital 2) Amendment of Clause V of Authorised Capital 3) Amendment of Article 4 of Articles of<br />
Association 4) Issue of Bonus Shares.<br />
The Chairman then announced the following results of the Postal Ballot as per report of Mr. Surjan Singh Rauthan, the<br />
Scrutineer.<br />
Particulars Resolution Resolution Resolution Resolution<br />
No. 1 No. 2 No. 3 No. 4<br />
Total number of Postal Ballot Papers received 2018 2018 2018 2018<br />
Number of invalid Postal Ballot Papers received 148 213 217 152<br />
Number of valid Postal Ballot Papers received 1870 1805 1801 1866<br />
Votes in favour of the Resolution 35173146 35160843 35160157 35171894<br />
Votes against the Resolution 2304 2284 1934 305<br />
Resolution passed by % of valid votes received 99.99 99.99 99.99 99.99<br />
f) Date Time and Venue of the Ensuing <strong>Annual</strong> General Meeting: -<br />
<strong>Annual</strong> General Meeting shall be held on 27th September, 2005 at 11.00 a.m. at Sunville Banquet Hall, Dr. Annie Besant Road,<br />
Mumbai – 400 018<br />
g) Record Date/ Book Closure: -<br />
· – 2nd May 2005 was fixed as record date for making payment of Interim dividend on Equity share capital of the<br />
company.<br />
· – 8th March 2005 to 11th March, 2005 (both days inclusive) was declared for the purpose of determining the members<br />
who would be entitled to receive Bonus Shares.<br />
· – Book Closure: Monday, 26th September, 2005 to Tuesday, 27th September, 2005. (both days inclusive).<br />
h) Date of declaration of interim dividend:<br />
Equity Shares: 26th April 2005<br />
Preference Shares: 28th March 2005<br />
i) Financial Calendar (Tentative and Subject to change)<br />
Financial reporting for the first quarter ending June 30, 2005. July 2005<br />
Financial reporting for the second quarter ending September 30, 2005. October 2005<br />
Financial reporting for the third quarter ending December 31, 2005. January 2006<br />
Financial results for the year ending March 31, 2006. May 2006<br />
j) Members can avail of nomination facility by filing Form 2B with the Company. Blank forms can be downloaded from the<br />
website of the Company.<br />
66<br />
k) Members may kindly note that consequent to split in the face value of equity shares of the company, the shares in<br />
the face value of Rs. 10/- have ceased to be valid for any purpose whatsoever. Members who are holding shares of the<br />
face value of Rs. 10/- each are requested to kindly send their respective share certificates to the R&T Agents for<br />
receiving five equity shares of face value of Rs. 2/- each in exchange of one equity share of face value of Rs. 10/-<br />
each.<br />
l) Pursuant to the provisions of Section 205A (5) of the Companies Act, 1956, dividend for the financial year ended March 31,<br />
2000 and thereafter, which remain unclaimed for a period of seven years will be transferred by the Company to the Investor<br />
Education and Protection Fund (IEPF) established by the Central Government pursuant to Section 205C of the Companies<br />
Act, 1956.
Information in respect of such unclaimed dividend when due for transfer to the said Fund is given below:<br />
Financial Year Date of Date of transfer to Last date for Due date for<br />
Ended declaration unpaid/ unclaimed claiming unpaid transfer to<br />
of Dividend dividend account Dividend IEP Fund<br />
31.03.2000 10.03.2000 22.04.2000 21.04.2007 22.04.2007<br />
31.03.2001 28.09.2001 28.10.2001 27.10.2008 28.10.2008<br />
31.03.2002 27.09.2002 27.10.2002 26.10.2009 27.10.2009<br />
31.03.2003 15.05.2003 15.06.2003 14.06.2010 15.06.2010<br />
31.03.2004 29.03.2004 29.04.2004 28.04.2011 29.04.2011<br />
Shareholders who have not so far encashed their dividend warrant(s) are requested to seek issue of duplicate warrant(s) by<br />
writing to the Company’s Registrar and Transfer Agents, M/s. Karvy Computershare Pvt. Ltd. immediately. Shareholders are<br />
requested to note that no claims shall lie against the Company or the said Fund in respect of any amounts which were<br />
unclaimed and unpaid for a period of seven years from the dates that they first became due for payment and no payment<br />
shall be made in respect of any such claims.<br />
m) Means of Communication:<br />
a. Quarterly/Half Yearly and <strong>Annual</strong> Financial Results of the Company are published in the Financial Express and<br />
Punyanagri newspapers.<br />
b. Your Company’s results & official news releases are displayed on the company’s website.<br />
c. All items required to be covered in the Management Discussion & Analysis are included in the Directors’ <strong>Report</strong> to<br />
Members.<br />
67<br />
d. Company has its own web site and all the vital information relating to the company and its products is displayed on its<br />
web site; www.glenmarkpharma.com.<br />
Your Company also regularly provides information to the stock exchanges as per the requirements of the Listing<br />
Agreements. The Company’s website is updated periodically to include information on new developments and business<br />
opportunities of your Company.<br />
9. Company’s Scrip Information:<br />
· Listing on stock exchanges: The shares of the Company are listed on The Stock Exchange, Mumbai & The National Stock Exchange<br />
of India Ltd.<br />
o Listing fees for the year 2005-06 have been paid to the Stock Exchanges.<br />
· Stock Code: 532296 on the BSE<br />
o<br />
Electronic Form No.INE935A01027<br />
o Scrip Name GLENMARK PHA- BSE; GLENMARK - NSE<br />
Market Price Data: High, low during each month in last financial year. Performance in comparison to broad based indices namely<br />
BSE Sensex.
(All figures in Indian Rupees)<br />
Month High Low Close BSE<br />
Sensex<br />
Apr 04 162.75 145.00 149.50 5,655.09<br />
May 04 155.90 128.00 141.70 4,759.62<br />
Jun 04 146.00 129.40 135.90 4,795.46<br />
Jul 04 167.90 133.00 158.65 5,170.32<br />
Aug 04 194.65 151.00 182.95 5,192.08<br />
Sep 04 342.50 179.70 319.30 5,583.61<br />
Oct 04 325.00 286.10 302.80 5,672.27<br />
Nov 04 371.00 300.00 344.35 6,234.29<br />
GLENMARK<br />
600<br />
500<br />
400<br />
300<br />
200<br />
100<br />
0<br />
GLENMARK Vs. BSE<br />
10000.00<br />
9000.00<br />
8000.00<br />
7000.00<br />
6000.00<br />
5000.00<br />
4000.00<br />
3000.00<br />
2000.00<br />
1000.00<br />
0.00<br />
BSE SENSEX<br />
Dec 04 484.40 333.00 484.40 6,602.69<br />
Jan 05 563.90 455.50 504.45 6,555.94<br />
Feb 05 555.00 442.00 532.40 6,713.86<br />
Mar 05 613.00* 271.25** 282.25** 6,492.82<br />
Apr-04<br />
May-04<br />
Jun-04<br />
Jul-04<br />
Aug-04<br />
Sep-04<br />
Oct-04<br />
MONTHS<br />
Nov-04<br />
Dec-04<br />
Jan-04<br />
Feb-04<br />
Mar-04<br />
Glanmark<br />
BSE<br />
* Cum-Bonus Price** Ex-Bonus Price<br />
10. Plant Locations:<br />
The Company’s plants are located at:<br />
i) E-37, MIDC Industrial Area, D Road, Satpur, Nasik-422007, Maharashtra<br />
ii) 3109-C, GIDC Industrial Estate, Ankleshwar – 393 002 Dist. Bharuch.<br />
iii) Plot no. 7, Colvale Industrial Estate, Bardez, Goa.<br />
iv) Plot no. A- 80, MIDC Area, Kurkumbh, Daund, Pune – 413 802 Maharashtra.<br />
v) Plot No. 163- 165 & 170 – 172, Chandramouli Industrial Estate, Mohol,<br />
Sholapur, Maharashtra – 413213.<br />
11. Outstanding GDR’s/ADR’s/Warrants or any Convertible instruments exercised, date and likely impact on equity :<br />
A) The Company had issued 5,16,500 new options under Employees Stock Option Scheme viz. ESOS’ 2003. During the Financial<br />
Year 2004-2005, 10,000 & 1,52,050 options were cancelled under ESOS’ 1999 & ESOS’ 2003 respectively. As of 31st March<br />
2005, 10,000 and 10,65,175 options were outstanding under ESOS’ 1999 and ESOS’ 2003 respectively and are due for<br />
exercise on the following dates:<br />
ESOS’ 1999 ESOS’ 2003<br />
Date Number of Options Date Number of Options<br />
July 01,2005 5,000 October 22, 2005 60,018<br />
January 01, 2006 5,000 July 5, 2006 47,650<br />
68<br />
September 17, 2006 14,350<br />
October 22, 2006 120,035<br />
January 25, 2007 13,500<br />
February 17, 2007 1,600<br />
July 5, 2007 27,300<br />
September 17, 2007 28,700<br />
October 22, 2007 180,053
ESOS’ 1999 ESOS’ 2003<br />
Date Number of Options Date Number of Options<br />
January 25, 2008 27,000<br />
February 17, 2008 3,200<br />
July 5, 2008 40,950<br />
September 17, 2008 43,050<br />
October 22, 2008 240,069<br />
January 25, 2009 40,500<br />
February 17, 2009 4,800<br />
July 5, 2009 54,600<br />
September 17, 2009 57,400<br />
January 25, 2010 54,000<br />
February 17, 2010 6,400<br />
On exercising the convertible options so granted under the ESOS of the Company, the paid-up equity share capital of the<br />
company will increase by a like number of shares.<br />
B) The company had issued 20,000 Zero Coupon Foreign Currency Convertible Bonds of USD 1,000 each.<br />
i. Convertible at the option of the bondholder at any time on or after 28th March, 2005 but prior to the close of business<br />
on 2nd January, 2010 at a fixed exchange rate of Rs.43.66 per 1 USD and price of Rs.862.394 per share of par value of Rs.2<br />
per share subject to adjustment in certain events i.e. issue of bonus shares, division, consolidation, reclassification of<br />
shares etc.<br />
ii.<br />
Redeemable in whole but not in part at the option of the company on or after 15th February, 2008 if closing price of the<br />
share for each of the 25 consecutive trading days immediately prior to the date upon which notice of such redemption<br />
is given was at least 130% of the applicable Early Redemption Amount divided by the conversion ratio.<br />
69<br />
iii.<br />
Redeemable on maturity date on 16th February, 2010 at 133.74% of its principal amount if not redeemed or converted<br />
earlier. The redemption premium of 33.74%payable on maturity of the bond if there is no conversion of the bond to be<br />
debited to Share Premium account evenly over the period of 5 years from the date of issue of bonds.<br />
C) The company had issued 50,000 Zero Coupon Foreign Currency Convertible Bonds of USD 1,000 each.<br />
i. Convertible at the option of the bondholder at any time on or after 15th November, 2006 but prior to the close of<br />
business on 2nd January 2010 at a fixed exchange rate of Rs.43.66 per 1 USD and the price greater of 35% of the average<br />
of the order book volume–weighted-average-price of a share on each Trading Day during the period commencing on<br />
15th September and ending on 14th November, 2006 and the Floor Price (Rs.500) of par value of Rs.2 per share.<br />
ii.<br />
iii.<br />
Redeemable in whole but not in part at the option of the company on or after 15th February, 2009 if closing price of the<br />
share for each of the 25 consecutive trading days immediately prior to the date upon which notice of such redemption<br />
is given was at least 130% of the applicable Early Redemption Amount divided by the conversion ratio.<br />
Redeemable on maturity date on 16th February, 2010 at 134.07% of its principal amount if not redeemed or converted<br />
earlier. The redemption premium of 34.07%payable on maturity of the bond if there is no conversion of the bond to be<br />
debited to Share Premium account evenly over the period of 5 years from the date of issue of bonds.<br />
12. Electronic Clearing System (ECS):<br />
Shareholders are advised to opt for payment of dividend through ECS. The salient benefits of receiving dividend payment through<br />
ECS amongst others may be listed as below:<br />
a) There are no clearing charges in the hands of the investor/ recipient, the same are borne by the company;
) Risk as to fraudulent encashment of the dividend warrants, loss / interception of dividend warrants in transit, are eliminated;<br />
c) The facility ensures instant credit of the dividend amount in the desired account which to the recipient, means effortless<br />
and speedier transaction and hassles as to revalidation etc are done away with;<br />
d) Once the payment is made through ECS company issues intimation letters to the investors as to credit / payment of dividend,<br />
providing therein the details of the account and amount. Investors may download the ECS Mandate Form from the company’s<br />
website and send the same duly filed in to registrars for updation of records.<br />
13. Investor Helpdesk: for clarifications / assistance, if any, please contact;-<br />
Registered Office<br />
Registrars & Transfer Agents<br />
Persons to contact Mr. S. R. Turalkar M. S. Madhusudhan<br />
Add: <strong>Glenmark</strong> Pharmaceuticals Ltd Karvy Computershare P. Ltd<br />
B/2, Mahalaxmi Chambers “Karvy House”,46,Avenue 4,<br />
22, Bhulabhai Desai Road, Street No.1, Banjara Hills,<br />
Mumbai-400 026.<br />
Hyderabad-500034.<br />
Telephone (022) 56549999 (040) 23312454/23320751<br />
Fax No. (022) 23512531 (040) 23311968<br />
Email shrikantt@glenmarkpharma.com madhusudhan@karvy.com<br />
Website: www.glenmarkpharma.com www.karvy.com<br />
To the Members of<br />
<strong>Glenmark</strong> Pharmaceuticals Limited<br />
Certificate on<br />
Corporate Governance<br />
We have reviewed the implementation of Corporate Governance procedures by <strong>Glenmark</strong> Pharmaceuticals Limited during the year<br />
ended March 31, 2005, with the relevant records and documents maintained by the Company, furnished to us for our review and the<br />
report on Corporate Governance as approved by the Board of Directors.<br />
The compliance of conditions of Corporate Governance is the responsibility of the management. Our examination was limited to a<br />
review of procedures and implementation thereof, adopted by the Company for ensuring the compliances of the conditions of<br />
Corporate Governance. It is neither an audit nor an expression of opinion on the financial statements of the Company.<br />
In our opinion and to the best of our information and explanations given to us, we certify that the Company has complied with the<br />
conditions of Corporate Governance as stipulated in the Listing Agreement, subject to - Internal Auditors is not an invitee of the<br />
meetings of the Audit committee required under sub-clause II (A) of Clause 49 of the Listing Agreement.<br />
We further state that such compliance is neither an assurance as to the future viability of the Company nor of the efficiency or<br />
effectiveness with which the management has conducted the affairs of the Company.<br />
70<br />
On the basis of our review and according to the information and explanations given to us, the conditions of Corporate Governance as<br />
stipulated in Clause 49 of the Listing Agreement(s) with the stock exchanges have been complied with in all material respect by the<br />
Company and that no investor grievance is pending for a period exceeding one month against the Company as per the records<br />
maintained by the Shareholders/Investors Grievance Committee.<br />
For and on behalf of<br />
Price Waterhouse<br />
Chartered Accountants<br />
Mumbai, July 29, 2005.<br />
Partha Gosh<br />
Partner<br />
Membership No. – F 55913
Auditors’ <strong>Report</strong><br />
To the members of<br />
GLENMARK PHARMACEUTICALS LIMITED<br />
1. We have audited the attached Balance Sheet of <strong>Glenmark</strong> Pharmaceuticals Limited as at March 31, 2005 and the related Profit<br />
and Loss Account and Cash Flow Statement for the year ended on that date annexed thereto, which we have signed under<br />
reference to this report. These financial statements are the responsibility of the company’s management. Our responsibility is<br />
to express an opinion on these financial statements based on our audit.<br />
2. We conducted our audit in accordance with the auditing standards generally accepted in India. Those Standards require that we plan<br />
and perform the audit to obtain reasonable assurance about whether the financial statements are free of material misstatement. An<br />
audit includes examining, on a test basis, evidence supporting the amounts and disclosures in the financial statements. An audit also<br />
includes assessing the accounting principles used and significant estimates made by management, as well as evaluating the overall<br />
financial statement presentation. We believe that our audit provides a reasonable basis for our opinion.<br />
3. As required by the Companies (Auditor’s <strong>Report</strong>) Order, 2003, as amended by the Companies (Auditor’s <strong>Report</strong>) (Amendment) Order,<br />
2004, issued by the Central Government of India in terms of sub-section (4A) of Section 227 of ‘The Companies Act, 1956’ of India (the<br />
‘Act’) and on the basis of such checks of the books and records of the company as we considered appropriate and according to the<br />
information and explanations given to us, we give in the Annexure a statement on the matters specified in paragraphs 4 and 5 of the<br />
said Order.<br />
4. Further to our comments in the Annexure referred to in paragraph 3 above, we report that:<br />
(a) We have obtained all the information and explanations, which to the best of our knowledge and belief were necessary for the<br />
purposes of our audit;<br />
(b) In our opinion, proper books of account as required by law have been kept by the company so far as appears from our examination<br />
of those books;<br />
(c) The Balance Sheet, Profit and Loss Account and Cash Flow Statement dealt with by this report are in agreement with the books of<br />
account;<br />
(d) In our opinion, the Balance Sheet, Profit and Loss Account and Cash Flow Statement dealt with by this report comply with the<br />
accounting standards referred to in sub-section (3C) of Section 211 of the Act;<br />
(e) On the basis of written representations received from the directors, as on March 31, 2005 and taken on record by the Board of<br />
Directors, none of the directors is disqualified as on March 31, 2005 from being appointed as a director in terms of clause (g) of subsection<br />
(1) of Section 274 of the Act;<br />
(f) In our opinion and to the best of our information and according to the explanations given to us, the said financial statements<br />
together with the notes thereon and attached thereto give in the prescribed manner the information required by the Act and<br />
give a true and fair view in conformity with the accounting principles generally accepted in India:<br />
(i) in the case of the Balance Sheet, of the state of affairs of the company as at March 31, 2005;<br />
(ii) in the case of the Profit and Loss Account, of the profit for the year ended on that date; and<br />
(iii) in the case of the Cash Flow Statement, of the cash flows for the year ended on that date.<br />
71<br />
Partha Ghosh<br />
Partner<br />
Membership Number F-055913<br />
For and on behalf of Price Waterhouse<br />
Chartered Accountants<br />
Mumbai,<br />
Dated: April 27, 2005
ANNEXURE TO AUDITORS’ REPORT<br />
Refereed to in paragraph 3 of the Auditors’ <strong>Report</strong> of even date to the members of <strong>Glenmark</strong> Pharmaceuticals Limited on the financial<br />
statements for the year ended March 31, 2005<br />
1. (a) The company is maintaining proper records showing full particulars including quantitative details and situation of fixed<br />
assets.<br />
(b) The fixed assets are physically verified by the management according to a phased programme designed to cover all the items over<br />
a period of three years, which in our opinion, is reasonable having regard to the size of the company and the nature of its assets.<br />
Pursuant to the programme, a portion of the fixed assets has been physically verified by the management during the year and no<br />
material discrepancies between the book records and the physical inventory have been noticed.<br />
(c) In our opinion and according to the information and explanations given to us, a substantial part of fixed assets has not been<br />
disposed of by the company during the year.<br />
2. (a) The inventory (excluding stocks with third parties) has been physically verified by the management during the year. In respect of<br />
inventory lying with third parties, these have substantially been confirmed by them. In our opinion, the frequency of verification<br />
is reasonable.<br />
(b) In our opinion, the procedures of physical verification of inventory followed by the management are reasonable and adequate in<br />
relation to the size of the company and the nature of its business.<br />
(c) On the basis of our examination of the inventory records, in our opinion, the company is maintaining proper records of inventory.<br />
The discrepancies noticed on physical verification of inventory as compared to book records were not material.<br />
3. The company has not granted nor taken any loans, secured or unsecured, to companies, firms or other parties covered in the register<br />
maintained under Section 301 of the Act. Consequently clauses (b), (c), (d), (f) and (g) of paragraph 4 of the Order are not applicable to<br />
the Company.<br />
4. In our opinion and according to the information and explanations given to us, having regard to the explanation that certain items<br />
purchased and sold are of special nature for which suitable alternative sources do not exist for obtaining comparative quotations,<br />
there is an adequate internal control system commensurate with the size of the company and the nature of its business for the<br />
purchase of inventory, fixed assets and for the sale of goods and services. Further, on the basis of our examination of the books and<br />
records of the company, and according to the information and explanations given to us, we have neither come across nor have been<br />
informed of any continuing failure to correct major weaknesses in the aforesaid internal control system.<br />
5. (a) According to the information and explanations given to us, there have been no contracts or arrangements referred to in Section<br />
301 of the Act during the year to be entered in the register required to be maintained under that Section. Accordingly, commenting<br />
on transactions made in pursuance of such contracts or arrangements does not arise.<br />
(b) In our opinion and according to the information and explanations given to us, there are no transactions made in pursuance to such<br />
contracts or arrangements and exceeding the value of Rupees Five Lakhs in respect of any party during the year, which have been<br />
made at prices which are not reasonable having regard to the prevailing market prices at the relevant time.<br />
6. The company has not accepted any deposits from the public within the meaning of Sections 58A and 58AA of the Act and the rules<br />
framed there under.<br />
72<br />
7. In our opinion, the company has an internal audit system commensurate with its size and nature of its business.<br />
8. We have broadly reviewed the books of account maintained by the company in respect of products where, pursuant to the Rules made<br />
by the Central Government of India, the maintenance of cost records has been prescribed under clause (d) of sub-section (1) of Section<br />
209 of the Act and are of the opinion that prima facie, the prescribed accounts and records have been made and maintained. We have<br />
not, however, made a detailed examination of the records with a view to determine whether they are accurate or complete.<br />
9. (a) According to the information and explanations given to us and the records of the company examined by us, in our opinion, the<br />
company is regular in depositing undisputed statutory dues including investor education and protection fund, employees’ state<br />
insurance, income-tax, wealth tax, service tax, customs duty, excise duty and other material statutory dues as applicable, with the<br />
appropriate authorities except dues in respect of sales tax. The extent of the arrears of statutory dues outstanding as at March 31,<br />
2005, for a period of more than six months from the date they became payable, are as follows–
Name of the statute Nature of dues Amount Period to which Due date Date of Payment<br />
(Rs.)<br />
the amount relates<br />
Central Sales Tax Sales Tax Rs.7.07 lakhs 2004 Various dates Still due<br />
and Local Sales Tax Act<br />
(b) According to the information and explanations given to us and the records of the company examined by us, the particulars of<br />
dues of income-tax, sales-tax, wealth tax, service tax, customs duty excise duty and cess as at March 31, 2005 which have not been<br />
deposited on account of a dispute, are as follows -<br />
Name of the statute Nature of dues Amount Period to which the Forum where the<br />
(Rs.) amount relates dispute is pending<br />
The Income Tax Act, Income Tax Rs 34.34 lakhs A.Y 02-03 CIT (Appeals)<br />
1961<br />
10. The company has no accumulated losses as at March 31, 2005 and it has not incurred any cash losses in the financial year ended on<br />
that date or in the immediately preceding financial year.<br />
11. According to the records of the company examined by us and the information and explanation given to us, the company has not<br />
defaulted in repayment of dues to any financial institution or bank or debenture holders as at the balance sheet date.<br />
12. The company has not granted any loans and advances on the basis of security by way of pledge of shares, debentures and other<br />
securities.<br />
13. The provisions of any special statute applicable to chit fund / nidhi / mutual benefit fund/societies are not applicable to the<br />
company.<br />
14. In our opinion, the company is not a dealer or trader in shares, securities, debentures and other investments.<br />
15. In our opinion and according to the information and explanations given to us, the company has not given any guarantee for loans<br />
taken by others from banks of financial institutions during the year.<br />
16. In our opinion, and according to the information and explanations given to us, on an overall basis, the term loans have been<br />
applied for the purposes for which they were obtained.<br />
73<br />
17. On the basis of an overall examination of the balance sheet of the company, in our opinion and according to the information and<br />
explanations given to us, there are no funds raised on a short-term basis, which have been used for long-term investment.<br />
18. The company has not made any preferential allotment of shares to parties and companies covered in the register maintained<br />
under Section 301 of the Act during the year.<br />
19. The company has not issued any debenture during the year accordingly, no securities have been created.<br />
20. The company has not raised any money by public issues during the year.<br />
21. During the course of our examination of the books and records of the company, carried out in accordance with the generally<br />
accepted auditing practices in India, and according to the information and explanations given to us, we have neither come across<br />
any instance of material fraud on or by the company, noticed or reported during the year, nor have we been informed of such case<br />
by the management.<br />
Mumbai,<br />
Dated: April 27, 2005<br />
Partha Ghosh<br />
Partner<br />
Membership Number F-055913<br />
For and on behalf of Price Waterhouse<br />
Chartered Accountants
Balance Sheet<br />
Rs. In (’000s)<br />
As at 31st March, Schedules 2005 2004<br />
I. SOURCES OF FUNDS<br />
1. Shareholders’ Funds<br />
a) Share Capital 1 437,286 218,546<br />
b) Reserves and Surplus 2 2,429,774 2,132,109<br />
2,867,060 2,350,655<br />
2. Loan Funds<br />
a) Secured Loans 3 1,293,032 1,029,429<br />
b) Unsecured Loans 4 3,080,580 119,314<br />
4,373,612 1,148,743<br />
II.<br />
3. Deferred Tax Liability 5 386,111 293,181<br />
Less: Deferred Tax Assets 6 25,287 23,627<br />
360,824 269,554<br />
TOTAL 7,601,496 3,768,952<br />
APPLICATION OF FUNDS<br />
1. Fixed Assets 7<br />
a) Gross Block 2,586,231 1,723,534<br />
b) Less : Depreciation 493,221 346,864<br />
c) Net Block 2,093,010 1,376,670<br />
d) Capital Work-in-progress 129,050 244,966<br />
2,222,060 1,621,636<br />
2. Investments 8 264,564 299,372<br />
3. Current Assets, Loans And Advances<br />
a) Inventories 9 1,110,593 821,601<br />
b) Sundry Debtors 10 1,821,047 1,304,813<br />
c) Cash and Bank Balances 11 1,092,793 67,694<br />
d) Loans and Advances 12 1,871,872 392,538<br />
5,896,305 2,586,646<br />
Less : Current Liabilities And Provisions<br />
a) Current Liabilities 13 779,013 705,349<br />
b) Provisions 14 2,420 39,772<br />
781,433 745,121<br />
Net Current Assets 5,114,872 1,841,525<br />
4. Miscellaneous Expenditure 15 – 6,419<br />
(to the extent not written off or adjusted)<br />
TOTAL 7,601,496 3,768,952<br />
Notes To The Financial Statements 22<br />
Schedules referred to above and notes attached there to form an<br />
integral part of the Balance Sheet.<br />
74<br />
This is the Balance Sheet referred to in our report of even date.<br />
For and on behalf of<br />
Price Waterhouse<br />
Chartered Accountants<br />
For and on behalf of the Board of Directors<br />
Partha Ghosh M. J. Mendonza Glenn Saldanha Rajesh Desai<br />
Partner Vice President - Legal & Managing Director & CEO Director - Finance<br />
Membership Number - F 055913<br />
Company Secretary<br />
Mumbai, April 27, 2005
Profit and Loss Accounts<br />
Rs. In (’000s)<br />
For the year ended 31st March, Schedules 2005 2004<br />
INCOME<br />
Sales & Operating Income 16 5,364,310 3,806,606<br />
Other Income 17 54,856 29,803<br />
5,419,166 3,836,409<br />
EXPENDITURE<br />
Cost of Sales 18 2,617,580 1,793,191<br />
Selling and Operating Expenses 19 1,289,270 1,060,256<br />
Depreciation/Amortisation 7 149,836 108,891<br />
Interest 20 167,308 100,578<br />
Research and Development Expenses 21 325,819 248,073<br />
4,549,813 3,310,989<br />
Profit Before Tax 869,353 525,420<br />
Provision for Taxation<br />
– Current Year [includes wealth tax provision Rs. 275 (2004-Rs. 300)] 143,275 90,298<br />
– Deferred Tax 91,271 15,081<br />
Net Profit After Tax 634,807 420,041<br />
Balance Profit Brought Forward 496,938 235,883<br />
Net Profit Available For Appropriation 1,131,745 655,924<br />
Interim Dividend paid on Preference Shares 7,058 10,500<br />
Tax on Dividend paid on Preference Shares 922 1,345<br />
Interim Dividend on Equity Shares 83,035 77,020<br />
Tax on Interim Dividend paid on Equity Shares 11,646 9,868<br />
Transfer to Debenture Redemption Reserve – 253<br />
Transfer to General Reserve 65,000 60,000<br />
Balance Carried To Balance Sheet 964,084 496,938<br />
Earnings Per Share (Rs.) 22(2)<br />
Basic 5.29 3.57<br />
Diluted 4.81 3.55<br />
Face Value of Shares 2.00 2.00<br />
Notes To The Financial Statements 22<br />
Schedules referred to above and notes attached there to form an<br />
integral part of the Profit and Loss Account.<br />
75<br />
This is the Profit and Loss Account referred to in our report of even date.<br />
For and on behalf of<br />
Price Waterhouse<br />
Chartered Accountants<br />
For and on behalf of the Board of Directors<br />
Partha Ghosh M. J. Mendonza Glenn Saldanha Rajesh Desai<br />
Partner Vice President - Legal & Managing Director & CEO Director - Finance<br />
Membership Number - F 055913<br />
Company Secretary<br />
Mumbai, April 27, 2005
Cash Flow Statement<br />
Rs. In (’000s)<br />
Year ended 31st March, 2005 2004<br />
A. Cash Flow from Operating Activities:<br />
Net Profit Before Tax 869,353 525,420<br />
Adjustments for:<br />
Depreciation 149,836 108,891<br />
Interest Expense 166,285 98,677<br />
Interest Expense - Finance Lease 1,023 1,901<br />
Interest Income (11,815) (2,333)<br />
Income from Investment - Dividends (1,220) (1,245)<br />
(Profit)/Loss on Fixed Assets Sold (394) 720<br />
Deferred Revenue Expenditure Written off 6,419 17,657<br />
Provision for Bad & Doubtful Debts 14,600 11,800<br />
Provision for Gratuity & Leave Encashment 145 500<br />
Unrealised Foreign Exchange (Gain) /Loss 19,504 (9,102)<br />
Employee Stock Option Plan (1,202) (4,593)<br />
Operating Profit Before Working Capital Changes 1,212,534 748,293<br />
Adjustments for Changes in Working Capital :<br />
– (Increase)/Decrease in Sundry Debtors (542,410) (71,640)<br />
– (Increase)/Decrease in Other Receivables (108,655) (125,189)<br />
– (Increase)/Decrease in Inventories (288,992) (377,230)<br />
– Increase/(Decrease) in Trade and Other Payables 42,960 126,466<br />
Cash Generated from Operations 315,437 300,700<br />
– Taxes (Paid) / Received (Net of Tax deducted at source) (214,326) (62,343)<br />
Net Cash from Operating Activities 101,111 238,357<br />
76<br />
B. Cash Flow from Investing Activities:<br />
Purchase of Fixed Assets (866,978) (522,806)<br />
Capital Work in Progress 115,916 (12,495)<br />
Proceeds from Sale of Fixed Assets 21,747 250,000<br />
Proceeds from Sale of Investments 980,257 –<br />
Purchase of Investments (969,153) (138,246)<br />
Share Application Money for Subsidiary Companies. (11,685) (275)<br />
Loan to Subsidiary Company (1,310,486) –<br />
Finance Lease Rent Payment Against Principal Amount (6,345) (6,974)<br />
Interest Received 6,825 3,613<br />
Dividend Received 1,220 1,245<br />
Net Cash used in Investing Activities (2,038,682) (425,938)
Cash Flow Statement<br />
Rs. In (’000s)<br />
Year ended 31st March, 2005 2004<br />
C. Cash Flow from Financing Activities:<br />
Proceeds from Fresh Issue of<br />
Share Capital (Including Securities Premium ) 102,380 508,185<br />
Issue Expenses of FCCB (94,553) –<br />
Proceeds / (Repayment ) of Long Term Borrowings 519,668 (340,079)<br />
Proceeds /(Repayment) of Short Term Borrowings 2,953,566 65,450<br />
Proceeds from Cash Credits (NET) (249,719) 182,918<br />
Finance Lease Rent (Interest Part only) (1,023) (1,901)<br />
Interest Paid (172,067) (115,121)<br />
Dividend Paid (83,446) (76,224)<br />
Dividend Tax Paid (12,136) (8,471)<br />
Net Cash used in Financing Activities 2,962,670 214,757<br />
Net Increase/(Decrease) in Cash & Cash Equivalents 1,025,099 27,176<br />
Cash and Cash Equivalents as at 31.03.2004 67,694 40,518<br />
Cash and Cash Equivalents as at 31.03.2005 1,092,793 67,694<br />
Cash and Cash Equivalents Comprise<br />
Cash 1,317 836<br />
Deposits with Scheduled Banks 46,151 46,411<br />
Deposits with Non-scheduled Banks 1,006,890 –<br />
Balance with Scheduled Banks 35,336 20,171<br />
Balance with Non-scheduled Banks 3,099 276<br />
1,092,793 67,694<br />
77<br />
Notes :<br />
1. The Cash Flow Statement has been prepared under the “Indirect Method” as set out in<br />
Accounting Standard - 3 on Cash Flow Statements issued by the Institute of Chartered<br />
Accountants of India.<br />
2. Cash and cash equivalents includes Rs. 2,996 which are not available for use by<br />
the Company. (Refer schedule 13 to the financial statements)<br />
3. Figures in bracket indicate Cash outgo.<br />
This is the Cash Flow Statement referred to in our report of even date<br />
For and on behalf of<br />
Price Waterhouse<br />
Chartered Accountants<br />
For and on behalf of the Board of Directors<br />
Partha Ghosh M. J. Mendonza Glenn Saldanha Rajesh Desai<br />
Partner Vice President - Legal & Managing Director & CEO Director - Finance<br />
Membership Number - F 055913<br />
Company Secretary<br />
Mumbai, April 27, 2005
Schedules forming part of the Balance Sheet<br />
Rs. In (’000s)<br />
As at 31st March, 2005 2004<br />
1 Share Capital Note<br />
Authorised<br />
150,000,000 (2004 – 125,000,000) Equity Shares of Rs 2 each 6 300,000 250,000<br />
4,000,000 (2004 – 4,000,000) Cumulative Redeemable Non-convertible<br />
Preference Shares of Rs 100 each 400,000 400,000<br />
Unclassified Capital 50,000 100,000<br />
Issued, Subscribed and Paid-up<br />
118,621,140 (2004 – 59,245,570) Equity Shares of Rs 2 each 1 237,242 118,491<br />
Less: Calls in Arrears 1 3<br />
237,241 118,488<br />
10.5%, Nil (2004 – 1,000,000) Redeemable Cumulative Non-convertible – 100,000<br />
Preference Shares of Rs. 100 each (Redeemed on April 1, 2004 at par)<br />
7%, 2,000,000 (2004 – Nil) Redeemable Cumulative Non-convertible<br />
Preference Shares of Rs. 100 each 200,000 –<br />
(Redeemable at the end of 36 months from 29th September,2004<br />
with put/call option at the end of 12th month and 24th<br />
month from the date of allotment by giving minimum of 30 days notice.]<br />
Equity Share Warrants<br />
225,000 (2004 – 290,000) Equity Share Warrants of Rs. 0.20 each 45 58<br />
Total 437,286 218,546<br />
Notes :<br />
1. The Company has allotted bonus of 59,310,570 Equity Shares of Rs.2 each at the Board Meeting held on March 18,2005.<br />
2. In terms of Employee Stock Option Plan approved by the members, 225,000 (2004 – 290,000) convertible warrants are outstanding with<br />
<strong>Glenmark</strong> Pharmaceuticals Limited Employees Welfare Trust. Each Warrant carries an option and is convertible to one Equity Share of Rs. 2.<br />
During the year, 65,000 (2004 – 200,000) Warrants were converted into Equity Shares at an exercise price of Rs. 14.34 per Share.<br />
3. During the year ended March 31, 2005 the Company has cancelled 10,000 options pursuant to Employee Stock Option Plan 1999 and<br />
152,050 options pursuant to Employee Stock Option Scheme 2003 and granted 5,16,500 (2004 - 700,725 ) options pursuant to Employee<br />
Stock Option Scheme 2003 at a market price as defined in SEBI (ESOS) guidlines.As at March 31, 2005, 10,65,175 Stock Options were<br />
outstanding under Employee Stock Option Scheme 2003.On exercise of the options so granted under Employee Stock Option Scheme<br />
2003 the paid up Equity Share Capital of the Company will increase by a like number of Shares.<br />
4. As of March 31, 2005, 10,000 (2004 – 85,000) Warrants Issued to the employees of the Company, which are outstanding under Employee<br />
Stock Option Plan 1999. The options have been granted at an exercise price of Rs 14.34 per Share in respect of 10,000 Shares.<br />
5. Of the above Equity Shares, 79,185,570 (2004 -19,875,000) Shares of Rs 2 each are allotted as fully paid-up Bonus Shares by Capitalisation of<br />
Reserves.<br />
6. At the Extraordinary General Meeting held on February 17,2005, the Company has altered its Authorised Share Capital by classifying out of<br />
the unclassified Share Capital of Rs.100,000, unclassified Share Capital of Rs. 50,000 into 25,000,000 Equity Shares of Rs. 2 each.<br />
78
Schedules forming part of the Balance Sheet<br />
Rs. In (’000s)<br />
As at 31st March, 2005 2004<br />
2 Reserves and Surplus<br />
Note<br />
Securities Premium Account<br />
Balance at the beginning of the year 991,968 500,518<br />
Add: Issue of Shares/Conversion of ESOP 2,279 491,502<br />
Less: Calls in Arrears 19 52<br />
Less : Issue cost of FCCB 94,553 –<br />
Less: Issue of Bonus Shares 118,621 –<br />
Less : Redemption Premium of FCCB 22,365 –<br />
Closing Balance 758,689 991,968<br />
General Reserve<br />
Balance at the beginning of the year 610,773 550,773<br />
Add : Transferred from Profit & Loss Account 65,000 60,000<br />
Add : Transferred from Debenture Redemption Reserve Account 1 29,917 –<br />
Closing Balance 705,690 610,773<br />
Debenture Redemption Reserve<br />
Balance at the beginning of the year 29,917 29,664<br />
Addition during the year – 253<br />
Less: Transfer to General Reserve Account 1 (29,917) –<br />
Closing Balance – 29,917<br />
Capital Reserve<br />
Balance at the beginning of the year 1,000 1,000<br />
Addition during the year – –<br />
Closing Balance 1,000 1,000<br />
Employee Stock Option<br />
Employee Stock Options outstanding 2,052 8,219<br />
Less : Conversion of Option 1,425 5,283<br />
Less : Cancellation of Option 257 884<br />
A 370 2,052<br />
Deferred Employee Stock Compensation 539 2,113<br />
Less : Amortisation of ESOP expense. 448 1,436<br />
Less : Cancellation of Option 32 138<br />
B 59 539<br />
Net Employee Stock Option A - B 311 1,513<br />
Profit and Loss Account<br />
Balance 964,084 496,938<br />
Total 2,429,774 2,132,109<br />
79<br />
Note :<br />
1. Balance in Debenture Redemption Reserve Account transferred to General Reserve Account on Redemption of Non-convertible<br />
Debentures ‘NCD’ comprising of 10.05% NCD - A series aggregating Rs. 50 million and 10.35% NCD - B series aggregating<br />
Rs 90 million.<br />
3 Secured Loans<br />
Note<br />
Term Loan 1 1,000,000 350,000<br />
Non Convertible Debentures 2 – 140,000<br />
Loan from Banks for Working Capital 3 278,695 528,414<br />
Other Loans 4 14,337 11,015<br />
Total 1,293,032 1,029,429<br />
Notes :<br />
1. Term Loan is Secured by the Mortgage of Fixed Assets of the Company as a Security.
Schedules forming part of the Balance Sheet<br />
2. Non-convertible Debentures ‘NCD’ comprising of 10.05% NCD - A series aggregating Rs. 50 million and 10.35% NCD - B series aggregating<br />
Rs 90 million are redeemed during the year.<br />
3. Working Capital Loan from Banks are Secured by Hypothecation of Stocks of Raw Materials, Packing Materials, Finished Goods, work in<br />
progress, receivables etc. They are additionally secured by way of personal guarantees of some of the Directors and Equitable Mortgage on<br />
Fixed Assets at the manufacturing facility at Nasik and Research and Development Centre at Sinnar, Nasik.<br />
4. Other Loans are Secured by way of Hypothecation of Vehicles.<br />
Rs. In (’000s)<br />
As at 31st March, 2005 2004<br />
4 Unsecured Loans<br />
Note<br />
Short Term Loan – 105,117<br />
Foreign Currency Convertable Bonds 1 3,063,900 –<br />
Security Deposit 6,235 3,752<br />
Deferred Sales Tax Loan 2 10,445 10,445<br />
Total 3,080,580 119,314<br />
80<br />
Notes :<br />
1. During the year<br />
A) The Company had Issued 20,000 Zero Coupon Foreign Currency Convertible Bonds of USD 1,000 each (Rs.8,73,200 at Issue)<br />
(i) Convertible at the option of the bondholder at any time on or after 28th March, 2005 but prior to the close of business<br />
on 2nd January, 2010 at a fixed exchange rate of Rs.43.66 per 1 USD and price of Rs.862.394 per share of par value of Rs. 2<br />
per share subject to adjustment in certain events i.e. Issue of Bonus Shares, Division, Consolidation, Reclassification of<br />
Shares etc.<br />
(ii) Redeemable in whole but not in part at the option of the Company on or after 15th February, 2008 if closing price of the Share<br />
for each of the 25 consecutive trading days immediately prior to the date upon which notice of such Redemption is given was at<br />
least 130% of the applicable Early Redemption Amount divided by the Conversion Ratio.<br />
(iii) Redeemable on maturity date on 16th February, 2010 at 133.74% of its Principal Amount if not Redeemed or Converted earlier.<br />
The Redemption Premium of 33.74% payable on maturity of the bond if there is no Conversion of the Bond to be debited to<br />
Securities Premium Account evenly over the period of 5 years from the date of Issue of Bonds.<br />
B) The Company had Issued 50,000 Zero Coupon Foreign Currency Convertible Bonds of USD 1,000 each (Rs.21,83,000 at Issue)<br />
(i)<br />
(ii)<br />
(iii)<br />
Convertible at the option of the bond holder at any time on or after 15th November, 2006 but prior to the close of business on<br />
2nd January 2010 at a fixed exchange rate of Rs.43.66 per 1 USD and the price greater of 35% of the average of the order book<br />
volume–weighted-average-price of a Share on each Trading Day during the period commencing on 15th September and<br />
ending on 14th November, 2006 and the Floor Price (Rs.500) of par value of Rs.2 per share.<br />
Redeemable in whole but not in part at the option of the Company on or after 15th February, 2009 if closing price of the Share<br />
for each of the 25 consecutive trading days immediately prior to the date upon which notice of such redemption is given was at<br />
least 130% of the applicable Early Redemption Amount divided by the Conversion Ratio.<br />
Redeemable on maturity date on 16th February, 2010 at 134.07% of its Principal Amount if not redeemed or converted earlier.<br />
The Redemption Premium of 34.07% payable on maturity of the bond if there is no conversion of the bond to be debited to<br />
Securities Premium Account evenly over the period of 5 years from the date of Issue of Bonds.<br />
2. The Company has availed of an interest free Sales Tax Deferral Loan under Part I of the 1983 and 1988 Package Schemes of the Government<br />
of Maharashtra, repayable after twelve years in six half-yearly installments.<br />
5 Deferred Tax Liability [Refer Note (1)(ix) of Schedule 22]<br />
Liabilities<br />
Depreciation 386,111 291,291<br />
Others – 1,890<br />
Total 386,111 293,181
Schedules forming part of the Balance Sheet<br />
Rs. In (’000s)<br />
As at 31st March, 2005 2004<br />
6 DEFERRED TAX ASSET [Refer Note (1)(ix) of Schedule 22]<br />
Assets<br />
Provision for Bad Debts and Doubtful Advances 23,457 23,102<br />
Others 1,830 525<br />
Total 25,287 23,627<br />
7 FIXED ASSETS [Refer note (1)(ii) and (6) of Schedule 22]<br />
GROSS BLOCK DEPRECIATION/AMORTISATION NET BLOCK<br />
As on Additions Sales/ As on As on For the Sales/ As on As on As on<br />
1st Apr, during Disposals 31st Mar, 1st Apr, year Disposals 31st Mar, 31st Mar, 31st Mar,<br />
2004 the year during 2005 2004 of Assets 2005 2005 2004<br />
the year<br />
Tangible assets<br />
Freehold Land 5,710 – – 5,710 – – – – 5,710 5,710<br />
Leasehold Land 57,039 28,861 – 85,900 1,280 730 – 2,010 83,890 55,759<br />
Factory Buildings 159,287 186,904 - 346,191 22,706 7,907 – 30,613 315,578 136,581<br />
Other Buildings &<br />
Premises 267,410 26,871 975 293,306 16,045 4,513 175 20,383 272,923 251,365<br />
Plant and Machinery 187,119 201,703 2,232 386,590 21,242 16,652 200 37,694 348,896 165,877<br />
Furniture and Fixtures 128,942 59,978 – 188,920 35,332 20,248 – 55,580 133,340 93,610<br />
Equipments 518,880 343,059 1,273 860,666 105,337 57,067 158 162,246 698,420 413,543<br />
Vehicles 32,024 16,843 4,434 44,433 13,322 5,875 2,946 16,251 28,182 18,702<br />
Intangible assets<br />
– Computer Software 17,054 7,392 – 24,446 3,241 1,837 – 5,078 19,368 13,813<br />
– Brands 350,069 – – 350,069 128,359 35,007 – 163,366 186,703 221,710<br />
Total 1,723,534 871,611 8,914 2,586,231 346,864 149,836 3,479 493,221 2,093,010 1,376,670<br />
Previous Year 1,246,518 500,668 23,652 1,723,534 243,340 108,891 5,367 346,864 1,376,670 1,003,178<br />
81<br />
Capital Work-in-process including Capital Advances. 129,050 244,966<br />
Notes :<br />
1. Equipment and Vehicles include Assets aggregating Rs.19,559 (2004 – Rs.19,308) [net book value as at March 31, 2005 – Rs. 12,152 (2004 – Rs.14,338)] and<br />
Rs. 4,098 (2004 – Rs. 5,536) [net book value as at March 31, 2005 – Rs.2,087 (2004 – Rs. 3,708)], respectively, which have been acquired on finance lease.<br />
2. Additions to Assets include Rs. 12,423 (2004 – Rs.4,488) being borrowing costs.<br />
3. Estimated amount of contracts remaining to be executed on Capital Account, net of Advances, not provided for as at March 31, 2005 aggregate Rs.170,526<br />
(2004 – Rs.59,039)<br />
4. Capital Work in Progress includes :<br />
2005 2004<br />
At Ankleshwar Plant – 68,157<br />
At Mohol Plant 4,040 –<br />
At Baddi Plant 2,212 –<br />
At Goa Plant 11,768 57,145<br />
Capital Advances 104,791 109,854<br />
Other Work-in-processes 6,239 9,810
Schedules forming part of the Balance Sheet<br />
Rs. In (’000s)<br />
As at 31st March, 2005 2004<br />
8 INVESTMENTS [Refer Note (1)(iv) of Schedule 22]<br />
82<br />
Long Term Investments<br />
Quoted - Traded<br />
Equity Shares<br />
9,000 (2004 – 9,000) Bank of India of Rs.10 each [Market Value Rs. 931 (2004 – Rs. 530)] 405 405<br />
1,718 (2004 – 1,718) IDBI Bank Limited of Rs. 10 each [Market Value Rs.109 (2004 – Rs. 85)] 34 34<br />
439 439<br />
Unquoted - non trade<br />
National Savings Certificate -Sixth Issue 12 48<br />
1 (2004 – 1) Time Share of Dalmia Resorts Limited 20 20<br />
1 (2004 – 1) Equity Share of Esquados 340,000 of <strong>Glenmark</strong><br />
Pharmaceutica Limitada, Lisbon (Portugal) 48 48<br />
1,93,665 (2004 - 193665) Shares of Bharuch Eco-Aqua<br />
Infrastructure Limited of Rs. 10each, fully paid up. 1,937 1,937<br />
100,000 12% Cumulative Preference Shares of Rs 100 each fully paid up of<br />
Cheryl Laboratories (P) Limited 10,000 10,000<br />
1,350,000 7% Cumulative Preference Shares of Rs 100 each fully paid up of<br />
Marksans Pharma Ltd 135,000 135,000<br />
Investments in Subsidiary Companies<br />
a) 100,020 (2004 — 100,020) Equity Shares of Rs 10 each fully paid up of<br />
<strong>Glenmark</strong> Exports Limited 1,000 1,000<br />
b) 100,000 (2004 — 100,000) Equity Shares of Rs 10 each fully paid up of<br />
GM Pharma Limited 1,000 1,000<br />
c) Investment in Equity and Chartered of <strong>Glenmark</strong> Impex LLC, 12,812 12,812<br />
Russia [Roubles 8,235,958 (2004 - 8,235,958)]<br />
d) <strong>Glenmark</strong> Pharmaceuticals Inc.USA {Refer Note} – 110,492<br />
[NIL Shares (2004 - 2400000 Shares of USD 1 each)]<br />
e) <strong>Glenmark</strong> Farmaceutica Ltda, Brazil { Refer Note} [Reals NIL (2004 - Reals 1118857)] – 17,526<br />
f) <strong>Glenmark</strong> Philippines Inc., Philippines 9,050 9,050<br />
[56,000 Shares of Pesos 200 each (2004 - Share Capital -Pesos 11200000)]<br />
g) <strong>Glenmark</strong> Pharmaceuticals S.A.Switzerland 58,525 –<br />
[100,000 Shares of CHF 1 each fully paid up, 2,900,000 Shares of<br />
CHF 0.511 partly paid up]<br />
h) <strong>Glenmark</strong> Pharmaceuticals (U K) Ltd 32,640 –<br />
[389,000 Shares of Pound 1 each]<br />
i) <strong>Glenmark</strong> Pharmaceuticals Nigeria Ltd 1,581 –<br />
[4,605,096 Shares of Naira 1 each.]<br />
j) <strong>Glenmark</strong> Pharmaceuticals (Malaysia ) SDN.BHD * – –<br />
[2 Shares of RM 1 each.]<br />
k) <strong>Glenmark</strong> Organics Ltd 500 –<br />
[50,000 Shares of Rs.10 each]<br />
l ) <strong>Glenmark</strong> Dominican SA [50 Shares of RD 1000 each] – –<br />
m) <strong>Glenmark</strong> Chemicals Inc. USA [1000 Shares of USD 1 each] – –<br />
264,125 298,933<br />
Total 264,564 299,372<br />
*denotes amount less than Rs. 1 (‘000)<br />
Note During the year ended March 31, 2005 the Company had sold its entire shareholding in <strong>Glenmark</strong> Pharmaceuticals Inc., USA and<br />
<strong>Glenmark</strong> Farmaceutica Ltda, Brazil to its wholly owned subsidiary <strong>Glenmark</strong> Pharmaceuticals S.A. at the original cost in Indian<br />
rupees based on the valuation carried out by the independent valuers.
Schedules forming part of the Balance Sheet<br />
Rs. In (’000s)<br />
As at 31st March, 2005 2004<br />
9 Inventories [Refer Note (1)(v) of Schedule 22]<br />
(As certified by the Management)<br />
Raw Materials 327,752 280,413<br />
Packing Material 32,610 29,685<br />
Work-in-process 267,667 223,462<br />
Stores and Spares 3,670 2,574<br />
Finished Goods 478,894 285,467<br />
Total 1,110,593 821,601<br />
10 Sundry Debtors<br />
Outstanding for more than six months<br />
Secured, considered good – –<br />
Unsecured, considered good 328,033 147,936<br />
Unsecured, considered doubtful 53,598 38,998<br />
381,631 186,934<br />
Less: Provision for doubtful debts 53,598 38,998<br />
328,033 147,936<br />
Other debts –<br />
Secured, considered good – –<br />
Unsecured, considered good 1,493,014 1,156,877<br />
1,493,014 1,156,877<br />
Total 1,821,047 1,304,813<br />
Debts due from Subsidiary Companies,<br />
<strong>Glenmark</strong> Exports Ltd. Rs. 393,435 (2004 – Rs. 218,617),<br />
<strong>Glenmark</strong> Pharmaceuticals Inc., USA Rs. 637 (2004 - Rs.Nil),<br />
<strong>Glenmark</strong> Pharmaceuticals S.A. Rs. 3,877 (2004 - Nil),<br />
<strong>Glenmark</strong> Pharmaceuticals Inc., Philippines Rs.23,691(2004 – Nil).<br />
83<br />
11 Cash and Bank Balances<br />
Cash in hand 1,317 836<br />
Balances with Scheduled Banks<br />
– Current Accounts 26,755 17,967<br />
– Margin Money Account 41,646 42,092<br />
– EEFC Account 8,581 2,203<br />
– Deposit Accounts 4,505 4,319<br />
Balances with Non Scheduled Banks<br />
– Current Accounts 3,099 276<br />
– Deposit Accounts 1,006,890 –<br />
Total 1,092,793 67,694<br />
The balances in the margin money accounts are given as security against guarantees issued by banks on behalf of the<br />
Company.
Schedules forming part of the Balance Sheet<br />
Rs. In (’000s)<br />
As at 31st March, 2005 2004<br />
12 Loans and Advances (unsecured, considered good)<br />
Advances to Subsidiaries<br />
<strong>Glenmark</strong> Pharmaceuticals Inc., U.S.A. [Maximum during the year 31,653 –<br />
Rs.1,868 ( 2004 – Rs. 7,944)]<br />
<strong>Glenmark</strong> Pharmaceuticals (UK) Ltd. [Maximum during the year 2,104 –<br />
Rs. 2,104 (2004 – Rs. NIL)]<br />
<strong>Glenmark</strong> Pharmaceuticals S A, Switzerland. [Maximum during the year 1,324,053 –<br />
Rs. 1,339,219 (2004 – Rs. NIL)]<br />
<strong>Glenmark</strong> Exports Limited [Maximum during the year Rs. 24,619 (2004 – Rs. 13,673)] 24,619 13,673<br />
<strong>Glenmark</strong> Farmaceutica Ltda, Brazil [Maximum during the year 1,139 1,139<br />
Rs. 11,364 ( 2004 – Rs.1,139)]<br />
<strong>Glenmark</strong> Pharmaceuticals Nigeria Ltd., Lagos. [Maximum during . 1,271 –<br />
the year Rs. 1,271 (2004 – Rs. NIL)]<br />
<strong>Glenmark</strong> Philippines Inc.Manilla [ Maximum during the year Rs. 48 (2004 – Rs. NIL)] 48 –<br />
GM Pharma Ltd [ Maximum during the year Rs. 1,137 (2004 – Rs. NIL)] 1,137 –<br />
Share Application money - pending allotment<br />
– <strong>Glenmark</strong> Philippines Inc., Philippines 11,584 275<br />
[Pesos 14,324,800 (2004 - Pesos 340,260) ]<br />
– <strong>Glenmark</strong> Pharmaceuticals (Malaysia) SDN.BHD [RM 31,803] 377 –<br />
Advance to Vendors 147,070 130,275<br />
Advances recoverable in cash or kind or for value to be received 181,331 167,666<br />
Advance tax (net of provision) [Refer Note (1) (ix) of Schedule 22] 34,022 –<br />
Balance with Excise Authorities 59,669 19,620<br />
Deposits 51,795 59,890<br />
Total 1,871,872 392,538<br />
13 Current Liabilities<br />
Acceptances 70,416 92,842<br />
Sundry creditors - Small scale industrial undertakings [Refer note (5) of Schedule 22] 16,527 20,867<br />
- Others 469,290 350,891<br />
Investor Education and Protection Fund shall be credited by<br />
– Unclaimed Dividend 2,996 2,364<br />
[There are no amounts due and outstanding to be credited to Investor Education<br />
and Protection Fund.]<br />
Advances from Customers 1,899 3,049<br />
Payable to Subsidiaries<br />
– <strong>Glenmark</strong> Pharmaceuticals Inc., U.S.A. – 199<br />
Other Liabilities 98,379 138,662<br />
Interest accrued but not due 24,825 8,242<br />
Interim Dividend on Equity Shares 83,035 77,020<br />
Tax on Interim Dividend 11,646 9,868<br />
Tax on Preference Dividend – 1,345<br />
Total 779,013 705,349<br />
84<br />
14 Provisions<br />
Wealth Tax 275 300<br />
Income-Tax (Net of Advance Tax) [ Refer Note (1) (ix) of Schedule 22] – 37,472<br />
Provision for Gratuity and Leave encashment 2,145 2,000<br />
Total 2,420 39,772<br />
15 Miscellaneous Expenditure [Refer Note (1) (xi) of Schedule 22]<br />
(to the extent not written off or adjusted)<br />
Implementation expenses of ERP system – 1,147<br />
Product launch, investigation and registration expenses – 5,272<br />
Total – 6,419
Schedules to the Profit & Loss Account<br />
Rs. In (’000s)<br />
For the year ended 31st March, 2005 2004<br />
16 Sales and Operating Income [refer Note (1) (vii) of Schedule 22]<br />
Sale of goods and I P assets* 5,354,417 3,796,569<br />
Income from services 9,893 10,037<br />
Total 5,364,310 3,806,606<br />
* includes sales tax and excise duty aggregating Rs 288,020 (2004 — Rs 255,771) and<br />
Rs 434,423 (2004 — Rs 340,561) respectively.<br />
17 Other Income<br />
Lease Rent [tax deducted at source Rs.403 (2004 — Rs. 403)] 1,920 1,920<br />
Interest Income [tax deducted at source Rs.468 (2004 — Rs. 400)] 11,815 2,333<br />
Dividend received 1,220 1,245<br />
Export Incentive 17,019 7,613<br />
Profit on sale of fixed assets 394 –<br />
Miscellaneous income 22,488 16,692<br />
Total 54,856 29,803<br />
85<br />
18 Cost of Sales<br />
Salary, wages and allowances 83,580 38,320<br />
Labour charges 99,024 82,227<br />
Consumption of raw & packing materials 1,447,949 966,088<br />
Purchase of Trading goods 322,761 286,013<br />
Excise duty paid 426,865 308,398<br />
Sales tax 288,020 255,771<br />
Power, fuel and water charges 74,059 31,365<br />
Consumable stores 45,076 24,583<br />
Repairs and maintenance - plant and machinery 50,120 17,066<br />
Rent, rates and taxes 759 1,578<br />
Other manufacturing expenses 16,999 540<br />
(Increase)/decrease in inventory (237,632) (218,758)<br />
Total 2,617,580 1,793,191
Schedules to the Profit & Loss Account<br />
Rs. In (’000s)<br />
For the year ended 31st March, 2005 2004<br />
19 Selling and Operating Expenses<br />
Salary and allowances 309,963 256,391<br />
Staff welfare 12,894 7,801<br />
Directors’ salaries and allowances 50,201 44,762<br />
Incentive and commission 38,274 40,978<br />
Sales promotion expenses 245,247 184,386<br />
Export Commission 17,710 7,935<br />
Commission on sales 8,027 4,154<br />
Travelling expenses 202,716 151,626<br />
Freight outward 97,621 71,847<br />
Telephone expenses 20,955 19,431<br />
Rates and taxes 17,166 14,040<br />
Provision for doubtful debts 14,600 11,800<br />
Insurance premium 13,357 9,173<br />
Electricity charges 9,552 7,258<br />
Rent 18,471 12,975<br />
Repairs & Maintenance 49,365 39,135<br />
Auditors’ remuneration -<br />
Audit fees 1,250 1,100<br />
Other matters 1,250 1,020<br />
Out of pocket expenses 32 30<br />
Loss on sale of assets – 720<br />
Other operating expenses 160,619 173,694<br />
Total 1,289,270 1,060,256<br />
20 Interest Expense<br />
On loans from banks 83,943 35,777<br />
Other interest 83,365 64,801<br />
Total 167,308 100,578<br />
21 Research and Development Expenses [refer Note (1) (viii)of Schedule 22]<br />
86<br />
Salary and other allowances 115,423 71,328<br />
Staff welfare expenses 8,103 4,633<br />
Directors’ Remuneration 1,242 2,517<br />
Consumable & Chemicals 85,637 80,560<br />
Electricity charges 18,694 12,777<br />
Repairs and maintenance 18,375 12,192<br />
Insurance premium 540 283<br />
Other expenses 77,805 63,783<br />
Total 325,819 248,073
Schedules forming part of the Financial Statements<br />
For the year ended 31st March, 2005<br />
22 Notes to the Financial Statements<br />
1) SIGNIFICANT ACCOUNTING POLICIES<br />
i) Basis of Accounting<br />
The financial statements are prepared under the historical cost convention, on the accrual basis of accounting, in conformity with<br />
accounting principles generally accepted in India.<br />
ii)<br />
iii)<br />
iv)<br />
Fixed assets and depreciation<br />
Fixed assets are stated at cost less accumulated depreciation. The Company capitalises all costs relating to the acquisition and<br />
installation of fixed assets. Expenditure of revenue nature, incurred in setting up of new projects, is capitalised as an indir ect cost<br />
towards construction of the fixed assets. Exchange differences relating to the acquisition of fixed assets are adjusted in the cost of the<br />
assets.<br />
Depreciation is provided using the straight line method, pro-rata to the period of use of assets, based on the useful lives of fixed assets<br />
as estimated by management, or at the rates specified in Schedule XIV of the Companies Act, 1956, whichever is higher.<br />
Fixed assets having aggregate cost of Rs 5,000 or less are depreciated fully in the year of acquisition.<br />
The company has estimated the useful life of its assets as follows:<br />
Category<br />
Estimated useful life<br />
(in years)<br />
Plant and machinery 8 - 20<br />
Vehicles 5 - 6<br />
Equipments and air conditioners 4 - 20<br />
Furniture and fixtures 10<br />
Brands 10<br />
Leasehold land is amortised over the period of lease.<br />
Foreign currency transactions<br />
Foreign currency transactions during the year are recorded at the rates of exchange prevailing on the date of the transaction.<br />
Foreign currency assets and liabilities are translated into rupees at the exchange rates prevailing on the date of the balance sheet.<br />
All exchange differences are dealt with in the statement of profit and loss, except those relating to the acquisition of fixed assets,<br />
which are adjusted in the cost of the respective fixed assets.<br />
Investments<br />
Long term investments are stated at cost. Provision, where necessary, is made to recognize a decline, other than temporary, in the<br />
value of the investments.<br />
87<br />
v) Inventories<br />
Inventories of raw materials, packing materials, work-in-process and finished goods are valued at cost or net realisable value,<br />
whichever is lower. Cost of raw materials and packing materials is ascertained on a first-in-first out basis. Cost of work-in- process and<br />
finished goods includes the cost of materials consumed, labour and manufacturing overheads. Excise and customs duty accrued on<br />
production or import of goods, as applicable, is included in the valuation of inventories.<br />
vi)<br />
Employee Benefits<br />
Retirement benefits to employees comprise payments towards gratuity, superannuation and provident fund under the schemes of<br />
the Company and encashment of leave. <strong>Annual</strong> contributions to the superannuation and provident funds are charged to the<br />
statement of profit and loss.<br />
The employee leave encashment and gratuity schemes are administered through the Life Insurance Corporation of India. <strong>Annual</strong><br />
contributions as determined by the LIC are charged to the statement of profit and loss.<br />
In respect of stock options granted to employees under the Company’s Employee Stock Option Plan (‘ESOP’), the excess of the market<br />
price of the share at the date of grant of the option over its exercise price is treated as a form of employee compensation in the<br />
financial statements of the company. This amount is amortised on a straight-line basis over the vesting period. The unamortised<br />
portion is carried forward as deferred employee compensation.
Schedules forming part of the Financial Statements<br />
For the year ended 31st March, 2005<br />
22 Notes to the Financial Statements (Contd.)<br />
vii) Revenue recognition<br />
The company recognizes revenue on dispatch of goods to customers. Revenues from services are recognized on completion of such<br />
services. Revenue from IP asset/Marketing rights is recognized on transfer of ownership/right to use in accordance with the terms of<br />
relevant agreements. Revenue from contract research being in the nature of product development activities is recognized as per<br />
the terms of the agreement. Revenues are recorded at invoice value, inclusive of excise duty and sales-tax, but net of returns and<br />
trade discounts.<br />
viii) Research and development<br />
Capital expenditure on research and development (R&D) is capitalised as fixed assets.Development cost relating to the new and<br />
improved product and/or process development is recognised as an intangible asset to the extent that it is expected that such asset<br />
will generate future economical benefits. Other research and development costs is expensed as incurred.<br />
ix)<br />
Income-tax<br />
Provision for current income-taxes is made on the assessable income at the tax rate applicable to the relevant assessment year.<br />
Deferred income taxes are recognised for the future tax consequences attributable to timing differences between the financial<br />
statement determination of income and their recognition for tax purposes. The effect on deferred tax assets and liabilities because of<br />
a change in tax rates is recognised in statement of profit and loss using the tax rates and tax laws that have been enacted or substantively<br />
enacted by the balance sheet date.<br />
Deferred tax assets are recognised and carried forward only to the extent that there is a reasonable certainty that sufficient future<br />
taxable income will be available against which such deferred tax assets can be realised.<br />
Prior / Earlier year’s income tax is charged to the Profit and Loss account on payment and the same is disclosed separately.<br />
x) Leases<br />
Finance leases<br />
Assets acquired under finance lease are recognised as assets with corresponding liabilities in the balance sheet at the<br />
inception of the lease at amounts equal to the fair value of the leased asset or, if lower, at the present value of the minimum<br />
lease payments. These leased assets are depreciated in line with the Company’s policy on depreciation of fixed assets. The<br />
interest is allocated to periods during the lease term so as to produce a constant periodic rate of interest on the remaining<br />
balance of the liability for each period.<br />
Operating leases<br />
Lease payments for operating leases are recognised as expense on a straight-line basis over the lease term.<br />
Lease income from operating leases is recognised as income on a straight-line basis over the lease term. Initial direct costs are<br />
recognised immediately as an expense.<br />
88<br />
xi)<br />
Miscellaneous expenditure<br />
Product launch expenditure<br />
Earlier years’ expenditure on launch of new products and their sales promotion is being amortised over a period of three years.<br />
Implementation expenses of Enterprise Resource Planning system.<br />
Earlier year’s expenditure incurred on payments for infrastructure facilities and expenditure incurred on user license fees for an<br />
Enterprise Resource Planning system is being amortised over a period of thirty-six months.<br />
xii) Borrowing costs<br />
Borrowing costs that are attributable to the acquisition and construction of a qualifying asset are capitalised as a part of the cost of<br />
the asset.Other borrowing costs are recognised as an expense in the year in which they are incurred.<br />
xiii) Impairment of Assets<br />
The Company assesses at each balancesheet date whether there is any indication that an asset may be impaired.If any such indication<br />
exist , the Company estimates the recoverable amount of the asset . If such recoverable amount of the asset or the recoverable<br />
amount of the cash generating unit to which the asset belongs is less than its carring amount ,the carrying amount is reduced to its<br />
recoverable amount.The reduction is treated as an impairment loss and is recognised in the profit and loss account.If at the
Schedules forming part of the Financial Statements<br />
For the year ended 31st March, 2005<br />
22 Notes to the Financial Statements (Contd.)<br />
balancesheet date there is an indication that if a previously assessed impairment loss no longer exist, the recoverable amount is<br />
reassessed and the asset is reflected at the recoverable amount.<br />
xiv) Provisions and Contingent Liabilities<br />
The Company recognises a provision when there is a present obligation as a result of a past event that probably requires an<br />
outflow of resources and a reliable estimate can be made of the amount of the obligation. A disclosure for a contingent<br />
liability is made when there is a possible obligation or a present obligation that may, but probably will not , require an<br />
outflow of resources.Where there is a possible obligation or a present obligation that the likelihood of outflow of resources<br />
is remote, no provision or disclosure is made.<br />
2) EARNINGS PER SHARE<br />
Basic earnings per share are calculated by dividing the net profit for the year attributable to equity shareholders (net profit for the year<br />
less dividends on preference shares) by the weighted average number of equity shares outstanding during the year.<br />
For the purpose of calculating diluted earnings per share, the net profit attributable to equity shareholders and the weighted<br />
average number of shares outstanding are adjusted for the effects of all dilutive potential equity shares from the exercise of<br />
options on unissued share capital. The number of equity shares is the aggregate of the weighted average number of equity shares<br />
and the weighted average number of equity shares, which would be issued on the conversion of all the dilutive potential equity<br />
shares into equity shares. Options on unissued equity share capital are deemed to have been converted into equity shares on the<br />
date when the options are exercised.<br />
The calculations of earnings per share (basic and diluted) are based on the earnings and number of shares as computed below.<br />
Rs. In (’000s)<br />
Reconciliation of earnings 31st March, 31st March,<br />
2005 2004<br />
Profit after tax for the financial year 634,807 420,041<br />
Less:<br />
Preference dividends 7,058 10,500<br />
Dividend tax on preference shares 922 1,345<br />
Net profit attributable to equity shareholders for calculation of Basic EPS 626,827 408,196<br />
Reconciliation of number of shares<br />
Shares<br />
Shares<br />
Weighted average number of shares:<br />
For basic earnings per share 118,581 114,357<br />
Add:<br />
Deemed exercise of options on unissued equity share capital 1,062 548<br />
Conversion of FCC Bonds 10,757 –<br />
For diluted earnings per share 130,400 114,905<br />
Earnings per share (nominal value Rs. 2 each) Rs. Rs.<br />
Basic 5.29 3.57<br />
Diluted 4.81 3.55<br />
EPS for previous year have been recomputed considering Bonus issue.<br />
89<br />
3) SEGMENT INFORMATION<br />
Business segments<br />
The Company is primarily engaged in a single segment business of manufacturing and marketing of pharmaceuticals formulations and<br />
active ingredients and is managed as one entity, for its various activities and is governed by a similar set of risks and returns.<br />
Geographical segments<br />
The operations of the Company are largely confined to India, with exports contributing to 30.26% of its annual sales. Hence, in the view of<br />
the management, the Indian and export markets represent geographical segments.
Schedules forming part of the Financial Statements<br />
For the year ended 31st March, 2005<br />
22 Notes to the Financial Statements (Contd.)<br />
Sales by market – The following is the distribution of the Company’s sale by geographical market:<br />
2005 2004<br />
Geographical segment Rs. In ‘000s Rs. In ‘000s<br />
India 3,741,223 3,152,961<br />
Other than India* 1,623,087 653,645<br />
Total 5,364,310 3,806,606<br />
* includes deemed exports aggregating Rs 292,359 (2004 – Rs. 152,642)<br />
Assets and additions to fixed assets by geographical area – The following table shows the carrying amount of segment assets and additions<br />
to fixed assets by geographical area in which the assets are located:<br />
India Others* India Others*<br />
2005 2005 2004 2004<br />
Rs. In ‘000s Rs. In ‘000s Rs. In ‘000s Rs. In ‘000s<br />
Carrying amount of segment assets 6,391,149 1,833,930 3,773,369 459,143<br />
Additions to tangible assets 871,611 – 500,669 –<br />
* Others represent receivables from debtors located outside India including those related to deemed exports and cash and bank balances<br />
outside india.<br />
90<br />
4) RELATED PARTY DISCLOSURES<br />
a) Parties where control exists<br />
Wholly owned subsidiary companies<br />
<strong>Glenmark</strong> Dominicana S.A.<br />
<strong>Glenmark</strong> Impex LLC , Russia<br />
<strong>Glenmark</strong> Philippines Inc., Philippines<br />
Laboratorios Klinger Do Brazil Ltda<br />
<strong>Glenmark</strong> Farmaceutica Ltda, Brazil<br />
<strong>Glenmark</strong> Organics Ltd.<br />
<strong>Glenmark</strong> Exports Ltd.<br />
GM Pharma Ltd<br />
<strong>Glenmark</strong> Pharmaceuticals Inc,USA.<br />
<strong>Glenmark</strong> Pharmaceuticals (U.K.) Ltd , U.K.<br />
<strong>Glenmark</strong> Pharmaceuticals Nigeria Ltd.<br />
<strong>Glenmark</strong> Pharmaceuticals SDN.BHD.<br />
<strong>Glenmark</strong> Pharmaceuticals S.A.<br />
<strong>Glenmark</strong> Chemicals Inc.<br />
b) Related party relationships where transactions have taken place during the year<br />
Subsidiary Companies<br />
<strong>Glenmark</strong> Exports Limited<br />
<strong>Glenmark</strong> Pharmaceuticals Inc., USA<br />
<strong>Glenmark</strong> Farmaceutica Ltda, Brazil<br />
<strong>Glenmark</strong> Philippines Inc., Philippines<br />
<strong>Glenmark</strong> Pharmaceuticals (U.K.) Ltd , U.K.<br />
<strong>Glenmark</strong> Pharmaceuticals Nigeria Ltd.<br />
<strong>Glenmark</strong> Pharmaceuticals S.A.<br />
<strong>Glenmark</strong> Pharmaceuticals SDN.BHD.<br />
<strong>Glenmark</strong> Organics Ltd.<br />
GM Pharma Ltd
Schedules forming part of the Financial Statements<br />
For the year ended 31st March, 2005<br />
22 Notes to the Financial Statements (Contd.)<br />
c) Key management personnel (includes directors of the Company)<br />
Mr. Gracias Saldanha<br />
Mrs. B.E. Saldanha<br />
Mr. Glenn Saldanha<br />
Mrs. Cheryl Pinto<br />
Mr. R.V. Desai<br />
Mr. A.S. Mohanty<br />
d) Transactions with related parties during the year Rs. In (‘000s)<br />
31st March,<br />
31st March,<br />
2005 2004<br />
Subsidiary company<br />
Sale of finished products 694,174 150,750<br />
<strong>Glenmark</strong> Exports Limited 292,359 149,009<br />
<strong>Glenmark</strong> Pharmaceuticals Inc., USA 1,014 1,741<br />
<strong>Glenmark</strong> Pharmaceuticals S.A. 370,987 –<br />
<strong>Glenmark</strong> Pharmaceuticals Inc., Philippines 29,814 –<br />
Sale of Investment 1,004,522 –<br />
<strong>Glenmark</strong> Pharmaceuticals S.A. 1,004,522<br />
Advance received 17,480 –<br />
<strong>Glenmark</strong> Pharmaceuticals S.A. 17,480<br />
Advances given 41,042 2,223<br />
<strong>Glenmark</strong> Pharmaceuticals Inc., USA 476 1,084<br />
<strong>Glenmark</strong> Farmaceutica Ltda, Brazil – 1,139<br />
<strong>Glenmark</strong> Philippines Inc., Philippines 48 –<br />
<strong>Glenmark</strong> Pharmaceuticals S.A. 11,387 –<br />
<strong>Glenmark</strong> Pharmaceuticals (U.K.) Ltd , U.K. 2,104 –<br />
<strong>Glenmark</strong> Pharmaceuticals Nigeria Ltd. 1,271 –<br />
GM Pharma Ltd 1,137 –<br />
<strong>Glenmark</strong> Exports Limited 24,619 –<br />
Loan given to 1,320,712 –<br />
<strong>Glenmark</strong> Farmaceutica Ltda, Brazil 10,226<br />
<strong>Glenmark</strong> Pharmaceuticals S.A. 1,310,486<br />
Loan repaid by 9,628 –<br />
<strong>Glenmark</strong> Pharmaceuticals S.A. 9,628<br />
Product Development Expenses incurred on behalf of 204,985 –<br />
<strong>Glenmark</strong> Pharmaceuticals Inc., USA 204,985<br />
Purchase of finished goods from <strong>Glenmark</strong><br />
Pharmaceuticals Inc., USA – 3,025<br />
Purchase of service from <strong>Glenmark</strong> Pharmaceuticals (U.K.)<br />
Ltd 266 –<br />
Reimbursement of expenses to <strong>Glenmark</strong> Exports Limited 55,037 26,740<br />
91
Schedules forming part of the Financial Statements<br />
For the year ended 31st March, 2005<br />
22 Notes to the Financial Statements (Contd.)<br />
d) Transactions with related parties during the year (Contd.)<br />
31st March,<br />
31st March,<br />
2005 2004<br />
Investment in Share Capital 980,806 129,399<br />
<strong>Glenmark</strong> Pharmaceuticals Inc., USA 305,146 102,548<br />
<strong>Glenmark</strong> Farmaceutica Ltda, Brazil 570,762 17,526<br />
<strong>Glenmark</strong> Philippines Inc., Philippines 11,309 9,325<br />
<strong>Glenmark</strong> Pharmaceuticals S.A. 58,525 –<br />
<strong>Glenmark</strong> Pharmaceuticals (U.K.) Ltd , U.K. 32,640 –<br />
<strong>Glenmark</strong> Pharmaceuticals SDN.BHD. 377 –<br />
<strong>Glenmark</strong> Pharmaceuticals Nigeria Ltd. 1,582 –<br />
<strong>Glenmark</strong> Organics Ltd. 465 –<br />
Key management personnel<br />
Remuneration paid to these personnel have been disclosed<br />
in note 10 of Schedule 22.<br />
Personal guarantees given by directors have been<br />
disclosed in Schedule 3.<br />
e) Related party balances<br />
Receivable from wholly owned subsidiary companies 1,807,664 233,429<br />
<strong>Glenmark</strong> Exports Limited 418,054 232,290<br />
G.M. Pharma Ltd 1,137 –<br />
<strong>Glenmark</strong> Farmaceutica Ltda, Brazil 1,139 1,139<br />
<strong>Glenmark</strong> Pharmaceuticals Inc., USA 32,290 –<br />
<strong>Glenmark</strong> Philippines Inc., Philippines 23,738 –<br />
<strong>Glenmark</strong> Pharmaceuticals S.A. 1,327,931 –<br />
<strong>Glenmark</strong> Pharmaceuticals (U.K.) Ltd , U.K. 2,104 –<br />
<strong>Glenmark</strong> Pharmaceuticals Nigeria Ltd. 1,271 –<br />
Payable to subsidiary company<br />
<strong>Glenmark</strong> Pharmaceuticals Inc., USA – 199<br />
92<br />
5) OUTSTANDING DUES TO SMALL SCALE INDUSTRIAL UNDERTAKINGS<br />
The small scale industrial undertakings to whom amounts are outstanding for more than 30 days are:<br />
Rs. In (’000s)<br />
31st March,<br />
31st March,<br />
2005 2004<br />
Alcap Containers Pvt Ltd 273 456<br />
Blown Enterprise 452 76<br />
Corneilo Packaging 275 59<br />
Joy Enterprise 3 3<br />
K K Alu Foil 237 706<br />
K Laminates 185 249<br />
Manju Industrial Ancillaries 38 126<br />
Print Paks (India) 26 26<br />
Rajlaxmi Plastics 78 330<br />
Super Label Mfg Co. 15 14<br />
Varsha Plast 2 2<br />
Waxoils Pvt Ltd 351 126<br />
Speciality Caps 56 –
Schedules forming part of the Financial Statements<br />
For the year ended 31st March, 2005<br />
22 Notes to the Financial Statements (Contd.)<br />
Rs. In (’000s)<br />
31st March, 31st March,<br />
2005 2004<br />
Aviditya Chem. Corpn. – 36<br />
Plascap Industries – 162<br />
Mahesh Industry 1,364 3,306<br />
Kraft-Pack Containers 89 94<br />
Autofits 863 13<br />
Crown Closures Pvt Ltd 756 186<br />
D M Printers 3 32<br />
Servewell Printers 1,087 1,086<br />
Pharma Plastics 254 254<br />
Desicca Chemicals – 1<br />
Renuka Industries – 73<br />
Standard Packprints Pvt Ltd 157 207<br />
Eskay Packaging – 107<br />
Mahalsa Chemicals 64 –<br />
Bina Packaging & Printers Pvt Ltd 3,680 413<br />
Supreme Alutainers p. ltd – 91<br />
Agarwal ISPAT Udyog 44 –<br />
Akshar Ent. – 4<br />
Glindia Chemicals 96 –<br />
Lifeline Drugs & Intermeduates Pvt. Ltd. 728 –<br />
Dayaram Chemicals – 128<br />
Plastic pigments p. ltd – 8<br />
Synthochem Pvt. Ltd. – 59<br />
11,176 8,433<br />
Amount outstanding for less than 30 days 5,351 12,434<br />
Total 16,527 20,867<br />
93<br />
6) LEASES<br />
a) The Company has entered into operating and finance lease agreements for the rental<br />
of property, vehicles,computers, equipment and other assets. Typically, lease<br />
agreements are for a period of three to five years.<br />
At March 31 2005, the Company had commitments under non-cancellable finance<br />
leases as follows:<br />
Minimum lease payments<br />
Due within one year 4,146 7,368<br />
Due later than one year and not later than five years – 4,146<br />
Total 4,146 11,514<br />
Present value of minimum lease payments<br />
Due within one year 2,728 5,528<br />
Due later than one year and not later than five years – 2,728<br />
Total 2,728 8,256<br />
b) The Company has leased out its manufacturing facility at Panoli, Gujarat and the same has been<br />
capitalised in the books of account in accordance with Accounting Standard 19 - “Leases”<br />
issued by The Institute of Chartered Accountants of India in this regard.
Schedules forming part of the Financial Statements<br />
For the year ended 31st March, 2005<br />
94<br />
22 Notes to the Financial Statements (Contd.)<br />
Rs. In (’000s)<br />
31st March, 31st March,<br />
2005 2004<br />
Depreciation has been provided based on the estimated useful life of the asset.<br />
(i) Details in respect of assets given on operating Lease<br />
Gross Block<br />
Leasehold Land 4,259 4,259<br />
Factory Buildings 22,065 22,065<br />
Plant and Machinery 5,838 5,838<br />
Equipments 3,764 3,764<br />
Furniture and Fixtures 165 165<br />
36,091 36,091<br />
Accumulated depreciation<br />
Leasehold Land 215 172<br />
Factory Buildings 4,039 3,302<br />
Plant and Machinery 1,382 1,104<br />
Equipments 1,572 1,272<br />
Furniture and Fixtures 83 66<br />
7,291 5,916<br />
Depreciation 1,375 1,375<br />
(ii) The lease income of Rs.1,920 (2004 — Rs. 1,920) has been accrued on the basis of the<br />
lease agreement executed with the lessees. This lease is cancellable by notice of 30 days<br />
on either side.<br />
c) The Company has taken godowns/residential & office premises at various locations in the<br />
country.<br />
i) The Company’s significant leasing arrangements are in respect of the above plant,<br />
godowns & premises (Including furniture and fittings therein, as applicable). The<br />
aggregate lease rentals payable are charged to Profit and Loss Account as Rent in<br />
Schedule 18 ,19 & 21.<br />
ii) The Leasing arrangements which are cancellable range between 11 months and 3 years.<br />
They are usually renewable by mutual consent on mutually agreeable terms. Under<br />
these arrangements, generally refundable interest free deposits have been given. An<br />
amount of Rs. 16,088 towards deposit and unadjusted advance rent is recoverable from<br />
the lessor.<br />
7) The Company has entered into an arrangement with it’s wholly owned subsidiary (WOS) for<br />
undertaking product development work and to provide complete information concerning the<br />
product formulation. As per the arrangement, the WOS shall pay fees for such services on an arm’s<br />
length basis on completion of formulation development and pivotal bio-studies and on submission<br />
of product dossier for the regulatory filings. However no fees have been recognized during<br />
the year, as the above-mentioned activities have not been completed till the year-end.<br />
8) The Finance Act,2001 has introduced, with effect from Assessment Year 2002-03 (effective April<br />
1,2001 ), detailed Transfer Pricing regulations for computing the taxable income and expenditure<br />
from ‘International transaction ‘ between ‘Associated enterprises’ on an ‘ arm’s length ‘ basis.These<br />
regulations ,inter alia , also require the maintenance of prescribed documents and information<br />
including furnishing a report from an Accountant on or before October 31, 2005.<br />
For the year ended March 31,2004,the Company had undertaken a transfer pricing study and<br />
obtained the prescribed certificate of the Accountant to comply with the said transfer pricing<br />
regulations which did not envisage any tax liability.<br />
For the tax year ended March 31, 2005 the Company had carried out a study to comply with the<br />
said transfer pricing regulations.
Schedules forming part of the Financial Statements<br />
For the year ended 31st March, 2005<br />
22 Notes to the Financial Statements (Contd.)<br />
Rs. In (’000s)<br />
31st March, 31st March,<br />
2005 2004<br />
9) CONTINGENT LIABILITIES NOT PROVIDED FOR<br />
Bank guarantees 11,649 9,981<br />
Corporate guarantee – 50,000<br />
Disputed taxes/duties 3,434 –<br />
Labour / Industrial disputes 1,141 1,120<br />
Open letters of credit 94,945 83,350<br />
Sundry debtors factored with recourse option 100,000 91,677<br />
Channel financing with recourse option 24,231 14,159<br />
Call money payable to <strong>Glenmark</strong> Pharmaceuticals S.A. (@ 0.4889 CHF per equity share ) 51,754 –<br />
10) COMPUTATION OF NET PROFITS IN ACCORDANCE WITH<br />
SECTION 349 AND SECTION 309(5) OF THE COMPANIES ACT, 1956<br />
Profit before taxation as per statement of profit and loss 869,353 525,420<br />
Add: Depreciation as per statement of profit and loss 149,836 108,891<br />
Provision for Doubtful Debts & Advances 14,600 11,800<br />
Loss on sale of assets as per statement of profit and loss – 848<br />
1,033,789 646,959<br />
Less: Depreciation calculated under section 350 of the<br />
Companies Act, 1956 149,836 108,891<br />
Profit on sale of assets as per statement of profit and loss 394 128<br />
Net profit in accordance with Section 349 883,559 537,940<br />
Add: Managerial remuneration paid/payable to directors 50,614 48,850<br />
Net profit in accordance with Section 309(3) of the 934,173 586,790<br />
Companies Act, 1956<br />
Maximum managerial remuneration allowed under Section 198 of the<br />
Companies Act, 1956, 11 per cent of the above 102,759 64,547<br />
Managerial remuneration paid/payable to directors<br />
Salaries,perquisites & Other benefits 21,421 19,609<br />
Commission 26,412 26,806<br />
Sitting Fees 280 201<br />
Contribution to PF & Superannuation Fund 2,501 2,234<br />
50,614 48,850<br />
95<br />
Name of Directors 2005 2004<br />
1. Mr. Gracias Saldanha 9,377 10,104<br />
2. Mrs. B. E. Saldanha 8,079 7,177<br />
3. Mr. Glenn Saldanha 20,572 14,560<br />
4. Mrs. Cheryl Pinto 5,325 7,411<br />
5. Other Directors 7,261 9,598
Schedules forming part of the Financial Statements<br />
For the year ended 31st March, 2005<br />
22 Notes to the Financial Statements (Contd.)<br />
11) CAPACITY, PRODUCTION, SALES AND STOCKS<br />
(a) Capacities and actual production (includes samples) Rs. In (’000s)<br />
Class of goods Installed capacity Actual production<br />
UoM 2005 2004 2005 2004<br />
Injectibles Ltrs – – 113,700 75,646<br />
Liquid orals Ltrs 2,475,000 2,475,000 2,053,821 1,860,730<br />
Lotions and externals Ltrs 450,000 450,000 431,037 385,689<br />
Ointments and creams Kgs 780,000 780,000 429,602 408,965<br />
Solids and powders Kgs 105,000 105,000 122,715 198,151<br />
Tablets and capsules Nos 570,000,000 240,000,000 505,600,000 385,100,000<br />
Bulk drugs Kgs 300,000 60,000 47,815 18,832<br />
Notes:<br />
(i) The products of the Company are exempt from licencing procedures.<br />
(ii) Installed capacity, being a technical matter, has not been verified by the auditors. However, the management has certified the<br />
same.<br />
(iii) Actual production includes goods manufactured at third party manufacturing facilities on loan licence basis and at leased<br />
facilities.<br />
(iv) Installed capacity of Tablets and capsules has been increased due to production started at Goa plant.<br />
(b) Sales Rs. In (’000s)<br />
Product 2005 2004<br />
UoM Qty Value Qty Value<br />
Injectibles Ltrs 114,275 154,878 76,211 139,548<br />
Liquid orals Ltrs 2,383,306 731,468 2,298,267 676,726<br />
Lotions and externals Ltrs 461,246 416,878 492,514 435,245<br />
Ointments and creams Kgs 447,977 830,456 407,882 723,888<br />
Solids and powders Kgs 107,523 46,715 186,404 68,423<br />
Tablets and capsules Nos 692,842,900 2,077,286 441,025,700 1,433,031<br />
Bulk drugs 27,023 719,847 295,681<br />
Cardiac diagnostic services 9,893 10,037<br />
Others 376,889 24,027<br />
Total 5,364,310 3,806,606<br />
1. Sales are net of sales returns.<br />
2. Sales quantities does not include free issues, samples and breakages.<br />
(c) Finished goods purchased (includes samples) Rs. In (’000s)<br />
96<br />
Product 2005 2004<br />
UoM Qty Value Qty Value<br />
Injectibles Ltrs 1,657 23,796 1,293 1,699<br />
Liquid orals Ltrs 404,692 58,491 445,181 80,331<br />
Lotions and externals Ltrs 48,189 22,915 147,840 41,184<br />
Ointments and creams Kgs 18,144 13,960 13,553 12,328<br />
Tablets and capsules Nos 194,721,000 193,572 65,887,200 132,944<br />
Solids & Powders Kgs 300 108 - -<br />
Bulk Drugs Kgs 1,682 9,919 2,797 17,527<br />
Total 322,761 286,013
Schedules forming part of the Financial Statements<br />
For the year ended 31st March, 2005<br />
22 Notes to the Financial Statements (Contd.)<br />
(d) Raw and packing materials consumed (quantities in kgs) Rs. In (’000s)<br />
Products 2005 2004<br />
Qty Value Qty Value<br />
Valdecoxib 1,760 35,505 2,698 60,191<br />
Etoricoxib 9,148 343,411 840 59,742<br />
Rosuvastatin Calcium 99 41,803 92 48,175<br />
Linezolid 1,229 32,251 702 21,852<br />
Linezolid purified IV grade – – 242 6,946<br />
Telmisartan 1,113 62,619 408 27,438<br />
Mupirocin 143 21,078 148 24,853<br />
Cefuroxime sodium sterile BP / USP 466 11,143 678 19,843<br />
Cefdinir 249 10,153 445 18,914<br />
Propylene Glycol I.P./ B.P. 264,356 21,118 264,335 17,337<br />
Tacrolimus 2,209 18,322 1,587 16,373<br />
Acarbose 578 22,058 355 15,356<br />
Glycerine Refined IP/BP 245,728 11,778 219,247 11,985<br />
Sugar - S/30 952,009 14,997 888,662 11,806<br />
Itraconazole Pellets 1,336 11,856 1,072 9,514<br />
Pregelatinised starch BP/USP 2,503 1,300 4,188 9,134<br />
Sorbitol Soln 70% IP 503,923 9,961 448,457 9,099<br />
Beclomethasone Dipropionate IP/BP 52,533 8,516 47 8,918<br />
Cefuroxime Axetil 100% Amorophous 787 13,083 431 8,652<br />
Esomeprazole Mag Trihydrate 916 9,843 838 8,558<br />
Ketoconazole IP/BP 1,452 7,043 1,214 8,432<br />
Cilastazol 412 7,736 378 8,033<br />
Nateglinide – – 279 7,774<br />
5-CHLRO-6-METHYL-3-(4-METHYL<br />
SULFONYL) 3,800 122,891 1,201 50,718<br />
METHYL 6-METHYLNICOTINATE 15,517 43,493 – –<br />
Tetra Hydro Furan(THF) 322,608 36,261 148,351 13,606<br />
Others 529,730 462,839<br />
Total 1,447,949 966,088<br />
97<br />
(e) Break-up of Materials and Consumable stores consumed Rs. In (’000s)<br />
2005 2004<br />
Value % Value %<br />
Materials<br />
Imported materials 360,987 24.93 282,466 29.24<br />
Indigenously procured 1,086,961 75.07 683,622 70.76<br />
Total 1,447,948 100.00 966,088 100.00<br />
Consumable stores<br />
Imported – – – –<br />
Indigenously procured 45,076 100.00 24,583 100.00<br />
Total 45,076 100.00 24,583 100.00
Schedules forming part of the Financial Statements<br />
For the year ended 31st March, 2005<br />
22 Notes to the Financial Statements (Contd.)<br />
(f) Inventories of finished goods (includes samples) Rs. In (’000s)<br />
Opening Stock<br />
Closing Stock<br />
2005 2004 2005 2004<br />
Products UoM Qty Value Qty Value Qty Value Qty Value<br />
Injectibles Ltrs 20,004 19,330 16,597 29,066 23,679 23,151 20,004 19,330<br />
Liquid orals Ltrs 148,822 29,755 201,403 34,683 276,991 46,922 148,822 29,755<br />
Lotions and externals Ltrs 63,206 21,578 40,772 14,959 70,839 25,049 63,206 21,578<br />
Ointments and creams Kgs 53,169 41,851 39,019 26,088 58,478 50,761 53,169 41,851<br />
Solids and powders Kgs 15,680 2,874 5,876 1,228 34,062 4,777 15,680 2,874<br />
Tablets and capsules Nos 67,633,200 157,822 70,909,000 132,247 132,013,000 313,563 67,633,200 157,822<br />
Others 8,806 51 3,352 8,806<br />
Bulk Drugs 3,451 305 11,319 3,451<br />
Total 285,467 238,322 478,894 285,467<br />
12) VALUE OF IMPORTS ON CIF BASIS ( on payment basis )<br />
Rs. In (’000s)<br />
31st March,<br />
31st March,<br />
2005 2004<br />
Capital Goods 89,646 76,821<br />
Raw Materials 347,359 219,869<br />
Total 437,005 296,690<br />
13) EARNINGS IN FOREIGN CURRENCY ( on accrual basis )<br />
Export of goods 1,291,578 486,384<br />
Others 9,777 3,155<br />
Total 1,301,355 489,539<br />
14) EXPENDITURE IN FOREIGN CURRENCY ( on payment basis )<br />
Travelling expenses 9,102 4,568<br />
Professional & Consultancy charges 100,040 34,847<br />
Others 186,043 116,312<br />
Total 295,185 155,727<br />
98<br />
15) DIVIDEND REMITTANCE IN FOREIGN CURRENCY<br />
Number of Non-resident Shareholders 12 12<br />
Number of Equity Shares held by them 284,750 290,250<br />
Amount of dividend paid (Gross), TDS Rs Nil (2004 – Rs Nil) 370,175 377,325<br />
Year to which dividend relates 2003-04 2002-03<br />
16) PRIOR YEAR COMPARATIVES<br />
Prior year’s figures have been regrouped wherever necessary.
Balance Sheet Abstract & Company’s General Business Profile<br />
(Amount in Rs. ‘000s)<br />
(a) Registration Details<br />
Registration No. 1 9 9 8 2 State Code 1 1<br />
Balance Sheet Date 3 1 0 3 2 0 0 5<br />
Date Month Year<br />
(b)<br />
(c)<br />
(d)<br />
Capital raised during the year<br />
Public issue<br />
Rights issue<br />
N I L N I L<br />
Bonus issue<br />
Private Placement<br />
1 1 8 6 2 1 N I L<br />
Preferential offer of shares under Employee stock option scheme<br />
2 3 5 7<br />
Position of mobilisation and deployment of funds<br />
Total liabilities including shareholders funds<br />
Total assets<br />
8 4 0 8 2 1 6 8 4 0 8 2 1 6<br />
SOURCES OF FUNDS<br />
Paid-up capital<br />
Reserves and surplus<br />
4 3 7 2 8 6 2 4 2 9 7 7 4<br />
Secured loans<br />
Unsecured loans<br />
1 2 9 3 0 3 2 3 0 8 0 5 8 0<br />
APPLICATION OF FUNDS<br />
Net fixed assets<br />
Investments<br />
2 2 2 2 0 6 0 2 6 4 5 6 4<br />
Net current assets<br />
Miscellaneous expenditure<br />
5 1 1 4 8 7 2 N I L<br />
Accumulated losses<br />
N I L<br />
Performance of the Company<br />
Turnover ( Total Income )<br />
Total expenditure<br />
5 4 1 9 1 6 6 4 5 4 9 8 1 3<br />
Profit/(loss) before tax<br />
Profit/(loss) after tax<br />
8 6 9 3 5 3 6 3 4 8 0 7<br />
Basic Earnings per share in Rs.<br />
Diluted Earnings per share in Rs.<br />
5 . 2 9 4 . 8 1<br />
Dividend rate<br />
35%<br />
99<br />
Signatures to Schedules 1 to 22<br />
For and on behalf of<br />
Price Waterhouse<br />
Chartered Accountants<br />
For and on behalf of the Board of Directors<br />
Partha Ghosh M. J. Mendonza Glenn Saldanha Rajesh Desai<br />
Partner Vice President - Legal & Managing Director & CEO Director - Finance<br />
Membership Number - F 055913<br />
Company Secretary<br />
Mumbai, April 27, 2005
100<br />
SECTION 212<br />
STATEMENT PURSUANT TO SECTION 212 OF THE COMPANIES ACT, 1956, RELATING TO COMPANY’S INTEREST IN SUBSIDIARY COMPANIES:<br />
No. Name of the Company <strong>Glenmark</strong> GM <strong>Glenmark</strong> <strong>Glenmark</strong> <strong>Glenmark</strong> Labora- <strong>Glenmark</strong> <strong>Glenmark</strong> <strong>Glenmark</strong> <strong>Glenmark</strong> <strong>Glenmark</strong> <strong>Glenmark</strong> <strong>Glenmark</strong> <strong>Glenmark</strong><br />
Exports Pharma Organics Impex Farma- toris Pharma- Philip- Pharma- Chemicals Pharma- Dominican Pharma- Pharma-<br />
Ltd. Ltd. Ltd. L.L.C. ceutica Klinger Do ceuticals pines ceuticals, Inc.,USA ceuticals S.A. ceuticals ceuticals<br />
ltda. Brazil Ltda (U.K.)Ltd. Inc., Inc., USA (Nigeria) (Malaysia) S.A.,<br />
Ltd. SDN BHD Switzerland<br />
1 The financial year of the 31-Mar-05 31-Mar-05 31-Mar-05 31-Dec-04 31-Dec-04 31-Dec-04 31-Mar-05 31-Mar-05 31-Dec-04 31-Dec-04 31-Dec-04 31-Dec-04 31-Dec-04 31-Dec-04<br />
Subsidiary Companies<br />
ended<br />
2 Date from which they 10-Sep-96 5-Oct-99 15-Sep-04 7-May-01 Not Not 10-Feb-04 28-Jan-04 Not 29-Mar-04 28-Apr-04 1-Jun-04 22-Jul-04 2-Jul-04<br />
became subsidiary Applicable. Applicable. Applicable.<br />
(Wholly (Wholly (Wholly<br />
owned owned owned<br />
subsidary subsidary subsidary<br />
of of of<br />
<strong>Glenmark</strong> <strong>Glenmark</strong> <strong>Glenmark</strong><br />
Pharma- Farma- Pharmaceuticals<br />
ceutica ceuticals<br />
S.A., Itda. Brazil) S.A.,<br />
Switzerland) Switzerland)<br />
3. a. Number of shares held by 1,00,020 1,00,000 50,000 1 share Not Not 389,000 56000 Not 1,000 4,605,096 50 2 shares 100,000<br />
<strong>Glenmark</strong> Pharmaceuticals Equity Equity shares Roubles Applicable Applicable shares shares Applicable shares shares shares of RM shares of<br />
Ltd. in the subsidiary Shares of Shares of Rs.10/- 8,235,958 (36,809,476 (26,362,000 of £ 1 of 200 (7,900,000 of US $ 1 of N 1.00 of RD 1/- each CHF 1 each<br />
companies at the end of Rs.10/- of Rs.10/- each. Equity Equity each. Pesos shares each. each 1,000 fully paid<br />
financial year of Subsidiary each fully each Shares Shares each of US$ 1 each. 2,90,000<br />
Companies paid up fully of BRL of BRL each) shares of<br />
paid up 1/- each held 1/- each held CHF 0.511<br />
by <strong>Glenmark</strong> by <strong>Glenmark</strong> partly paid<br />
Pharma- Farmaceauticals<br />
SA, ceutica Ltd.,<br />
Switzerland) Brazil)<br />
3. b. Extent of interest of 100% 100% 100% 100% 100% 100% 100% 100% 100% 100% 100% 100% 100% 100%<br />
holding Company at the<br />
end of the financial year<br />
of the subsidiary companies<br />
4 The net aggregate amount of<br />
the subsidiary companies’<br />
Profit/ (Loss) so far as it<br />
concerns the members of the<br />
holding company:<br />
For and on behalf of the Board of Directors<br />
M. J. Mendonza Glenn Saldanha Rajesh Desai<br />
Mumbai, Vice President - Legal & Managing Director & CEO Director - Finance<br />
April 27, 2005<br />
Company Secretary<br />
4.a. Not dealt within the holding<br />
company’s accounts:<br />
4.a.1. For the financial year ended<br />
31st March, 2005 Nil (5,400) (45,019) (2,262,790) (2,273,517) 30,158,465 (24,290,790) (5,538,590) (16,711,458) Nil (2,436,840) Nil (389,130) 824,619,690<br />
4.a.2. For the previous financial years<br />
(excluding current year) of<br />
the Subsidiary Companies<br />
since they became the holding<br />
company’s subsidiaries 7,378,445 (7,420) Nil Nil Nil Nil Nil Nil (6,636,191) Nil Nil Nil Nil Nil<br />
4.b. Dealt within the holding<br />
company’s accounts:<br />
4.b.1. For the financial year ended<br />
31st March, 2005 Nil Nil Nil Nil Nil Nil Nil Nil Nil Nil Nil Nil Nil Nil<br />
4.b.2. For the previous financial years<br />
of the subsidiary companies<br />
since they became the holding<br />
company’s subsidiaries Nil Nil Nil Nil Nil Nil Nil Nil Nil Nil Nil Nil Nil Nil
Consolidated Auditors’ <strong>Report</strong><br />
Auditors’ report to the Board of Directors of <strong>Glenmark</strong> Pharmaceuticals Limited on the Consolidated Financial Statements of<br />
GLENMARK PHARMACEUTICALS LIMITED AND ITS SUBSIDIARIES.<br />
1. We have audited (refer para 3) the attached consolidated Balance Sheet of <strong>Glenmark</strong> Pharmaceuticals Limited and its subsidiaries (the<br />
Group) as at March 31, 2005 and also the consolidated Profit and Loss Account and the consolidated Cash Flow Statement for the year<br />
ended on that date annexed thereto. These consolidated financial statements are the responsibility of the <strong>Glenmark</strong> Pharmaceuticals<br />
Limited’s management and have been prepared by the management on the basis of separate financial statements and other financial<br />
information regarding components. Our responsibility is to express an opinion on these financial statements based on our audit.<br />
2. We conducted our audit in accordance with the auditing standards generally accepted in India. Those Standards require that we plan and<br />
perform the audit to obtain reasonable assurance about whether the financial statements are free of material misstatements. An audit<br />
includes examining, on a test basis, evidence supporting the amounts and disclosures in the financial statements. An audit also includes<br />
assessing the accounting principles used and significant estimates made by management, as well as evaluating the overall financial<br />
statement presentation. We believe that our audit provides a reasonable basis for our opinion.<br />
3. We did not audit the financial statements of subsidiaries, <strong>Glenmark</strong> Dominicana SA, <strong>Glenmark</strong> Impex LLC, <strong>Glenmark</strong> Philippines Inc,<br />
Laboratorios Klinger Do Brazil Ltda, <strong>Glenmark</strong> Farmaceutica Ltda, <strong>Glenmark</strong> Organics Ltd, <strong>Glenmark</strong> Exports Ltd, GM Pharma Ltd, <strong>Glenmark</strong><br />
Pharmaceuticals Inc USA, <strong>Glenmark</strong> Pharmaceuticals (UK) Ltd, <strong>Glenmark</strong> Pharmaceuticals Nigeria Ltd, <strong>Glenmark</strong> Pharmaceuticals SDN.BHD,<br />
<strong>Glenmark</strong> Pharmaceuticals SA and <strong>Glenmark</strong> Chemicals Inc whose financial statements reflect the Group’s share of total assets of<br />
Rs. 26,714.38 lakhs as at March 31, 2005 and the Group’s share of total revenues of Rs.10,485.81 lakhs and net cash inflows amou nting to<br />
Rs. 1,747.35 lakhs for the year ended on that date as considered in the consolidated financial statements. These financial statements and<br />
other information of the subsidiaries have been audited by other auditors/ special auditors whose reports have been furnished to us, and<br />
our opinion, in so far as it relates to the amounts included in respect of these subsidiaries, is based solely on the report of other auditors.<br />
4. We report that the consolidated financial statements have been prepared by the <strong>Glenmark</strong> Pharmaceuticals Limited’s management in<br />
accordance with the requirements of Accounting Standard 21, Consolidated Financial Statements issued by the Institute of Chartered<br />
Accountants of India.<br />
5. Based on our audit and on consideration of the reports of other auditors on separate financial statements and on the other<br />
financial information of the components, in our opinion and to the best of our information and according to the explanations<br />
given to us, the attached consolidated financial statements give a true and fair view in conformity with the accounting principles<br />
generally accepted in India:<br />
a) in the case of the consolidated Balance Sheet, of the state of affairs of <strong>Glenmark</strong> Pharmaceuticals Limited Group as at March 31,<br />
2005;<br />
101<br />
b) in the case of the consolidated Profit and Loss Account, of the profit of <strong>Glenmark</strong> Pharmaceuticals Limited Group for the year<br />
ended on that date; and<br />
c) in the case of the consolidated Cash Flow Statement, of the cash flows of <strong>Glenmark</strong> Pharmaceuticals Limited Group for the year<br />
ended on that date.<br />
For and on behalf of Price Waterhouse<br />
Mumbai,<br />
Dated: July 29, 2005<br />
Partha Ghosh<br />
Partner<br />
Membership Number F-055913<br />
Chartered Accountants
Consolidated Balance Sheet<br />
Rs. In (’000s)<br />
As at 31st March, Schedules 2005 2004<br />
I. SOURCES OF FUNDS<br />
1. Shareholders’ Funds<br />
a) Share Capital 1 437,286 218,546<br />
b) Reserves and Surplus 2 2,852,333 2,125,091<br />
3,289,619 2,343,637<br />
2. Minority Interest - Share Capital – 4,365<br />
3. Loan Funds<br />
a) Secured Loans 3 1,294,192 1,029,429<br />
b) Unsecured Loans 4 3,080,580 119,314<br />
4,374,772 1,148,743<br />
4. Deferred Tax Liability 5 386,111 293,181<br />
Less: Deferred Tax Assets 6 76,978 28,153<br />
309,133 265,028<br />
Total 7,973,524 3,761,773<br />
II.<br />
APPLICATION OF FUNDS<br />
1. Fixed Assets 7<br />
a) Gross Block 3,890,385 1,838,830<br />
b) Less : Depreciation 518,175 349,176<br />
c) Net Block 3,372,210 1,489,654<br />
d) Capital Work-in-Progress 130,625 251,853<br />
3,502,835 1,741,507<br />
2. Investments 8 152,117 147,492<br />
3. Current Assets, Loans and Advances<br />
a) Inventories 9 1,194,215 821,601<br />
b) Sundry Debtors 10 2,375,584 1,304,813<br />
c) Cash and Bank Balances 11 1,272,755 81,255<br />
d) Loans and Advances 12 578,660 402,470<br />
5,421,214 2,610,139<br />
Less : Current Liabilities and Provisions<br />
a) Current Liabilities 13 1,119,783 727,726<br />
b) Provisions 14 2,420 39,702<br />
1,122,203 767,428<br />
Net Current Assets 4,299,011 1,842,711<br />
4. Miscellaneous Expenditure 15 19,561 30,063<br />
(to the extent not written off or adjusted)<br />
Total 7,973,524 3,761,773<br />
Notes To The Financial Statements 22<br />
Schedules referred to above and notes attached there to form an integral part of the Balance Sheet.<br />
102<br />
This is the Balance Sheet referred to in our report of even date.<br />
For and on behalf of<br />
Price Waterhouse<br />
Chartered Accountants<br />
For and on behalf of the Board of Directors<br />
Partha Ghosh M. J. Mendonza G. Saldanha Rajesh Desai<br />
Partner Vice President - Legal & Chairman Director - Finance<br />
Membership Number - F 055913<br />
Company Secretary<br />
Mumbai, July 29, 2005
Consolidated Profit And Loss Account<br />
Rs. In (’000s)<br />
For the year ended 31st March, Schedules 2005 2004<br />
INCOME<br />
Sales & Operating Income 16 6,120,532 3,806,606<br />
Other Income 17 52,285 34,662<br />
6,172,817 3,841,268<br />
EXPENDITURE<br />
Cost of Sales 18 2,714,675 1,793,191<br />
Selling and Operating Expenses 19 1,521,825 1,074,266<br />
Depreciation/Amortisation 7 164,232 110,930<br />
Interest 20 172,631 100,578<br />
Research and Development Expenses 21 326,512 248,073<br />
4,899,875 3,327,038<br />
Profit Before Tax 1,272,942 514,230<br />
Provision for Taxation<br />
– Current Year [includes wealth tax provision Rs. 275(2004-Rs. 300)] 156,542 90,334<br />
– Deferred tax 44,989 10,555<br />
Net Profit After Tax before Minority Interest 1,071,411 413,341<br />
Share of loss transfer to Minority – 265<br />
Net Profit After Tax & Minority Interest 1,071,411 413,606<br />
Balance Profit brought forward 497,882 243,262<br />
Share of loss acquired from Minority (Refer note 11 of Schedule 22) 265 –<br />
Net Profit Available for Appropriation 1,569,028 656,868<br />
Interim Dividend paid on Preference Shares 7,058 10,500<br />
Tax on Dividend paid on Preference Shares 922 1,345<br />
Interim Dividend on Equity Shares 83,035 77,020<br />
Tax on Interim Dividend paid on Equity Shares 11,646 9,868<br />
Transfer to Debenture Redemption Reserve – 253<br />
Transfer to General Reserve 65,000 60,000<br />
Balance Carried to Balance Sheet 1,401,367 497,882<br />
Earnings Per Share (Rs.) 22(4)<br />
Basic 8.97 3.51<br />
Diluted 8.16 3.50<br />
Face Value of Shares 2.00 2.00<br />
Notes to the Financial Statements 22<br />
Schedules referred to above and notes attached there to form an integral part of the Profit and Loss Account.<br />
103<br />
This is the Profit and Loss Account referred to in our report of even date.<br />
For and on behalf of<br />
Price Waterhouse<br />
Chartered Accountants<br />
For and on behalf of the Board of Directors<br />
Partha Ghosh M. J. Mendonza G. Saldanha Rajesh Desai<br />
Partner Vice President - Legal & Chairman Director - Finance<br />
Membership Number - F 055913<br />
Company Secretary<br />
Mumbai, July 29, 2005
Consolidated Cash Flow Statement<br />
Rs. In (’000s)<br />
Year ended 31st March 2005 2004<br />
A. Cash flow from Operating Activities:<br />
Net Profit before Tax 1,272,942 514,230<br />
Adjustments for:<br />
Depreciation 164,232 110,930<br />
Interest Expense 171,608 98,677<br />
Interest Expense - Finance Lease 1,023 1,901<br />
Interest Income (8,419) (2,422)<br />
Income from Investment - Dividends (1,220) (1,245)<br />
(Profit)/Loss on Fixed Assets sold (394) 720<br />
Deferred Revenue Expenditure 10,502 6,285<br />
Provision for Bad & Doubtful Debts 14,600 11,800<br />
Provision for Gratuity & Leave Encashment 145 500<br />
Unrealised Foreign Exchange (gain) /loss 14,118 (9,102)<br />
Employee Stock Option Plan (1,202) (4,593)<br />
Operating Profit before Working Capital changes 1,637,935 727,681<br />
Adjustments for changes in Working Capital :<br />
– (increase)/decrease in Sundry Debtors (1,096,948) (75,705)<br />
– (increase)/decrease in Other Receivables (171,181) (125,596)<br />
– (increase)/decrease in Inventories (372,614) (377,230)<br />
– increase/(decrease) in Trade and Other Payables 361,353 146,856<br />
Cash generated from Operations 358,545 296,006<br />
– Taxes (paid) / received (Net of Tax Deducted at Source) (214,474) (62,379)<br />
Net Cash from Operating Activities 144,071 233,627<br />
B. Cash flow from Investing Activities:<br />
Purchase of Fixed Assets (1,865,009) (637,192)<br />
Acquisition of Fixed Assets (183,027) –<br />
Capital Work in Progress 121,229 (19,382)<br />
Proceeds from Sale of Fixed Assets 22,489 250,000<br />
Proceeds from Sale of Investments 36 –<br />
Purchase of Investments (4,661) (1,178)<br />
Finance Lease Rent payment against Principal amount (6,345) (6,974)<br />
Interest Received 7,862 3,701<br />
Dividend Received 1,220 1,245<br />
Capital Reserve on acquisition of <strong>Glenmark</strong> Organics Ltd. 127 –<br />
Acquisition of Minority Interest (4,365) 4,365<br />
Net Cash used in Investing Activities (1,910,444) (405,415)<br />
104
Consolidated Cash Flow Statement<br />
Rs. In (’000s)<br />
Year ended 31st March 2005 2004<br />
C. Cash flow from Financing Activities:<br />
Proceeds from Fresh Issue of<br />
Share Capital (including Securities Premium ) 102,380 508,185<br />
Issue Expenses of FCCB (94,553) –<br />
Proceeds / (Repayment ) of Long Term Borrowings 520,828 (340,079)<br />
Receipt /(Repayment) of Short Term Borrowings 2,961,266 65,450<br />
Proceeds from Cash Credits (Net) (249,719) 182,918<br />
Finance Lease Rent (Interest Part only) (1,023) (1,901)<br />
Interest Paid (177,390) (115,121)<br />
Dividend Paid (83,446) (76,224)<br />
Dividend Tax Paid (12,136) (8,471)<br />
Net Cash used in Financing Activities 2,966,207 214,757<br />
Net Increase/(Decrease) in Cash & Cash Equivalents 1,199,834 42,969<br />
Cash and Cash Equivalents as at 31.03.2004 81,255 45,699<br />
Consolidation Adjustment (8,334) (7,413)<br />
Cash and Cash Equivalents as at 31.03.2005 1,272,755 81,255<br />
Cash and Cash Equivalents comprise<br />
Cash 1,537 897<br />
Deposits with Scheduled Banks 49,195 4,319<br />
Deposits with Non-Scheduled Banks 1,006,890 –<br />
Balance with Scheduled Banks 43,009 75,763<br />
Balance with Non-Scheduled Banks 172,124 276<br />
1,272,755 81,255<br />
Notes :<br />
1 The Cash Flow Statement has been prepared under the “Indirect Method” as set out in Accounting Standard - 3 on Cash Flow<br />
Statements issued by the Institute of Chartered Accountants of India.<br />
2 Cash and Cash Equivalents includes Rs. 2,996 which are not available for use by the Company. (Refer schedule 13 to the Financial<br />
Statements)<br />
3 Figures in bracket indicate Cash Outgo.<br />
105<br />
This is the Cash Flow Statement referred to in our report of even date<br />
For and on behalf of<br />
Price Waterhouse<br />
Chartered Accountants<br />
For and on behalf of the Board of Directors<br />
Partha Ghosh M. J. Mendonza G. Saldanha Rajesh Desai<br />
Partner Vice President - Legal & Chairman Director - Finance<br />
Membership Number - F 055913<br />
Company Secretary<br />
Mumbai, July 29, 2005
Schedules forming part of the Consolidated Balance Sheet<br />
Rs. In (’000s)<br />
As at 31st March, 2005 2004<br />
1. Share Capital Note<br />
Authorised<br />
150,000,000 (2004 – 125,000,000) Equity Shares of Rs 2 each 6 300,000 250,000<br />
4,000,000 (2004 – 4,000,000) Cumulative Redeemable<br />
Non Convertible Preference Shares of Rs. 100 each 400,000 400,000<br />
Unclassified Capital 50,000 100,000<br />
Issued, Subscribed and Paid-up<br />
118,621,140 (2004 – 59,255,570) Equity Shares of Rs. 2 each 1 237,242 118,491<br />
Less: Calls in Arrears 1 3<br />
237,241 118,488<br />
10.5%, Nil (2004 – 1,000,000) Redeemable Cumulative Non-Convertible<br />
Preference Shares of Rs. 100 each (Redeemed on April 1, 2004 at par) – 100,000<br />
7%, 2,000,000 (2004 — NIL) Redeemable Cumulative Non-Convertible Preference Shares<br />
of Rs. 100 each (Redeemable at the end of 36 months from 29th September, 2004<br />
with put/call option at the end of the 12th month and 24th month from<br />
the date of alottment by giving minimum of 30 days notice) 200,000 –<br />
Equity Share Warrants<br />
225,000 (2004 – 290,000) Equity Share Warrants of Rs. 0.20 each 45 58<br />
Total 437,286 218,546<br />
Notes :<br />
1. The Company has allotted Bonus of 59,310,570 Equity Shares of Rs. 2 each at the Board Meeting held on March 18,2005.<br />
2. In terms of Employee Stock Option Plan approved by the members,225,000 (2004 – 290,000) convertible warrants are outstanding<br />
with <strong>Glenmark</strong> Pharmaceuticals Limited Employees Welfare Trust. Each warrant carries an option and is convertible to one Equity<br />
Share of Rs 2. During the year, 65,000 (2004 – 200,000) warrants were converted into Equity Shares at an exercise price of Rs. 14.34<br />
per share.<br />
3. During the year ended March 31, 2005 the Company has cancelled 10,000 options pursuant to Employee Stock Option Plan 1999 and<br />
152,050 options pursuant to Employee Stock Option Scheme 2003 and granted 516,500 (2004 - 700,725 ) options pursuant to Employee<br />
Stock Option Scheme 2003 at a market price as defined in SEBI (ESOS) guidlines.As at March 31, 2005 1,065,175 stock options were outstanding<br />
under Employee Stock Option Scheme 2003.On exercise of the options so granted under Employee Stock Option Scheme 2003 the paid<br />
up Equity Share Capital of the Company will increase by a like number of Shares.<br />
4. As of March 31, 2005, 10,000 (2004 — 85,000) warrants issued to the Employees of the Company, which are outstanding under<br />
Employee Stock Option Plan 1999. The options have been granted at an exercise price of Rs. 14.34 per share in respect of 10,000<br />
shares.<br />
5. Of the above Equity Shares,79,185,570 (2004 -19,875,000) shares of Rs 2 each are allotted as fully paid-up Bonus Shares by capitalisation of<br />
reserves.<br />
6. At the Extraordinary General Meeting held on February 17,2005, the Company has altered its Authorised Share Capital by<br />
classifying out of the unclassified Share Capital of Rs.100,000,unclassified Share Capital of Rs.50,000 into 25,000,000 Equity<br />
Shares of Rs.2 each.<br />
106
Schedules forming part of the Consolidated Balance Sheet<br />
Rs. In (’000s)<br />
As at 31st March, 2005 2004<br />
2. Reserves and Surplus Note<br />
Securities Premium Account<br />
Balance at the beginning of the year 991,968 500,518<br />
Add: Issue of Shares/Conversion of ESOP 2,279 491,502<br />
Less: Calls in arrears 19 52<br />
Less : Issue cost & Redemption premium of FCCB 94,553 –<br />
Less: Issue of Bonus Shares 118,621 –<br />
Less : Redemption premium of FCCB 22,365 –<br />
Closing balance 758,689 991,968<br />
General reserve<br />
Balance at the beginning of the year 610,508 550,773<br />
Add : Transferred from Profit & Loss account 65,000 60,000<br />
Add: Share of loss acquired from Minority (Refer note 11 of Schedule 22) 265 –<br />
Less: Loss pertains to Minority Interest – 265<br />
Add : Transferred from Debenture Redemption Reserve account 1 29,917 –<br />
Closing balance 705,690 610,508<br />
Debenture Redemption Reserve<br />
Balance at the beginning of the year 29,917 29,664<br />
Addition during the year – 253<br />
Less: Transfer to General Reserve account 1 (29,917) –<br />
Closing balance – 29,917<br />
Capital Reserve<br />
Balance at the beginning of the year 1,000 1,000<br />
Addition during the year on acquisition of <strong>Glenmark</strong> Organics Ltd. 127 –<br />
Closing balance 1,127 1,000<br />
Exchange Fluctuation Reserves (14,851) (7,697)<br />
Employee Stock option<br />
Employee Stock Options outstanding 2,052 8,219<br />
Less : Conversion of Option 1,425 5,283<br />
Less : Cancellation of Option 257 884<br />
A 370 2,052<br />
Deferred Employee Stock Compensation 539 2,113<br />
Less : Amortisation of ESOP expense. 448 1,436<br />
Less : Cancellation of Option 32 138<br />
B 59 539<br />
Net Employee Stock Option A-B 311 1,513<br />
107<br />
Profit and Loss Account Balance 1,401,367 497,882<br />
Total 2,852,333 2,125,091<br />
Note :<br />
1. Balance in Debenture Redemption Reserve account transferred to General Reserve account on Redemption of Non Convertible<br />
Debentures ‘NCD’ comprising of 10.05% NCD - A series aggregating Rs. 50 million and 10.35% NCD - B series aggregating Rs 90<br />
million .
Schedules forming part of the Consolidated Balance Sheet<br />
Rs. In (’000s)<br />
As at 31st March, 2005 2004<br />
3. Secured Loans Note<br />
Term Loan 1 1,000,000 350,000<br />
Non Convertible Debentures 2 – 140,000<br />
Working Capital Facilities 3 278,695 528,414<br />
Other Loans 4 15,497 11,015<br />
Total 1,294,192 1,029,429<br />
Notes :<br />
1. Term Loan is secured by the mortgage of Fixed Assets of the Company as a security.<br />
2. Non Convertible Debentures ‘NCD’ comprising of 10.05% NCD - A series aggregating Rs. 50 million and 10.35% NCD - B series<br />
aggregating Rs 90 million are redeemed during the year.<br />
3 Working Capital Loan from banks are secured by hypothecation of stocks of raw materials, packing materials, finished goods,<br />
work in progress, receivables etc. They are additionally secured by way of personal guarantees of some of the directors and<br />
equitable mortgage on fixed assets at the manufacturing facility at Nasik and Research and Development Centre at Sinnar, Nasik.<br />
4 Other loans are secured by way of hypothecation of vehicles.<br />
As at 31st March, 2005 2004<br />
4. Unsecured Loans Note<br />
Short term Loan – 105,117<br />
Foreign Currency Convertable Bonds 1 3,063,900 –<br />
Security Deposit 6,235 3,752<br />
Deferred Sales Tax Loan 2 10,445 10,445<br />
Total 3,080,580 119,314<br />
108<br />
Notes :<br />
1. During the year<br />
A) The company had issued 20,000 Zero Coupon Foreign Currency Convertible Bonds of USD 1,000 each (Rs. 873,200 at issue)<br />
(i) Convertible at the option of the bondholder at any time on or after 28th March, 2005 but prior to the close of business<br />
on 2nd January, 2010 at a fixed exchange rate of Rs.43.66 per 1 USD and price of Rs.862.394 per share of par value of Rs.2<br />
per share subject to adjustment in certain events i.e. issue of bonus shares, division, consolidation,reclassification of<br />
shares etc.<br />
(ii) Redeemable in whole but not in part at the option of the company on or after 15th February, 2008 if closing price of the share for<br />
each of the 25 consecutive trading days immediately prior to the date upon which notice of such redemption is given was at least<br />
130% of the applicable Early Redemption Amount divided by the conversion ratio.<br />
(iii) Redeemable on maturity date on 16th February, 2010 at 133.74% of its principal amount if not redeemed or converted earlier.<br />
The redemption premium of 33.74%payable on maturity of the bond if there is no conversion of the bond to be debited to<br />
Securities Premium account evenly over the period of 5 years from the date of issue of bonds.<br />
B) The company had issued 50,000 Zero Coupon Foreign Currency Convertible Bonds of USD 1,000 each (Rs. 2,183,000 at issue)<br />
(i) Convertible at the option of the bondholder at any time on or after 15th November, 2006 but prior to the close of business<br />
on 2nd January 2010 at a fixed exchange rate of Rs. 43.66 per 1 USD and the price greater of 35% of the average of the order book<br />
volume–weighted-average-price of a share on each trading day during the period commencing on 15th September and ending<br />
on 14th November, 2006 and the Floor Price (Rs. 500) of par value of Rs.2 per share.<br />
(ii) Redeemable in whole but not in part at the option of the company on or after 15th February, 2009 if closing price of the share for<br />
each of the 25 consecutive trading days immediately prior to the date upon which notice of such redemption is given was at least<br />
130% of the applicable Early Redemption Amount divided by the conversion ratio.<br />
(iii) Redeemable on maturity date on 16th February, 2010 at 134.07% of its principal amount if not redeemed or converted earlier.<br />
The redemption premium of 34.07%payable on maturity of the bond if there is no conversion of the bond to be debited to<br />
Securities Premium account evenly over the period of 5 years from the date of issue of bonds.<br />
2. The Company has availed of an interest free sales tax deferral loan under Part I of the 1983 and 1988 Package Schemes of the<br />
Government of Maharashtra, repayable after twelve years in six half-yearly installments.
Schedules forming part of the Consolidated Balance Sheet<br />
Rs. In (’000s)<br />
As at 31st March, 2005 2004<br />
5. Deferred Tax Liability [Refer Note (2)(ix) of Schedule 22]<br />
Liabilities<br />
Depreciation 386,111 291,291<br />
Others – 1,890<br />
Total 386,111 293,181<br />
6. Deferred Tax Asset [ Refer Note (2)(ix) of Schedule 22]<br />
Assets<br />
Provision for Bad Debts and Doubtful Advances 23,457 23,102<br />
Unabsorbed Losses and Depreciation 51,691 4,526<br />
Others 1,830 525<br />
Total 76,978 28,153<br />
7 Fixed Assets [Refer note (2)(ii) and (7) of Schedule 22]<br />
GROSS BLOCK DEPRECIATION/AMORTISATION NET BLOCK<br />
As on Acqui- Additions Consoli- Sales/ As on As on Acqui- For the Consoli- Sales/ As on As on As on<br />
1st Apr, sition during the dation Disposals 31st Mar. 1st Apr. sition year dation Disposals 31st Mar. 31st Mar. 31st Mar.<br />
2004 during the year Adjust- during the 2005 2004 Adjust- of Assets 2005 2005 2004<br />
year ment year ment<br />
Tangible assets<br />
Freehold Land 5,710 – – – – 5,710 – – – – – – 5,710 5,710<br />
Leasehold Land 57,039 – 28,861 – – 85,900 1,280 – 730 – – 2,010 83,890 55,759<br />
Factory Buildings 159,287 2,144 198,488 – – 359,919 22,705 1,179 8,022 5 – 31,911 328,009 136,582<br />
Other Buildings &<br />
Premises 267,410 – 26,871 – 975 293,306 16,045 – 4,513 – 175 20,383 272,923 251,365<br />
Plant and Machinery 187,119 – 201,703 – 2,232 386,590 21,242 – 16,652 – 200 37,694 348,896 165,877<br />
Furniture and<br />
Fixtures 130,612 18,966 73,625 5 – 223,208 35,660 6,202 23,976 78 – 65,916 157,292 94,952<br />
Equipments 522,969 1,674 360,120 12 1,273 883,502 106,140 734 60,671 15 158 167,402 716,100 416,829<br />
Vehicles 32,490 946 34,129 – 5,306 62,259 13,588 192 9,362 78 3,077 20,143 42,116 18,902<br />
Intangible assets<br />
– Goodwill – 167,604 – – – 167,604 – – – – – – 167,604 –<br />
– Computer software 21,637 – 19,663 14 – 41,313 4,157 – 5,299 (42) – 9,414 31,899 17,480<br />
– Brands 454,557 – 926,181 335 – 1,381,073 128,359 – 35,007 (64) – 163,302 1,217,771 326,198<br />
Total 1,838,830 191,334 1,869,641 366 9,786 3,890,385 349,176 8,307 164,232 70 3,610 518,175 3,372,210 1,489,654<br />
Previous Year 1,247,428 – 615,054 – 23,652 1,838,830 243,613 – 110,930 – 5,367 349,176 1,489,654 1,003,815<br />
Capital Work-in-progress including Capital advances. 130,625 251,853<br />
Notes :<br />
1. Equipment and vehicles include assets aggregating Rs.19,559 (2004 -- Rs.19,308) [net book value as at March 31, 2005 -- Rs. 12,152 (2004 -- Rs.14,338)]<br />
and Rs. 4,098 (2004 -- Rs. 5,536) [net book value as at March 31, 2005 -- Rs.2,087 (2004 -- Rs. 3,708)], respectively, which have been acquired on finance<br />
lease.<br />
2. Additions to assets include Rs. 12,423 (2004 -- Rs.4,488) being borrowing costs.<br />
3. Estimated amount of contracts remaining to be executed on capital account, net of advances, not provided for as at March 31, 2005 aggregate Rs.170,526<br />
(2004 -- Rs.59,039)<br />
4. Capital Work-in-progress includes :<br />
2005 2004<br />
At Ankleshwar Plant - 68,157<br />
At Mohol Plant 4,040 -<br />
At Baddi Plant 2,212 -<br />
At Goa Plant 11,768 57,145<br />
Capital Advances 104,791 109,854<br />
Other work-in-processes 6,239 9,810<br />
At Brazil 1,574 6,282<br />
At Philippines - 605<br />
5. Additions for <strong>Glenmark</strong> Pharmaceuticals Inc, USA ,<strong>Glenmark</strong> Pharmaceuticals S.A., <strong>Glenmark</strong> Philippines Inc., Philippines includes<br />
Product development process , Patents and Trademarks.However pending completion of the development process and registration of<br />
Products and Trademarks ,no amortisation of Intangible assets has been provided for during the year.<br />
6. Acquisition during the year represent the assets of Laboratorios Klinger Do Brazil Ltda acquired by <strong>Glenmark</strong> Farmaceutica Ltda, Brazil.<br />
109
Schedules forming part of the Consolidated Balance Sheet<br />
Rs. In (’000s)<br />
As at 31st March, 2005 2004<br />
8. Investments [Refer Note (2)(iv) of Schedule 22]<br />
Long Term Investments<br />
Quoted - traded<br />
Equity Shares<br />
9,000 (2004 — 9,000) Bank of India of Rs.10 each [Market Value Rs. 931 (2004 — Rs. 530)] 405 405<br />
1,718 (2004 — 1,718) IDBI Bank Limited of Rs. 10 each [Market Value Rs.109 (2004 — Rs. 85)] 34 34<br />
439 439<br />
Unquoted - non trade<br />
National Savings Certificate -Sixth Issue 12 48<br />
1 (2004 — 1) Time Share of Dalmia Resorts Limited 20 20<br />
1 (2004 — 1) Equity Share of Esquados 340,000 of <strong>Glenmark</strong><br />
Pharmaceutica Limitada, Lisbon (Portugal) 48 48<br />
193,665 ( 2004 - 193,665 ) Shares of Bharuch Eco-Aqua Infrastructure Limited of Rs. 10<br />
each, fully paid up . 1,937 1,937<br />
100,000 12% Cumulative Preference Shares of Rs 100 each fully<br />
paid up of Cheryl Laboratories (P) Limited 10,000 10,000<br />
1,350,000 7% Cumulative Preference Shares of Rs 100 each fully<br />
paid up of Marksans Pharma Ltd 135,000 135,000<br />
1 (2004 - Nil) Bond of Titulos Divida Publica, Brazil 2,205 –<br />
1 (2004 - Nil) Bond of Creditos Judiciarios da Uniao, Brazil 2,456 –<br />
151,678 147,053<br />
Total 152,117 147,492<br />
110<br />
9. Inventories [Refer Note (2)(v) of Schedule 22]<br />
(As certified by the management)<br />
Raw & Packing Materials 380,408 310,098<br />
Work-in-Process 278,666 223,462<br />
Stores and Spares 3,670 2,574<br />
Finished Goods* 531,471 285,467<br />
Total 1,194,215 821,601<br />
* Includes stock in transit Rs. 11,032 (2004 - Rs.Nil)<br />
10. Sundry Debtors<br />
Outstanding for more than six months<br />
Secured, considered good – –<br />
Unsecured, considered good 490,638 147,936<br />
Unsecured, considered doubtful 57,661 43,061<br />
548,299 190,997<br />
Less: Provision for Doubtful Debts 57,661 43,061<br />
490,638 147,936<br />
Other Debts-<br />
Secured, considered good – –<br />
Unsecured, considered good 1,884,946 1,156,877<br />
Total 2,375,584 1,304,813<br />
11. Cash And Bank Balances<br />
Cash in hand 1,537 897<br />
Balances with Scheduled Banks<br />
– Current Accounts 34,428 31,468<br />
– Margin Money 41,672 42,092<br />
– EEFC Account 8,581 2,203<br />
– Deposit Accounts 7,523 4,319<br />
Balances with Non-Scheduled Banks<br />
– Current Accounts 172,124 276<br />
– Deposit Accounts 1,006,890 –<br />
Total 1,272,755 81,255<br />
The balances in the Margin money accounts are given as security against guarantees issued by banks on behalf of the Company
Schedules forming part of the Consolidated Balance Sheet<br />
Rs. In (’000s)<br />
As at 31st March, 2005 2004<br />
12. Loans And Advances (unsecured, considered good)<br />
Advance to Vendors 149,957 130,275<br />
Advances Recoverable in cash or kind or for value to be received 293,234 192,685<br />
Advance Tax (net of provision) [Refer Note (2) (ix) of Schedule 22] 20,973 –<br />
Balance with Excise Authorities 59,669 19,620<br />
Deposits 54,827 59,890<br />
Total 578,660 402,470<br />
13. Current Liabilities<br />
Acceptances 70,416 92,842<br />
Sundry Creditors - Small scale industrial undertakings 16,527 20,867<br />
– Others 662,746 372,691<br />
Investor Education and Protection Fund shall be credited by<br />
– Unclaimed Dividend 2,996 2,364<br />
[There are no amounts due and outstanding to be credited to Investor<br />
Education and Protection Fund.]<br />
Advances from Customers 1,899 3,049<br />
Other Liabilities 245,693 139,438<br />
Interest Accrued but not due 24,825 8,242<br />
Interim Dividend on Equity Shares 83,035 77,020<br />
Tax on Interim Dividend 11,646 9,868<br />
Tax on Preference Dividend – 1,345<br />
Total 1,119,783 727,726<br />
111<br />
14. Provisions<br />
Wealth Tax 275 300<br />
Income-Tax (net of advance tax) [ Refer Note (2) (ix) of Schedule 22] – 37,402<br />
Provision for Gratuity and Leave Encashment 2,145 2,000<br />
Total 2,420 39,702<br />
15. Miscellaneous Expenditure [Refer Note (2) (xi) & 10 of Schedule 22]<br />
(to the extent not written off or adjusted)<br />
Implementation Expenses of ERP system – 1,147<br />
Product launch, investigation and registration expenses – 5,272<br />
Pre-operative / Preliminary expenses 19,561 23,644<br />
Total 19,561 30,063
Schedules forming part of the Consolidated Profit and Loss Account<br />
As at 31st March, 2005 2004Rs. In (’000s)<br />
As at 31st March, 2005 2004<br />
16. Sales [refer note (2) (vii) of Schedule 22]<br />
Sale of goods and I P assets* 6,110,639 3,796,569<br />
Income from services 9,893 10,037<br />
Total 6,120,532 3,806,606<br />
* includes sales tax and excise duty aggregating Rs 288,020 (2004 — Rs 255,771) and Rs 434,423 (2004 — Rs 340,561)<br />
respectively.<br />
17. Other Income<br />
Lease Rent [tax deducted at source Rs. 403 (2004 — Rs.403 )] 2,381 1,920<br />
Interest Income [tax deducted at source Rs. 468 (2004 — Rs.400 )] 8,419 2,422<br />
Dividend received 1,220 1,245<br />
Exchange Gain 260 4,642<br />
Export Incentive 17,019 7,613<br />
Profit on sale of Fixed Assets 394 128<br />
Miscellaneous Income 22,592 16,692<br />
Total 52,285 34,662<br />
112<br />
18. Cost of Sales<br />
Salary, Wages and Allowances 83,580 38,320<br />
Labour charges 99,024 82,227<br />
Consumption of raw & packing materials 1,542,462 966,088<br />
Purchase of Trading goods 388,919 286,013<br />
Excise Duty paid 426,865 308,398<br />
Sales Tax 288,020 255,771<br />
Power, fuel and water charges 74,059 31,365<br />
Consumable stores 45,076 24,583<br />
Repairs and maintenance - plant and machinery 50,120 17,066<br />
Rent, rates and taxes 759 1,578<br />
Other manufacturing expenses 16,999 540<br />
(Increase)/decrease in inventory (301,208) (218,758)<br />
Total 2,714,675 1,793,191
Schedules forming part of the Consolidated Profit and Loss Account<br />
Rs. In (’000s)<br />
As at 31st March, 2005 2004<br />
19. Selling And Operating Expenses<br />
Salary and Allowances 346,207 256,391<br />
Staff Welfare 13,006 7,801<br />
Directors’ Salaries and Allowances 50,450 44,762<br />
Incentive and Commission 38,274 40,978<br />
Sales Promotion expenses 249,296 184,386<br />
Export Commission 17,710 7,935<br />
Commission on Sales 7,760 4,154<br />
Travelling expenses 203,210 151,626<br />
Freight outward 97,621 71,847<br />
Telephone expenses 24,808 19,431<br />
Rates and Taxes 18,319 14,040<br />
Provision for doubtful debts 14,600 11,800<br />
Insurance premium 13,407 9,173<br />
Electricity charges 9,552 7,258<br />
Rent 28,409 15,885<br />
Repairs & Maintenance 50,183 39,135<br />
Auditors’ remuneration<br />
Audit fees 1,271 1,322<br />
Other matters 1,250 1,020<br />
Out of pocket expenses 32 30<br />
Loss on sale of assets – 848<br />
Amortisation 34,134 376<br />
Other Operating expenses 302,326 184,068<br />
Total 1,521,825 1,074,266<br />
113<br />
20. Interest Expense<br />
On Loans from Banks 84,012 35,777<br />
Other Interest 88,619 64,801<br />
Total 172,631 100,578<br />
21 Research And Development Expenses [refer note (2) (viii)of Schedule 22]<br />
Salary and other Allowances 115,423 71,328<br />
Staff Welfare expenses 8,103 4,633<br />
Directors’ Remuneration 1,242 2,517<br />
Consumable & Chemicals 85,637 80,560<br />
Electricity charges 18,694 12,777<br />
Repairs and maintenance 18,375 12,192<br />
Insurance premium 540 283<br />
Other expenses 78,498 63,783<br />
Total 326,512 248,073
114<br />
Notes to the Consolidated Accounts<br />
For the year ended 31st March, 2005<br />
22 Notes to the Financial Statement<br />
1) Principles Of Consolidation<br />
(a)<br />
The consolidated financial statements of the Group have been prepared in accordance with Accounting Standard (AS-21) - “Consolidated<br />
Financial Statements” issued by the Institute of Chartered Accountants of India.<br />
(b) <strong>Glenmark</strong> Pharmaceuticals, the holding company, had controlling interest in the following entities as at 31st March, 2005:<br />
Name of the Subsidiary Country of Incorporation Percentage of ownership<br />
<strong>Glenmark</strong> Dominicana S.A. Dominicana Republic 100%<br />
<strong>Glenmark</strong> Impex LLC Russia 100%<br />
<strong>Glenmark</strong> Philippines Inc. Philippines 100%<br />
Laboratorios Klinger Do Brazil Ltda (Subsidiary of <strong>Glenmark</strong> Farmaceutica Ltda Brazil) Brazil 100%<br />
<strong>Glenmark</strong> Farmaceutica Ltda, Brazil (Subsidiary of <strong>Glenmark</strong> Pharmaceuticals S.A.) Brazil 100%<br />
<strong>Glenmark</strong> Organics Ltd. India 100%<br />
<strong>Glenmark</strong> Exports Ltd. India 100%<br />
GM Pharma Ltd India 100%<br />
<strong>Glenmark</strong> Pharmaceuticals Inc,USA. (Subsidiary of <strong>Glenmark</strong> Pharmaceuticals S.A.) USA 100%<br />
<strong>Glenmark</strong> Pharmaceuticals (U.K.) Ltd , U.K. UK 100%<br />
<strong>Glenmark</strong> Pharmaceuticals Nigeria Ltd. Nigeria 100%<br />
<strong>Glenmark</strong> Pharmaceuticals SDN.BHD. Malaysia 100%<br />
<strong>Glenmark</strong> Pharmaceuticals S.A. Switzerland 100%<br />
<strong>Glenmark</strong> Chemicals Inc. USA 100%<br />
(c) Assets and liabilities of foreign subsidiaries are translated into Indian rupees at the rate of exchange prevailing as at the Balance Sheet<br />
date. Revenues and expenses are translated into Indian rupees at yearly average exchange rates prevailing during the year and the<br />
resulting net translation adjustment has been adjusted to Reserves.<br />
2) SIGNIFICANT ACCOUNTING POLICIES<br />
i) Basis of Accounting<br />
The Financial Statements are prepared under the historical cost convention, on the accrual basis of accounting, in conformity<br />
with accounting principles generally accepted in India. These consolidated financial statements have been prepared to meet the<br />
requirements of clause 32 of the listing agreement with the stock exchanges.<br />
ii) Fixed Assets and Depreciation<br />
Fixed Assets are stated at cost less accumulated depreciation. The Company capitalises all costs relating to the acquisition<br />
and installation of fixed assets. Expenditure of revenue nature, incurred in setting up of new projects, is capitalised as an indirect cost<br />
towards construction of the fixed assets. Exchange differences relating to the acquisition of fixed assets are adjusted in the cost of the<br />
assets.<br />
Depreciation is provided using the straight line method, pro-rata to the period of use of assets, based on the useful lives of fixed assets as<br />
estimated by management, or at the rates specified in Schedule XIV of the Companies Act, 1956, whichever is higher.<br />
Fixed Assets having aggregate cost of Rs. 5,000 or less are depreciated fully in the year of acquisition.<br />
The Company has estimated the useful life of its assets as follows:<br />
Category<br />
Estimated useful life<br />
(in years)<br />
Plant and Machinery 8 - 20<br />
Vehicles 5 - 6<br />
Equipments and air conditioners 4 - 20<br />
Furniture and fixtures 5 - 10<br />
Brands 5 - 10<br />
Leasehold land is amortised over the period of lease.<br />
iii) Foreign currency transactions<br />
Foreign currency transactions during the year are recorded at the rates of exchange prevailing on the date of the transaction. Foreign<br />
currency assets and liabilities are translated into rupees at the exchange rates prevailing on the date of the balance sheet. All exchange<br />
differences are dealt with in the statement of profit and loss, except those relating to the acquisition of fixed assets, which are adjusted<br />
in the cost of the respective fixed assets.<br />
iv) Investments<br />
Long term investments are stated at cost. Provision, where necessary, is made to recognize a decline, other than temporary, in the value<br />
of the investments.<br />
v) Inventories<br />
Inventories of raw materials, packing materials, work-in-process and finished goods are valued at cost or net realisable value,<br />
whichever is lower. Cost of raw materials and packing materials is ascertained on a first-in-first out basis. Cost of work-in-process and<br />
finished goods includes the cost of materials consumed, labour and manufacturing overheads. Excise and customs duty accrued on<br />
production or import of goods, as applicable, is included in the valuation of inventories.<br />
vi) Employee Benefits<br />
Retirement benefits to employees comprise payments towards gratuity, superannuation and provident fund under the schemes of<br />
the Company and encashment of leave. <strong>Annual</strong> contributions to the superannuation and provident funds are charged to the<br />
statement of profit and loss.
Notes to the Consolidated Accounts<br />
For the year ended 31st March, 2005<br />
22 Notes to the Financial Statement (Contd.)<br />
The employee leave encashment and gratuity schemes are administered through the Life Insurance Corporation of India. <strong>Annual</strong><br />
contributions as determined by the LIC are charged to the statement of profit and loss.<br />
In respect of stock options granted to employees under the Company’s Employee Stock Option Plan (‘ESOP’), the excess of the market<br />
price of the share at the date of grant of the option over its exercise price is treated as a form of employee compensation in the<br />
financial statements of the Company. This amount is amortised on a straight-line basis over the vesting period. The unamortised<br />
portion is carried forward as deferred employee compensation.<br />
vii) Revenue Recognition<br />
The Company recognizes revenue on dispatch of goods to customers. Revenues from services are recognized on completion of such<br />
services. Revenue from IP asset/Marketing rights is recognized on transfer of ownership/right to use in accordance with the terms of<br />
relevant agreements. Revenue from contract research being in the nature of product development activities is recognized as per<br />
the terms of the agreement. Revenues are recorded at invoice value, inclusive of excise duty and sales-tax, but net of returns and<br />
trade discounts.<br />
viii) Research and Development<br />
Capital expenditure on research and development (R&D) is capitalised as fixed assets.Development cost relating to the new and<br />
improved product and/or process development is recognised as an intangible asset to the extent that it is expected that such asset<br />
will generate future economical benefits. Other research and development costs is expensed as incurred.<br />
ix) Income-Tax<br />
Provision for current income-taxes is made on the assessable income at the tax rate applicable to the relevant assessment year.<br />
Deferred income taxes are recognised for the future tax consequences attributable to timing differences between the financial<br />
statement determination of income and their recognition for tax purposes. The effect on deferred tax assets and liabilities<br />
because of a change in tax rates is recognised in statement of profit and loss using the tax rates and tax laws that have been<br />
enacted or substantively enacted by the balance sheet date. Deferred tax assets are recognised and carried forward only to the<br />
extent that there is a reasonable certainty that sufficient future taxable income will be available against which such deferred tax<br />
assets can be realised. Prior / Earlier year’s income tax is charged to the Profit and Loss account on payment and the same is<br />
disclosed separately.<br />
x) Leases<br />
Finance Leases<br />
Assets acquired under finance lease are recognised as assets with corresponding liabilities in the balance sheet at the inception of<br />
the lease at amounts equal to the fair value of the leased asset or, if lower, at the present value of the minimum lease payments. These<br />
leased assets are depreciated in line with the Company’s policy on depreciation of fixed assets. The interest is allocated to periods<br />
during the lease term so as to produce a constant periodic rate of interest on the remaining balance of the liability for each period.<br />
Operating Leases<br />
Lease payments for operating leases are recognised as expense on a straight-line basis over the lease term.<br />
Lease income from operating leases is recognised as income on a straight-line basis over the lease term. Initial direct costs are<br />
recognised immediately as an expense.<br />
xi) Miscellaneous Expenditure<br />
Product Launch Expenditure<br />
Earlier years’ expenditure on launch of new products and their sales promotion is being amortised over a period of three years.<br />
Implementation expenses of Enterprise Resource Planning system.<br />
Earlier year’s expenditure incurred on payments for infrastructure facilities and expenditure incurred on user license fees for an<br />
Enterprise Resource Planning system is being amortised over a period of thirty-six months.<br />
Preliminary Expenses / Pre-Operative Expenses<br />
The opening balance are amortised over the originating period of five years.<br />
xii) Borrowing Costs<br />
Borrowing costs that are attributable to the acquisition and construction of a qualifying asset are capitalised as a part of the cost of<br />
the asset.Other borrowing costs are recognised as an expense in the year in which they are incurred<br />
xiii) Impairment of Assets<br />
The Company assesses at each balancesheet date whether there is any indication that an asset may be impaired.If any such indication<br />
exist , the Company estimates the recoverable amount of the asset . If such recoverable amount of the asset or the recoverable<br />
amount of the cash generating unit to which the asset belongs is less than its carring amount ,the carrying amount is reduced to its<br />
recoverable amount.The reduction is treated as an impairment loss and is recognised in the profit and loss account.If at the<br />
balancesheet date there is an indication that if a previously assessed impairment loss no longer exist, the recoverable amount is<br />
reassessed and the asset is reflected at the recoverable amount.<br />
xiv) Provisions and Contingent Liabilities<br />
The Company recognises a provision when there is a present obligation as a result of a past event that probably requires an<br />
outflow of resources and a reliable estimate can be made of the amount of the obligation. A disclosure for a contingent liability is<br />
made when there is a possible obligation or a present obligation that may, but probably will not , require an outflow of<br />
resources.Where there is a possible obligation or a present obligation that the likelihood of outflow of resources is remote, no<br />
provision or disclosure is made.<br />
115
Notes to the Consolidated Accounts<br />
For the year ended 31st March, 2005<br />
22 Notes to the Financial Statement (Contd.)<br />
Rs. In (‘000s)<br />
31st March, 2005 31st March, 2004<br />
3) Contingent liabilities not provided for<br />
Bank Guarantees 11,649 9,981<br />
Corporate Guarantee - 50,000<br />
Disputed Taxes/Duties 3,434 -<br />
Labour / Industrial Disputes 1,141 1,120<br />
Open Letters of Credit 94,945 83,350<br />
Sundry Debtors factored with recourse option 100,000 91,677<br />
Channel Financing with Recourse Option 24,231 14,159<br />
4) Earnings per Share<br />
Basic earnings per share are calculated by dividing the net profit for the year attributable to equity shareholders (net profit for the year<br />
less dividends on preference shares) by the weighted average number of equity shares outstanding during the year.<br />
For the purpose of calculating diluted earnings per share, the net profit attributable to equity shareholders and the weighted average<br />
number of shares outstanding are adjusted for the effects of all dilutive potential equity shares from the exercise of options on<br />
unissued share capital. The number of equity shares is the aggregate of the weighted average number of equity shares and the<br />
weighted average number of equity shares, which would be issued on the conversion of all the dilutive potential equity shares into<br />
equity shares. Options on unissued equity share capital are deemed to have been converted into equity shares on the date when the<br />
options are exercised.<br />
The calculations of earnings per share (basic and diluted) are based on the earnings and number of shares as computed below.<br />
Rs. In (‘000s)<br />
Reconciliation of Earnings 31st March, 2005 31st March, 2004<br />
Profit after tax for the financial year 1,071,411 413,606<br />
Less:<br />
Preference Dividends 7,058 10,500<br />
Dividend Tax on Preference Shares 922 1,345<br />
Net profit attributable to Equity Shareholders for calculation of Basic EPS 1,063,431 401,761<br />
Reconciliation of number of Shares Shares Shares<br />
in ‘000s in ‘000s<br />
Weighted average number of Shares:<br />
For basic earnings per share 118,581 114,357<br />
Add:<br />
Deemed exercise of options on unissued equity share capital 1,062 548<br />
Conversion of FCC Bonds 10,757 –<br />
For Diluted Earnings Per Share 130,400 114,905<br />
Earnings Per Share (nominal value Rs 2 each) Rs Rs<br />
Basic 8.97 3.51<br />
Diluted 8.16 3.50<br />
EPS for previous year have been recomputed considering Bonus issue.<br />
116<br />
5) SEGMENT INFORMATION<br />
Business Segments<br />
The Company is primarily engaged in a single segment business of manufacturing and marketing of pharmaceuticals formulations and<br />
active ingredients and is managed as one entity, for its various activities and is governed by a similar set of risks and returns.<br />
Geographical Segments<br />
The operations of the Company are largely confined to India, with exports contributing to 38.87% of its annual sales. Hence, in the view<br />
of the management, the Indian and export markets represent geographical segments.<br />
Sales by market — The following is the distribution of the Company’s sale by geographical market:<br />
Rs. In (‘000s)<br />
Geographical Segment 31st March, 2005 31st March, 2004<br />
India 3,741,223 3,154,903<br />
Other than India 2,379,309 651,703<br />
Total 6,120,532 3,806,606
Notes to the Consolidated Accounts<br />
For the year ended 31st March, 2005<br />
22 Notes to the Financial Statement (Contd.)<br />
Assets and additions to fixed assets by geographical area – The following table shows the carrying amount of segment assets<br />
and additions to fixed assets by geographical area in which the assets are located:<br />
Rs. In (‘000s)<br />
2005 2005 2004 2004<br />
India Others* India Others*<br />
Carrying amount of segment assets 4,988,828 3,927,913 3,633,914 583,192<br />
Additions to tangible assets 871,611 75,934 615,053 –<br />
* Others represent receivables from debtors located outside India including those related to deemed exports and cash and bank<br />
balances outside india.<br />
6) Related Party Disclosures<br />
a) Related Party relationships where transactions have taken place during the year<br />
Key management personnel (includes directors of the Company and its Subsidiaries)<br />
Mr. Gracias Saldanha<br />
Mrs B.E. Saldanha<br />
Mr Glenn Saldanha<br />
Mrs Cheryl Pinto<br />
Mr. R.V. Desai<br />
Mr. A.S. Mohanty<br />
Mr. Aliton Wiliczinski<br />
Mr. Sangeet Mehrotra<br />
Mr. Terrence Coughlin<br />
Mr. Assagabriel Olusola<br />
Mr. Surdass Vipinkumar<br />
Mr. Paramasivam A/L Govindasamy<br />
Mr. Anil Muddanna<br />
Mr. Jeffrey Weiss (Resigned in Oct’04)<br />
b) Transactions with related parties during the year Rs. In (’000)<br />
Managerial Remuneration 2005 2004<br />
Name of Directors<br />
1. Mr. Gracias Saldanha 9,377 10,104<br />
2. Mrs. B. E. Saldanha 8,079 7,177<br />
3. Mr. Glenn Saldanha 20,572 14,560<br />
4. Mrs. Cheryl Pinto 5,325 7,411<br />
117<br />
7) Leases<br />
a) The Company has entered into operating and finance lease agreements for the rental of property, vehicles,computers, equipment<br />
and other assets. Typically, lease agreements are for a period of three to five years. At March 31, 2005, the Company had<br />
commitments under non-cancellable finance leases as follows:<br />
Rs. In (‘000s )<br />
31st March, 2005 31st March, 2004<br />
Minimum lease payments<br />
Due within one year 4,146 7,368<br />
Due later than one year and not later than five years – 4,146<br />
Total 4,146 11,514<br />
Present value of minimum lease payments<br />
Due within one year 2,728 5,528<br />
Due later than one year and not later than five years – 2,728<br />
Total 2,728 8,256<br />
b) The Company has leased out its manufacturing facility at Panoli, Gujarat and the same has been capitalised in the books of account<br />
in accordance with Accounting Standard 19 -“Leases” issued by The Institute of Chartered Accountants of India in this regard.<br />
Depreciation has been provided based on the estimated useful life of the asset.
118<br />
Notes to the Consolidated Accounts<br />
For the year ended 31st March, 2005<br />
22 Notes to the Financial Statement (Contd.)<br />
(i) Details in respect of assets given on operating Lease<br />
Rs. In (‘000s )<br />
31st March, 2005 31st March, 2004<br />
Gross Block<br />
Leasehold Land 4,259 4,259<br />
Factory Buildings 22,065 22,065<br />
Plant and Machinery 5,838 5,838<br />
Equipments 3,764 3,764<br />
Furniture and Fixtures 165 165<br />
36,091 36,091<br />
Accumulated Depreciation<br />
Leasehold Land 215 172<br />
Factory Buildings 4,039 3,302<br />
Plant and Machinery 1,382 1,104<br />
Equipments 1,572 1,272<br />
Furniture and Fixtures 83 66<br />
7,291 5,916<br />
Depreciation 1,375 1,375<br />
(ii) The lease income of Rs. 1,920 (2004 — Rs. 1,920) has been accrued on the basis of the lease agreement executed with the lessees.<br />
This lease is cancellable by notice of 30 days on either side.<br />
c) The Company has taken godowns/residential & office premises at various locations in the country.<br />
i) The Company’s significant leasing arrangements are in respect of the above plant, godowns & premises (Including furniture and<br />
fittings therein, as applicable ). The aggregate lease rentals payable are charged to Profit and Loss Account as Rent in Schedule 18<br />
,19 & 21 .<br />
ii) The Leasing arrangements which are cancellable range between 11 months and 3 years. They are usually renewable by mutual<br />
consent on mutually agreeable terms. Under these arrangements, generally refundable interest free deposits have been given. An<br />
amount of Rs. 16,088 towards deposit and unadjusted advance rent is recoverable from the lessor.<br />
8) The Company has entered into an arrangement with it’s wholly owned subsidiary (WOS) for undertaking product development work<br />
and to provide complete information concerning the product formulation. As per the arrangement, the WOS shall pay fees for such<br />
services on an arm’s length basis on completion of formulation development and pivotal bio-studies and on submission of product<br />
dossier for the regulatory filings. However no fees have been recognized during the year, as the above-mentioned activities have<br />
not been completed till the year-end.<br />
9) The Finance Act,2001 has introduced, with effect from Assessment Year 2002-03 (effective April 1,2001 ), detailed Transfer<br />
Pricing regulations for computing the taxable income and expenditure from ‘International transaction ‘ between ‘Associated<br />
enterprises’ on an ‘ arm’s length ‘ basis.These regulations ,inter alia , also require the maintenance of prescribed documents and<br />
information including furnishing a report from an Accountant on or before October 31, 2005.<br />
For the year ended March 31, 2004, the Holding company had undertaken a transfer pricing study and obtained the prescribed<br />
certificate of the Accountant to comply with the said transfer pricing regulations which did not envisage any tax liability. For the tax<br />
year ended March 31, 2005 the Holding company had carried out a study to comply with the said transfer pricing regulations.<br />
10) In accordance with Accounting standard 26 ‘’Intangible Assets’’ preliminary expenses / pre-operative expenses incurred during the year<br />
are charged off unlike in earlier years where these were deferred over a period of five financial years.<br />
11) During the year, Company had acquired four percent minority interest of <strong>Glenmark</strong> Pharmaceuticals Inc, USA. Share of loss Rs.265<br />
pertaining to Minority interest is adjusted against General reserve and Profit and Loss account.<br />
12) Prior year comparatives<br />
Prior year’s figures have been regrouped wherever necessary.<br />
Signatures to the Schedules 1 to 22 which form an integral part of the Consolidated Financial Statements.<br />
For and on behalf of<br />
Price Waterhouse<br />
Chartered Accountants<br />
For and on behalf of the Board of Directors<br />
Partha Ghosh M. J. Mendonza G. Saldanha Rajesh Desai<br />
Partner Vice President - Legal & Chairman Director - Finance<br />
Membership Number - F 055913<br />
Company Secretary<br />
Mumbai, July 29, 2005
Corporate Information<br />
Chairman [Non-Executive]<br />
Mr. Gracias Saldanha<br />
Managing Director & CEO<br />
Mr. Glenn Saldanha<br />
Directors<br />
Ms. B. E. Saldanha<br />
Ms. Cheryl Pinto<br />
Mr. J. F. Riberio<br />
Dr. Prasanna Gore<br />
Mr. R. V. Desai<br />
Mr. A. S. Mohanty<br />
Mr. Sridhar Gorthi<br />
Mr. M. Gopal Krishnan<br />
Mr. Natvarlal B. Desai<br />
Mr. J. M. Trivedi [Up to 26.04.2005]<br />
Mr. Steven Bates [Up to 29.07.2005]<br />
Company Secretary<br />
Mr. Marshall Mendonza<br />
Registered Office<br />
B/2, Mahalaxmi Chambers<br />
22, Bhulabhai Desai Road,<br />
Mumbai 400026, Maharashtra<br />
Tel: [+91 22] 56549999<br />
Fax: [+91 22] 23512531 / 23519652<br />
Website:<br />
http://www.glenmarkpharma.com<br />
E-mail:<br />
webmaster@glenmarkpharma.com<br />
Manufacturing Facilities<br />
E-37, MIDC Industrial Area, D-Road,<br />
Satpur, Nasik 422007, Maharashtra<br />
3109-C, GIDC Industrial Estate,<br />
Ankleshwar, Dist. Bharuch,<br />
Gujarat 393002<br />
Plot No. 163-165/170-172,<br />
Chandramouli Industrial Estate,<br />
Mohol, Mohal Bazarpeth, Solapur,<br />
Maharashtra 413213<br />
Plot No. A-80, MIDC Area,<br />
Kurkumbh, Daund,<br />
Pune 413802, Maharashtra<br />
Plot No. 7, Colvale Industrial Estate,<br />
Bardez, Goa<br />
Village: Kishanpura,<br />
Baddi Nalagarh Road,<br />
Tehsil: Nalagarh, Dist: Solan,<br />
Himachal Pradesh 174101, Baddi<br />
Rua Assahi, 33-1 Andar<br />
CEP 09633-010, Rudge Ramos<br />
Sao Bernado Do Campo<br />
Sao Paulo, Brazil<br />
R&D Centres<br />
Plot No. A-607, TTC Industrial Area,<br />
MIDC, Mahape, Vashi,<br />
Navi Mumbai 400705, Maharashtra<br />
Plot No. C-152, MIDC Sinnar<br />
Industrial Area, Malegaon,<br />
Nasik District 422113,<br />
Maharashtra<br />
Clinical Research Centre<br />
Plot No. D-508, TTC Industrial Area,<br />
MIDC, Turbhe,<br />
Navi Mumbai 400705,<br />
Maharashtra<br />
Auditors<br />
Pricewaterhouse<br />
Chartered Accountants<br />
Mumbai<br />
Cost Auditors<br />
Sevekari Khare & Associates<br />
Solicitor<br />
Kanga & Co., Mumbai,<br />
Trilegal, Mumbai<br />
Registrar and Transfer Agents<br />
Karvy Computershare Pvt. Limited<br />
“Karvy House”, 46 Avenue 4,<br />
Street No. 1, Banjara Hills,<br />
Hyderabad 500034<br />
Tel: [+91 40] 23312454 / 23320751<br />
Fax: [+91 40] 23311968<br />
Bankers<br />
Bank of India<br />
Mahalaxmi Branch, Mumbai 400026
14<br />
13<br />
12<br />
43<br />
19<br />
71<br />
49<br />
10<br />
5<br />
20<br />
62<br />
3 30<br />
29 41 36 35 63<br />
18<br />
68<br />
72<br />
31<br />
22<br />
1<br />
59<br />
40<br />
47<br />
24<br />
21<br />
4<br />
67<br />
39 16<br />
69<br />
54<br />
73<br />
64<br />
26 32<br />
25<br />
8<br />
70 33<br />
6<br />
28 56 58<br />
57<br />
45<br />
17 74 65<br />
75<br />
52 23 50<br />
44 48<br />
53<br />
46 61<br />
15<br />
66 37<br />
51<br />
42<br />
7 2<br />
38<br />
60<br />
9<br />
55<br />
27<br />
11<br />
34<br />
MANUFACTURING SITES<br />
India<br />
Brazil<br />
REGIONAL /<br />
REPRESENTATIVE<br />
OFFICES<br />
1. Brazil<br />
2. Cambodia<br />
3. Dominican Republic<br />
4. Ghana<br />
5. Kazakhstan<br />
6. Kenya<br />
7. Malaysia<br />
8. Nigeria<br />
9. Philippines<br />
10. Russia<br />
11. South Africa<br />
12. Switzerland<br />
13. UK<br />
14. USA<br />
15. Vietnam<br />
INTERNATIONAL OPERATION<br />
16. Afghanistan<br />
17. Angola<br />
18. Barbados<br />
19. Belarus<br />
20. Belize<br />
21. Benin<br />
22. Bolivia<br />
23. Botswana<br />
24. Burkina Faso<br />
25. Central African<br />
Republic<br />
26. Chad<br />
27. Chile<br />
28. Congo Brazzaville<br />
29. Costa Rica<br />
30. Dominica<br />
31. Ecuador<br />
32. Eritrea<br />
33. Ethiopia<br />
34. Fiji<br />
35. Grenada<br />
36. Haiti<br />
37. Hong Kong<br />
38. Indonesia<br />
39. Iraq<br />
40. Ivory Coast<br />
41. Jamaica<br />
42. Laos<br />
43. Latvia<br />
44. Madagascar<br />
45. Malawi<br />
46. Maldives<br />
47. Mali<br />
48. Mauritius<br />
49. Moldova<br />
50. Mozambique<br />
51. Myanmar<br />
52. Namibia<br />
53. Nepal<br />
54. Oman<br />
55. Papua New Guinea<br />
56. Peru<br />
57. R D Congo<br />
58. Rwanda<br />
59. Senegal<br />
60. Singapore<br />
61. Sri Lanka<br />
62. St. Kitts<br />
63. St. Lucia<br />
64. Sudan<br />
65. Tanzania<br />
66. Thailand<br />
67. Togo<br />
68. Trinidad & Tobago<br />
69. UAE<br />
70. Uganda<br />
71. Ukraine<br />
72. Venezuela<br />
73. Yemen<br />
74. Zambia<br />
75. Zimbabwe<br />
www.glenmarkpharma.com
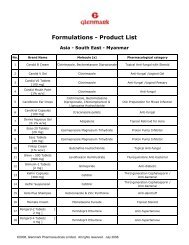
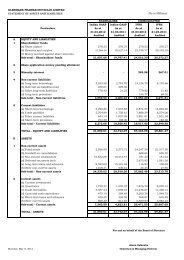
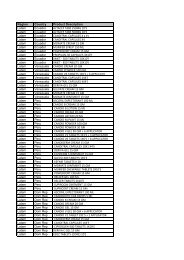
![Formulations [India] â Product List - Glenmark](https://img.yumpu.com/46601329/1/190x245/formulations-india-a-product-list-glenmark.jpg?quality=85)
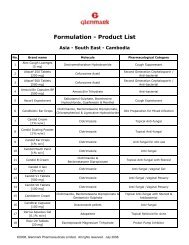
![Formulation [India] â Product List - Glenmark](https://img.yumpu.com/44013338/1/190x245/formulation-india-a-product-list-glenmark.jpg?quality=85)
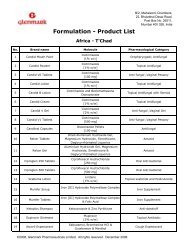
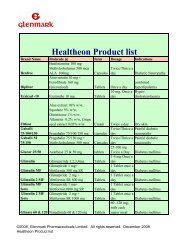
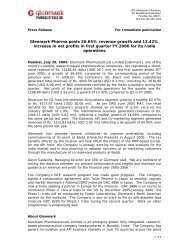
![Formulations [India] â Product List - Glenmark](https://img.yumpu.com/35994839/1/190x245/formulations-india-a-product-list-glenmark.jpg?quality=85)