2011 – 2015 new mexico consolidated plan for housing and ...
2011 – 2015 new mexico consolidated plan for housing and ...
2011 – 2015 new mexico consolidated plan for housing and ...

Create successful ePaper yourself
Turn your PDF publications into a flip-book with our unique Google optimized e-Paper software.
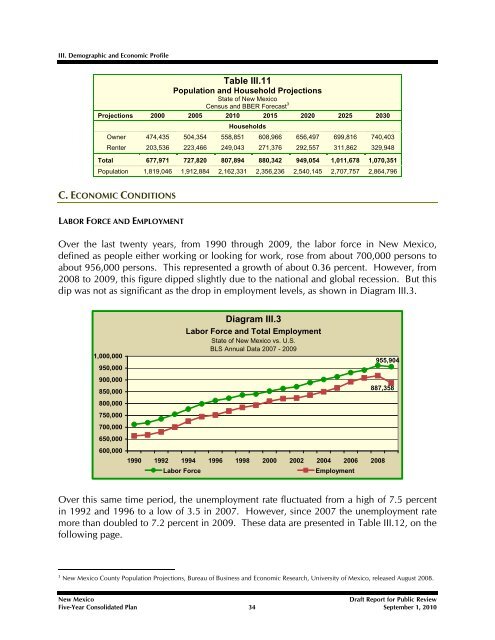
III. Demographic <strong>and</strong> Economic Profile<br />
Table III.11<br />
Population <strong>and</strong> Household Projections<br />
State of New Mexico<br />
Census <strong>and</strong> BBER Forecast 3<br />
Projections 2000 2005 2010 <strong>2015</strong> 2020 2025 2030<br />
Households<br />
Owner 474,435 504,354 558,851 608,966 656,497 699,816 740,403<br />
Renter 203,536 223,466 249,043 271,376 292,557 311,862 329,948<br />
Total 677,971 727,820 807,894 880,342 949,054 1,011,678 1,070,351<br />
Population 1,819,046 1,912,884 2,162,331 2,356,236 2,540,145 2,707,757 2,864,796<br />
C. ECONOMIC CONDITIONS<br />
LABOR FORCE AND EMPLOYMENT<br />
Over the last twenty years, from 1990 through 2009, the labor <strong>for</strong>ce in New Mexico,<br />
defined as people either working or looking <strong>for</strong> work, rose from about 700,000 persons to<br />
about 956,000 persons. This represented a growth of about 0.36 percent. However, from<br />
2008 to 2009, this figure dipped slightly due to the national <strong>and</strong> global recession. But this<br />
dip was not as significant as the drop in employment levels, as shown in Diagram III.3.<br />
1,000,000<br />
950,000<br />
900,000<br />
850,000<br />
800,000<br />
750,000<br />
700,000<br />
650,000<br />
600,000<br />
Diagram III.3<br />
Labor Force <strong>and</strong> Total Employment<br />
State of New Mexico vs. U.S.<br />
BLS Annual Data 2007 - 2009<br />
955,904<br />
887,358<br />
1990 1992 1994 1996 1998 2000 2002 2004 2006 2008<br />
Labor Force<br />
Employment<br />
Over this same time period, the unemployment rate fluctuated from a high of 7.5 percent<br />
in 1992 <strong>and</strong> 1996 to a low of 3.5 in 2007. However, since 2007 the unemployment rate<br />
more than doubled to 7.2 percent in 2009. These data are presented in Table III.12, on the<br />
following page.<br />
3<br />
New Mexico County Population Projections, Bureau of Business <strong>and</strong> Economic Research, University of Mexico, released August 2008.<br />
New Mexico<br />
Draft Report <strong>for</strong> Public Review<br />
Five-Year Consolidated Plan 34 September 1, 2010