BASF in Japan - BASF Asia Pacific
BASF in Japan - BASF Asia Pacific
BASF in Japan - BASF Asia Pacific

Create successful ePaper yourself
Turn your PDF publications into a flip-book with our unique Google optimized e-Paper software.
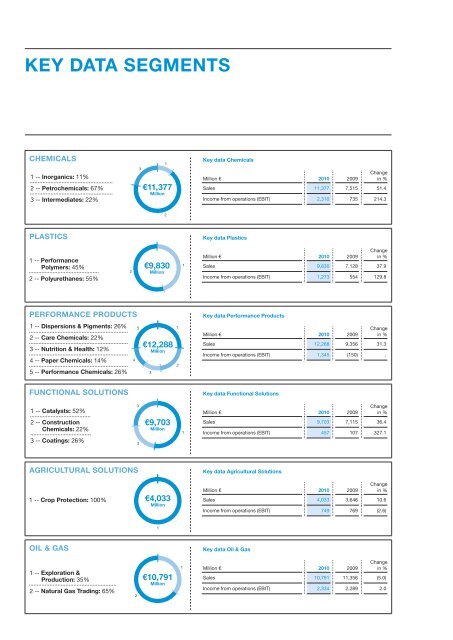
KEY DATA SEGMENTS<br />
S<br />
CHEMICALS<br />
1 -- Inorganics: 11%<br />
2 -- Petrochemicals: 67%<br />
3 -- Intermediates: 22%<br />
3<br />
1<br />
€11,377<br />
Million<br />
Key data Chemicals<br />
Change<br />
Million € 2010 2009 <strong>in</strong> %<br />
Sales 11,377 7,515 51.4<br />
Income from operations (EBIT) 2,310 735 214.3<br />
2<br />
PLASTICS<br />
Key data Plastics<br />
1 -- Performance<br />
Polymers: 45%<br />
2 -- Polyurethanes: 55%<br />
2<br />
€9,830<br />
Million<br />
1<br />
Change<br />
Million € 2010 2009 <strong>in</strong> %<br />
Sales 9,830 7,128 37.9<br />
Income from operations (EBIT) 1,273 554 129.8<br />
<strong>in</strong><br />
,<br />
PERFORMANCE PRODUCTS<br />
1 -- Dispersions & Pigments: 26%<br />
2 -- Care Chemicals: 22%<br />
3 -- Nutrition & Health: 12%<br />
4 -- Paper Chemicals: 14%<br />
5 -- Performance Chemicals: 26%<br />
5<br />
4<br />
€12,288<br />
Million<br />
3<br />
1<br />
2<br />
Key data Performance Products<br />
Change<br />
Million € 2010 2009 <strong>in</strong> %<br />
Sales 12,288 9,356 31.3<br />
Income from operations (EBIT) 1,345 (150) .<br />
FUNCTIONAL SOLUTIONS<br />
Key data Functional Solutions<br />
1 -- Catalysts: 52%<br />
2 -- Construction<br />
Chemicals: 22%<br />
3 -- Coat<strong>in</strong>gs: 26%<br />
3<br />
2<br />
€9,703<br />
Million<br />
1<br />
Change<br />
Million € 2010 2009 <strong>in</strong> %<br />
Sales 9,703 7,115 36.4<br />
Income from operations (EBIT) 457 107 327.1<br />
AGRICULTURAL SOLUTIONS<br />
Key data Agricultural Solutions<br />
d<br />
1 -- Crop Protection: 100%<br />
€4,033<br />
Million<br />
Change<br />
Million € 2010 2009 <strong>in</strong> %<br />
Sales 4,033 3,646 10.6<br />
Income from operations (EBIT) 749 769 (2.6)<br />
1<br />
OIL & GAS<br />
Key data Oil & Gas<br />
1 -- Exploration &<br />
Production: 35%<br />
2 -- Natural Gas Trad<strong>in</strong>g: 65%<br />
2<br />
€10,791<br />
Million<br />
1<br />
Change<br />
Million € 2010 2009 <strong>in</strong> %<br />
Sales 10,791 11,356 (5.0)<br />
Income from operations (EBIT) 2,334 2,289 2.0