Amadeus Introductory presentation - Investor relations at Amadeus
Amadeus Introductory presentation - Investor relations at Amadeus
Amadeus Introductory presentation - Investor relations at Amadeus

Create successful ePaper yourself
Turn your PDF publications into a flip-book with our unique Google optimized e-Paper software.
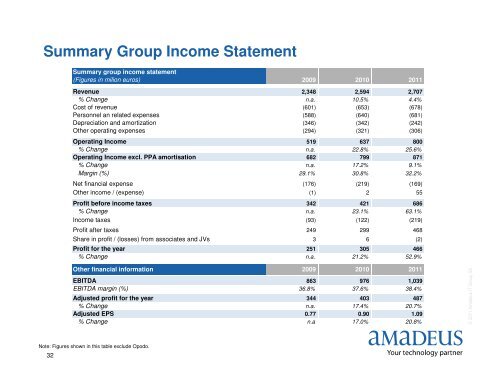
Summary Group Income St<strong>at</strong>ement<br />
Summary group income st<strong>at</strong>ement<br />
(Figures in milion euros) 2009 2010 2011<br />
Revenue 2,348 2,594 2,707<br />
% Change n.a. 10.5% 4.4%<br />
Cost of revenue (601) (653) (678)<br />
Personnel an rel<strong>at</strong>ed expenses (588) (640) (681)<br />
Depreci<strong>at</strong>ion and amortiz<strong>at</strong>ion (346) (342) (242)<br />
Other oper<strong>at</strong>ing expenses (294) (321) (306)<br />
Oper<strong>at</strong>ing Income 519 637 800<br />
% Change n.a. 22.8% 25.6%<br />
Oper<strong>at</strong>ing Income excl. PPA amortis<strong>at</strong>ion 682 799 871<br />
% Change n.a. 17.2% 9.1%<br />
Margin (%) 29.1% 30.8% 32.2%<br />
Net financial expense (176) (219) (169)<br />
Other income / (expense) (1) 2 55<br />
Profit before income taxes 342 421 686<br />
% Change n.a. 23.1% 63.1%<br />
Income taxes (93) (122) (219)<br />
Profit after taxes 249 299 468<br />
Share in profit / (losses) from associ<strong>at</strong>es and JVs 3 6 (2)<br />
Profit for the year 251 305 466<br />
% Change n.a. 21.2% 52.9%<br />
Other financial inform<strong>at</strong>ion 2009 2010 2011<br />
EBITDA 863 976 1,039<br />
EBITDA margin (%) 36.8% 37.6% 38.4%<br />
Adjusted profit for the year 344 403 487<br />
% Change n.a. 17.4% 20.7%<br />
Adjusted EPS 0.77 0.90 1.09<br />
% Change n.a 17.0% 20.8%<br />
© 2011 <strong>Amadeus</strong> IT Group SA<br />
Note: Figures shown in this table exclude Opodo.<br />
32