Tensile Test Report:
Tensile Test Report:
Tensile Test Report:

You also want an ePaper? Increase the reach of your titles
YUMPU automatically turns print PDFs into web optimized ePapers that Google loves.
MCH T 214<br />
<strong>Tensile</strong> <strong>Test</strong> <strong>Report</strong>:<br />
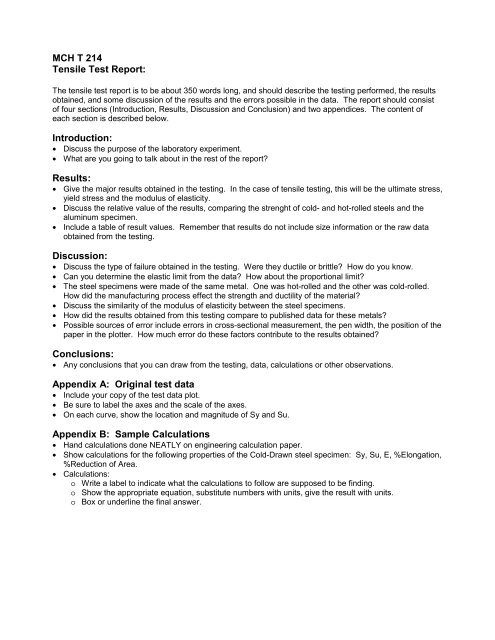
The tensile test report is to be about 350 words long, and should describe the testing performed, the results<br />
obtained, and some discussion of the results and the errors possible in the data. The report should consist<br />
of four sections (Introduction, Results, Discussion and Conclusion) and two appendices. The content of<br />
each section is described below.<br />
Introduction:<br />
• Discuss the purpose of the laboratory experiment.<br />
• What are you going to talk about in the rest of the report<br />
Results:<br />
• Give the major results obtained in the testing. In the case of tensile testing, this will be the ultimate stress,<br />
yield stress and the modulus of elasticity.<br />
• Discuss the relative value of the results, comparing the strenght of cold- and hot-rolled steels and the<br />
aluminum specimen.<br />
• Include a table of result values. Remember that results do not include size information or the raw data<br />
obtained from the testing.<br />
Discussion:<br />
• Discuss the type of failure obtained in the testing. Were they ductile or brittle How do you know.<br />
• Can you determine the elastic limit from the data How about the proportional limit<br />
• The steel specimens were made of the same metal. One was hot-rolled and the other was cold-rolled.<br />
How did the manufacturing process effect the strength and ductility of the material<br />
• Discuss the similarity of the modulus of elasticity between the steel specimens.<br />
• How did the results obtained from this testing compare to published data for these metals<br />
• Possible sources of error include errors in cross-sectional measurement, the pen width, the position of the<br />
paper in the plotter. How much error do these factors contribute to the results obtained<br />
Conclusions:<br />
• Any conclusions that you can draw from the testing, data, calculations or other observations.<br />
Appendix A: Original test data<br />
• Include your copy of the test data plot.<br />
• Be sure to label the axes and the scale of the axes.<br />
• On each curve, show the location and magnitude of Sy and Su.<br />
Appendix B: Sample Calculations<br />
• Hand calculations done NEATLY on engineering calculation paper.<br />
• Show calculations for the following properties of the Cold-Drawn steel specimen: Sy, Su, E, %Elongation,<br />
%Reduction of Area.<br />
• Calculations:<br />
o Write a label to indicate what the calculations to follow are supposed to be finding.<br />
o Show the appropriate equation, substitute numbers with units, give the result with units.<br />
o Box or underline the final answer.
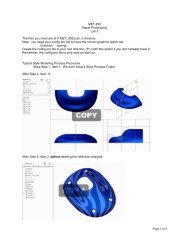
MCHT 214<br />
Laboratory <strong>Report</strong> Format<br />
~2.5”<br />
<strong>Tensile</strong> <strong>Test</strong> of a Brass Specimen<br />
Title: 14 point<br />
Arial Bold font,<br />
Centered<br />
~3.0”<br />
Your Name<br />
January 29, 2003<br />
MCH T 214, Section 1<br />
Personal Info:<br />
12 point Arial<br />
font, Centered<br />
1” Margin on all<br />
sides of the<br />
sheet.<br />
Sample <strong>Report</strong> Title Page<br />
Introduction:<br />
This is a report of…<br />
Section Title:<br />
12 point Arial<br />
Bold font,<br />
Skip ONE row<br />
between sections<br />
…blah, blah, will be shown.<br />
Results:<br />
Text of the <strong>Report</strong>:<br />
10 point Arial font<br />
DOUBLE SPACE<br />
You may want a<br />
table of the<br />
primary result<br />
values<br />
Discussion:<br />
Conclusions:<br />
1” Margin on all<br />
sides of the<br />
sheet.<br />
Sample Body of the <strong>Report</strong>
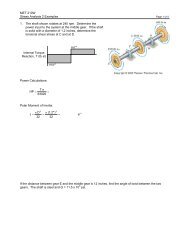
~2.5”<br />
Appendix A<br />
Original <strong>Test</strong> Data<br />
Title: 14 point<br />
Arial Bold font,<br />
Centered<br />
Appendix B<br />
Sample Calculations<br />
Typical Appendix Title Sheet<br />
STAPLE HERE!<br />
“X-axis” –<br />
independent<br />
variable<br />
“Y-axis” –<br />
dependent<br />
variable<br />
• Make graphs as large as<br />
possible.<br />
• Have a title on the graph.<br />
• Label the axes with UNITS.<br />
• Identify the lines shown on a<br />
graph.<br />
• Almost all Excel graphs<br />
should be XY(Scatter)<br />
charts.<br />
Sample Graph Layout