Life Cycle Assessment of PET (Polyethylene Terephthalate) bottles ...
Life Cycle Assessment of PET (Polyethylene Terephthalate) bottles ...
Life Cycle Assessment of PET (Polyethylene Terephthalate) bottles ...

Create successful ePaper yourself
Turn your PDF publications into a flip-book with our unique Google optimized e-Paper software.
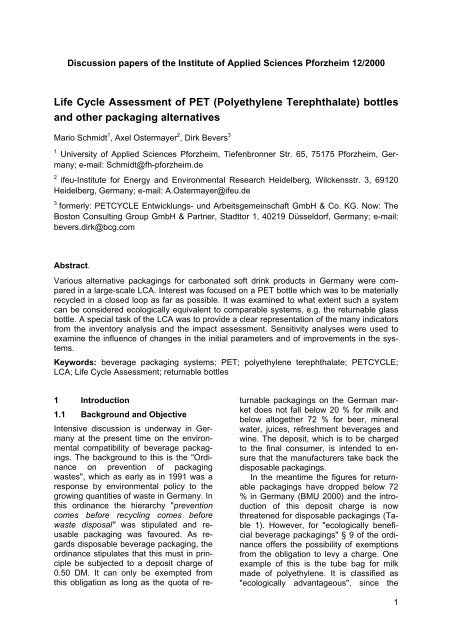
Discussion papers <strong>of</strong> the Institute <strong>of</strong> Applied Sciences Pforzheim 12/2000<br />
<strong>Life</strong> <strong>Cycle</strong> <strong>Assessment</strong> <strong>of</strong> <strong>PET</strong> (<strong>Polyethylene</strong> <strong>Terephthalate</strong>) <strong>bottles</strong><br />
and other packaging alternatives<br />
Mario Schmidt 1 , Axel Ostermayer 2 , Dirk Bevers 3<br />
1 University <strong>of</strong> Applied Sciences Pforzheim, Tiefenbronner Str. 65, 75175 Pforzheim, Germany;<br />
e-mail: Schmidt@fh-pforzheim.de<br />
2 ifeu-Institute for Energy and Environmental Research Heidelberg, Wilckensstr. 3, 69120<br />
Heidelberg, Germany; e-mail: A.Ostermayer@ifeu.de<br />
3<br />
formerly: <strong>PET</strong>CYCLE Entwicklungs- und Arbeitsgemeinschaft GmbH & Co. KG. Now: The<br />
Boston Consulting Group GmbH & Partner, Stadttor 1, 40219 Düsseldorf, Germany; e-mail:<br />
bevers.dirk@bcg.com<br />
Abstract.<br />
Various alternative packagings for carbonated s<strong>of</strong>t drink products in Germany were compared<br />
in a large-scale LCA. Interest was focused on a <strong>PET</strong> bottle which was to be materially<br />
recycled in a closed loop as far as possible. It was examined to what extent such a system<br />
can be considered ecologically equivalent to comparable systems, e.g. the returnable glass<br />
bottle. A special task <strong>of</strong> the LCA was to provide a clear representation <strong>of</strong> the many indicators<br />
from the inventory analysis and the impact assessment. Sensitivity analyses were used to<br />
examine the influence <strong>of</strong> changes in the initial parameters and <strong>of</strong> improvements in the systems.<br />
Keywords: beverage packaging systems; <strong>PET</strong>; polyethylene terephthalate; <strong>PET</strong>CYCLE;<br />
LCA; <strong>Life</strong> <strong>Cycle</strong> <strong>Assessment</strong>; returnable <strong>bottles</strong><br />
1 Introduction<br />
1.1 Background and Objective<br />
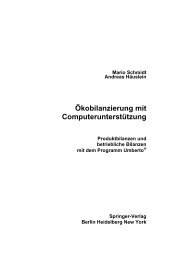
Intensive discussion is underway in Germany<br />
at the present time on the environmental<br />
compatibility <strong>of</strong> beverage packagings.<br />
The background to this is the "Ordinance<br />
on prevention <strong>of</strong> packaging<br />
wastes", which as early as in 1991 was a<br />
response by environmental policy to the<br />
growing quantities <strong>of</strong> waste in Germany. In<br />
this ordinance the hierarchy "prevention<br />
comes before recycling comes before<br />
waste disposal" was stipulated and reusable<br />
packaging was favoured. As regards<br />
disposable beverage packaging, the<br />
ordinance stipulates that this must in principle<br />
be subjected to a deposit charge <strong>of</strong><br />
0.50 DM. It can only be exempted from<br />
this obligation as long as the quota <strong>of</strong> returnable<br />
packagings on the German market<br />
does not fall below 20 % for milk and<br />
below altogether 72 % for beer, mineral<br />
water, juices, refreshment beverages and<br />
wine. The deposit, which is to be charged<br />
to the final consumer, is intended to ensure<br />
that the manufacturers take back the<br />
disposable packagings.<br />
In the meantime the figures for returnable<br />
packagings have dropped below 72<br />
% in Germany (BMU 2000) and the introduction<br />
<strong>of</strong> this deposit charge is now<br />
threatened for disposable packagings (Table<br />
1). However, for "ecologically beneficial<br />
beverage packagings" § 9 <strong>of</strong> the ordinance<br />
<strong>of</strong>fers the possibility <strong>of</strong> exemptions<br />
from the obligation to levy a charge. One<br />
example <strong>of</strong> this is the tube bag for milk<br />
made <strong>of</strong> polyethylene. It is classified as<br />
"ecologically advantageous", since the<br />
1
Table 1: Returnable quota in beverage packagings in Germany. Source: BMU (2000).<br />
1992 1994 1996 1998<br />
Beverages total (excl. milk) 73.54 % 72.87 % 72.21 % 70.13 %<br />
- Mineral water 90.25 % 89.53 % 88.68 % 87.44 %<br />
- Refreshment beverages with CO 2 76.54 % 76.66 % 77.50 % 77.02 %<br />
- Fruit juices and other beverages without CO 2 38.98 % 38.76 % 37.93 % 35.66 %<br />
- Beer 82.37 % 81.03 % 79.02 % 76.14 %<br />
Milk 28.33 % 26.94 % 30.60 % 25.0 %<br />
Quota <strong>of</strong> PE tube packaging for milk 1.53 % 2.25 % 10.50 % 9.7 %<br />
German Environmental Protection Agency<br />
(UBA) had a large-scale LCA <strong>of</strong> beverage<br />
packagings carried out from 1992 to 1995<br />
(Projektgemeinschaft Lebenswegbilanzen<br />
1995). Accordingly, its significance in the<br />
market improved substantially after 1995<br />
(Table 1).<br />
For this reason the packaging manufacturers<br />
have a strong interest in having their<br />
packaging systems graded as "ecologically<br />
beneficial", in order to circumvent a<br />
compulsory deposit. The life cycle assessment<br />
plays a crucial role here, since<br />
in national policy it is the basis for assessing<br />
whether a packaging system is to be<br />
considered as environmentally sound or<br />
not.<br />
For this reason the development joint<br />
venture <strong>PET</strong>CYCLE Entwicklungs- und<br />
Arbeitsgemeinschaft GmbH & Co. KG issued<br />
an order for an LCA to ifeu-Institut<br />
Heidelberg, which was completed in 1999<br />
and presented to the Federal Ministry for<br />
the Environment in March 2000 (Ostermayer<br />
et al. 1999). <strong>PET</strong>CYCLE is an alliance<br />
<strong>of</strong> beverage packers, machine manufacturers<br />
for installations processing the<br />
plastic polyethylene terephthalate (<strong>PET</strong>),<br />
and companies in the packaging industry<br />
who plan to set up a "<strong>PET</strong> material recycling<br />
system" in Germany.<br />
The task <strong>of</strong> the LCA was to compare<br />
packagings for mineral water and lemonades<br />
with each other and to examine in<br />
particular a new <strong>PET</strong> packaging system<br />
known as the <strong>PET</strong> material recycling system.<br />
It was to be ascertained whether and<br />
under what general conditions a <strong>PET</strong> material<br />
recycling system is ecologically<br />
equivalent to the established glass and<br />
<strong>PET</strong> returnable systems, and can thus be<br />
considered as ecologically beneficial beverage<br />
packaging and be excepted from<br />
the rules <strong>of</strong> a compulsory deposit.<br />
The comparison with the 0.7 litre returnable<br />
bottle for mineral water, which is<br />
widespread in Germany, is particularly important<br />
here. About two thirds <strong>of</strong> the mineral<br />
water in Germany is bottled in such<br />
"pearl-glass" <strong>bottles</strong> (so called because <strong>of</strong><br />
the pearl decoration on the bottle). In the<br />
public eye and among politicians, this is<br />
considered to be a typical returnable system<br />
and particularly environmentally<br />
sound. The pearl-glass bottle was introduced<br />
in 1969 by a combination <strong>of</strong> German<br />
mineral water bottlers - the<br />
Genossenschaft Deutscher Brunnen<br />
(GDB). In particular it has the advantage<br />
<strong>of</strong> pool forming for empties, i.e. the <strong>bottles</strong><br />
can be exchanged. Each bottler takes<br />
back <strong>bottles</strong> <strong>of</strong> other firms as well as his<br />
own and fills them again. In this way unnecessary<br />
transport operations can be<br />
saved.<br />
However, at the present time there are<br />
many efforts to replace this pearl-glass<br />
bottle. Weighing 590 grams, it is almost<br />
just as heavy as the material with which it<br />
is filled (700 g, see Table 2). It is not compatible<br />
with Euro-pallets. Many firms need<br />
a special design for their marketing today<br />
and would like to deviate from the standard<br />
bottle. Leading mineral water firms<br />
therefore introduced new glass <strong>bottles</strong> into<br />
the German market, in some cases with<br />
conspicuous designs such as e.g. Carolinen-Brunnen<br />
in Bielefeld with a bottle designed<br />
by Luigi Colani. However, these individual<br />
packagings are tied to the relevant<br />
bottler as returnable systems and require<br />
corresponding logistic arrangements for<br />
return <strong>of</strong> the empties.<br />
That is why light-weight <strong>PET</strong> <strong>bottles</strong><br />
have become very important. However,<br />
the use <strong>of</strong> returnable <strong>PET</strong> <strong>bottles</strong> involves<br />
major investments for the bottlers, since<br />
the empty <strong>bottles</strong> have to be examined for<br />
contamination. using costly techniques.<br />
Many small and medium-sized firms can-<br />
2
not afford these investments. Changes in<br />
beverage packagings can therefore involve<br />
concentration effects in the beverage<br />
industry and lead to weakening <strong>of</strong> the<br />
many medium-sized firms in Germany,<br />
who in particular serve a regional market<br />
with short transport distances. This latter<br />
effect would involve major impacts for the<br />
environment.<br />
The concept <strong>of</strong> the "<strong>PET</strong> material recycling<br />
system", on the other hand, proposes<br />
that the <strong>PET</strong> <strong>bottles</strong> should be materially<br />
recycled after being used (once only) and<br />
the material should be re-used for bottle<br />
production (Figure 1). By contrast with the<br />
classic disposable systems, the <strong>PET</strong> used<br />
would be run in nearly closed material recycling<br />
systems and the typical system<br />
disadvantage <strong>of</strong> disposable systems - increased<br />
generation <strong>of</strong> waste - could be<br />
avoided. A deposit charge system would<br />
be an incentive for customers to return the<br />
<strong>bottles</strong> and thus ensure high return quotas.<br />
The segregated returned <strong>PET</strong> would<br />
be treated in conditioning centres and be<br />
delivered to the bottlers again as preforms<br />
or as finished <strong>bottles</strong>. The precondition<br />
for this system is a well-functioning,<br />
full-scale collection and reconditioning<br />
structure. Similar systems already exist in<br />
Switzerland and in Sweden, though there<br />
the recycled <strong>PET</strong> is not sent straight back<br />
to bottle production but is used in other<br />
high-grade products such as e.g. textile fibres.<br />
However, in the <strong>PET</strong> material recycling<br />
system a genuine recycling circuit is<br />
aimed at.<br />
All beverage packaging systems currently<br />
being discussed or used have advantages<br />
and disadvantages, as well as<br />
potential for improvement. Generally, the<br />
material <strong>PET</strong> has substantial weight advantages<br />
over glass systems, e.g. in the<br />
<strong>PET</strong> returnable system, which is also reflected<br />
in the LCA. The concept <strong>of</strong> "material<br />
recycling" unites two further advantages.<br />
The <strong>bottles</strong> can be produced with<br />
an individual design by the relevant bottler<br />
without this involving long return transport<br />
paths. At the same time, the bottle weights<br />
can be reduced substantially again by<br />
comparison with <strong>PET</strong> returnable <strong>bottles</strong>,<br />
since the <strong>bottles</strong> need not be suitable for<br />
several turn-arounds.<br />
1.2 General conditions<br />
The LCA commissioned was to be oriented<br />
strongly to the methodology <strong>of</strong> studies<br />
which were drawn up in parallel by<br />
Prognos AG Basel and ifeu-Institut on behalf<br />
<strong>of</strong> German companies or the UBA,<br />
and was to correspond to the latest ISO<br />
standards (Prognos/ifeu 1999). In addition<br />
a critical review procedure with renowned<br />
experts from the LCA sector was planned.<br />
Thus the study was among the first LCAs<br />
published in Germany to correspond to the<br />
ISO standard.<br />
The quantity <strong>of</strong> packaging needed to<br />
provide 1,000 litres <strong>of</strong> beverage from the<br />
mineral water and lemonade sector was<br />
taken as a comparison standard, as a<br />
"functional unit", <strong>of</strong> the LCA. This makes it<br />
Table 2: Description <strong>of</strong> the beverage packaging systems for stock purchases taken into account<br />
in the study<br />
System name<br />
Brief description / important features<br />
Volume Bottle material packaging bottle weight cap Return quota<br />
Glass ret. 0.7 l C 0,7 l Glass-Returnable HDPE-crate 590 g Alu-/HDPE-screw cap 99.5 %<br />
<strong>PET</strong>-MR 1 l C 1 l <strong>PET</strong>-Material recycling HDPE-crate 46 g PP-screw cap 99 %<br />
<strong>PET</strong>-. MR 1 l C 1 l <strong>PET</strong>-Material recycling HDPE-crate 33 g PP-screw cap 99 %<br />
<strong>PET</strong>- MR 1 l T 1 l <strong>PET</strong>-Material recycling HDPE-tray 33 g PP-screw cap 90 %<br />
<strong>PET</strong>-ret. 1 l C 1 l <strong>PET</strong>-Returnable HDPE-crate 71 g PP-screw cap 99 %<br />
L-Glass-ret. 1 l C 1 l Light glass-Returnable HDPE-crate 490g Alu-/HDPE-screw cap 99.5%<br />
<strong>PET</strong>- MR 1,5 l C 1,5 l <strong>PET</strong>-Material recycling HDPE-crate 38 g PP-screw cap 99 %<br />
<strong>PET</strong>- MR 1,5 l T 1,5 l <strong>PET</strong>-Material recycling HDPE-tray 38 g PP-screw cap 95 %<br />
<strong>PET</strong>-ret. 1,5 l C 1,5 l <strong>PET</strong>-Returnable HDPE-crate 103 g PP-screw cap 99 %<br />
3
Figure 1: The recycling <strong>of</strong> “<strong>PET</strong> material<br />
recycling <strong>bottles</strong>”<br />
possible to carry out a basic comparison <strong>of</strong><br />
beverage packagings with different volumes.<br />
Despite this, a distinction was made<br />
between systems from stock-keeping sectors<br />
and systems for immediate consumption,<br />
since consumer requirements differ.<br />
In addition to the actual beverage packaging<br />
made <strong>of</strong> glass or <strong>PET</strong>, the labels and<br />
capsules as well as the transport packaging<br />
(bottle crate or tray) needed for 1,000<br />
litres <strong>of</strong> bottled material were taken into<br />
account.<br />
The systems considered are beverage<br />
packagings which are either already established<br />
in the market or have already<br />
been developed and successfully tested.<br />
Altogether 14 different systems made <strong>of</strong><br />
glass or <strong>PET</strong> were compared, including 5<br />
systems for immediate<br />
consumption with very<br />
small volumes (0.33 and<br />
0.5 litres) and 9 systems<br />
for stocking purchases<br />
with volumes <strong>of</strong> 0.7 litres<br />
and more. Only the results<br />
for the stock purchase<br />
sector are described below<br />
(Table 2).<br />
The "life cycles" <strong>of</strong> the<br />
product systems with the<br />
various stages from procurement<br />
<strong>of</strong> raw materials<br />
to waste disposal were<br />
described as process<br />
chains. The production<br />
and waste disposal <strong>of</strong> the<br />
beverage packagings<br />
themselves, <strong>of</strong> the transport<br />
packagings (e.g. crates, trays or<br />
wooden pallets), or important operating<br />
and auxiliary materials were taken into account,<br />
as well as the actual filling process<br />
and distribution and redistribution. The<br />
provision <strong>of</strong> the infrastructure (e.g. the<br />
machines or means <strong>of</strong> conveyance) and<br />
the production <strong>of</strong> the relevant material to<br />
be bottled, in other words the beverage,<br />
were not taken into account, inasmuch as<br />
they were independent <strong>of</strong> the packaging<br />
system.<br />
Alongside the process chain, a product<br />
system is only defined by a number <strong>of</strong> assumptions<br />
in the life cycle, e.g. distribution<br />
distances or recycling quotas. These are<br />
relevant for the results for the product system<br />
and must always be taken into account<br />
for comparison purposes. In other<br />
words, the entire production, consumption<br />
and waste disposal system <strong>of</strong> the product,<br />
including the so-called system parameters,<br />
must be described. In the case <strong>of</strong> assumptions<br />
on the life cycle, either real processes<br />
and system parameters were taken<br />
as a basis, or plausible assumptions were<br />
used, such as are used in the LCA for the<br />
UBA.<br />
One crucial stipulation within LCAs is<br />
the question <strong>of</strong> how the secondary raw<br />
materials are used or generated. Generally,<br />
an attempt is made to use secondary<br />
raw materials - in as far as they conform to<br />
real conditions - in a closed loop, e.g. in<br />
glass fragment use, the glass from broken<br />
glass <strong>bottles</strong> is used for production <strong>of</strong> new<br />
Table 3: Impact categories taken into account and the<br />
indicators used for them<br />
Resources<br />
Greenhouse effect<br />
Acidification<br />
Eutrophication<br />
crea-<br />
Photo-oxidant<br />
tion<br />
Noise<br />
Human toxicity<br />
Nature space used<br />
up<br />
Cumulative Energy Demand CED<br />
Crude oil resources equivalent value<br />
Process water consumption<br />
Global Warming Potential GWP<br />
Acidification Potential AcP<br />
Eutrophication Potential NP<br />
POCP or NCPOCP<br />
Lorry mileage<br />
Cancer Risk Potential CRP<br />
Landfill area<br />
Wood consumption<br />
4
ottles. In the case <strong>of</strong> the new <strong>PET</strong> material<br />
recycling system, however, assumptions<br />
had to be made. It was assumed that<br />
50 % secondary <strong>PET</strong> can be used again in<br />
<strong>PET</strong> bottle production. Results <strong>of</strong> surveys<br />
and experience compiled by the party<br />
commissioning the study indicate that this<br />
is a conservative assumption and that<br />
possibly even higher values can be<br />
achieved in future (TNO 1996; Welle und<br />
Franz, 1998). However, an assessment <strong>of</strong><br />
this assumption lies outside the scope <strong>of</strong><br />
examination <strong>of</strong> this LCA.<br />
The remaining secondary <strong>PET</strong> which<br />
leaves the closed loop will - according to<br />
the assumption <strong>of</strong> this study - be passed<br />
on for high-grade material recycling. A<br />
credit is normally issued to the <strong>PET</strong> beverage<br />
<strong>bottles</strong> for this. In the case <strong>of</strong> secondary<br />
<strong>PET</strong> which leaves the system, 90<br />
% <strong>of</strong> the substituted primary <strong>PET</strong>/ amorphous<br />
is credited, since at the present<br />
time the market can absorb the secondary<br />
<strong>PET</strong> without any problems. However, such<br />
credits affect the results. For this reason it<br />
was decided to calculate the systems once<br />
without credits (so-called cut-<strong>of</strong>f account)<br />
and once with credits (net account). This<br />
illustrates the influence <strong>of</strong> more or less arbitrary<br />
credit rulings. The influence <strong>of</strong> such<br />
assumptions on the results was also examined<br />
and discussed with sensitivity calculations.<br />
2 Procedure<br />
When drawing up the inventory analysis,<br />
the actual core <strong>of</strong> an LCA, data categories<br />
oriented firstly to the availability <strong>of</strong> data for<br />
the various sub-processes and also to an<br />
altogether justifiable data balance were<br />
taken into consideration. Data insecurities<br />
in some areas were examined by sensitivity<br />
calculations as to their relevance. It was<br />
derived from this that results only differ<br />
significantly in system comparisons if the<br />
difference exceeds 20 %. Secondly, data<br />
categories needed to determine the most<br />
important environmental impacts for the<br />
investigation were included.<br />
Since according to the defined objective<br />
the study is to discuss the question <strong>of</strong><br />
whether the <strong>PET</strong> material recycling bottle<br />
is ecologically equivalent to other returnable<br />
beverage packaging systems, ecological<br />
impact categories were selected<br />
which on the one hand illustrate the ecological<br />
relevance <strong>of</strong> beverage packaging<br />
systems, and on the other hand correspond<br />
to the public and political priorities<br />
set in Germany. The selected impact<br />
categories and the indicators to be used<br />
are compiled in Table 3.<br />
Both the inventory analysis and the impact<br />
analysis with the aggregation <strong>of</strong> data<br />
to form impact indicators were conducted<br />
with the aid <strong>of</strong> the Umberto ® s<strong>of</strong>tware.<br />
Figure 2: Results for Global Warming Potential in the cut-<strong>of</strong>f-system (left), in the net system<br />
with credit for secondary <strong>PET</strong> (middle) and normalised in population equivalents (right)<br />
kg CO2-Equiv. per 1 000 l beverage<br />
200<br />
150<br />
100<br />
50<br />
0<br />
96,3<br />
Glass ret. C<br />
cut-<strong>of</strong>f without credits<br />
0,7 l 1,0 l 1,5 l<br />
160<br />
132<br />
123<br />
59,5<br />
70,1<br />
<strong>PET</strong> MR C<br />
<strong>PET</strong> MR C<br />
<strong>PET</strong> MR T<br />
<strong>PET</strong> ret. C<br />
L-Glass ret. C<br />
96,6<br />
89,1<br />
51,1<br />
<strong>PET</strong> MR C<br />
<strong>PET</strong> MR T<br />
<strong>PET</strong> ret. C<br />
kg CO2-Equiv. per 1 000 l beverage<br />
200<br />
150<br />
100<br />
50<br />
0<br />
86,9<br />
Glass ret. C<br />
120<br />
net with credits<br />
0,7 l 1,0 l 1,5 l<br />
103<br />
98,2<br />
46,1<br />
63,7<br />
<strong>PET</strong> MR C<br />
<strong>PET</strong> MR C<br />
<strong>PET</strong> MR T<br />
<strong>PET</strong> ret. C<br />
L-Glass ret. C<br />
74,4<br />
68,3<br />
42,4<br />
<strong>PET</strong> MR C<br />
<strong>PET</strong> MR T<br />
<strong>PET</strong> ret. C<br />
in thousand PAV (total market segment)<br />
500<br />
400<br />
300<br />
200<br />
100<br />
0<br />
82,6<br />
Glass ret. C<br />
population average values<br />
0,7 l 1,0 l 1,5 l<br />
114<br />
97,5 93,4<br />
43,8<br />
60,6<br />
<strong>PET</strong> MR C<br />
<strong>PET</strong> MR C<br />
<strong>PET</strong> MR T<br />
<strong>PET</strong> ret. C<br />
L-Glass ret. C<br />
70,8 65<br />
40,3<br />
<strong>PET</strong> MR C<br />
<strong>PET</strong> MR T<br />
<strong>PET</strong> ret. C<br />
<strong>PET</strong> material recycling <strong>PET</strong> returnable Glass or Light-Glass returnable C: crate T: tray<br />
5
Umberto <strong>of</strong>fers comfortable possible ways<br />
<strong>of</strong> describing complex product systems as<br />
material flow networks and process chains<br />
and <strong>of</strong> analysing the results (Schmidt et al.<br />
1997, Möller et al. 2000). The life cycles <strong>of</strong><br />
the systems are mapped as a material<br />
flow network which consists <strong>of</strong> up to 200<br />
individual process modules. Dealing with<br />
multiple product processes or difficult allocations,<br />
drawing up scenarios and conducting<br />
relevance analyses are facilitated<br />
by the s<strong>of</strong>tware. The material flows - broken<br />
down via various network levels - can<br />
be visualised as Sankey diagrams. The<br />
impact assessment is carried out on the<br />
basis <strong>of</strong> the input and output balance <strong>of</strong><br />
the systems and is partly distinguished by<br />
life cycle segments. This makes a sector<br />
analysis possible, i.e. the question as to<br />
which areas make the highest contribution<br />
to the relevant impact indicators can be<br />
answered.<br />
The final evaluation is based on two further<br />
steps. In a standardising step the results<br />
were presented on a different scale.<br />
For this the results <strong>of</strong> the LCA on the market<br />
potentially possible, i.e. on the entire<br />
market segment for mineral water and<br />
lemonades, were calculated for each impact<br />
indicator. Thus it was assumed that<br />
the entire market is serviced by the relevant<br />
packaging system. This would be the<br />
maximum influence which such a packaging<br />
system could exert on the relevant impact<br />
indicator in Germany. This value was<br />
set in relation to the overall value <strong>of</strong> an<br />
impact indicator in Germany and expressed<br />
in terms <strong>of</strong> population average<br />
values (PAV). In other words, a PAV value<br />
<strong>of</strong> e.g. 1000 for GWP means that the relevant<br />
system would contribute as a maximum<br />
just as much to GWP in Germany as<br />
1000 inhabitants if the entire market were<br />
equipped with the system.<br />
In a second step sensitivities were calculated<br />
in which variations <strong>of</strong> altogether 14<br />
system parameters or input data were examined<br />
for their impact on the results <strong>of</strong><br />
the impact analysis. The result <strong>of</strong> these<br />
sensitivity calculations was an optimised<br />
scenario, taking into account the currently<br />
realistic technical and economic general<br />
conditions. The conclusions for this study<br />
resulted from this.<br />
3 Results<br />
Figure 2 shows the graduated procedure<br />
on the basis <strong>of</strong> a calculated impact indicator,<br />
in this case the Global Warming Potential.<br />
The various systems for the stock<br />
purchase sector are first compared without<br />
the use <strong>of</strong> credits (cut-<strong>of</strong>f). Then the credits<br />
for secondary materials are taken into<br />
account (net), and finally the data are<br />
standardised as population average values,<br />
extrapolated to cover the entire market<br />
segment.<br />
This shows on the one hand the influence<br />
<strong>of</strong> the credit method used. It is pos-<br />
Figure 3: Contributions <strong>of</strong> the life cycle segments or processes to the Global Warming Potential<br />
in the two systems "Glass ret. 0.7 l C“ und "<strong>PET</strong> MR 1 l C“<br />
0.7 l Glass Returnable Bottle<br />
1.0 l <strong>PET</strong> Material Recycling Bottle<br />
200<br />
200<br />
<strong>PET</strong> recycling<br />
kg CO2 Equiv. per 1 000 l beverage<br />
150<br />
100<br />
50<br />
18%<br />
9%<br />
10% 11%<br />
33% 37%<br />
28% 31%<br />
Aluminium prod.<br />
Glass bottle prod.<br />
Distribution<br />
Filling / packing<br />
Cap/lid-prod.<br />
Other processes<br />
kg CO2 Equiv. per 1 000 l beverage<br />
150<br />
100<br />
50<br />
7%<br />
32%<br />
9%<br />
13%<br />
4% 5%<br />
34% 43%<br />
8% 10%<br />
6% 8%<br />
9% 11%<br />
<strong>PET</strong>(bottle grade) prod.<br />
Polypropylene prod.<br />
<strong>PET</strong> bottle prod.<br />
Distribution<br />
Filling / packing<br />
Other processes<br />
0<br />
7% 8%<br />
cut <strong>of</strong>f net<br />
0<br />
cut <strong>of</strong>f net<br />
6
sible to examine whether the credits lead<br />
to a change in conclusions, e.g. in the<br />
ranking <strong>of</strong> systems, and these are thus artefacts<br />
<strong>of</strong> the calculations. On the other<br />
hand, the PAV presentation clearly illustrates<br />
the specific importance <strong>of</strong> the relevant<br />
impact category. This study deliberately<br />
refrains from <strong>of</strong>fsetting or aggregating<br />
different impact categories.<br />
Basically, systems <strong>of</strong> stock purchasing<br />
show strong dependence on the filling volume,<br />
which becomes clear as the values<br />
decline from left to right. The returnable<br />
systems <strong>of</strong> the same size (hatched bars in<br />
the chart) come <strong>of</strong>f much better by comparison<br />
with the material recycling systems<br />
(filled bars), especially in this impact<br />
category.<br />
Figure 3 shows the contributions <strong>of</strong> the<br />
various life cycle sections or processes to<br />
the GWP as a so-called sector analysis.<br />
For this the two systems <strong>of</strong> 0.7 l glass returnable<br />
bottle and 1.0 l <strong>PET</strong> material recycling<br />
bottle were selected. In the glass<br />
returnable system the processes filling/packaging<br />
and distribution dominate<br />
the results for the GWP. In the case <strong>of</strong> the<br />
<strong>PET</strong> material recycling system, on the<br />
other hand, the <strong>PET</strong> bottle production and<br />
<strong>PET</strong> production processes dominate.<br />
The sectoral analysis again clearly<br />
shows the influence <strong>of</strong> the credit method<br />
between the cut-<strong>of</strong>f and net approaches.<br />
In the case <strong>of</strong> the glass returnable system,<br />
the credit produces effects chiefly in the<br />
case <strong>of</strong> aluminium production (for the bottle<br />
caps). Other credits play practically no<br />
role here. The determining processes <strong>of</strong><br />
bottling/packing and distribution are not<br />
sensitive to system allocations. In the case<br />
<strong>of</strong> the <strong>PET</strong> material recycling system, the<br />
credit method has effects on the process<br />
<strong>of</strong> <strong>PET</strong> production. The credit for secondary<br />
<strong>PET</strong> farmed out from the system<br />
leads to a reduction <strong>of</strong> the GWP.<br />
A special challenge in LCAs is to<br />
achieve clear presentation <strong>of</strong> the many<br />
quantitative data from the inventory analysis<br />
or the impact analysis. Figure 4 shows<br />
all 12 impact indicators taken into account<br />
for the system <strong>of</strong> stock purchasing in the<br />
form <strong>of</strong> a so called Hoepfner diagram,<br />
which was applied the first time in this<br />
study. This allows a fast overview <strong>of</strong> the<br />
behaviour <strong>of</strong> various indicators with regard<br />
to the systems. For the presentation in this<br />
paper the PAV values were selected (the<br />
cut-<strong>of</strong>f and net values are also documented<br />
as Hoepfner diagrams in the final<br />
report <strong>of</strong> the LCA).<br />
Some indicators show a rather slight<br />
specific contribution in the PAV presentation.<br />
This applies e.g. for the indicator<br />
"cancer risk potential". However, the "landfill<br />
area" also makes a lower specific contribution,<br />
yet this does not say anything<br />
about its ecological relevance. The two indicators<br />
"vehicle mileage" and "acidification<br />
potential" show the greatest specific<br />
contributions with values above 200,000<br />
PAV. Here the ranking <strong>of</strong> systems runs<br />
counter-clockwise: the <strong>PET</strong> material recycling<br />
systems come <strong>of</strong>f best in the vehicle<br />
mileage, and worst as regards the acidification<br />
potential.<br />
The system <strong>of</strong> the 0.7 l glass returnable<br />
bottle can certainly be considered as a<br />
benchmark. This bottle is the most widespread<br />
in the market and enjoys the general<br />
reputation <strong>of</strong> being environmentally<br />
sound. This comparison is shown in Table<br />
4, whereby the significance threshold <strong>of</strong> 20<br />
% was selected. It cannot be stated clearly<br />
at this point which system comes <strong>of</strong>f as<br />
more environmentally sound in the comparison.<br />
That depends on the weighting <strong>of</strong><br />
the various impact categories. Conversely,<br />
it is possible to ascertain that at least with<br />
the impact indicators CED, POCP and<br />
acidification potential, the material recycling<br />
system has disadvantages by comparison<br />
with the glass returnable bottle. In<br />
the case <strong>of</strong> CED, the <strong>PET</strong> material recycling<br />
system comes <strong>of</strong>f about 25 % worse,<br />
in the case <strong>of</strong> POCP 400 % worse, and in<br />
the case <strong>of</strong> acidification potential 67 %<br />
worse. Thus no clear trend, for instance a<br />
"winner" or "loser", can be derived from<br />
the results.<br />
This situation changes basically if a<br />
more modern system such as the <strong>PET</strong> returnable<br />
bottle is taken as a benchmark.<br />
The comparison between the <strong>PET</strong> material<br />
recycling bottle and the <strong>PET</strong> returnable<br />
bottle shows a much less favourable result<br />
for the material recycling system. The result<br />
compiled in Table 5 emerges here.<br />
Thus the <strong>PET</strong> returnable system is clearly<br />
the better system. The two systems are<br />
only equivalent in a few points.<br />
7
Figure 4: Comparison <strong>of</strong> beverage packaging systems for 12 impact indicators, stated as net<br />
values (i.e. incl. credit) and in Population Average Values (PAV) (see text)<br />
in 1000 PAV (total market segment)<br />
in 1000 PAV (total market segment)<br />
in 1000 PAV (total market segment)<br />
500<br />
400<br />
300<br />
200<br />
100<br />
0<br />
97,7<br />
Glass ret. C<br />
500<br />
400<br />
300<br />
200<br />
100<br />
0<br />
145<br />
CED, total<br />
0,7 l 1,0 l 1,5 l<br />
57,1<br />
Glass ret. C<br />
500<br />
400<br />
300<br />
200<br />
100<br />
0<br />
123 119<br />
<strong>PET</strong> MR C<br />
<strong>PET</strong> MR C<br />
<strong>PET</strong> MR T<br />
<strong>PET</strong> ret. C<br />
L-Glass ret. C<br />
32,3 28,7 28,4 33,4<br />
60,5 72,5 89,4 82,9<br />
52,3<br />
46<br />
<strong>PET</strong> MR C<br />
<strong>PET</strong> MR C<br />
<strong>PET</strong> MR T<br />
<strong>PET</strong> ret. C<br />
L-Glass ret. C<br />
<strong>PET</strong> MR C<br />
<strong>PET</strong> MR T<br />
<strong>PET</strong> ret. C<br />
Process water consumption<br />
0,7 l 1,0 l 1,5 l<br />
17,2<br />
Glass ret. C<br />
94<br />
POCP<br />
25,5 22,8 37,3<br />
<strong>PET</strong> MR C<br />
<strong>PET</strong> MR T<br />
<strong>PET</strong> ret. C<br />
0,7 l 1,0 l 1,5 l<br />
70,4 84,9 29,8<br />
12,2<br />
52,7 56,3<br />
<strong>PET</strong> MR C<br />
<strong>PET</strong> MR C<br />
<strong>PET</strong> MR T<br />
<strong>PET</strong> ret. C<br />
L-Glass ret. C<br />
28<br />
<strong>PET</strong> MR C<br />
<strong>PET</strong> MR T<br />
<strong>PET</strong> ret. C<br />
in 1000 PAV (total market segment)<br />
in 1000 PAV (total market segment)<br />
in 1000 PAV (total market segment)<br />
500<br />
400<br />
300<br />
200<br />
100<br />
0<br />
Crude oil resources equivalence values<br />
Glass ret. C<br />
500<br />
400<br />
300<br />
200<br />
100<br />
0<br />
0,7 l 1,0 l 1,5 l<br />
110 104<br />
87,5 82,9 79,8<br />
57,8<br />
82,6<br />
Glass ret. C<br />
500<br />
400<br />
300<br />
200<br />
100<br />
0<br />
<strong>PET</strong> MR C<br />
<strong>PET</strong> MR C<br />
<strong>PET</strong> MR T<br />
<strong>PET</strong> ret. C<br />
L-Glass ret. C<br />
62,7 54,6 52,2<br />
<strong>PET</strong> MR C<br />
<strong>PET</strong> MR T<br />
<strong>PET</strong> ret. C<br />
Global warming potential (GWP)<br />
0,7 l 1,0 l 1,5 l<br />
61,2<br />
Glass ret. C<br />
114<br />
97,5 93,4<br />
43,8 60,6 70,8 65<br />
40,3<br />
151<br />
<strong>PET</strong> MR C<br />
<strong>PET</strong> MR C<br />
<strong>PET</strong> MR T<br />
<strong>PET</strong> ret. C<br />
L-Glass ret. C<br />
NCPOCP<br />
<strong>PET</strong> MR C<br />
<strong>PET</strong> MR T<br />
<strong>PET</strong> ret. C<br />
0,7 l 1,0 l 1,5 l<br />
120 128 86,6 83,4<br />
59,8 56,2<br />
43,1<br />
<strong>PET</strong> MR C<br />
<strong>PET</strong> MR C<br />
<strong>PET</strong> MR T<br />
<strong>PET</strong> ret. C<br />
L-Glass ret. C<br />
<strong>PET</strong> MR C<br />
<strong>PET</strong> MR T<br />
<strong>PET</strong> ret. C<br />
<strong>PET</strong> material recycling <strong>PET</strong> returnable Glass or Light-Glass returnable C: crate T: tray<br />
8
in 1000 PAV (total market segment)<br />
500<br />
400<br />
300<br />
200<br />
100<br />
0<br />
99,4<br />
Glass ret. C<br />
Acidification potential<br />
0,7 l 1,0 l 1,5 l<br />
202<br />
166 171<br />
73,1 71,4<br />
<strong>PET</strong> MR C<br />
<strong>PET</strong> MR C<br />
<strong>PET</strong> MR T<br />
<strong>PET</strong> ret. C<br />
L-Glass ret. C<br />
120 117<br />
<strong>PET</strong> MR C<br />
<strong>PET</strong> MR T<br />
<strong>PET</strong> ret. C<br />
66,7<br />
in 1000 PAV (total market segment)<br />
500<br />
400<br />
300<br />
200<br />
100<br />
0<br />
Glass ret. C<br />
Eutrophication potential<br />
0,7 l 1,0 l 1,5 l<br />
62,7 66,8 56,1 54,8<br />
32,5 44,5 39,5 35,2 31,5<br />
<strong>PET</strong> MR C<br />
<strong>PET</strong> MR C<br />
<strong>PET</strong> MR T<br />
<strong>PET</strong> ret. C<br />
L-Glass ret. C<br />
<strong>PET</strong> MR C<br />
<strong>PET</strong> MR T<br />
<strong>PET</strong> ret. C<br />
in 1000 PAV (total market segment)<br />
in 1000 PAV (total market segment)<br />
500<br />
400<br />
300<br />
200<br />
100<br />
0<br />
Glass ret. C<br />
500<br />
400<br />
300<br />
200<br />
100<br />
0<br />
Glass ret. C<br />
Cancer risk potential<br />
0,7 l 1,0 l 1,5 l<br />
13,0 9,4 8,0 5,8 5,6 9,2 5,6 4,0 5,5<br />
86,6 80,5 80,5 78,6<br />
<strong>PET</strong> MR C<br />
<strong>PET</strong> MR C<br />
<strong>PET</strong> MR T<br />
<strong>PET</strong> ret. C<br />
L-Glass ret. C<br />
Wood consumption<br />
<strong>PET</strong> MR C<br />
<strong>PET</strong> MR T<br />
<strong>PET</strong> ret. C<br />
0,7 l 1,0 l 1,5 l<br />
11,5<br />
48,6<br />
<strong>PET</strong> MR C<br />
<strong>PET</strong> MR C<br />
<strong>PET</strong> MR T<br />
<strong>PET</strong> ret. C<br />
L-Glass ret. C<br />
58,8 57,3 46,7<br />
<strong>PET</strong> MR C<br />
<strong>PET</strong> MR T<br />
<strong>PET</strong> ret. C<br />
in 1000 PAV (total market segment)<br />
in 1000 PAV (total market segment)<br />
500<br />
400<br />
300<br />
200<br />
100<br />
0<br />
368,0<br />
Glass ret. C<br />
500<br />
400<br />
300<br />
200<br />
100<br />
0<br />
Vehicle mileage (total)<br />
0,7 l 1,0 l 1,5 l<br />
54,3<br />
Glass ret. C<br />
166,0 158,0<br />
99,0<br />
142,0<br />
249,0<br />
<strong>PET</strong> MR C<br />
<strong>PET</strong> MR C<br />
<strong>PET</strong> MR T<br />
<strong>PET</strong> ret. C<br />
L-Glass ret. C<br />
Landfill area<br />
31,2 26,7 31,2<br />
14,0<br />
33,8<br />
<strong>PET</strong> MR C<br />
<strong>PET</strong> MR C<br />
<strong>PET</strong> MR T<br />
<strong>PET</strong> ret. C<br />
L-Glass ret. C<br />
91,0<br />
38,2<br />
142,0<br />
<strong>PET</strong> MR C<br />
<strong>PET</strong> MR T<br />
<strong>PET</strong> ret. C<br />
0,7 l 1,0 l 1,5 l<br />
19,7 20,0 14,0<br />
<strong>PET</strong> MR C<br />
<strong>PET</strong> MR T<br />
<strong>PET</strong> ret. C<br />
<strong>PET</strong> material recycling <strong>PET</strong> returnable Glass or Light-Glass returnable C: crate T: tray<br />
9
4 Interpretation<br />
A large number <strong>of</strong> sensitivity analyses<br />
were conducted in the interpretation which<br />
are documented in detail in the LCA report<br />
and form an essential component <strong>of</strong> the<br />
LCA. On the one hand they show what influence<br />
changes on assumptions and system<br />
parameters have on the result <strong>of</strong> the<br />
LCA. On the other hand, they serve to<br />
identify relevant potential for improvement<br />
for the systems considered. One interesting<br />
example here is the impact <strong>of</strong> various<br />
recycling quotas and credit methods for<br />
<strong>PET</strong> on the results <strong>of</strong> the LCA (Figure 5).<br />
The proportion <strong>of</strong> recycled <strong>PET</strong> which<br />
can technically be used in new <strong>bottles</strong><br />
cannot be determined reliably at the present<br />
time, since <strong>PET</strong> material recycling<br />
systems do not yet have sufficient experience.<br />
Therefore a rate <strong>of</strong> use <strong>of</strong> 50 % new<br />
material in the <strong>PET</strong> material recycling <strong>bottles</strong><br />
was assumed for the standard scenarios.<br />
The mode <strong>of</strong> recycling <strong>of</strong> the <strong>PET</strong> material<br />
leaving the system boundaries in the<br />
open loop has an essential influence on<br />
the overall results. It can be assumed that<br />
initially nearly all the <strong>PET</strong> secondary material<br />
is recycled in high-grade applications.<br />
The long-term recycling paths <strong>of</strong> the secondary<br />
<strong>PET</strong> can only be determined after<br />
the market finds it feet. In the standard<br />
systems it is assumed that 90 % <strong>of</strong> the<br />
secondary <strong>PET</strong> replaces new <strong>PET</strong> amorphous.<br />
The remaining 10 % are not provided<br />
with any credit here.<br />
In the sensitivity consideration the recycling<br />
quotas and recycling paths are varied.<br />
In the worst case, the recycling quota<br />
is 0 % and the entire <strong>PET</strong> material is incinerated,<br />
whereby 90 % heavy fuel oil is<br />
substituted. In the best case 90 % <strong>of</strong> the<br />
secondary material can be used in the<br />
new <strong>bottles</strong> and remaining <strong>PET</strong> replaces<br />
90 % <strong>PET</strong>, amorphously. The result shown<br />
in figure 5, specially for the two indicators<br />
CED and eutrophication potential, stresses<br />
the importance <strong>of</strong> the recycling quotas and<br />
selection <strong>of</strong> credit procedure. If the <strong>PET</strong><br />
material is largely recycled (RQ=90 %),<br />
then the question <strong>of</strong> whether the <strong>PET</strong><br />
farmed out from the system is recycled<br />
materially or thermally becomes <strong>of</strong> secon-<br />
Figure 5: Sensitivity calculation for the credit / recycling quota <strong>of</strong> secondary <strong>PET</strong> for the two<br />
impact indicators CED and eutrophication. The left bar in the charts is the "Benchmark" <strong>of</strong> the<br />
0.7-litre glass bottle<br />
CED, total<br />
Eutrophication potential<br />
4000<br />
0,2<br />
MJ per 1 000 l beverage<br />
3000<br />
2000<br />
1000<br />
1350<br />
1690<br />
+ 41,4 %<br />
+ 18,3 %<br />
- 0,6 % + 1,1 % - 1,1 %<br />
kg PO4 Equiv. per 1 000 l beverage<br />
0,15<br />
0,1<br />
0,05<br />
0,0538<br />
+ 155 %<br />
+ 62,4 %<br />
+ 17,0 %<br />
0,0482<br />
- 12,9 % - 13,9 %<br />
0<br />
0<br />
Glass ret. C<br />
<strong>PET</strong> MR C<br />
RQ=0% credit: incin.<br />
RQ=50% credit: incin.<br />
RQ=90% credit: incin.<br />
RQ=0% credit: <strong>PET</strong><br />
RQ=90% credit: <strong>PET</strong><br />
Glass ret. C<br />
<strong>PET</strong> MR C<br />
RQ=0% credit: incin.<br />
RQ=50% credit: incin.<br />
RQ=90% credit: incin.<br />
RQ=0% credit: <strong>PET</strong><br />
RQ=90% credit: <strong>PET</strong><br />
Basic value Variations Figures rounded<br />
10
dary importance. If secondary <strong>PET</strong> is not<br />
used or is only used with a low percentage<br />
for new <strong>bottles</strong> (closed loop), then the material<br />
recycling (in other words a credit for<br />
<strong>PET</strong> amorphous) is definitely preferable to<br />
thermal recycling. A low <strong>PET</strong> recycling<br />
component in the system and thermal recycling<br />
would make the <strong>PET</strong> material recycling<br />
system appear much worse than in<br />
the case <strong>of</strong> assumptions on the standard<br />
scenario.<br />
An overview <strong>of</strong> the various sensitivities<br />
calculated is shown in Figure 6. This is<br />
grouped on the basis <strong>of</strong> sensitivities in the<br />
individual process management or scenario<br />
assumptions at system level. It is<br />
apparent that changed assumptions in the<br />
process management - especially in the<br />
Figure 6: Overview <strong>of</strong> the sensitivity calculations with their impact on the indicators CED and<br />
acidification potential in the system "<strong>PET</strong>-MR 1.0 l C"<br />
60<br />
50<br />
Process management<br />
Scenario assumptions<br />
40<br />
30<br />
20<br />
10<br />
0<br />
-10<br />
-20<br />
<strong>PET</strong> production<br />
bottle production<br />
<strong>PET</strong> recycling<br />
PP production<br />
filling<br />
bottle weight<br />
central redistribution<br />
<strong>PET</strong> production<br />
bottle production<br />
<strong>PET</strong> recycling<br />
PP production<br />
filling<br />
bottle weight<br />
central redistribution<br />
tray instead <strong>of</strong> crate<br />
credits<br />
Deviation <strong>of</strong> the CED in %<br />
recycling quota<br />
with beverage<br />
Deviation <strong>of</strong> the acification potential in %<br />
regional distribution<br />
return quota<br />
credit PP-screw cap<br />
60<br />
50<br />
40<br />
30<br />
20<br />
10<br />
0<br />
-10<br />
Process management<br />
-20<br />
tray instead <strong>of</strong> crate<br />
credits<br />
recycling quota<br />
with beverage<br />
regional distribution<br />
return quota<br />
credit PP-screw cap<br />
Scenario assumptions<br />
11
direction <strong>of</strong> improved process management<br />
such as are currently technically<br />
possible and appear feasible on the market<br />
- lead to changes in the two impact indicators,<br />
ranging from a few percent to<br />
about 10 percent. Changes in the system<br />
parameters have an essentially greater influence.<br />
Other assumptions regarding the<br />
credit for secondary materials or the recycling<br />
quotas can influence the results by<br />
several 10 percent, and generally even<br />
worsen them (= increase <strong>of</strong> values). These<br />
sensitivities are to be assessed individually,<br />
i.e. their contribution to results is always<br />
only based on the relevant measure;<br />
the contributions cannot be added. If the<br />
interaction <strong>of</strong> several measures is to be<br />
considered, overall scenarios must be calculated.<br />
Finally, in the sensitivity calculations<br />
several assumptions were changed at the<br />
same time and such overall scenarios<br />
were calculated. In accordance with the<br />
objective specified for this examination, attempts<br />
were made to set up an optimised<br />
scenario for the <strong>PET</strong> material recycling<br />
system. For this a reduced bottle weight,<br />
optimised <strong>PET</strong> bottle production, optimised<br />
filling, filling without rinsing and optimised<br />
<strong>PET</strong> recycling were assumed. This<br />
scenario can be considered as a scenario<br />
using the best technologies currently<br />
available on the market and the current<br />
possible improvement (e.g. bottle weight).<br />
The technologies can be realised today or<br />
are already in operation. By comparison<br />
with this, assumptions which would be<br />
speculative at the present time were omitted.<br />
These include in particular improved<br />
recycling quotas for <strong>PET</strong>.<br />
The optimising leads to a clear improvement<br />
<strong>of</strong> the <strong>PET</strong> material recycling<br />
system considered (Table 6). By comparison<br />
with the glass system the <strong>PET</strong> system<br />
now comes <strong>of</strong>f as set out below.<br />
The optimised material recycling system<br />
only comes <strong>of</strong>f worse than the glass<br />
returnable system for the impact indicators<br />
POCP and acidification potential. Otherwise<br />
it can be considered as equivalent or<br />
even better than the glass returnable system.<br />
However, this does not represent a<br />
final overall assessment, since the ecological<br />
relevance <strong>of</strong> the impact indicators<br />
in relation to each other has not been considered<br />
in this study.<br />
If one wish to be on the safe side, irrespective<br />
<strong>of</strong> ranking or weighting <strong>of</strong> the impact<br />
categories, and to produce ecological<br />
equivalence on the <strong>PET</strong> material recycling<br />
systems and the 0.7 l glass returnable system,<br />
the acidification potential has to be<br />
reduced further by about 1/3 <strong>of</strong> the value<br />
(starting from the already optimised system).<br />
The POCP value has to be reduced<br />
by as much as 2/3. The relevant influence<br />
parameter is the process <strong>of</strong> <strong>PET</strong> production<br />
here. With its hydrocarbon emissions<br />
it contributes chiefly to the POCP value. In<br />
the case <strong>of</strong> acidification potential, <strong>PET</strong><br />
production accounts for at least 35 %<br />
(net). In addition, the process <strong>of</strong> bottle<br />
production with 30 % is also relevant here.<br />
These two processes would have to be<br />
improved considerably in order to achieve<br />
ecological equivalence in these categories.<br />
The ecological equivalence would then<br />
only be effected by comparison with the<br />
0.7 l glass returnable bottle - which is still<br />
dominant on the market and generally<br />
considered to be environmentally sound.<br />
The <strong>PET</strong> returnable systems would then<br />
still have clear advantages over the <strong>PET</strong><br />
material recycling system.<br />
5. Conclusions<br />
An essential assumption in the packaging<br />
systems presented is that the <strong>PET</strong> material<br />
recycling systems are operated with a<br />
high share <strong>of</strong> high-grade recycled <strong>PET</strong> in a<br />
closed loop. Although initial experience in<br />
practice on an international basis is available<br />
here, an important question focuses<br />
on the technical and legal feasibility presumed<br />
for this LCA. It was assumed that<br />
50 % recycled <strong>PET</strong> is used in bottle production.<br />
This assumption appears to be altogether<br />
plausible, and technically even<br />
conservative. However, it is not conclusive<br />
for a real system. If the assumption does<br />
not materialise, the results change to the<br />
detriment <strong>of</strong> <strong>PET</strong> material recycling systems.<br />
On the other hand, the contributions <strong>of</strong><br />
<strong>PET</strong> production could be reduced further if<br />
recycled <strong>PET</strong> were used in a quasi closed<br />
loop system to a greater extent, in other<br />
words if recycled <strong>PET</strong> were used for bottle<br />
production again. A further increase <strong>of</strong> the<br />
assumed 50 % would come out clearly in<br />
12
Table 4: Comparison <strong>of</strong> results <strong>of</strong> the “<strong>PET</strong> material recycling bottle” and the benchmark<br />
“pearl-glass bottle”<br />
“<strong>PET</strong> material recycling 1.0 l crate” compared with “Glass ret. 0.7 l crate”<br />
better in: same in: worse in:<br />
process water consumption global warming potential CED<br />
vehicle mileage eutrophication potential POCP<br />
landfill area wood consumption acidification potential<br />
Significance threshold:<br />
> 20 % difference ≤ 20 % difference > 20 % difference<br />
Table 5: Comparison <strong>of</strong> results <strong>of</strong> the “<strong>PET</strong> material recycling bottle” and the returnable <strong>PET</strong><br />
bottle<br />
“<strong>PET</strong> material recycling 1.0 l crate” compared with “<strong>PET</strong> ret. 1.0 l crate”<br />
better in: same in: worse in:<br />
process water consumption CED<br />
vehicle mileage<br />
global warming potential<br />
POCP<br />
acidification potential<br />
eutrophication potential<br />
wood consumption<br />
landfill area<br />
Significance threshold:<br />
> 20 % difference ≤ 20 % difference > 20 % difference<br />
Table 6: Comparison <strong>of</strong> results for an optimised system <strong>of</strong> the “<strong>PET</strong> material recycling bottle”<br />
and the benchmark “pearl-glass bottle”<br />
“<strong>PET</strong> material recycling 1.0 l crate optimised” compared with “Glass ret. 0.7 l<br />
crate”<br />
better in: same in: worse in:<br />
process water consumption CED POCP<br />
eutrophication potential global warming potential acidification potential<br />
vehicle mileage<br />
wood consumption<br />
landfill area<br />
Significance threshold:<br />
> 20 % difference ≤ 20 % difference > 20 % difference<br />
13
favour <strong>of</strong> the balance for <strong>PET</strong> material recycling<br />
systems. However, it must be considered<br />
that for this, high return quotas are<br />
necessary and the systems must be designed<br />
accordingly. Thus for instance the<br />
systems with the tray as transport packing<br />
have slight ecological advantages over<br />
systems with crates. However, as a result<br />
disadvantages could occur in the return<br />
quotas, which would have an altogether<br />
negative effect.<br />
The attempt to achieve higher recycling<br />
use quotas in a closed loop system would<br />
also increase the expressive force <strong>of</strong> the<br />
LCA, since it would be possible to largely<br />
refrain from applying allocation regulations<br />
for secondary materials.<br />
On the basis <strong>of</strong> these results the following<br />
recommendations can be made.<br />
• Design the material recycling systems<br />
in such a way that the highest possible<br />
return quotas can be realised and<br />
these can be sustained in reality. This<br />
has a considerable influence on the<br />
collection and distribution systems<br />
used. For instance tray systems are<br />
not advisable.<br />
• The quota for use <strong>of</strong> recycled material<br />
in a closed loop system should be improved<br />
as far as possible, i.e. the<br />
technical and food law conditions for<br />
this should be secured. The target<br />
should be a quota <strong>of</strong> at least 50 %.<br />
• The processes for <strong>PET</strong> production,<br />
<strong>PET</strong> bottle production, bottling and<br />
<strong>PET</strong> recycling should be optimised further.<br />
For this in particular the hydrocarbon<br />
emissions and acid creating<br />
emissions (SO2, NOx) should be reduced.<br />
• The receptacle weights should be reduced<br />
further. The 1.0 l bottle weight <strong>of</strong><br />
27 g should be the goal.<br />
• The production data for <strong>PET</strong> bottlegrade<br />
granules should be reconsidered<br />
and updated.<br />
In the political decision-making process it<br />
should be clarified with which packaging<br />
systems the <strong>PET</strong> material recycling system<br />
has to be compared and considered<br />
ecologically equivalent in order to be<br />
treated in the same way as returnable systems.<br />
Literature<br />
BMU - Bundesministerium für Umwelt, Naturschutz<br />
und Reaktorsicherheit (2000):<br />
Mehrweganteil bei Getränkeverpackungen<br />
weiter gesunken. In: Umwelt. Heft<br />
5/2000, Berlin, p. 267-268<br />
Möller, A. et al. (2000): Foundations and<br />
Applications <strong>of</strong> computer based Material<br />
Flow Networks for Environmental Management.<br />
In: Rautenstrauch, C. (ed.):<br />
Environmental Information Systems in<br />
Industry and Public Administration, Hershey/PA,<br />
London. In print.<br />
Ostermayer, A. et al. (1999): Ökobilanz<br />
der <strong>PET</strong>-St<strong>of</strong>fkreislauf-Flasche und anderer<br />
Getränkeverpackungssysteme. Im<br />
Auftrag der <strong>PET</strong>CYCLE Arbeits- und<br />
Entwicklungsgemeinschaft GmbH & Co.<br />
KG. ifeu-Institut Heidelberg<br />
Projektgemeinschaft Lebenswegbilanzen:<br />
Ökobilanzen für Verpackungen (1994):<br />
UBA-Vorhaben 103 03 220/04. Fraunh<strong>of</strong>er-Institut<br />
für Lebensmitteltechnologie<br />
und Verpackung München, ifeu-Institut<br />
für Energie- und Umweltforschung Heidelberg,<br />
Gesellschaft für Verpackungsmarktforschung<br />
Wiesbaden<br />
Prognos / ifeu (1999): Ökobilanz für die<br />
leichte <strong>PET</strong>-Mehrwegflasche. Im Auftrag<br />
der Gerolsteiner Brunnen GmbH & Co.<br />
Basel (CH)<br />
Prognos / ifeu (1999): Ökobilanz für <strong>PET</strong>und<br />
Glasflaschen für Mineralwasser. Im<br />
Auftrag der Genossenschaft Deutscher<br />
Brunnen. Basel (CH)<br />
Schmidt, M. et al. (1997): Environmental<br />
Material Flow Analyses by Network Approach.<br />
In: Geiger, W. et al. (eds.): Informatique<br />
pour l`Environnement `97.<br />
Conférence Européenne sur les Technologies<br />
de l`Information pour<br />
l`Environnment, Strasbourg 1997. Marburg,<br />
p. 768-779<br />
TNO (Ed.) (1996): Recycled <strong>PET</strong> flakes as<br />
a raw material for food packaging. Voerding<br />
(NL)<br />
Welle, F.; Franz, R. (1998): Prüfbericht,<br />
Migrationsanalytische Begleitung und lebensmittelrechtliche<br />
Bewertung eines<br />
Challenge-Tests für das Stehning-<br />
Verfahren zur st<strong>of</strong>flichen Verwertung von<br />
post-consumer <strong>PET</strong>-Flaschen für den<br />
erneuten Lebensmitteldirektkontakt.<br />
Fraunh<strong>of</strong>er-Institut f. Verfahrenstechnik<br />
u. Verpackung, Freising<br />
14