article in press - und Umweltmanagement - Hochschule Pforzheim
article in press - und Umweltmanagement - Hochschule Pforzheim
article in press - und Umweltmanagement - Hochschule Pforzheim

Create successful ePaper yourself
Turn your PDF publications into a flip-book with our unique Google optimized e-Paper software.
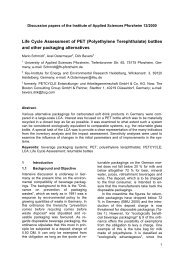
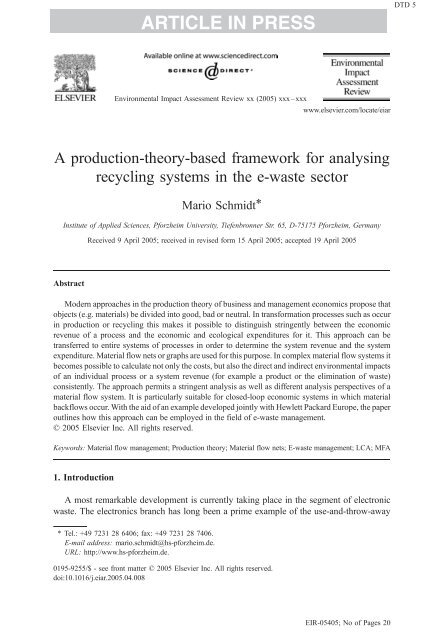
ARTICLE IN PRESSDTD 5Environmental Impact Assessment Review xx (2005) xxx–xxxwww.elsevier.com/locate/eiarA production-theory-based framework for analys<strong>in</strong>grecycl<strong>in</strong>g systems <strong>in</strong> the e-waste sectorMario Schmidt*Institute of Applied Sciences, <strong>Pforzheim</strong> University, Tiefenbronner Str. 65, D-75175 <strong>Pforzheim</strong>, GermanyReceived 9 April 2005; received <strong>in</strong> revised form 15 April 2005; accepted 19 April 2005AbstractModern approaches <strong>in</strong> the production theory of bus<strong>in</strong>ess and management economics propose thatobjects (e.g. materials) be divided <strong>in</strong>to good, bad or neutral. In transformation processes such as occur<strong>in</strong> production or recycl<strong>in</strong>g this makes it possible to dist<strong>in</strong>guish str<strong>in</strong>gently between the economicrevenue of a process and the economic and ecological expenditures for it. This approach can betransferred to entire systems of processes <strong>in</strong> order to determ<strong>in</strong>e the system revenue and the systemexpenditure. Material flow nets or graphs are used for this purpose. In complex material flow systems itbecomes possible to calculate not only the costs, but also the direct and <strong>in</strong>direct environmental impactsof an <strong>in</strong>dividual process or a system revenue (for example a product or the elim<strong>in</strong>ation of waste)consistently. The approach permits a str<strong>in</strong>gent analysis as well as different analysis perspectives of amaterial flow system. It is particularly suitable for closed-loop economic systems <strong>in</strong> which materialbackflows occur. With the aid of an example developed jo<strong>in</strong>tly with Hewlett Packard Europe, the paperoutl<strong>in</strong>es how this approach can be employed <strong>in</strong> the field of e-waste management.D 2005 Elsevier Inc. All rights reserved.Keywords: Material flow management; Production theory; Material flow nets; E-waste management; LCA; MFA1. IntroductionA most remarkable development is currently tak<strong>in</strong>g place <strong>in</strong> the segment of electronicwaste. The electronics branch has long been a prime example of the use-and-throw-away* Tel.: +49 7231 28 6406; fax: +49 7231 28 7406.E-mail address: mario.schmidt@hs-pforzheim.de.URL: http://www.hs-pforzheim.de.0195-9255/$ - see front matter D 2005 Elsevier Inc. All rights reserved.doi:10.1016/j.eiar.2005.04.008EIR-05405; No of Pages 20
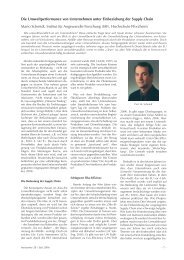
ARTICLE IN PRESS2M. Schmidt / Environmental Impact Assessment Review xx (2005) xxx–xxxsociety. Technical <strong>in</strong>novations and customer demand lead to ever shorter product lives.Mobile telephones now have a service life of just <strong>und</strong>er two years. It is generally not worthrepair<strong>in</strong>g defective equipment. Consequently the typical life cycle of an electronicappliance is a l<strong>in</strong>ear progress from production, through use, to waste disposal.The EU’s WEEE Directive (waste of electronic and electrical equipment) obligatesmanufacturers of electronic and electrical equipment to take back old equipment fromcustomers free of charge and to dispose of these wastes <strong>in</strong> an environmentally so<strong>und</strong>manner. The Directive specifies recycl<strong>in</strong>g quotas accord<strong>in</strong>g to which the old appliances ortheir materials must be reused and channelled back <strong>in</strong>to the economic cycle. In this wayl<strong>in</strong>ear material flow management with a throw-away mentality becomes a closed-loopmaterial flow management with a high recycl<strong>in</strong>g target – <strong>und</strong>er duress on the basis ofgovernment stipulations.The closed-loop material flow management is one of the meta-strategies ofsusta<strong>in</strong>able development. Economical handl<strong>in</strong>g of the natural resources of this worldcan be achieved not merely by renunciation, but also by reuse and recycl<strong>in</strong>g of theproducts. Despite this a question still to be answered concerns the price at whichclosed-loop material flow management is possible. Observance of the WEEEstipulations <strong>in</strong>volves costs, which the manufactur<strong>in</strong>g firms naturally want to m<strong>in</strong>imise.Furthermore, for f<strong>und</strong>amental physical reasons a closed-loop material flow managementsystem can never be completely closed and function as a self-conta<strong>in</strong>ed entity.Accord<strong>in</strong>g to the rules of thermodynamics it requires at least energy <strong>in</strong> order tostructure order and reduce the entropy. If this energy is not generated <strong>in</strong> anenvironmentally so<strong>und</strong> manner, e.g. solar energy, there is not necessarily an ecologicalbenefit <strong>in</strong> the closed-loop material flow management system which then depends onthe concrete structur<strong>in</strong>g of the closed-loop system.This makes it clear that <strong>in</strong> future methodology approaches are necessary that allow aholistic analysis of closed-loop material flow management systems <strong>und</strong>er both economicand ecological aspects. Look<strong>in</strong>g at the example of electronic waste, even socialcomponents have to be added. In Germany electrical equipment has so far chiefly beendismantled and recycled by workshops provid<strong>in</strong>g employment for handicapped orchallenged persons. These workshops were granted subsidies by society. However, thestrict stipulations of the WEEE Directive force manufacturers to build up efficient andcost-optimised reverse logistics and recycl<strong>in</strong>g systems. Facilities on a large technical scalewith high-quantity throughputs will be given preference over manual dismantl<strong>in</strong>g bydecentrally distributed social facilities.The problem of the quantitative analysis methods customary so far is that they canhardly be applied for closed-loop material flow management systems. Classic managementtheory focuses on products, not on wastes, that for a long time did not cost anyth<strong>in</strong>g.However, if these are taken <strong>in</strong>to account despite this, then as costs for the establishments oras macro-economic damage, but not as possible secondary raw materials <strong>in</strong> a closed-loopmaterial flow management system. On the other hand environmentally oriented analysessuch as, for example, the Life Cycle Assessment of products and services only consider theimpacts on the environment (ISO, 14.040). Admittedly recycl<strong>in</strong>g systems are analysed ona large scale here too (UBA, 1999), but so far the economic aspect and hence the costshave not been <strong>in</strong>tegrated.
ARTICLE IN PRESSM. Schmidt / Environmental Impact Assessment Review xx (2005) xxx–xxx 3In cooperation with Hewlett-Packard Europe possible waste disposal scenarios forelectronic scrap <strong>in</strong> Europe were analysed us<strong>in</strong>g a new method <strong>in</strong> which the material andenergy flows were tracked <strong>in</strong> a complex system and can be analysed both ecologically andeconomically. Methodology approaches that have been developed <strong>in</strong> the German-speak<strong>in</strong>garea <strong>in</strong> recent years and are based on the one hand on the production theory of bus<strong>in</strong>essand management economics (Dyckhoff, 1994) and on the other hand on the concept ofmaterial flow nets from environmental <strong>in</strong>formatics (Möller, 1994, 2000) were applied. Thebasic features of these approaches are outl<strong>in</strong>ed here and their significance for closed-loopmaterial flow management systems such as e.g. the electronic waste segment are po<strong>in</strong>tedup. However, these methods can naturally also be applied to other sectors. They are nowbe<strong>in</strong>g used by the packag<strong>in</strong>g waste collection organisation Duales System Deutschland toanalyse material flows of packag<strong>in</strong>g wastes labelled with the system’s bGreen Po<strong>in</strong>tQ(DSD, 2003, 41f.), as well as for analys<strong>in</strong>g and optimis<strong>in</strong>g operat<strong>in</strong>g production centres(LfU, 2004).2. Production theory as the start<strong>in</strong>g po<strong>in</strong>tAs Dyckhoff (2003, 710) ascerta<strong>in</strong>s, production theory focuses on the transformation ofobjects. bObjectsQ are here <strong>und</strong>erstood to mean products and goods. In a wider sense theyare also considered to <strong>in</strong>clude <strong>und</strong>esirable objects such as emissions or waste, thatDyckhoff describes as bbadsQ and that Koopmans (1951, P. 38f.) already mentions asb<strong>und</strong>esired commoditiesQ. Transformations can be production processes, but the converseis also true <strong>in</strong> operations <strong>in</strong> which the purpose is not the output of goods, but <strong>in</strong>steadelim<strong>in</strong>ation of bads – namely waste disposal or recycl<strong>in</strong>g processes. Production theory <strong>in</strong>the tradition of Gutenberg (1951) is therefore particularly suitable for analys<strong>in</strong>g systems <strong>in</strong>which evaluation of materials and transformation processes depends on their economicand ecological context. It thus differs from purely scientific approaches to mapp<strong>in</strong>gmaterial flow systems, as for <strong>in</strong>stance <strong>in</strong> Bader and Bacc<strong>in</strong>i (1996), which rema<strong>in</strong> bondedto the real flow system – without an economic analysis. In recent years environmentalprotection also represented the most important sector for further methodologicaldevelopment of the production theory (D<strong>in</strong>kelbach and Rosenberg, 2003, Steven, 1998).2.1. Good and badIf production theory is to be applied to a closed-loop material flow management system,it cannot solely address the actual process of produc<strong>in</strong>g goods. In order to close the loop,waste and production residues must also be taken <strong>in</strong>to account and recycl<strong>in</strong>g or wasteelim<strong>in</strong>ation processes must be <strong>in</strong>cluded <strong>in</strong> the analysis. Production, consumption andreduction form a cycle, as it were, <strong>in</strong> closed-loop material flow management (see Fig. 1).‘Reduction’ is <strong>und</strong>erstood to mean the conversion of old products and wastes to secondaryraw materials. Production, consumption and reduction are the transformations: rawmaterials become products, products become wastes, wastes become raw materials aga<strong>in</strong>.The technology used <strong>in</strong> the transformation processes not only determ<strong>in</strong>es whether theseare possible at all (e.g. the recycl<strong>in</strong>g of certa<strong>in</strong> materials). It also decides what
(POR)ARTICLE IN PRESS4M. Schmidt / Environmental Impact Assessment Review xx (2005) xxx–xxxNaturalenvironmentPrimary materialsWastes for disposalInduction(POE)ProductionTransactionTransactionDistribution(POS)Closed-loopeconomyTransformationTransformationTransactionTransformationConsumptionReductionCollectionFig. 1. A simple model for closed-loop material flow management (after Dyckhoff et al., 2004, p. 4).environmental impacts occur as a result and how expensive an <strong>in</strong>dividual process andhence the entire closed-loop management becomes.However, the transformation processes are only one important po<strong>in</strong>t of approach. Forthem to function <strong>in</strong> a real economic system the transactions are equally significant. Dyckhoff(2000) therefore placed the transactions of distribution (po<strong>in</strong>t of sale), collection (po<strong>in</strong>t ofreturn) and <strong>in</strong>duction (po<strong>in</strong>t of entry) between the processes of production, consumption andreduction (see Fig. 1), but these will not be discussed further <strong>in</strong> this paper.If we wish to evaluate the systems not only economically but also ecologically, thosematerials that have not yet played any role <strong>in</strong> the economic operation of a companybecause they did not cost anyth<strong>in</strong>g and were ma<strong>in</strong>ly available without restriction must betaken <strong>in</strong>to account. Look<strong>in</strong>g at a transformation process <strong>in</strong> quite general terms, materialsenter the process as an <strong>in</strong>put, while other materials leave it as an output. Under economicaspects only the most important materials were taken <strong>in</strong>to account <strong>in</strong> the past, <strong>in</strong> otherwords those that caused costs or earned revenues, i.e. had a market price.On the <strong>in</strong>put side we traditionally consider factors that are connected with costs andreduce the profit, and reducts (wastes) when revenues are connected with them and they<strong>in</strong>crease the profits. Reducts on the <strong>in</strong>put side may for <strong>in</strong>stance be wastes <strong>in</strong> the case of awaste <strong>in</strong>c<strong>in</strong>eration plant. The waste <strong>in</strong>c<strong>in</strong>eration plant earns its money by accept<strong>in</strong>g (andconvert<strong>in</strong>g) these wastes. On the output side, on the other hand, we consider the products –they <strong>in</strong>crease the profit. Wastes, however, reduce the profit if elim<strong>in</strong>at<strong>in</strong>g them costsmoney. Ecologically relevant flows are only taken <strong>in</strong>to account if they are connected withcosts, e.g. scarce environmental factors, or wastes that have to be elim<strong>in</strong>ated actively.Houtman (1998) extends this view. He also considers material flows on the <strong>in</strong>put andoutput sides that do not cause any costs, but might harm the environment (Fig. 2). Firstlythere are success-neutral <strong>in</strong>puts and outputs that are subject to volume restrictions.Admittedly they do not cost anyth<strong>in</strong>g, but due to restrictions imposed by authorities for
ARTICLE IN PRESSM. Schmidt / Environmental Impact Assessment Review xx (2005) xxx–xxx 5InputThroughputOutputFactorsReductsEnvironmental factorsSuccess-neutral <strong>in</strong>putsFree environmental goodsProductionprocessproductsWastes for recycl<strong>in</strong>gWastes for elim<strong>in</strong>ationSuccess-neutral outputsFree wasteFig. 2. Inputs and outputs of a generalised production process.<strong>in</strong>stance perhaps only certa<strong>in</strong> volumes may be withdrawn or emitted. Withdraw<strong>in</strong>g waterfrom a river is an example here. This <strong>in</strong>directly restricts production. Secondly there aresuccess-neutral materials without any volume restrictions (free environmental goods or freewastes). These can be withdrawn from the environment or emitted to it directly and withoutrestriction.This extended consideration of a transformation process helps to capture the <strong>in</strong>fluenceon the environment. In particular those materials without a market price play a major role<strong>in</strong> direct environmental impacts, e.g. emissions <strong>in</strong>to the atmosphere, waste water, or wastesto be deposited <strong>in</strong> landfills. In most cases the crucial environmental <strong>in</strong>fluences of a processoccur <strong>in</strong>directly: through the use of special raw materials, energy, or the occurrence ofwastes that have to be treated specially (Table 1). Often it is even the products that lead toenvironmental impacts. Dist<strong>in</strong>guish<strong>in</strong>g between <strong>in</strong>puts and outputs alone does not help usfurther here. It is the <strong>in</strong>directly act<strong>in</strong>g objects especially that have to be analysed with<strong>in</strong> thecontext of the further supply cha<strong>in</strong> or closed-loop material flow management system andtraced back to direct environmental <strong>in</strong>fluences.At this po<strong>in</strong>t the analysis must move away from the <strong>in</strong>dividual process and considercha<strong>in</strong>s, or more precisely networks of transformation processes. It is no longer relevant toTable 1Classification of the <strong>in</strong>puts and outputs on the basis of their economic and ecological <strong>in</strong>fluence (after Houtman,1998, 76)Materials <strong>in</strong> the production process Influence on profit Influence on environmentDirect IndirectInput Factors Lower<strong>in</strong>g XReducts Increas<strong>in</strong>g XEnvironmental factors Lower<strong>in</strong>g XSuccess-neutral <strong>in</strong>puts Limit<strong>in</strong>g XFree environmental goods Neutral XOutput Products Increas<strong>in</strong>g XWastes for recycl<strong>in</strong>g Lower<strong>in</strong>g XWastes for elim<strong>in</strong>ation Lower<strong>in</strong>g XSuccess-neutral outputs Limit<strong>in</strong>g XFree wastes Neutral X
ARTICLE IN PRESS6M. Schmidt / Environmental Impact Assessment Review xx (2005) xxx–xxxfocus on the product or the environmental impact of a s<strong>in</strong>gle process, but to quantify thoseof the entire system. Two questions arise here:- How can transformation processes be l<strong>in</strong>ked consistently with each other so that itbecomes apparent, for <strong>in</strong>stance, what the product of the system is?- How can the environmental impacts of a system be related to a product?Simple systematisation of the objects, as <strong>in</strong>troduced by Dyckhoff (1994), contributessubstantially to answer<strong>in</strong>g these questions. Economically the objects – <strong>in</strong> other words thematerials on the <strong>in</strong>put and the output side of a transformation process – only differ <strong>in</strong>whether they have a positive, a negative, or no market price at all. If they have a positivemarket price then they are desired objects: one pays to possess them. Such an object iscalled a bgoodQ. If an object has a negative market price, one pays to get rid of it. This is abbadQ. For example waste is a bad. If it has no market price, it is neutral – it does not playany role <strong>in</strong> the economic analysis.How is this classification of objects connected with direct environmental impacts?Someth<strong>in</strong>g that is a bad may not only be expensive (elim<strong>in</strong>ation of waste), it can also harmthe environment directly. In addition there are ecologically bad objects that do not costanyth<strong>in</strong>g, but endanger the environment despite this. Consequently bad objects are<strong>und</strong>esirable from both economic and/or ecological po<strong>in</strong>ts of view (see Table 2).The question as to whether goods can harm the environment directly is more difficult toanswer. Naturally there are many goods that admittedly have a market price, but areevidently bad for the environment. For <strong>in</strong>stance, a PC costs a few h<strong>und</strong>red dollars or euros(and so is a good), yet it causes emissions through its electricity consumption. Furthermoreit subsequently becomes electronic waste. At this po<strong>in</strong>t, however, the somewhat sophistdef<strong>in</strong>ition is often advanced that economically desired objects are always basically bgoodQand do not represent any directly <strong>und</strong>esirable environmental impacts. However, naturallythe production, consumption or reduction of these goods can be connected with directlyenvironmental impacts, namely e.g. by releas<strong>in</strong>g what is bad (emissions, waste water ...).Possession of a PC is desirable, even if it causes emissions dur<strong>in</strong>g the phase of use. Theseemissions (as bad) are <strong>und</strong>esirable, but necessary concomitant phenomena of PC use – <strong>in</strong>other words an <strong>in</strong>direct environmental impact. It will therefore be a major task to trackthese <strong>in</strong>direct environmental impacts along a supply cha<strong>in</strong> or <strong>in</strong> a closed-loop materialflow management system and to allocate them correctly.F<strong>in</strong>ally, when the PC becomes broken the aim is to get rid of it and one may well even bewill<strong>in</strong>g to pay money for this. Now the good becomes bad, <strong>in</strong> other words waste. However,Table 2Systematis<strong>in</strong>g objects <strong>in</strong> transformation processesMarket priceDirect environmental impactNoPositive Good Not def<strong>in</strong>ed0 Neutral BadNegative Bad BadYes
ARTICLE IN PRESSM. Schmidt / Environmental Impact Assessment Review xx (2005) xxx–xxx 7the PC rema<strong>in</strong>s good, if someone buys it to scavenge parts and recycle the <strong>in</strong>dividualcomponents. Dyckhoff (1994, 70) already po<strong>in</strong>ted out this ambivalence <strong>in</strong> assess<strong>in</strong>g objects.It is essential for modell<strong>in</strong>g recycl<strong>in</strong>g management systems <strong>in</strong> which objects – depend<strong>in</strong>g onthe economic <strong>in</strong>terest situation – can assume the role of good or bad.2.2. Expenditure and revenueThis division of objects <strong>in</strong>to goods and bads forms the framework with which closedloopmaterial flow management systems can be analysed. In systems consist<strong>in</strong>g of manyprocesses it is important to <strong>in</strong>troduce the terms expenditure and revenue due to theambivalence of the pair of concepts good/bad. Tak<strong>in</strong>g an <strong>in</strong>dividual transformation processas an example makes this clear. For a production process <strong>in</strong> which a product results, therevenue is the generation of a good on the output side (see Table 3). On the other hand theexpenditure is everyth<strong>in</strong>g that is <strong>und</strong>esirable, costs money, or harms the environment:factor consumption, emissions, waste etc. An ecological dimension is added to theeconomic expenditure concept here. An expenditure is then formed by goods on the <strong>in</strong>putside (factor consumption) or bads on the output side (emissions, wastes ...). Thisexpenditure – considered economically as well as ecologically – is necessary to generatethe benefit that can always only be substantiated economically <strong>in</strong> this system. In the caseof an <strong>in</strong>dividual production process this allocation of revenue and expenditure is simple. Inclassic cost account<strong>in</strong>g it is the basis for cost<strong>in</strong>g products. One can even <strong>in</strong>terpret the LifeCycle Assessment as a k<strong>in</strong>d of ecological cost<strong>in</strong>g <strong>in</strong> which the ecological expenditure isadded to the (economic) revenue, namely the functional unit.However, there are also converse cases <strong>in</strong> which money is earned by elim<strong>in</strong>at<strong>in</strong>g bads,for <strong>in</strong>stance <strong>in</strong> a waste <strong>in</strong>c<strong>in</strong>eration or recycl<strong>in</strong>g plant. Then the revenue is the <strong>in</strong>put ofbads. The expenditure is still everyth<strong>in</strong>g connected with costs or environmental pollution:factor consumption, emissions, waste etc.An important case arises when a multiple revenue appears <strong>in</strong> a process. This is then a jo<strong>in</strong>tproduction process, which by no means necessarily has only two coupled bproductsQ. Todaya modern waste <strong>in</strong>c<strong>in</strong>eration plant earns its money by accept<strong>in</strong>g waste (bad on the <strong>in</strong>put side)and sell<strong>in</strong>g heat or electricity (good on the output side). The revenue concept helps toidentify coupl<strong>in</strong>g processes clearly. The difficulty rema<strong>in</strong>s <strong>in</strong> allocat<strong>in</strong>g the expenditure tothe multiple benefit – the classic problem of jo<strong>in</strong>t production (Schmidt, 1998).Revenue and expenditure can be considered not solely for <strong>in</strong>dividual processes,however, but also for entire systems, e.g. l<strong>in</strong>ear supply cha<strong>in</strong>s or recycl<strong>in</strong>g systems. TheTable 3Economic and ecological importance of object categories for a transformation process dependent on theiroccurrence on <strong>in</strong>put or output sideMarket price Input OutputGood N0 Economic expenditure;Economic revenueany ecological expenditureBad b0 Economic revenue;any ecological revenueEconomic expenditure;any ecological expenditure=0 Ecological revenue Ecological expenditure
ARTICLE IN PRESS8M. Schmidt / Environmental Impact Assessment Review xx (2005) xxx–xxxrevenue is obviously the sum of the bad enter<strong>in</strong>g and the good leav<strong>in</strong>g the system, and theexpenditure is the sum of the good enter<strong>in</strong>g and the bad leav<strong>in</strong>g the system. Rememberthat the dist<strong>in</strong>ction between good and bad is made by the market at any time.However, the purpose of a system is very often to create one specific revenue, e.g. toproduce one good (the system is then called a production system) or to reduce one bad (thesystem is then called a recycl<strong>in</strong>g or disposal system). Given this <strong>in</strong>tended revenue, theoverall expenditure will be allocated to it. We call this purpose-based focus on a specific<strong>in</strong>put or output of the system a perspective. Perspectives are useful for the analysis andcommunication of system properties, as will be shown <strong>in</strong> Section 4. Given a perspective,the <strong>in</strong>direct environmental impacts already mentioned simply represent a question ofsystem bo<strong>und</strong>aries. If the system has been selected suitably, the <strong>in</strong>direct environmentalimpacts of <strong>in</strong>dividual processes will be captured elsewhere <strong>in</strong> the system as directenvironmental impacts.3. System modell<strong>in</strong>g with the aid of netsOne way of describ<strong>in</strong>g closed-loop systems as a model is to display them as nets orgraphs. Möller (1994) <strong>in</strong>troduced the bmaterial flow netsQ <strong>in</strong> which the nodes are<strong>in</strong>terpreted as transformation processes and the arrows as material flows. By <strong>in</strong>troduc<strong>in</strong>g asecond type of node – by analogy with the Petri net from theoretical <strong>in</strong>formatics – it is alsopossible to map storage processes. This allows a dist<strong>in</strong>ction to be made between activitiesand states, thus also permitt<strong>in</strong>g time-based analysis for <strong>in</strong>stance.Fig. 3a) shows a simple net as an <strong>in</strong>put/output graph. Each process is described throughits <strong>in</strong>put flows and its output flows that can stand <strong>in</strong> a functional connection with eachother (Schmidt and Keil, 2002). By l<strong>in</strong>k<strong>in</strong>g the processes it is possible to build up systemsa)G1G2G6systembo<strong>und</strong>aryG7P1 G3 P2 G4 P3G5B1 B2 B3R G5b)ExpendituresRevenuese 1_G1e 2_G3e 3_G4e 1_G2r 1_G3 e 2_G6r 2_G4 e 3_G7e 2_G3e 3_G4e 1_B1e 2_B2e 3_B3r 3_G5Fig. 3. a) An I/O graph of a cha<strong>in</strong> of three processes; b) the correspond<strong>in</strong>g expenditure–revenue graph.
ARTICLE IN PRESSM. Schmidt / Environmental Impact Assessment Review xx (2005) xxx–xxx 9of optional complexity. In this case a l<strong>in</strong>ear cha<strong>in</strong> of three processes is shown that areconnected to each other by the flow of goods (G3–G4). Thus for example process P1requires goods G1 and G2 as raw materials bfrom the exteriorQ and produces product G3with these. In addition a bad B1 results. It soon becomes clear that the system revenue isthe production of G5. The system expenditure for this is made up of the goods G1, G2, G6and G7 on the <strong>in</strong>put side, and the bads B1, B2 and B3 on the output side.This <strong>in</strong>put–output graph can be converted <strong>in</strong>to an expenditure and revenue graph <strong>in</strong>accordance with Fig. 3b) with the aid of good/bad classification (Möller, 2000). Eachprocess is now broken down by the expenditures and the revenues. The quantities e and rstand for the associated coefficients of production of expenditures and revenues, wherebya l<strong>in</strong>ear functional connection is assumed and the data are stated <strong>in</strong> physical quantity units(e.g. kg). The expenditure connected with the system revenue R G5 throughout the entiresystem can thus be calculated easily by determ<strong>in</strong><strong>in</strong>g the production level x i of processes 1to 3 and the expenditures of the <strong>in</strong>dividual processes derived from these.This approach makes it possible to map material cycles such as occur <strong>in</strong> recycl<strong>in</strong>g processeswithout any problem too. Fig. 4 shows such a case. The good 4 that is produced <strong>in</strong> process 2 isused as a raw material <strong>in</strong> process 1. To calculate the system expenditure for the system revenueR G5 , the production levels x i of processes 1–3 are solved with a l<strong>in</strong>ear equation system:x 3 ¼ R G5e 1 G4 =r 1 G3 d x 1 þ x 2 e 3 G4 =r 3 G5 d x 3 ¼ 0x 1 e 2 G3 =r 2 G4 d x 2 ¼ 0This results <strong>in</strong> the system expenditure E B1 =e _ 1 B1/r _ 1 B1d x 1 etc., for example. It shouldbe noted that this expenditure is determ<strong>in</strong>ed on the physical quantity level. The advantagea)G1G2G6systembo<strong>und</strong>aryG7P1 G3 P2 G4 P3G5B1 G4B2 B3R G5b)e 1_G1e 1_G2e 1_G4 e 2_B2 e 3_B3e 1_B1r 1_G3 e 2_G6r 2_G4 e 3_G7e 2_G3e 3_G4r 3_G5Fig. 4. a) An I/O graph of a cha<strong>in</strong> of 3 processes with recycl<strong>in</strong>g of good 4; b) the correspond<strong>in</strong>g expenditure–revenue graph.
ARTICLE IN PRESS10M. Schmidt / Environmental Impact Assessment Review xx (2005) xxx–xxxof this is that it can be used for both economic and ecological analyses. In the economicanalysis the quantities of the expenditures (e.g. raw materials) simply have to be multipliedby the market prices. This results <strong>in</strong> the costs <strong>in</strong>curred by the material <strong>in</strong>put for produc<strong>in</strong>ggood 5. The concept can be extended easily by the costs of further process-related factors(labour, capital...), so that complete cost and result account<strong>in</strong>g can be drawn up on thisquantity structure of costs (cf. Möller, 2000).The quantity relation of the material flows can, however, also be used to conduct anecological analysis. For <strong>in</strong>stance all greenhouse-relevant emissions of the system can becondensed to the global warm<strong>in</strong>g potential (GWP). The emissions then relate to the systemrevenue considered <strong>in</strong> the specific case, for <strong>in</strong>stance <strong>in</strong> this example the production ofgood 5.The attractiveness of this method lies <strong>in</strong> the fact that a real material flow system <strong>in</strong>which many different system revenues occur can be analysed very flexibly. Theexpenditure associated with each system revenue can be determ<strong>in</strong>ed. For theenvironmental sector this means that the <strong>in</strong>direct environmental impacts of a product or,more precisely, of a revenue can be determ<strong>in</strong>ed too.An <strong>in</strong>terest<strong>in</strong>g special case occurs when a cycle is operated with a material as bad(Fig. 5a). B2 occurs <strong>in</strong> process 2 and is needed <strong>in</strong> process 1. For process 1 this now meansan additional revenue, <strong>in</strong> other words the elim<strong>in</strong>ation of the bad B2. As a result theexpenditure/revenue graph looks different (Fig. 5b): The expenditures <strong>in</strong> process 1 are setaga<strong>in</strong>st two revenues. This is a typical case of jo<strong>in</strong>t production. It has to be solved at the<strong>in</strong>dividual process level by allocat<strong>in</strong>g the expenditures to the two revenues. Process 1 issubdivided <strong>in</strong>to two new processes with only one revenue each, as it were. At this po<strong>in</strong>t,however, it also becomes <strong>und</strong>erstandable that allocation <strong>in</strong> the case of a jo<strong>in</strong>t process cana)G6systembo<strong>und</strong>aryG7G1G2P1 G3P2 P3B1 B2B2 B3G5b)e 1_G1e 1_G2e 1_B1r 1_G3r 1_B2e 2_G3e 2_G6r 2_G4 e 3_G7e 3_G4e 3_B3r 3_G5Fig. 5. a) An I/O graph of a cha<strong>in</strong> of three processes with recycl<strong>in</strong>g of bad 2;. b) the correspond<strong>in</strong>g expenditure–revenue graph.
ARTICLE IN PRESSM. Schmidt / Environmental Impact Assessment Review xx (2005) xxx–xxx 11a)G2systembo<strong>und</strong>aryG3B1G1P1 P2 P3B2 B3 B4B5 B6 B7b)e 3_B4Expenditures Revenuese 3_G3 r 3_B3 e 2_G2 r 2_B2 e 1_G1e 2_B3e 1_B2e 1_B5r 1_B1Fig. 6. a) An I/O graph for a waste disposal cha<strong>in</strong> to elim<strong>in</strong>ate B1 (black arrow); b) the corresp. expenditurerevenuegraph.only be oriented to the revenues of a process. A purely physical allocation such as isproposed e.g. by ISO 14.041 is problematic. After all, the question as to what is revenueand what is expenditure is decided by the economic analysis.While so far goods have been passed on through the process cha<strong>in</strong> – <strong>in</strong> accordance witha supply cha<strong>in</strong> – a waste disposal cha<strong>in</strong> is considered <strong>in</strong> the follow<strong>in</strong>g example (Fig. 6).The bad B1 is elim<strong>in</strong>ated by this system, and this is also the system revenue. This revenueis connected with a certa<strong>in</strong> expenditure, <strong>in</strong>clud<strong>in</strong>g the development of new bads as systemoutput (B4–B7).To summarise it can be ascerta<strong>in</strong>ed that the graph display together with the classificationof the materials based on production theory provides an approach for calculat<strong>in</strong>g the systemrevenue <strong>in</strong> complex systems and determ<strong>in</strong><strong>in</strong>g the system expenditure. The expenditure canbe allocated to one or more different revenues <strong>in</strong> the style of cost and result account<strong>in</strong>g –however on a physical quantity–related level. This procedure serves both to calculate costsand to determ<strong>in</strong>e the <strong>in</strong>direct environmental impacts.4. Change of perspective <strong>in</strong> analysisThe methodology described above is ideally suited for analys<strong>in</strong>g production and wastedisposal structures. To this end <strong>in</strong>put/output process nets are formed <strong>in</strong> which theeconomically and ecologically relevant materials, energies, services etc. appear as flows.These flows are ascerta<strong>in</strong>ed. This can be done empirically by measur<strong>in</strong>g, but calculationsbased on mathematical process models are also possible.
ARTICLE IN PRESS12M. Schmidt / Environmental Impact Assessment Review xx (2005) xxx–xxxThe flow objects, usually the materials, simply have to be classified ord<strong>in</strong>ally as good,neutral or bad <strong>in</strong> order to specify their quality. Thus it is set out for each process what isexpenditure and what is revenue. From this it is possible to develop an expenditure andrevenue graph from which it can be derived what is system expenditure and what is systemrevenue at a quantity level. The necessary system expenditure for each system revenue canbe determ<strong>in</strong>ed – <strong>und</strong>er both ecological and economic perspectives.The follow<strong>in</strong>g example shows an important analysis potential of this approach (Fig. 7).Electronic waste is collected <strong>in</strong> various fractions <strong>in</strong> a number of different collection areas(left). The waste fractions are then conveyed to sort<strong>in</strong>g plants. F<strong>in</strong>ally the waste isprocessed to a secondary raw material <strong>in</strong> two recycl<strong>in</strong>g plants (right). The transport,sort<strong>in</strong>g and recycl<strong>in</strong>g require energy and cause emissions. They also <strong>in</strong>volve costs.In Fig. 7 the electronic waste <strong>in</strong> the system is <strong>in</strong>terpreted as a bad. The only revenue ofthe system lies on the <strong>in</strong>put side, namely the various fractions of electronic waste from thevarious collection areas. The expenditure <strong>in</strong> the system can be tracked easily for such arevenue. It is set out <strong>in</strong> Fig. 8, where the selected system revenue is marked with an arrow.The flows (<strong>in</strong>clud<strong>in</strong>g the pro-rated energy and emissions) occurr<strong>in</strong>g <strong>in</strong> the system toprovide a system revenue can be seen here.In this way it is possible to answer the question of where the waste goes, what materialflows it causes, and what consequential costs it has. These questions can <strong>in</strong> pr<strong>in</strong>ciple beanswered for each process and/or system revenue, <strong>in</strong> other words for the other wastefractions too.Whereas Fig. 8 answers the question regard<strong>in</strong>g the system expenditure at a physicalquantity level, Fig. 9 shows the volumes analysed <strong>in</strong> monetary terms. The costs of theprocesses are quasi pro-rated to the relevant system revenue, as can be seen from the CostSankey Diagram. This results <strong>in</strong> a clear presentation <strong>in</strong>dicat<strong>in</strong>g which waste fractioncauses what costs.A substantial change is made for Fig. 10. The electronic waste fractions are nolonger <strong>in</strong>terpreted as bad, but <strong>in</strong>stead as good, because of ris<strong>in</strong>g market prices forsecondary materials. Otherwise noth<strong>in</strong>g is changed <strong>in</strong> the system by comparison withFig. 7. Accord<strong>in</strong>g to this new perspective, the system revenue now lies on the outputside, namely with the secondary raw materials produced (black arrow). The electronicwaste fractions on the <strong>in</strong>put side of the system are now considered as goods, becausethe market reacts to the new perspective <strong>in</strong> creat<strong>in</strong>g a positive price for them too.Accord<strong>in</strong>gly Fig. 10 answers the question: where does the secondary raw materialcome from? What material flows are connected with this system revenue (<strong>in</strong>clud<strong>in</strong>genergy and emissions)? The pro-rated costs <strong>in</strong> the system are now credited aga<strong>in</strong>st thesecondary raw material. A Cost Sankey Diagram for a production cha<strong>in</strong> would showthe <strong>in</strong>creas<strong>in</strong>g added value.This makes it clear that the ambivalence <strong>in</strong> classify<strong>in</strong>g materials <strong>in</strong>to good or badmentioned <strong>in</strong> Section 2 opens up an <strong>in</strong>terest<strong>in</strong>g analysis option. If the waste is consideredto be bad, its whereabouts <strong>in</strong> the system is exam<strong>in</strong>ed. Result<strong>in</strong>g costs or environmentalpollution will be debited to it. However, if the waste is considered to be good, it is treatedas a factor <strong>in</strong>put that contributes to the production of a new secondary raw material. In thiscase the costs and environmental pollution will be credited to the secondary raw material.F<strong>in</strong>ally, the market decides which perspective is adequate.
energy6000.0 kg9000.0 kg11000.0 kg3000.0 kg6450.0 kg2000.0 kg3450.0 kg1350.0 kg2000.0 kg8000.0 kg22150.0 kg3000.0 kg7000.0 kg9000.0 kg9000.0 kg7000.0 kg2000.0 kg5150.0 kg5500.0 kg3500.0 kg8600.0 kgMögliche Auswertungen:Wo verbleibt der Abfall der Quellen:Alle Abfälle im System als Übel def<strong>in</strong>iert.5100.0 kgAbfälle auf Inputseite = ReferenzflüsseProzentuale Zusammensetzung <strong>und</strong> Trennung <strong>in</strong> T3/4Misch1 Misch2 Misch3 Misch45100.0 kgauftreten?sort1 50 20 30 0Collection Areas Alle Abfälle im System als Gut def<strong>in</strong>ieren.sort2 50 80 40 40Reststoffe auf Transport Outputseite = Referenzflüssesort3 Sort<strong>in</strong>g 0 0 30 60Recycl<strong>in</strong>gemissionsFig. 7. Input/Output net of the reverse logistics of various electronic waste fractions along the waste disposal path.6450.0 kg22150.0 kgEnergy (Good)Emissions (Bad)WEEE mixed fraction1(Bad)WEEE mixed fraction2(Bad)WEEE mixed fraction3(Bad)WEEE mixed fraction4(Bad)Waste sorted #1 (Bad)Waste sorted #2 (Bad)Waste sorted #3 (Bad)Recoverable Material 1(Bad)Recoverable Material 2(Bad)M. Schmidt / Environmental Impact Assessment Review xx (2005) xxx–xxx 13ARTICLE IN PRESS
14energy900.0 kg900.0 kg2100.0 kg2100.0 kg3000.0 kgMögliche Auswertungen:Wo verbleibt der Abfall der Quellen:Alle Abfälle im System als Übel def<strong>in</strong>iert.3000.0 kgAbfälle auf Inputseite = ReferenzflüsseProzentuale Zusammensetzung <strong>und</strong> Trennung <strong>in</strong> T3/4Misch1 Misch2 Misch3 Misch43000.0 kgauftreten?sort1 50 20 30 0sort2 50 80 40 40Collection Areas Alle Abfälle Transport im System als Gut def<strong>in</strong>ieren.sort3 Sort<strong>in</strong>g0 0 30 60 R Recycl<strong>in</strong>gReststoffe auf Outputseite = Referenzflüsseemissions900.0 kg2100.0 kgEnergy (Good)Emissions (Bad)WEEE mixed fraction1(Bad)WEEE mixed fraction2(Bad)WEEE mixed fraction3(Bad)WEEE mixed fraction4(Bad)Waste sorted #1 (Bad)Waste sorted #2 (Bad)Waste sorted #3 (Bad)Recoverable Material 1(Bad)Recoverable Material 2(Bad)M. Schmidt / Environmental Impact Assessment Review xx (2005) xxx–xxxARTICLE IN PRESSFig. 8. Electronic waste as bads: track<strong>in</strong>g the material expenditure of a special system revenue (black arrow).
energy603.9603.90.0 EUR1249.53638.4Mögliche Auswertungen:Wo verbleibt der Abfall der Quellen:Alle Abfälle im System als Übel def<strong>in</strong>iert.Abfälle auf Inputseite = ReferenzflüsseProzentuale Zusammensetzung <strong>und</strong> Trennung <strong>in</strong> T3/4Misch1 Misch2 Misch3 Misch45423.4auftreten?sort1 50 20 30 0sort2 50 80 40 40Collection Areas Alle Abfälle Transport im System als Gut def<strong>in</strong>ieren.sort3 Sort<strong>in</strong>g 0 0 30 60R Recycl<strong>in</strong>gReststoffe auf Outputseite = ReferenzflüsseemissionsFig. 9. Pro-rated costs of recycl<strong>in</strong>g the relevant waste (left), shown <strong>in</strong> the form of a Cost Sankey Diagram.Energy (Good)Emissions (Bad)WEEE mixed fraction1(Bad)WEEE mixed fraction2(Bad)WEEE mixed fraction3(Bad)WEEE mixed fraction4(Bad)Waste sorted #1 (Bad)Waste sorted #2 (Bad)Waste sorted #3 (Bad)Recoverable Material 1(Bad)Recoverable Material 2(Bad)M. Schmidt / Environmental Impact Assessment Review xx (2005) xxx–xxx 15ARTICLE IN PRESS
16energy2400.0 kg2400.0 kg3000.0 kg3000.0 kg6450.0 kg600.0 kg3450.0 kg360.0 kg600.0 kg1350.0 kg1350.0 kg 3450.0 kgMögliche Auswertungen:Wo verbleibt der Abfall der Quellen:Alle Abfälle im System als Übel def<strong>in</strong>iert.2100.0 kgAbfälle auf Inputseite = ReferenzflüsseProzentuale Zusammensetzung <strong>und</strong> Trennung <strong>in</strong> T3/4Misch1 Misch2 Misch3 Misch42100.0 kgauftreten?sort1 50 20 30 0Collection Areas Alle Abfälle sort2 50 80 40 40Transport im System als Gut def<strong>in</strong>ieren.sort3 Sort<strong>in</strong>gReststoffe auf Outputseite = Referenzflüsse0 0 30 60 R Recycl<strong>in</strong>gemissions6450.0 kgEnergy (Good)Emissions (Bad)WEEE mixed fraction1(Good)WEEE mixed fraction2(Good)WEEE mixed fraction3(Good)WEEE mixed fraction4(Good)Waste sorted #1 (Good)Waste sorted #2 (Good)Waste sorted #3 (Good)Recoverable Material 1(Good)Recoverable Material 2(Good)M. Schmidt / Environmental Impact Assessment Review xx (2005) xxx–xxxARTICLE IN PRESSFig. 10. Electronic waste as goods: track<strong>in</strong>g the material expenditure of a special system revenue (black arrow).
3 IT HP PCs (eee)NET PARAMETERS:3 IT HP Pr<strong>in</strong>ters etc. (eee)2 Small household appliances (eee)4 kg EEE waste per capita72 % white ware <strong>in</strong> eee waste3 IT and telecommunications equipment (eee)4 Consumer equipment (eee)9 % monitors <strong>in</strong> eee waste6 Electrical and electronic tools (eee)waste rest (w)waste monitors (w)350 /t waste (monitor)P5: 0-250 Pers/km2T4: Districtswaste tools (w)300 /t waste (rest)21518.7 k12943.4 kP1: HP 5005.1 k49872 k49872 kP6:250 - 1000 Pers/km2T6: DistrictsT1: MarketT2: Consumer5408.5 k44866.8 kP7:1000 - 2000 Pers/km2T8: Districts10001.4 kP2: otherProducersP8:> 2000 Pers/km2T10: DistrictsEEE MarketEEE ReturnDistrictfrom marketdispatcherPopulation <strong>in</strong>each categoryP9: Trader7538.3 kT5: Transport Monitors < 250T12:Transport Rest < 25013066.4 k4624 kT7:Transport Monitors 250-1000T13:Transport Rest 250 - 10008014.9 k1941.8 kT9: Transport Monitors 1000-2000T11:Transport Rest 1000-20003365.8 k3811.4 kT14: Transport Monitors >2000T15:Transport Rest > 20005994.7 kPercentage of white wareNet-Tonnage percosts per tondirectly to traderConta<strong>in</strong>ereee wasteScenario-SwitchCosts per Conta<strong>in</strong>erFig. 11. Scenario for recycl<strong>in</strong>g several e-waste components show<strong>in</strong>g the costs <strong>in</strong>curred along the cha<strong>in</strong> (figures are fictitious).M. Schmidt / Environmental Impact Assessment Review xx (2005) xxx–xxx 17ARTICLE IN PRESS
ARTICLE IN PRESS18M. Schmidt / Environmental Impact Assessment Review xx (2005) xxx–xxxOther, mixed forms between these two pure perspectives are also conceivable, for<strong>in</strong>stance when the electronic waste is <strong>in</strong>terpreted as bad and the secondary raw material asgood. This is then a coupled system <strong>in</strong> which the expenditures have to be allocated to thetwo revenues.The display form selected us<strong>in</strong>g the Sankey diagrams <strong>in</strong> Figs. 7–10 allows a clearrepresentation even for complex systems. These Sankey diagrams can be used not only fordisplay<strong>in</strong>g quantities (<strong>in</strong> kg), but also for track<strong>in</strong>g costs clearly, as illustrated <strong>in</strong> theexample <strong>in</strong> Fig. 10.5. Reverse logistic scenarios as a model caseWith the implementation of the WEEE Directive, it is <strong>in</strong>terest<strong>in</strong>g for firms such as e.g.Hewlett-Packard to know what quantity flows of electronic waste will be generated peryear <strong>in</strong> a national market, how they are made up, what possibilities exist for collect<strong>in</strong>g,grad<strong>in</strong>g and recycl<strong>in</strong>g, what costs are connected with each of these operations, and howthese costs are distributed between the <strong>in</strong>dividual manufacturers.S<strong>in</strong>ce these questions are connected strongly with the physical quantity flows andthe various transformation processes of collection/transport/grad<strong>in</strong>g/recycl<strong>in</strong>g, and asboth economic and ecological analyses are necessary after this, the approach presentedappears expedient. Such analyses have been developed together with Hewlett-Packardfor Germany, France, Spa<strong>in</strong>, the United K<strong>in</strong>gdom and Italy. Uncerta<strong>in</strong>ties, for <strong>in</strong>stancebecause <strong>in</strong>put data (quantity flows, prices, quotas etc.) are as yet unknown, wereparameterised <strong>in</strong> the model and mapped as scenarios. The parameters that can beadjusted <strong>in</strong> the model are shown at the relevant po<strong>in</strong>ts <strong>in</strong> the system with grey arrows<strong>in</strong> Fig. 11.Fig. 11 shows as a result not the quantity flows, but the quantities valued with prices, <strong>in</strong>other words the costs. That is why the Sankey arrows are provided with data <strong>in</strong> o. S<strong>in</strong>ceaccord<strong>in</strong>g to the WEEE Directive the manufacturers are responsible for the costs ofrecycl<strong>in</strong>g the historical electronic waste, the waste is set as bad here. With such scenariosthe manufacturers can determ<strong>in</strong>e their cost share and identify any possible parameters foroptimis<strong>in</strong>g the system.The ideal picture is naturally that one day the technical prerequisites will be created forproduc<strong>in</strong>g high-grade and marketable secondary raw materials from the electronic waste.The electronic waste will then have to be considered as a good and the questions willrevolve aro<strong>und</strong> those already posed <strong>in</strong> Section 4.6. ConclusionsIt was shown that modern production theory conta<strong>in</strong>s efficient approaches for analys<strong>in</strong>grecycl<strong>in</strong>g systems and closed-loop systems more adequately. While the categoris<strong>in</strong>g ofobjects as good or bad may appear a little unusual to start with, it soon proves to be a veryexpedient concept, s<strong>in</strong>ce it allows dist<strong>in</strong>ctions to be made between expenditure andrevenue at the process level, as well as at the system level. In addition the l<strong>in</strong>k<strong>in</strong>g of
ARTICLE IN PRESSM. Schmidt / Environmental Impact Assessment Review xx (2005) xxx–xxx 19processes <strong>in</strong> the form of graphs, such as e.g. the Petri net approach, is also helpful foranalys<strong>in</strong>g systems.A k<strong>in</strong>d of bnon-monetaryQ cost and result account<strong>in</strong>g can be drawn up solely with theord<strong>in</strong>al dist<strong>in</strong>ction of materials as good, bad or neutral for a complex material flow system.S<strong>in</strong>ce this is not immediately carried out at a monetary level (<strong>in</strong> other words <strong>in</strong> o or D),but <strong>in</strong>stead at a physical level (<strong>in</strong> kg or kJ), it can be used subsequently for both economicand ecological analyses. After all, ecological analyses presuppose physical data and cangenerally not be derived from economic quantities. Altogether this makes it possible todeterm<strong>in</strong>e the <strong>in</strong>direct environmental impacts caused as a result for <strong>in</strong>dividual processes <strong>in</strong>larger system l<strong>in</strong>kages.As shown here with the example of electronic waste, it is expedient to <strong>in</strong>terpret waste asgood <strong>in</strong> an advanced closed-loop economy too – <strong>in</strong> other words as a production factor –and no longer as an <strong>und</strong>esired bad. As regards the allocation of costs and environmentalpollution, we ultimately reach the chicken-and-egg problem <strong>in</strong> a material cycle. Are we toelim<strong>in</strong>ate the bad, or are we already produc<strong>in</strong>g a new good?Production theory could help further here by relat<strong>in</strong>g the costs and the environmentalimpacts <strong>in</strong> a closed-loop material management system consistently to the benefit, forexample the service of the products. In any case the methodology described here helps toanalyse complex production and reduction systems transparently, to <strong>und</strong>erstand thembetter, and ultimately to optimise them.AcknowledgementsThe author would like to thank Mr. Ulrich Hakenjos and Ms. Roswitha Weitzer fromHP Europe <strong>in</strong> Boebl<strong>in</strong>gen for the fruitful cooperation and IFU Hamburg GmbH forprovid<strong>in</strong>g the software UmbertoR.The author would also like to thank the two anonymousreviewers for their helpful comments and Ms. Gold<strong>in</strong>g for her <strong>in</strong>dispensable help <strong>in</strong>translation.ReferencesBader H-P, Bacc<strong>in</strong>i P. Regionaler Stoffhaushalt Erfassung, Bewertung <strong>und</strong> Steuerung. Berl<strong>in</strong>7 Heidelberg; 1996.D<strong>in</strong>kelbach W, Rosenberg O. Erfolgs-<strong>und</strong> umweltorientierte Produktionstheorie. Berl<strong>in</strong>7 Heidelberg; 2003.DSD-Duales System Deutschland. Geschaeftsbericht 2002. Koeln: DSD; 2003.Dyckhoff H. Betriebliche Produktion. Theoretische Gr<strong>und</strong>lagen e<strong>in</strong>er umweltorientierten Produktionswirtschaft.Berl<strong>in</strong>7 Heidelberg; 1994.Dyckhoff H. <strong>Umweltmanagement</strong>. Berl<strong>in</strong>7 Heidelberg; 2000.Dyckhoff H. Neukonzeption der Produktionstheorie. Zeitschrift für Betriebswirtschaft ZfB 2003;73(7):705– 32.Dyckhoff H, Lackes R, Reese J. Supply cha<strong>in</strong> management and reverse logistics. Berl<strong>in</strong>7 Heidelberg; 2004.Gutenberg E. Gr<strong>und</strong>lagen der Betriebswirtschaftslehre. Die Produktion Vol. 1. Berl<strong>in</strong>7 Heidelberg; 1951.Houtman J. Elemente e<strong>in</strong>er umweltorientierten Produktionstheorie. Wiesbaden; 1998.ISO-International Organization for Standardization. Environmental management—Life cycle assessment—Pr<strong>in</strong>ciples and framework ISO 14040; 1997. Genève.ISO-International Organization for Standardization. Environmental Management—Life cycle assessment—Goaland scope def<strong>in</strong>ition and <strong>in</strong>ventory analysis ISO 14041. Genève; 1998.
ARTICLE IN PRESS20M. Schmidt / Environmental Impact Assessment Review xx (2005) xxx–xxxKoopmans TC. Analysis of production as an efficient comb<strong>in</strong>ation of activities. In: Koopmans T.C., editor.Activity analysis of production and allocation. New York7 John Wiley & Sons; 1951. p. 33–97.LfU. Energie-<strong>und</strong> Stoffstrommanagement. Landesanstalt für Umweltschutz Baden-Württemberg. Industrie <strong>und</strong>Gewerbe No. 11. Karlsruhe; 2004.Möller A. Stoffstromnetze. In: Hilty L.M., et al, editors. Informatik für den Umweltschutz, vol. 2. Marburg7University of Hamberg; 1994. p. 223–30.Möller A. Gr<strong>und</strong>lagen stoffstrombasierter Betrieblicher Umwelt<strong>in</strong>formationssysteme. Bochum7 projekt verlag;2000.Schmidt M. E<strong>in</strong> leistungsfähiger Allokationsansatz für Stoffstromsysteme mit Kuppelproduktion aus derProduktionstheorie. In: Frischknecht R, Hellweg S, editors. Ökobilanz-Allokationsmethoden Modelle aus derKosten-<strong>und</strong> Produktionstheorie sowie praktische Probleme <strong>in</strong> der Abfallwirtschaft, Vol. 7. DiskussionsforumÖkobilanzen an der ETH Zürich; 1998. p. 35–41.Schmidt M, Keil R. Stoffstromnetze <strong>und</strong> ihre Nutzung für mehr Kostentransparenz sowie die Analyse derUmweltwirkung betrieblicher Stoffströme. Beiträge der <strong>Hochschule</strong> <strong>Pforzheim</strong>, vol. 103; 2002.Steven M. Produktionstheorie. Wiesbaden; 1998.Umweltb<strong>und</strong>esamt (UBA). Ökologische Bilanzen <strong>in</strong> der Abfallwirtschaft UBA-Texte 10/1999; 1999. Berl<strong>in</strong>:Umweltb<strong>und</strong>esamt.Mario Schmidt has been Professor of Environmental Management <strong>in</strong> the Faculty of Economics of <strong>Pforzheim</strong>University and Director of the Institute of Applied Research s<strong>in</strong>ce 1999. Before this he was a member of theScientific Board of ifeu-Institute for Energy and Environmental Research Heidelberg. His ma<strong>in</strong> fields of work areenvironmental management, Life Cycle Assessment and material flow management. He heads a large number ofresearch projects on behalf of the German Federal M<strong>in</strong>istry of Research and the state of Baden-Wuerttemberg. Heis also advisor to firms such as Daimler-Chrysler, BASF, Hewlett-Packard or DSD.