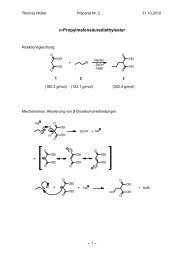
2D-NMR spectroscopy
2D-NMR spectroscopy
2D-NMR spectroscopy

Create successful ePaper yourself
Turn your PDF publications into a flip-book with our unique Google optimized e-Paper software.
<strong>2D</strong>-<strong>NMR</strong> <strong>spectroscopy</strong><br />
Part 2<br />
F.D. Sönnichsen<br />
Thursday, Oct 23 2008
The <strong>2D</strong> - COSY<br />
Periods in a <strong>2D</strong>: Preparation frequency labeling acquisition<br />
Indirect frequency determination =<br />
indirect dimension<br />
mixing<br />
Directly observed =<br />
Direct dimension<br />
Repeat n times,<br />
each time with incrementally increased Δt1<br />
Keep the individual FIDs separate.
Vektor-Diagramm Analyse des <strong>2D</strong>-COSYs –die<br />
Frequenzbestimung in der indirekten Dimension<br />
90x<br />
90x<br />
t 1<br />
t 2<br />
n<br />
FID 1:<br />
x<br />
90x<br />
T1=0<br />
T1=τ<br />
90x<br />
Acq<br />
FID 2:<br />
Acq<br />
FID 3:<br />
T1=2τ<br />
Acq<br />
FID 4:<br />
T1=3τ<br />
Acq<br />
Eine Komponente der Magnetisierung wird durch den zweiten Puls in Z-Richtung weitergedreht,<br />
während die zweite Komponente in der transversalen Ebene bleibt. Die Amplitude ist jedoch<br />
verringert, sie ist Sinus-moduliert.<br />
Was passiert wenn wir das Experiment wiederholen, jedesmal mit einer systematisch verlängerten<br />
Delay-Zeit
Sollte wie eine Sinus – Modulation aussehen
Fourier transform<br />
with respect to t 1
Correlating different types of nuclei<br />
The HMQC experiment<br />
Uses the direct coupling of attached nuclei to provide <strong>2D</strong> correlation<br />
spectrum. Very sensitive.<br />
The value used for J is typically 145 Hz.<br />
Note: the peak splitting due to the coupling is suppressed via decoupling<br />
during t2, so that we see singuletts in the spectra
Korrelation von unterschiedlichen Kernen<br />
Das HETCOR Experiment<br />
(traditionelle,ursprüngliche<br />
Weg, Protonen mit<br />
HeteroAtomen zu koppeln)<br />
Jetzt selten benutzt<br />
NOTE: Detektion des<br />
Kohlenstoffes<br />
Das HMQC Experiment<br />
(Heteronuclear multiple quantum<br />
coherences)<br />
Benutzt die direkte 1 J-Kopplung<br />
der gebundenen Atome.<br />
Detektiert das Proton. Sehr<br />
empfindlich . Der benutzte Wert<br />
für J ist typischerweise145 Hz.<br />
Note: der Entkoppler –Decoupler<br />
während der Detektionszeit führt<br />
zur Aufnahme von<br />
Singuletts,ungespaltete Signale
Heteronuclear Indirect Detection<br />
Experiments that detect 1 H involved in coupling to an X nuclei ( 13 C or 15 N). Sensitivity<br />
3/2<br />
is enhanced by a factor ⎛ γ H ⎞ where γ is the gyromagnetic ratio.<br />
⎜ γ X<br />
⎟<br />
⎝<br />
⎠<br />
Signal/Noise comparisons<br />
γ H<br />
γ X<br />
⎛ γ H ⎞<br />
⎝<br />
⎜ γ X ⎠<br />
⎟<br />
3/2<br />
Polarization<br />
Transfer for<br />
Direct DET<br />
Nuclei No NOE Full NOE<br />
13 C +1 +3 4 32<br />
15 N +1 Š4 10 306<br />
Indirect<br />
Detection<br />
The much larger sensitivity have lead to the almost exclusive use of indirectly<br />
detected heteronuclear experiments. Note, that these however do not provide<br />
information on quarternary Carbon nuclei!!
The HMBC experiment<br />
MB stands for Multiple bonds<br />
• We have connected neigboring protons (COSY)<br />
• We have connected protons to attached 13 C with the direct 1 J coupling<br />
(HMQC)<br />
• Can we use long range couplings and connect further protons<br />
The HMBC SELECTIVELY observes protons and 13 C that are connected via<br />
small 2,3 J couplings ( of the order of 10 Hz).
Comparison HMQC / HMBC<br />
C-H,<br />
1<br />
J=145,<br />
delay = 3ms<br />
long range C -H,<br />
2<br />
J or 3 J ~ 10Hz,<br />
delay = 50ms
Ipsenol<br />
Note : the arrows indicate<br />
artifacts, i.e. direct couplings<br />
which are not completely<br />
removed. These are 1J<br />
couplings, and can be<br />
identified by their large<br />
splitting. Since we don‘t<br />
decouple during t2, the 1J<br />
couplings constant splits the<br />
signal into a doublett, with a<br />
separation of ~145Hz due to<br />
the 1J-coupling.
More on <strong>2D</strong>:<br />
• The principle of <strong>2D</strong> <strong>NMR</strong> can be extended<br />
to 3D, 4D and even higher experiments,<br />
i.e. even more frequencies can be<br />
simultaneously detected. What is the<br />
caveat <br />
• A 1D spectrum takes minutes, a <strong>2D</strong><br />
spectrum hours, a 3D days, a 4D ……
More on <strong>2D</strong>:<br />
• Many more <strong>2D</strong> experiments can be<br />
created , that correlate the same or further<br />
nuclei with desired specificity<br />
• Most of these experiments correlate nuclei<br />
using coupling constants, i.e. the correlate<br />
through bonds.<br />
• Some also offer the possibility to correlate<br />
nuclei through space
<strong>2D</strong> -<br />
INADEQUATE<br />
Allows 13 C— 13 C connectivities to be obtained<br />
Incredible Natural Abundance Double<br />
Quantum Transfer Experiment<br />
1. A. Bax, Two-Dimensional Nuclear Magnetic Resonance in Liquids, Delft University Press,<br />
Delft, Holland (1982) pp. 155-174.<br />
2. D. L. Turner, J. Magn. Reson., 53, 259 (1983)<br />
3. D. L. Turner, J. Magn. Reson., 49, 175 (1982)<br />
4. A. Bax and T. H. Mareci, J. Magn. Reson., 53, 360 (1983)<br />
p. 178 - Nakanishi’s text<br />
p. 279 - Silverstein & Bassler & Morril<br />
Sensitivity is extremely low, because<br />
13<br />
C 1.1%<br />
13<br />
C— 13 C 0.01% Correlates double-quantum frequency of 13 C— 13 C<br />
Many variations provide same information, but in different formats<br />
Usually the cross peaks are 2 peaks, representing AX 13 C— 13 C doublets<br />
Pulse sequences are complex and involve long phase cycling to select for desired double<br />
quantum coherences
13C<br />
13C
<strong>2D</strong>-TOCSY experiment<br />
• Total Correlation Spectroscopy<br />
• Correlates simultaneously all atoms in a<br />
spin system
Same data as COSY (geminal and vicinal couplings), plus RELAY information
<strong>2D</strong>-TOCSY experiment<br />
Spin system : A, B, D, F<br />
F<br />
Diagonal<br />
TOCSY<br />
COSY<br />
D<br />
B<br />
A<br />
A B D F
TOCSY of a small peptide
Compare the COSY of this peptide
t1<br />
t2<br />
Correlation through space<br />
NOE difference <strong>spectroscopy</strong><br />
semi-quantitative measurement of of local proximity<br />
t1<br />
t2
The nuclear Overhauser enhancement<br />
• In contrast to all previous experiments, in which we connected spins through bonds,<br />
the nuclear Overhauser effects enables us to connect nuclei through space.<br />
• This effect is fundamentally different as exchange between the nuclei does not<br />
involve scalar coupling.<br />
• Instead, the direct magnetic coupling (no electrons in between) termed dipolar<br />
coupling is involved, which usually does not have an observable effect in solution (in<br />
contrast to solid state!).<br />
• The nOe can be correlated with internuclear distances and molecular motion.<br />
nOe definition:<br />
η = I - Io<br />
Io<br />
The noe is defined as the normalized intensity change of a resonance line<br />
upon saturating –changing the population of another spin in proximity<br />
NOE = c x r -6<br />
Noes can be measured for protons that are in<br />
close proximity, generally if they are less than<br />
5Å
Noe-background 1<br />
Let’s consider: 2 spins , I and S. They are not coupled ( J=0).<br />
ω 34 , S<br />
βα<br />
4<br />
ω 13 I 1<br />
3<br />
2<br />
ββ<br />
αα<br />
ω 24 I<br />
αβ<br />
ω 12 , S<br />
ω 13 = ω 24 = ω I<br />
ω 12 = ω 34 = ω S<br />
The intensity of the magnetization/ the transition for I and S is given by<br />
the relative populations of these four levels. For I and S, the respective<br />
population differences are:<br />
= 1/2 (P 1<br />
-P 3<br />
+ P 2<br />
-P 4<br />
)<br />
= 1/2 (P 1<br />
-P 2<br />
+ P 3<br />
-P 4<br />
)<br />
and<br />
The irradiation with resonance frequency of S, leads to the equalization of the Populations of the levels for S:P1<br />
= P2, and P3 = P4. At the same time, relaxation will oppose the non-equilibrium situation, leading to<br />
relaxation of the<br />
spins proportional to the following transition probabilities (W I<br />
, W S<br />
, W 2<br />
, W 0<br />
)<br />
W 1 S<br />
βα<br />
W 1 I<br />
ββ<br />
αα<br />
W 1 , I or W I<br />
αβ<br />
W 1 , S or W S<br />
In addition, if the spins are close enough,<br />
the additional two relaxation mechansims (blue arrows)<br />
also exist. These are doublequantum or zero quantum<br />
transistion, involving the spin flip of both spins<br />
simultaneously. Relaxation via these transistion leads<br />
to populationchanges , and thus the sensitivty<br />
enhancement
• It can be easily shown that<br />
NOE=<br />
η =<br />
σ<br />
IS<br />
ϕ<br />
I<br />
=<br />
W2<br />
−W0<br />
2W<br />
+ W + W<br />
I<br />
2<br />
0<br />
For small molecules , W2 is the dominant relaxation pathway leading to positive<br />
NOEs<br />
For larger molecules , W0 is dominant, and one obtains negative NOEs. (intensity<br />
reduction)<br />
Most importantly, the NOE can be quantified and correlated with a distance , since
NOE-experiments<br />
• 1D- steady-state nOe experiment:<br />
– constant irradiation – 1D difference spectrum<br />
• <strong>2D</strong>-NOESY experiment:<br />
The <strong>2D</strong>-NOESY experiment is the most useful experiments, as all nOe<br />
effect between spins can be measured simultaneously. The nOe is<br />
generated by simultaneous, temporary population changes, which is<br />
called “transient” nOe, not a selective inversion or steady-state<br />
irradiation. The nOe gives rise to magnetization transfer and offdiagonal<br />
peaks, connecting the resonance frequencies of the spins<br />
which couple/ cross relax through space.<br />
90 90 90<br />
d1 t1 tmix t2<br />
Tmix is usually chosen to be between 500ms and 2 sec
z<br />
<strong>2D</strong>-NOESY: vector model<br />
z<br />
z<br />
90x<br />
t 1<br />
y<br />
y<br />
y<br />
x<br />
x<br />
x<br />
Different y-component<br />
z<br />
z<br />
z<br />
90x<br />
y<br />
y<br />
y<br />
x<br />
Difference in z-component = population change,<br />
causes relaxation, is transfers magnetization,<br />
mixes S with I and vice versa<br />
dIz<br />
dt<br />
= − ϕ 1(<br />
Iz − Io ) − σ IS ( Sz − So<br />
)<br />
x<br />
During tmix transferred to I<br />
During t1: frequency labeled at ωs<br />
IS<br />
During t2 detected with I (ωI) NOE ( ϖ 1,<br />
ϖ 2 ) = ( ϖ S , ϖ I )<br />
I<br />
σ<br />
ϕ
Aphanamol-1<br />
This NOE showed that<br />
the 5-membered ring is<br />
cis to the 7-membered<br />
ring.<br />
15CH 2<br />
5H
Homonuclear<br />
• Through-bond<br />
• COSY (absolute value and<br />
phase sensitive displays, DQF-<br />
COSY)<br />
• TOCSY<br />
• Through-space<br />
• NOESY<br />
• ROESY<br />
Heteronuclear<br />
• Through-bond<br />
• HETCOR<br />
• Long-range HETCOR or<br />
COLOC<br />
• INADEQUATE<br />
• INDIRECT-DETECTION<br />
(HSCQ, HMQC, HMBC)<br />
Pulse Field Gradients (PFG)<br />
<strong>NMR</strong>- the acronym soup!<br />
(<strong>NMR</strong> – die Suppenterrine voll Abkürzungen)
Example: Lactose
• 2 sugar units<br />
• 2 separate groups of<br />
coupled spins (termed<br />
spin systems)<br />
• Multiple overlap of the<br />
sugar resonances, and<br />
of the resepective cross<br />
peaks<br />
• Canweusethegood<br />
separation of the<br />
anomeric protons
Lactose - <strong>2D</strong> TOCSY
Lactose -ROESY<br />
• Equivalent<br />
Experiment to the<br />
NOESY<br />
• Coupling through<br />
space<br />
• Detects close<br />
proximity of protons<br />
Expansions:
References<br />
J. B. Lambert & E. P. Mazzola, Nuclear<br />
Magnetic Resonance Spectroscopy,<br />
Pearson Prentice Hall, 2004<br />
RM Silverstein, FX Webster & DJ Kiemle,<br />
Spectrometric Identification of Organic<br />
compounds Wiley 2005.