ING (L) RENTA FUND - Fundsupermart.com
ING (L) RENTA FUND - Fundsupermart.com
ING (L) RENTA FUND - Fundsupermart.com

You also want an ePaper? Increase the reach of your titles
YUMPU automatically turns print PDFs into web optimized ePapers that Google loves.
Annual report and audited financial statements<br />
<strong>ING</strong> (L) <strong>RENTA</strong> <strong>FUND</strong><br />
(Sub-funds offered on the Hong Kong market)<br />
for the year ended March 31, 2008<br />
•••••••••••••••••••••••••••••••••••••••••••••••••••••••••••••••••••••••••••••••••••••••••••••••••••••••••••••••••••••••••••••••••••••••••••••••••••••••••••••••<br />
Management's report<br />
Not a single financial market was unaffected by the slump on the US housing market, due to various factors. First of all, banks had<br />
been extremely "flexible" in previous years, granting mortgage loans even to home owners who were not creditworthy (the subprime<br />
segment). Their flexible policy was based on the assumption that US house prices would continue to rise. When house prices started<br />
to decline, a growing number of home owners ran into financial trouble.<br />
The widespread fallout of declining property prices was also connected to the emergence of new financial products and innovative<br />
structures. In previous years, investors had massively taken advantage of enhanced opportunities to spread risk: by collecting<br />
mortgage portfolios, splitting them up into tranches and selling them again. There was a snag, however. Nobody knew exactly how<br />
big the risks involved really were and where the transferred risks had ended up.<br />
In July and subsequent months, investors’ risk aversion did not subside. As a consequence, the more defensive sectors outperformed<br />
the cyclical sectors on the whole. A notable exception was the basic materials sector which was able to consolidate most of its earlier<br />
gains. The energy sector also showed an excellent performance, boosted by substantially higher oil prices.<br />
The fourth quarter largely saw a continuation of the developments of the previous quarter. The credit crisis persisted and the financial<br />
markets continued to face huge uncertainties. As a consequence, the price fluctuations were again very substantial and financial<br />
stocks remained under severe pressure. Global equities lost around 5% during the quarter.<br />
During the first quarter of 2008, equity prices declined sharply worldwide, while volatility remained high. The financial sector saw the<br />
downward trend of last year continue, and once again produced sharply negative returns (-18%). Sectors which declined by more<br />
than 20% were tele<strong>com</strong> services and information technology. In these two sectors, a number of American <strong>com</strong>panies announced<br />
disappointing results. Sectors which held up relatively well were the segment consumer staples (-11%) and the cyclical segment<br />
Industrials (-13%). The cyclical basic materials sector also outperformed (-6%), as <strong>com</strong>modity prices continued to surge. This price<br />
trend could be attributed to ongoing shortages and sharply higher demand, in particular from Asia. On balance, global equities lost<br />
16% this quarter (in euro terms).<br />
Over the whole reporting period, Emerging Markets (especially Latin America) outperformed the rest of the world. In euro terms,<br />
MSCI Latin America won 18.7% and MSCI Emerging markets won 3.1% while MSCI World lost 16%.<br />
The best performing sectors over the period were: the Materials sector positively influenced by soaring <strong>com</strong>modity prices and the<br />
Energy sector which benefited from the rising oil prices. Underperformers were Healthcare, Financials and Consumer Discretionary.<br />
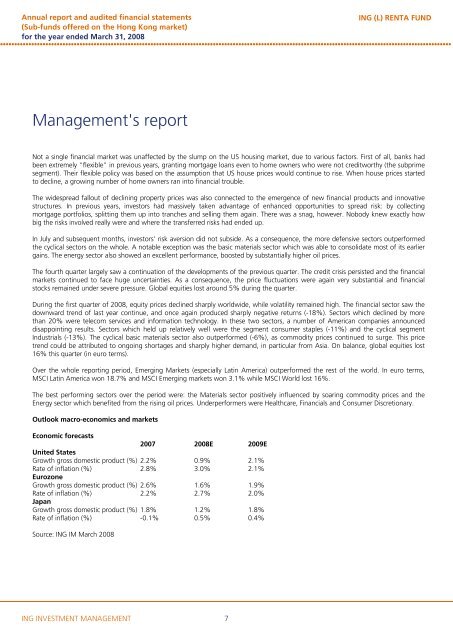
Outlook macro-economics and markets<br />
Economic forecasts<br />
2007 2008E 2009E<br />
United States<br />
Growth gross domestic product (%) 2.2% 0.9% 2.1%<br />
Rate of inflation (%) 2.8% 3.0% 2.1%<br />
Eurozone<br />
Growth gross domestic product (%) 2.6% 1.6% 1.9%<br />
Rate of inflation (%) 2.2% 2.7% 2.0%<br />
Japan<br />
Growth gross domestic product (%) 1.8% 1.2% 1.8%<br />
Rate of inflation (%) -0.1% 0.5% 0.4%<br />
Source: <strong>ING</strong> IM March 2008<br />
<strong>ING</strong> INVESTMENT MANAGEMENT<br />
7