Annual report and audited financial statements (Sub-funds offered on the Hong Kong market) for the year ended March 31, 2008 <strong>ING</strong> (L) Renta Fund Asian Debt (Denominated in USD) <strong>ING</strong> (L) <strong>RENTA</strong> <strong>FUND</strong> •••••••••••••••••••••••••••••••••••••••••••••••••••••••••••••••••••••••••••••••••••••••••••••••••••••••••••••••••••••••••••••••••••• Securities portfolio as at 31/03/2008 Quantity/ Nominal Name Transferable securities and money market instruments listed on an official stock exchange Bonds and other debt instruments South Korea Currency Market value % in USD NAV 450,000 GS CALTEX CORP 5.5% 07-24/04/17 USD 386,516 2.06 300,000,000 KOREA TREAS BOND 5.5% 07- KRW 307,987 1.64 10/09/2017 250,000 NACF 05-26/05/2015 SR USD 248,117 1.32 250,000 PUSAN BANK 07-30/10/2017 FRN USD 239,106 1.27 500,000 SHINHAN BANK 05-02/03/2035 SR USD 406,108 2.15 150,000 SHINHAN BANK 06-28/02/2016 SR USD 148,306 0.79 300,000 WOORI BANK 06-03/05/2016 SR USD 293,366 1.56 400,000 WOORI BANK 07-02/05/2037 FRN USD 318,328 1.69 2,347,834 12.48 Cayman Islands 350,000 AGILE PROPERTY 9% 06-22/09/2013 USD 269,436 1.43 250,000 C&M FINANCE LTD 06-01/02/2011 USD 251,750 1.34 FRN 350,000 HUTCH WHAM FIN 7.45% 97- USD 376,953 2.01 01/08/2017 325,000 HUTCHINSON WHAMPOA FIN 7.5% USD 331,006 1.76 97-01/08/2027 75,000 HUTCHINSON WHAMPOA INTL USD 76,647 0.41 5.45% 03-24/11/2010 425,000 HUTCHINSON WHAMPOA INTL USD 439,228 2.35 7.45% 03-24/11/2033 100,000 MTR CORP 4.75% 04-21/01/2014 USD 102,401 0.54 200,000 PARKSON RETAIL GROUP 7.875% 06- USD 196,000 1.04 14/11/11 100,000 UOB CAYMAN LTD 5.796% 05- USD 94,786 0.50 29/12/2049 FRN 2,138,207 11.38 Netherlands 100,000 INDOSAT FIN CO 7.75% 03- USD 101,439 0.54 05/11/2010 300,000 MAJAPAHIT HOLD 7.25% 07- USD 285,057 1.52 28/06/2017 700,000 MAJAPAHIT HOLD 7.75% 06- USD 687,563 3.66 17/10/2016 600,000 NIBC BANK NV FRN 07-22/04/2012 USD 567,840 3.02 200,000 SUN SAGE BV 8.25% 04-26/03/2009 USD 199,628 1.06 1,841,527 9.80 Philippines 150,000 EQUITABLE PCI 03-01/07/2013 SR USD 151,272 0.80 500,000 NATL POWER CORP 6.875% 06- USD 508,373 2.71 02/11/2016 200,000 PHILIP LONG DIST 8.35% 97- USD 223,753 1.19 06/03/2017 300,000 PHILIPPINES(REP) 9.5% 05- USD 391,500 2.08 02/02/2030 1,274,898 6.78 Malaysia 700,000 MALAYSIAN GOVT 7% 89- MYR 226,091 1.20 15/03/2009 100,000 MISC CAPITAL LTD 6.125%04- USD 106,174 0.56 01/07/2014 300,000 PRIME HOLD<strong>ING</strong>S 5.375% 04- USD 282,955 1.51 22/09/2014 100,000 PUBLIC BANK BERH 06-22/08/2036 USD 97,778 0.52 SR 500,000 RANTAU ABANG CAPITAL 06/2011 MYR 158,839 0.85 4.39% Quantity/ Nominal Name Currency Market value % in USD NAV 1,000,000 YTL POWER GEN 4.55% 06- 28/01/2009 MYR 314,181 1.67 1,186,018 6.31 Thailand 12,000,000 BANK OF THAILAND 5.5% 06- 10/08/2008 THB 384,573 2.04 250,000 PTT CHEMICAL 5.5% 05-24/06/2015 USD 243,932 1.30 275,000 TFBTB-REG S 8.25% 96-21/08/2016 USD 303,562 1.62 200,000 TRUE MOVE CO LTD 10.375% 07- 01/08/14 USD 186,919 0.99 1,118,986 5.95 Virgin Islands 400,000 CITIC RESOURCES 6.75% 07- 15/05/2014 USD 360,000 1.92 150,000 CNOOC FINANCE 03/2033 5 1/2% USD 130,488 0.69 300,000 PCCW-HKT CAPITAL 7.75% 01- 15/11/2011 USD 325,347 1.73 300,000 WHARF FINANCE 6.125% 07- 06/11/2017 USD 299,807 1.60 1,115,642 5.94 United Kingdom 20,000,000 BARCLAYS BK PLC 07-17/01/2017 FRN FLAT INR 511,515 2.72 500,000 BARCLAYS BK PLC 07-17/12/2012 FRN USD 572,500 3.05 1,084,015 5.77 Taiwan 17,000,000 TAIWAN GB 5.125% 98-25/09/2008 TWD 565,359 3.01 10,000,000 TAIWAN GB 6.875% 98-20/02/2013 TWD 396,963 2.11 962,322 5.12 Singapore 100,000 DEV BK S<strong>ING</strong>APORE 04-15/11/2019 SR USD 93,200 0.50 100,000 ICICI BANK S<strong>ING</strong> 5.75% 05- 16/11/2010 USD 99,834 0.53 300,000 S<strong>ING</strong>APORE 4.375% 99-15/01/2009 SGD 223,501 1.19 200,000 UNITED OVERSEAS 04-03/09/2019 SR USD 190,879 1.02 350,000 UNITED OVERSEAS 4.5% 03- 02/07/2013 USD 335,710 1.78 943,124 5.02 Indonesia 350,000 BANK INTL INDO 05-28/04/2015 SR USD 362,208 1.92 200,000 CILIANDRA 10.75% 06-08/12/2011 USD 194,000 1.03 350,000 PT BANK DANAMON 04-30/03/2014 SR USD 352,433 1.88 908,641 4.83 Pakistan 125,000 PAKISTAN INT 05-27/01/2010 FRN USD 120,883 0.64 200,000 PAKISTAN MOBILE 8.625% 06- 13/11/2013 USD 178,250 0.95 400,000 REP OF PAKISTAN 6.875% 07- 01/06/2017 USD 340,000 1.81 639,133 3.40 Japan 50,000,000 JAPAN GOVT 0.8% 06-15/11/2008 JPY 503,140 2.68 503,140 2.68 Hong Kong 225,000 BANGKOK BANK 9.025% 99- 15/03/2029 USD 237,189 1.26 The ac<strong>com</strong>panying notes form an integral part of these financial statements. <strong>ING</strong> INVESTMENT MANAGEMENT 13
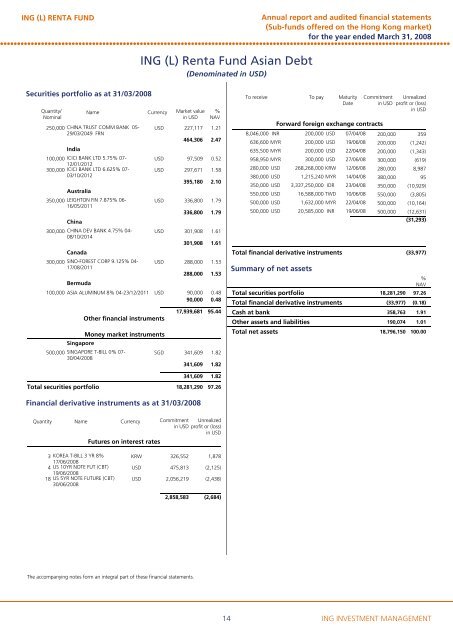
<strong>ING</strong> (L) <strong>RENTA</strong> <strong>FUND</strong> <strong>ING</strong> (L) Renta Fund Asian Debt (Denominated in USD) Annual report and audited financial statements (Sub-funds offered on the Hong Kong market) for the year ended March 31, 2008 •••••••••••••••••••••••••••••••••••••••••••••••••••••••••••••••••••••••••••••••••••••••••••••••••••••••••••••••••••••••••••••••••••• Securities portfolio as at 31/03/2008 Quantity/ Nominal Name 250,000 CHINA TRUST COMM BANK 05- 29/03/2049 FRN USD 227,117 1.21 464,306 2.47 India 100,000 ICICI BANK LTD 5.75% 07- 12/01/2012 USD 97,509 0.52 300,000 ICICI BANK LTD 6.625% 07- 03/10/2012 USD 297,671 1.58 395,180 2.10 Australia 350,000 LEIGHTON FIN 7.875% 06- 16/05/2011 USD 336,800 1.79 336,800 1.79 China 300,000 CHINA DEV BANK 4.75% 04- 08/10/2014 USD 301,908 1.61 301,908 1.61 Canada 300,000 SINO-FOREST CORP 9.125% 04- 17/08/2011 USD 288,000 1.53 288,000 1.53 Bermuda 100,000 ASIA ALUMINUM 8% 04-23/12/2011 USD 90,000 0.48 90,000 0.48 Other financial instruments Currency Market value % in USD NAV 17,939,681 95.44 Money market instruments Singapore 500,000 S<strong>ING</strong>APORE T-BILL 0% 07- 30/04/2008 SGD 341,609 1.82 341,609 1.82 To receive To pay Maturity Date Commitment in USD Unrealized profit or (loss) in USD Forward foreign exchange contracts 8,046,000 INR 200,000 USD 07/04/08 200,000 359 636,600 MYR 200,000 USD 19/06/08 200,000 (1,242) 635,500 MYR 200,000 USD 22/04/08 200,000 (1,343) 958,950 MYR 300,000 USD 27/06/08 300,000 (619) 280,000 USD 268,268,000 KRW 12/06/08 280,000 8,987 380,000 USD 1,215,240 MYR 14/04/08 380,000 95 350,000 USD 3,337,250,000 IDR 23/04/08 350,000 (10,929) 550,000 USD 16,588,000 TWD 10/06/08 550,000 (3,805) 500,000 USD 1,632,000 MYR 22/04/08 500,000 (10,164) 500,000 USD 20,585,000 INR 19/06/08 500,000 (12,631) (31,293) Total financial derivative instruments (33,977) Summary of net assets % NAV Total securities portfolio 18,281,290 97.26 Total financial derivative instruments (33,977) (0.18) Cash at bank 358,763 1.91 Other assets and liabilities 190,074 1.01 Total net assets 18,796,150 100.00 341,609 1.82 Total securities portfolio 18,281,290 97.26 Financial derivative instruments as at 31/03/2008 Quantity Name Currency Commitment Unrealized in USD profit or (loss) in USD Futures on interest rates 3 KOREA T-BILL 3 YR 8% KRW 326,552 1,878 17/06/2008 4 US 10YR NOTE FUT (CBT) USD 475,813 (2,125) 19/06/2008 18 US 5YR NOTE FUTURE (CBT) USD 2,056,219 (2,438) 30/06/2008 2,858,583 (2,684) The ac<strong>com</strong>panying notes form an integral part of these financial statements. 14 <strong>ING</strong> INVESTMENT MANAGEMENT