marees terrestres bulletin d'informations - Université de la Polynésie ...
marees terrestres bulletin d'informations - Université de la Polynésie ...
marees terrestres bulletin d'informations - Université de la Polynésie ...

Create successful ePaper yourself
Turn your PDF publications into a flip-book with our unique Google optimized e-Paper software.
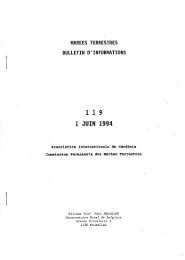
Tab. 4: Averages of noise levels at the different frequency bands for the analysed ET18 and SG data sets.<br />
4.17 • 10 -3 cph 0.0417 cph 0.0833 cph 0.125 cph<br />
ET18 [nm/s²] 2.992 0.252 0.124 0.085<br />
SG [nm/s²] 1.060 0.041 0.021 0.012<br />
100<br />
10<br />
Gravity amplitu<strong>de</strong> [nm/s²]<br />
1<br />
0.1<br />
0.01<br />
0.001<br />
ET18<br />
SG<br />
0.0001<br />
0 0.04 0.08 0.12 0.16<br />
Frequency [cph]<br />
Fig. 5: Frequency spectra of the residuals from tidal analyses for the ET18<br />
gravimeter and SG gravimeter.<br />
5. Comparative analyses in the high frequency band (free mo<strong>de</strong>s of the Earth)<br />
After strong earthquakes the Earth oscil<strong>la</strong>tes with a sum of discrete spheroidal and toroidal mo<strong>de</strong>s. Spheroidal<br />
mo<strong>de</strong>s are affected by the gravitational field of the Earth and can be measured using gravimeters. For the<br />
<strong>de</strong>termination of the free mo<strong>de</strong>s three strong earthquakes were cut out of the gravity records of the ET18 and the<br />
SG (source: earthquake catalogue USGS NEIC):<br />
1. August 15, 2007 near the coast of central Peru with a magnitu<strong>de</strong> of 8.0<br />
2. September 13, 2007 southern Sumatra with magnitu<strong>de</strong>s of 8.5<br />
3. May 12, 2008 eastern Sichuan, China with a magnitu<strong>de</strong> of 7.9<br />
Each of the three data sets has a length of 49 hours. Figure 6 shows the residuals of the time series<br />
(<strong>de</strong>ti<strong>de</strong>d and <strong>de</strong>pressured) of the ET18 and SG for the earthquake in eastern Sichuan, China. For all records<br />
discrete Fourier spectra between 0.25 mHz and 4 mHz (periods between 67 min and 4 min) were calcu<strong>la</strong>ted.<br />
Furthermore, the spectra were stacked for each gravimeter to increase the signal-to-noise ratios. Results are 28<br />
spheroidal free mo<strong>de</strong>s (frequencies of the mo<strong>de</strong>s after Masters and Widmer 1995) in the stacked spectra (Fig. 7).<br />
As can be seen, the noise level of the ET18 is slightly higher than the one of the SG until a frequency of 1.5 mHz.<br />
Moreover, the amplitu<strong>de</strong> values of the frequency peaks in the ET18 spectrum are a bit lower than the peak values<br />
of the SG spectrum. From these two facts follows, that the signal-to-noise ratios of the ET18 are smaller than<br />
those of the SG. Nevertheless, the information content in both spectra is the same.