marees terrestres bulletin d'informations - Université de la Polynésie ...
marees terrestres bulletin d'informations - Université de la Polynésie ...
marees terrestres bulletin d'informations - Université de la Polynésie ...

Create successful ePaper yourself
Turn your PDF publications into a flip-book with our unique Google optimized e-Paper software.
5. Recording of Data<br />
The data logged were stored in a computer using software <strong>de</strong>veloped by the first author, which<br />
was <strong>de</strong>signed un<strong>de</strong>r Q-basic. Data were logged in a high resolution sampling interval of 5 seconds.<br />
The data were stored in files, each of one hour capacity. The ETERNA format used was <strong>de</strong>scribed<br />
by Wenzel (1994). It was adopted for the exchange of high precision and high rate Earth ti<strong>de</strong> data<br />
by the working group on High Precision Tidal Data Processing at its meeting in Bonn 1994<br />
(comp. Jentzsch, 1995). This format was used in the tidal analysis. The recording of tidal gravity<br />
data started at the end of 2002 and is still going on. The feedback of the D–218 gravimeter returns<br />
the beam of the gravimeter to the reading line continuously, also after the occurrence of any<br />
earthquake. The changes in air pressure and temperature affect the quality of the recor<strong>de</strong>d data.<br />
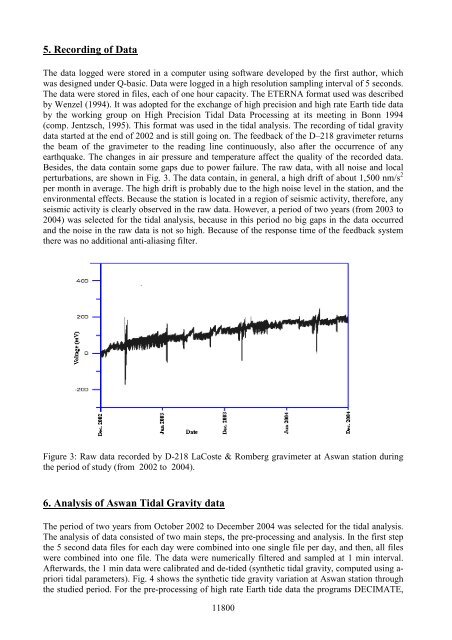
Besi<strong>de</strong>s, the data contain some gaps due to power failure. The raw data, with all noise and local<br />
perturbations, are shown in Fig. 3. The data contain, in general, a high drift of about 1,500 nm/s 2<br />
per month in average. The high drift is probably due to the high noise level in the station, and the<br />
environmental effects. Because the station is located in a region of seismic activity, therefore, any<br />
seismic activity is clearly observed in the raw data. However, a period of two years (from 2003 to<br />
2004) was selected for the tidal analysis, because in this period no big gaps in the data occurred<br />
and the noise in the raw data is not so high. Because of the response time of the feedback system<br />
there was no additional anti-aliasing filter.<br />
Figure 3: Raw data recor<strong>de</strong>d by D-218 LaCoste & Romberg gravimeter at Aswan station during<br />
the period of study (from 2002 to 2004).<br />
6. Analysis of Aswan Tidal Gravity data<br />
The period of two years from October 2002 to December 2004 was selected for the tidal analysis.<br />
The analysis of data consisted of two main steps, the pre-processing and analysis. In the first step<br />
the 5 second data files for each day were combined into one single file per day, and then, all files<br />
were combined into one file. The data were numerically filtered and sampled at 1 min interval.<br />
Afterwards, the 1 min data were calibrated and <strong>de</strong>-ti<strong>de</strong>d (synthetic tidal gravity, computed using a-<br />
priori tidal parameters). Fig. 4 shows the synthetic ti<strong>de</strong> gravity variation at Aswan station through<br />
the studied period. For the pre-processing of high rate Earth ti<strong>de</strong> data the programs DECIMATE,<br />
11800