

Gamuda - the DBS Vickers Securities Equities Research
Gamuda - the DBS Vickers Securities Equities Research
Gamuda - the DBS Vickers Securities Equities Research

Create successful ePaper yourself
Turn your PDF publications into a flip-book with our unique Google optimized e-Paper software.
The Pulse of Asia Conference<br />
<strong>Gamuda</strong><br />
Bloomberg: GAM MK | Reuters: GAMU.KL<br />
BUY RM2.90 KLCI : 1,288.24<br />
Price Target : 12-month RM 4.20<br />
Potential Catalyst: Government pump priming, overseas contracts<br />
Analyst<br />
Chong Tjen-San, CFA +603 2711 2295<br />
tjensan@hwangdbsvickers.com.my<br />
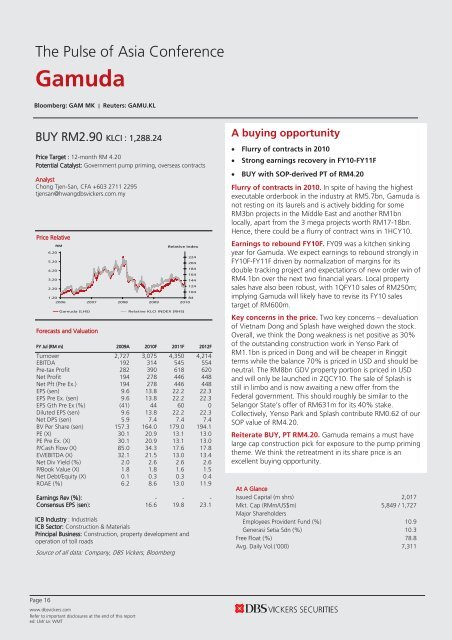
Price Relative<br />
6.20<br />
5.20<br />
4.20<br />
3.20<br />
2.20<br />
1.20<br />
RM<br />
Relative Index<br />
2006 2007 2008 2009 2010<br />
<strong>Gamuda</strong> (LHS) Relative KLCI INDEX (RHS)<br />
Forecasts and Valuation<br />
FY Jul (RM m) 2009A 2010F 2011F 2012F<br />
Turnover 2,727 3,075 4,350 4,214<br />
EBITDA 192 314 545 554<br />
Pre-tax Profit 282 390 618 620<br />
Net Profit 194 278 446 448<br />
Net Pft (Pre Ex.) 194 278 446 448<br />
EPS (sen) 9.6 13.8 22.2 22.3<br />
EPS Pre Ex. (sen) 9.6 13.8 22.2 22.3<br />
EPS Gth Pre Ex (%) (41) 44 60 0<br />
Diluted EPS (sen) 9.6 13.8 22.2 22.3<br />
Net DPS (sen) 5.9 7.4 7.4 7.4<br />
BV Per Share (sen) 157.3 164.0 179.0 194.1<br />
PE (X) 30.1 20.9 13.1 13.0<br />
PE Pre Ex. (X) 30.1 20.9 13.1 13.0<br />
P/Cash Flow (X) 85.0 34.3 17.6 17.8<br />
EV/EBITDA (X) 32.1 21.5 13.0 13.4<br />
Net Div Yield (%) 2.0 2.6 2.6 2.6<br />
P/Book Value (X) 1.8 1.8 1.6 1.5<br />
Net Debt/Equity (X) 0.1 0.3 0.3 0.4<br />
ROAE (%) 6.2 8.6 13.0 11.9<br />
Earnings Rev (%): - - -<br />
Consensus EPS (sen): 16.6 19.8 23.1<br />
ICB Industry : Industrials<br />
ICB Sector: Construction & Materials<br />
Principal Business: Construction, property development and<br />
operation of toll roads<br />
Source of all data: Company, <strong>DBS</strong> <strong>Vickers</strong>, Bloomberg<br />
224<br />
204<br />
184<br />
164<br />
144<br />
124<br />
104<br />
84<br />
A buying opportunity<br />
Flurry of contracts in 2010<br />
Strong earnings recovery in FY10-FY11F<br />
BUY with SOP-derived PT of RM4.20<br />
Flurry of contracts in 2010. In spite of having <strong>the</strong> highest<br />
executable orderbook in <strong>the</strong> industry at RM5.7bn, <strong>Gamuda</strong> is<br />
not resting on its laurels and is actively bidding for some<br />
RM3bn projects in <strong>the</strong> Middle East and ano<strong>the</strong>r RM1bn<br />
locally, apart from <strong>the</strong> 3 mega projects worth RM17-18bn.<br />
Hence, <strong>the</strong>re could be a flurry of contract wins in 1HCY10.<br />
Earnings to rebound FY10F. FY09 was a kitchen sinking<br />
year for <strong>Gamuda</strong>. We expect earnings to rebound strongly in<br />
FY10F-FY11F driven by normalization of margins for its<br />
double tracking project and expectations of new order win of<br />
RM4.1bn over <strong>the</strong> next two financial years. Local property<br />
sales have also been robust, with 1QFY10 sales of RM250m;<br />
implying <strong>Gamuda</strong> will likely have to revise its FY10 sales<br />
target of RM600m.<br />
Key concerns in <strong>the</strong> price. Two key concerns – devaluation<br />
of Vietnam Dong and Splash have weighed down <strong>the</strong> stock.<br />
Overall, we think <strong>the</strong> Dong weakness is net positive as 30%<br />
of <strong>the</strong> outstanding construction work in Yenso Park of<br />
RM1.1bn is priced in Dong and will be cheaper in Ringgit<br />
terms while <strong>the</strong> balance 70% is priced in USD and should be<br />
neutral. The RM8bn GDV property portion is priced in USD<br />
and will only be launched in 2QCY10. The sale of Splash is<br />
still in limbo and is now awaiting a new offer from <strong>the</strong><br />
Federal government. This should roughly be similar to <strong>the</strong><br />
Selangor State’s offer of RM631m for its 40% stake.<br />
Collectively, Yenso Park and Splash contribute RM0.62 of our<br />
SOP value of RM4.20.<br />
Reiterate BUY, PT RM4.20. <strong>Gamuda</strong> remains a must have<br />
large cap construction pick for exposure to <strong>the</strong> pump priming<br />
<strong>the</strong>me. We think <strong>the</strong> retreatment in its share price is an<br />
excellent buying opportunity.<br />
At A Glance<br />
Issued Capital (m shrs) 2,017<br />
Mkt. Cap (RMm/US$m) 5,849 / 1,727<br />
Major Shareholders<br />
Employees Provident Fund (%) 10.9<br />
Generasi Setia Sdn (%) 10.3<br />
Free Float (%) 78.8<br />
Avg. Daily Vol.(‘000) 7,311<br />
Page 16<br />
www.dbsvickers.com<br />
Refer to important disclosures at <strong>the</strong> end of this report<br />
ed: LM/ sa: WMT
The Pulse of Asia Conference<br />
<strong>Gamuda</strong><br />
Company Background<br />
<strong>Gamuda</strong> is an established Malaysian contractor which also<br />
has interests in property, toll concessions and water<br />
treatment and supply. Its focus has predominantly been on<br />
local government projects but has also carved out a<br />
reputation overseas with projects such as <strong>the</strong> Metro Tunnel,<br />
Taiwan, New Doha International Airport and Durkhan<br />
Highway in Qatar. Key project in hand is its RM12.5bn<br />
electrified double tracking project done jointly with MMC<br />
Corporation. It is now 34% complete while land acquisition<br />
has reached 90%.<br />
Industry Overview, Earnings Drivers & Risks<br />
The prospects for <strong>the</strong> construction industry continue to look<br />
favourable with expectations of <strong>the</strong> award of 3-4 mega<br />
projects in 2010 – LCCT, LRT extensions, Pahang Selangor<br />
Water Transfer and Bakun undersea cables and still benign<br />
cost environment. The tabling of <strong>the</strong> 10MP in June 2010 is<br />
ano<strong>the</strong>r key event to monitor. Earnings will be driven by<br />
construction in FY10F-FY12F from <strong>the</strong> normalization of<br />
margins for its double tracking project and some realistic<br />
assumptions on new order wins of RM4.1bn over FY10F-<br />
FY11F. Key risks for <strong>Gamuda</strong> are timing of rollout of mega<br />
projects, fur<strong>the</strong>r delays and pricing in <strong>the</strong> sale of Splash and<br />
fur<strong>the</strong>r devaluation of <strong>the</strong> Vietnam Dong.<br />
Outlook<br />
In spite of having <strong>the</strong> highest executable orderbook of<br />
RM5.7bn, <strong>Gamuda</strong> is not resting on its laurels. There are 4<br />
Middle East contracts which <strong>Gamuda</strong> is eyeing with a<br />
combined value of up to RM4bn. All are via open tender<br />
apart from one in Qatar which is on a restricted tender basis.<br />
On <strong>the</strong> local front, we understand <strong>Gamuda</strong> has already been<br />
prequalified for two infrastructure projects worth up to<br />
RM1bn.<br />
Its Vietnam property project in Hanoi, Yenso Park will have its<br />
maiden launch in May 2010 with sales of c. RM200m. Besides<br />
Yenso Park, <strong>Gamuda</strong> is also looking to sign a JV agreement<br />
with a Vietnamese party for a property project in Ho Chi<br />
Minh City (HCMC). In FY11, sales from Vietnam may<br />
potentially reach RM1bn once its HCMC project is launched.<br />
This is expected to fill <strong>the</strong> void from Splash.<br />
Sales Trend<br />
RM m<br />
4,000<br />
56.6%<br />
3,500<br />
46.6%<br />
3,000<br />
2,500<br />
36.6%<br />
2,000<br />
26.6%<br />
1,500<br />
16.6%<br />
1,000<br />
500<br />
6.6%<br />
0<br />
-3.4%<br />
2008A 2009A 2010F 2011F 2012F<br />
Total Revenue Revenue Growth (%) (YoY)<br />
Asset Trend<br />
RM m<br />
3,500<br />
3,000<br />
2,500<br />
2,000<br />
1,500<br />
1,000<br />
500<br />
2008A 2009A 2010F 2011F 2012F<br />
Net Fixed Assets (Tangible) Total Current Assets<br />
Profitability Trend<br />
RM m<br />
573<br />
523<br />
473<br />
423<br />
373<br />
323<br />
273<br />
223<br />
173<br />
2008A 2009A 2010F 2011F 2012F<br />
Operating EBIT Pre tax Profit Net Profit<br />
Margin Trends (%)<br />
20%<br />
18%<br />
16%<br />
14%<br />
12%<br />
10%<br />
8%<br />
6%<br />
4%<br />
2%<br />
0%<br />
2008A 2009A 2010F 2011F 2012F<br />
EBITDA Margin % EBIT Margin % Net Income Margin %<br />
Source: Company, <strong>DBS</strong> <strong>Vickers</strong><br />
Page 17
The Pulse of Asia Conference<br />
<strong>Gamuda</strong><br />
Leverage & Asset Turnover (x)<br />
Financials and Valuation<br />
0.7<br />
0.6<br />
0.5<br />
0.4<br />
0.3<br />
0.2<br />
0.1<br />
0.0<br />
2008A 2009A 2010F 2011F 2012F<br />
0.7<br />
0.7<br />
0.6<br />
0.6<br />
0.5<br />
0.5<br />
0.4<br />
We are expecting 3-year EPS CAGR of 30% driven by its<br />
RM5.7bn executable orderbook and revival in local property<br />
sales. Depending when <strong>the</strong> Sale of Splash materializes, <strong>the</strong>re<br />
could be an earnings gap in FY10-FY11. Splash contributes<br />
c.19% of <strong>Gamuda</strong>’s pretax profit for FY09. But in <strong>the</strong> longer<br />
term we expect <strong>the</strong> earnings void to be filled by earnings from<br />
Vietnam. Our current forecasts exclude any potential<br />
contribution from Vietnam.<br />
Financial Leverage (LHS)<br />
Asset Turnover (RHS)<br />
20.0%<br />
18.0%<br />
16.0%<br />
14.0%<br />
12.0%<br />
10.0%<br />
8.0%<br />
6.0%<br />
4.0%<br />
2.0%<br />
0.0%<br />
44.0<br />
39.0<br />
34.0<br />
29.0<br />
24.0<br />
19.0<br />
14.0<br />
ROE (%)<br />
2008A 2009A 2010F 2011F 2012F<br />
PE (x)<br />
<strong>Gamuda</strong>’s balance sheet continued to streng<strong>the</strong>n, with net<br />
gearing improving to 12% from 16% in 3QFY09, as payments<br />
continued to be prompt for its double tracking project.<br />
None<strong>the</strong>less, we continue to expect net gearing to rise to 0.4x<br />
in FY12F as it is due to draw down on its US$250m loan for<br />
Vietnam.<br />
Our SOP value for <strong>Gamuda</strong> is RM4.20/share. In terms of<br />
contribution to its SOP value/share of RM4.00, construction is<br />
<strong>the</strong> highest at RM2.15/share, followed by concessions at<br />
RM1.24/share, local and foreign property combined at<br />
RM0.81/share and <strong>Gamuda</strong> Water at RM0.26/share. We have<br />
already accounted for <strong>the</strong> sale of Splash which is at<br />
RM0.31/share.<br />
9.0<br />
2006 2007 2008 2009 2010<br />
3.8<br />
P/Book Value (x)<br />
3.3<br />
2.8<br />
2.3<br />
1.8<br />
1.3<br />
0.8<br />
2006 2007 2008 2009 2010<br />
Source: Company, <strong>DBS</strong> <strong>Vickers</strong><br />
Page 18
Income Statement (RM m) Balance Sheet (RM m)<br />
The Pulse of Asia Conference<br />
<strong>Gamuda</strong><br />
FY Jul 2009A 2010F 2011F 2012F FY Jul 2009A 2010F 2011F 2012F<br />
Turnover 2,727 3,075 4,350 4,214 Net Fixed Assets 364 440 512 580<br />
Cost of Goods Sold (2,465) (2,683) (3,672) (3,538) Invts in Associates & JVs 1,287 1,919 2,563 3,215<br />
Gross Profit 262 393 678 675 O<strong>the</strong>r LT Assets 948 948 948 948<br />
O<strong>the</strong>r Opng (Exp)/Inc (88) (103) (161) (154) Cash & ST Invts 1,255 1,066 1,141 1,201<br />
Operating Profit 174 289 517 522 Inventory 101 106 90 77<br />
O<strong>the</strong>r Non Opg (Exp)/Inc 0 0 0 0 Debtors 1,080 1,134 964 819<br />
Associates & JV Inc 143 133 143 152 O<strong>the</strong>r Current Assets 844 844 844 844<br />
Net Interest (Exp)/Inc (35) (32) (42) (53) Total Assets 5,878 6,457 7,061 7,683<br />
Exceptional Gain/(Loss) 0 0 0 0<br />
Pre-tax Profit 282 390 618 620 ST Debt 328 728 1,128 1,528<br />
Tax (78) (102) (161) (161) O<strong>the</strong>r Current Liab 1,099 1,134 1,025 933<br />
Minority Interest (10) (11) (11) (11) LT Debt 1,211 1,211 1,211 1,211<br />
Preference Dividend 0 0 0 0 O<strong>the</strong>r LT Liabilities 33 33 33 33<br />
Net Profit 194 278 446 448 Shareholder’s Equity 3,161 3,294 3,596 3,899<br />
Net Profit before Except. 194 278 446 448 Minority Interests 47 58 69 80<br />
EBITDA 192 314 545 554 Total Cap. & Liab. 5,878 6,457 7,061 7,683<br />
Sales Gth (%) 13.5 12.8 41.4 (3.1) Non-Cash Wkg. Capital 925 950 873 807<br />
EBITDA Gth (%) (39.4) 63.6 73.9 1.5 Net Cash/(Debt) (284) (873) (1,198) (1,538)<br />
Opg Profit Gth (%) (41.6) 66.6 78.7 0.9<br />
Net Profit Gth (%) (40.4) 43.6 60.5 0.3<br />
Effective Tax Rate (%) 27.6 26.0 26.0 26.0<br />
Cash Flow Statement (RM m)<br />
Rates & Ratio<br />
FY Jul 2009A 2010F 2011F 2012F FY Jul 2009A 2010F 2011F 2012F<br />
Pre-Tax Profit 282 390 618 620 Gross Margins (%) 9.6 12.8 15.6 16.0<br />
Dep. & Amort. 18 24 28 32 Opg Profit Margin (%) 6.4 9.4 11.9 12.4<br />
Tax Paid (106) (102) (161) (161) Net Profit Margin (%) 7.1 9.0 10.3 10.6<br />
Assoc. & JV Inc/(loss) (143) (133) (143) (152) ROAE (%) 6.2 8.6 13.0 11.9<br />
Chg in Wkg.Cap. 376 (24) 77 66 ROA (%) 3.3 4.5 6.6 6.1<br />
O<strong>the</strong>r Operating CF 183 (29) (31) (33) ROCE (%) 2.6 4.2 6.7 6.0<br />
Net Operating CF 609 127 388 372 Div Payout Ratio (%) 61.4 53.5 33.3 33.2<br />
Capital Exp.(net) (57) (100) (100) (100) Net Interest Cover (x) 5.0 9.1 12.2 9.8<br />
O<strong>the</strong>r Invts.(net) (81) 0 0 0 Asset Turnover (x) 0.5 0.5 0.6 0.6<br />
Invts in Assoc. & JV (21) (500) (500) (500) Debtors Turn (avg days) 160.6 131.4 88.0 77.2<br />
Div from Assoc & JV 0 0 0 0 Creditors Turn (avg days) 108.8 97.3 67.2 59.4<br />
O<strong>the</strong>r Investing CF 208 29 31 33 Inventory Turn (avg days) 15.8 14.2 9.8 8.7<br />
Net Investing CF 50 (571) (569) (567) Current Ratio (x) 2.3 1.7 1.4 1.2<br />
Div Paid (60) (145) (145) (145) Quick Ratio (x) 1.6 1.2 1.0 0.8<br />
Chg in Gross Debt (297) 400 400 400 Net Debt/Equity (X) 0.1 0.3 0.3 0.4<br />
Capital Issues 8 0 0 0 Net Debt/Equity ex MI (X) 0.1 0.3 0.3 0.4<br />
O<strong>the</strong>r Financing CF 79 0 0 0 Capex to Debt (%) 3.7 5.2 4.3 3.7<br />
Net Financing CF (270) 255 255 255 Z-Score (X) 2.2 2.6 2.4 2.4<br />
Net Cashflow 389 (189) 75 60 N. Cash/(Debt)PS (sen) (14.1) (43.4) (59.6) (76.5)<br />
Opg CFPS (sen) 11.6 7.5 15.5 15.2<br />
Free CFPS (sen) 27.5 1.3 14.3 13.5<br />
Quarterly / Interim Income Statement (RM m)<br />
Segmental Breakdown / Assumptions<br />
FY Jul 2Q2009 3Q2009 4Q2009 1Q2010 FY Jul 2009A 2010F 2011F 2012F<br />
Turnover 592 579 942 624 Revenues (RM m)<br />
Cost of Goods Sold (556) (540) (913) (576) Construction 2,220 2,681 3,852 3,763<br />
Gross Profit 35 40 29 48 Property development 407 290 390 343<br />
O<strong>the</strong>r Oper. (Exp)/Inc 8 9 16 7 Infrastructure 100 104 108 108<br />
Operating Profit 43 48 45 55<br />
O<strong>the</strong>r Non Opg (Exp)/Inc 0 0 0 0 Total 2,727 3,075 4,350 4,214<br />
Associates & JV Inc 35 29 44 39<br />
Net Interest (Exp)/Inc (11) (14) (9) (11) Pretax profit (RM m)<br />
Exceptional Gain/(Loss) 0 0 0 0 Construction 63 215 425 430<br />
Pre-tax Profit 67 63 80 83 Property development 84 87 109 102<br />
Tax (16) (14) (33) (17) Infrastructure 180 159 168 176<br />
Minority Interest (2) (2) (4) (3) O<strong>the</strong>rs (45) (71) (84) (87)<br />
Net Profit 49 46 43 63<br />
Net profit bef Except. 49 46 43 63 Total 282 390 618 620<br />
Pretax profit Margins (%)<br />
Sales Gth (%) (3.6) (2.1) 62.6 (33.8) Construction 2.8 8.0 11.0 11.4<br />
Opg Profit Gth (%) (10.5) 11.7 (7.0) 24.2 Property development 20.7 30.1 28.0 29.8<br />
Net Profit Gth (%) (10.9) (5.6) (6.5) 45.6<br />
Gross Margins (%) 6.0 6.8 3.1 7.7 Total 10.3 12.7 14.2 14.7<br />
Opg Profit Margins (%) 7.3 8.3 4.7 8.9<br />
Net Profit Margins (%) 8.3 8.0 4.6 10.1 Key Assumptions<br />
Construction orderbook N/A 1,623.0 2,500.0 3,000.0<br />
Source: Company, <strong>DBS</strong> <strong>Vickers</strong><br />
Page 19
The Pulse of Asia Conference<br />
<strong>DBS</strong>V recommendations are based an Absolute Total Return* Rating system, defined as follows:<br />
STRONG BUY (>20% total return over <strong>the</strong> next 3 months, with identifiable share price catalysts within this time frame)<br />
BUY (>15% total return over <strong>the</strong> next 12 months for small caps, >10% for large caps)<br />
HOLD (0-15% total return over <strong>the</strong> next 12 months for small caps, 0-10% for large caps)<br />
FULLY VALUED (negative total return i.e. > -10% over <strong>the</strong> next 12 months)<br />
SELL (negative total return of > -20% over <strong>the</strong> next 3 months, with identifiable catalysts within this time frame)<br />
Share price appreciation + dividends<br />
GENERAL DISCLOSURE/DISCLAIMER<br />
This document is published by <strong>DBS</strong> <strong>Vickers</strong> <strong>Research</strong> (Singapore) Pte Ltd ("<strong>DBS</strong>VR"), a direct wholly-owned subsidiary of <strong>DBS</strong> <strong>Vickers</strong><br />
<strong>Securities</strong> (Singapore) Pte Ltd ("<strong>DBS</strong>VS") and an indirect wholly-owned subsidiary of <strong>DBS</strong> <strong>Vickers</strong> <strong>Securities</strong> Holdings Pte Ltd ("<strong>DBS</strong>VH").<br />
[This report is intended for clients of <strong>DBS</strong>V Group only and no part of this document may be (i) copied, photocopied or duplicated in any<br />
form by any means or (ii) redistributed without <strong>the</strong> prior written consent of <strong>DBS</strong>VR.]<br />
The research is based on information obtained from sources believed to be reliable, but we do not make any representation or warranty as<br />
to its accuracy, completeness or correctness. Opinions expressed are subject to change without notice. This document is prepared for<br />
general circulation. Any recommendation contained in this document does not have regard to <strong>the</strong> specific investment objectives, financial<br />
situation and <strong>the</strong> particular needs of any specific addressee. This document is for <strong>the</strong> information of addressees only and is not to be taken<br />
in substitution for <strong>the</strong> exercise of judgement by addressees, who should obtain separate legal or financial advice. <strong>DBS</strong>VR accepts no liability<br />
whatsoever for any direct or consequential loss arising from any use of this document or fur<strong>the</strong>r communication given in relation to this<br />
document. This document is not to be construed as an offer or a solicitation of an offer to buy or sell any securities. <strong>DBS</strong>VH is a whollyowned<br />
subsidiary of <strong>DBS</strong> Bank Ltd. <strong>DBS</strong> Bank Ltd along with its affiliates and/or persons associated with any of <strong>the</strong>m may from time to<br />
time have interests in <strong>the</strong> securities mentioned in this document. <strong>DBS</strong>VR, <strong>DBS</strong>VS, <strong>DBS</strong> Bank Ltd and <strong>the</strong>ir associates, <strong>the</strong>ir directors, and/or<br />
employees may have positions in, and may effect transactions in securities mentioned herein and may also perform or seek to perform<br />
broking, investment banking and o<strong>the</strong>r banking services for <strong>the</strong>se companies.<br />
The assumptions for commodities in this report are for <strong>the</strong> purpose of forecasting earnings of <strong>the</strong> companies mentioned herein. They are<br />
not to be construed as recommendations to trade in <strong>the</strong> physical commodities or in futures contracts relating to <strong>the</strong> commodities<br />
mentioned in this report.<br />
<strong>DBS</strong>VUSA does not have its own investment banking or research department, nor has it participated in any investment banking transaction<br />
as a manager or co-manager in <strong>the</strong> past twelve months. Any US persons wishing to obtain fur<strong>the</strong>r information, including any clarification<br />
on disclosures in this disclaimer, or to effect a transaction in any security discussed in this document should contact <strong>DBS</strong>VUSA exclusively.<br />
ANALYST CERTIFICATION<br />
The research analyst primarily responsible for <strong>the</strong> content of this research report, in part or in whole, certifies that <strong>the</strong> views about <strong>the</strong><br />
companies and <strong>the</strong>ir securities expressed in this report accurately reflect his/her personal views. The analyst also certifies that no part of<br />
his/her compensation was, is, or will be, directly, or indirectly, related to specific recommendations or views expressed in this report. As of<br />
11 Jan 2010, <strong>the</strong> analyst and his / her spouse and/or relatives who are financially dependent on <strong>the</strong> analyst, do not hold interests in <strong>the</strong><br />
securities recommended in this report (“interest” includes direct or indirect ownership of securities, directorships and trustee positions).<br />
COMPANY-SPECIFIC / REGULATORY DISCLOSURES<br />
1. <strong>DBS</strong> <strong>Vickers</strong> <strong>Securities</strong> (Singapore) Pte Ltd and its subsidiaries do not have a proprietary position in <strong>the</strong> mentioned<br />
company as of 7 Jan 2010<br />
PT. <strong>DBS</strong> <strong>Vickers</strong> <strong>Securities</strong> Indonesia ("<strong>DBS</strong>VI") have a proprietary position in Indofood Sukses Makmur, recommended in<br />
this report as of 11 January 2010.<br />
2. <strong>DBS</strong>VR, <strong>DBS</strong>VS, <strong>DBS</strong> Bank Ltd and/or o<strong>the</strong>r affiliates of <strong>DBS</strong> <strong>Vickers</strong> <strong>Securities</strong> (USA) Inc ("<strong>DBS</strong>VUSA"), a U.S.-registered<br />
broker-dealer, may beneficially own a total of 1% or more of any class of common equity securities of <strong>the</strong> mentioned<br />
company as of 11 Jan .<br />
3. Compensation for investment banking services:<br />
(1) <strong>DBS</strong>VR, <strong>DBS</strong>VS, <strong>DBS</strong> Bank Ltd and/or o<strong>the</strong>r affiliates of <strong>DBS</strong>VUSA may have received compensation, within <strong>the</strong> past<br />
12 months, and within <strong>the</strong> next 3 months receive or intends to seek compensation for investment banking services<br />
from <strong>the</strong> mentioned company.<br />
(2) <strong>DBS</strong>VUSA does not have its own investment banking or research department, nor has it participated in any<br />
investment banking transaction as a manager or co-manager in <strong>the</strong> past twelve months. Any US persons wishing to<br />
obtain fur<strong>the</strong>r information, including any clarification on disclosures in this disclaimer, or to effect a transaction in<br />
any security discussed in this document should contact <strong>DBS</strong>VUSA exclusively.
The Pulse of Asia Conference<br />
RESTRICTIONS ON DISTRIBUTION<br />
General<br />
This report is not directed to, or intended for distribution to or use by, any person or entity who is a citizen or<br />
resident of or located in any locality, state, country or o<strong>the</strong>r jurisdiction where such distribution, publication,<br />
availability or use would be contrary to law or regulation.<br />
Australia<br />
Hong Kong<br />
Singapore<br />
United Kingdom<br />
Dubai/<br />
United Arab Emirates<br />
United States<br />
O<strong>the</strong>r jurisdictions<br />
This report is being distributed in Australia by <strong>DBS</strong>VR and <strong>DBS</strong>VS, which are exempted from <strong>the</strong> requirement to<br />
hold an Australian financial services licence under <strong>the</strong> Corporation Act 2001 [“CA] in respect of financial services<br />
provided to <strong>the</strong> recipients. <strong>DBS</strong>VR and <strong>DBS</strong>VS are regulated by <strong>the</strong> Monetary Authority of Singapore [“MAS”]<br />
under <strong>the</strong> laws of Singapore, which differ from Australian laws. Distribution of this report is intended only for<br />
“wholesale investors” within <strong>the</strong> meaning of <strong>the</strong> CA.<br />
This report is being distributed in Hong Kong by <strong>DBS</strong> <strong>Vickers</strong> (Hong Kong) Limited which is licensed and<br />
regulated by <strong>the</strong> Hong Kong <strong>Securities</strong> and Futures Commission.<br />
This report is being distributed in Singapore by <strong>DBS</strong>VR, which holds a Financial Adviser’s licence and is regulated<br />
by <strong>the</strong> MAS. This report may additionally be distributed in Singapore by <strong>DBS</strong>VS (Company Regn. No.<br />
198600294G), which is an Exempt Financial Adviser as defined under <strong>the</strong> Financial Advisers Act. Any research<br />
report produced by a foreign <strong>DBS</strong> <strong>Vickers</strong> entity, analyst or affiliate is distributed in Singapore only to<br />
“Institutional Investors”, “Expert Investors” or “Accredited Investors” as defined in <strong>the</strong> <strong>Securities</strong> and Futures<br />
Act, Chap. 289 of Singapore. Any distribution of research reports published by a foreign-related corporation of<br />
<strong>DBS</strong>VR/<strong>DBS</strong>VS to “Accredited Investors” is provided pursuant to <strong>the</strong> approval by MAS of research distribution<br />
arrangements under Paragraph 11 of <strong>the</strong> First Schedule to <strong>the</strong> FAA.<br />
This report is being distributed in <strong>the</strong> UK by <strong>DBS</strong> <strong>Vickers</strong> <strong>Securities</strong> (UK) Ltd, who is an authorised person in <strong>the</strong><br />
meaning of <strong>the</strong> Financial Services and Markets Act and is regulated by The Financial Services Authority. <strong>Research</strong><br />
distributed in <strong>the</strong> UK is intended only for institutional clients.<br />
This report is being distributed in Dubai/United Arab Emirates by <strong>DBS</strong> Bank Ltd, Dubai (PO Box 506538, 3 rd Floor,<br />
Building 3, Gate Precinct, DIFC, Dubai, United Arab Emirates) and is intended only for clients who meet <strong>the</strong><br />
DFSA regulatory criteria to be a Professional Client. It should not be relied upon by or distributed to Retail<br />
Clients. <strong>DBS</strong> Bank Ltd, Dubai is regulated by <strong>the</strong> Dubai Financial Services Authority.<br />
Nei<strong>the</strong>r this report nor any copy hereof may be taken or distributed into <strong>the</strong> United States or to any U.S. person<br />
except in compliance with any applicable U.S. laws and regulations.<br />
In any o<strong>the</strong>r jurisdictions, except if o<strong>the</strong>rwise restricted by laws or regulations, this report is intended only for<br />
qualified, professional, institutional or sophisticated investors as defined in <strong>the</strong> laws and regulations of such<br />
jurisdictions.<br />
<strong>DBS</strong> <strong>Vickers</strong> <strong>Research</strong> (Singapore) Pte Ltd – 8 Cross Street, #02-01 PWC Building, Singapore 048424<br />
Tel. 65-6533 9688, Fax: 65-6226 8048<br />
Company Regn. No. 198600295W


