Worldwatch Institute
Worldwatch Institute
Worldwatch Institute

You also want an ePaper? Increase the reach of your titles
YUMPU automatically turns print PDFs into web optimized ePapers that Google loves.
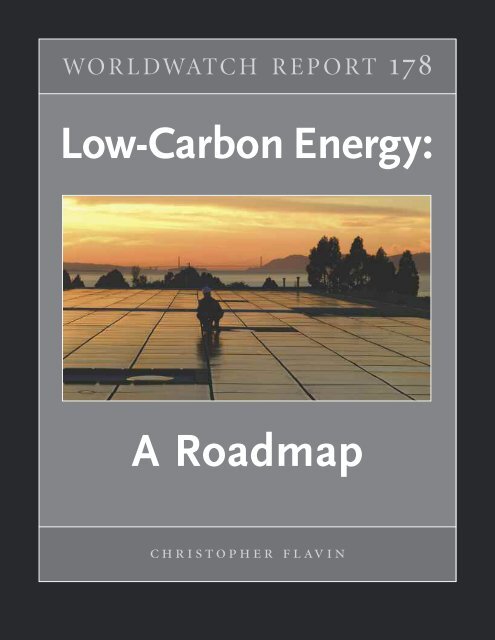
WO R L DWATC H R E P O RT 178<br />
Low-Carbon Energy:<br />
A Roadmap<br />
c h r i s t o p h e r f l av i n
WO R L D WAT C H R E P O R T 178<br />
Low-Carbon Energy:<br />
A Roadmap<br />
C H R I S T O P H E R F L AV I N<br />
l i s a m a s t n y, e d i t o r<br />
a m a n d a c h i u , r e s e a r c h e r<br />
wo r l d wat c h i n s t i t u t e , wa s h i n g t o n , d c
© <strong>Worldwatch</strong> <strong>Institute</strong>, 2008<br />
ISBN 978-1-878071-87-3<br />
Printed on paper that is 50 percent recycled, 30 percent<br />
post-consumer waste, process chlorine free.<br />
The views expressed are those of the author and do not necessarily<br />
represent those of the <strong>Worldwatch</strong> <strong>Institute</strong>; of its directors, officers, or staff;<br />
or of its funding organizations.<br />
On the cover: Solar roof in San Francisco, California.<br />
Photograph ©NREL<br />
Reprint and copyright information for one-time academic use of this material is available<br />
by contacting Customer Service, Copyright Clearance Center, at +1 978-750-8400 (phone) or<br />
+1 978-750-4744 (fax), or by writing to CCC, 222 Rosewood Drive, Danvers, MA 01923, USA.<br />
Nonacademic and commercial users should contact the <strong>Worldwatch</strong> <strong>Institute</strong>’s Business<br />
Development Department by fax at +1 202-296-7365 or by email at wwpub@worldwatch.org.
Table of Contents<br />
Summary . . . . . . . . . . . . . . . . . . . . . . . . . . . . . . . . . . . . . . . . . . . . . . . . . . . . . . . . . . . . . . . . . 5<br />
The Road to Low-Carbon Energy . . . . . . . . . . . . . . . . . . . . . . . . . . . . . . . . . . . . . . . . . . . . . . 6<br />
Avoiding Catastrophe . . . . . . . . . . . . . . . . . . . . . . . . . . . . . . . . . . . . . . . . . . . . . . . . . . . . . . . 8<br />
A Convenient Truth . . . . . . . . . . . . . . . . . . . . . . . . . . . . . . . . . . . . . . . . . . . . . . . . . . . . . . . . . 13<br />
No-Carbon Energy . . . . . . . . . . . . . . . . . . . . . . . . . . . . . . . . . . . . . . . . . . . . . . . . . . . . . . . . . 18<br />
Designing a New Energy System . . . . . . . . . . . . . . . . . . . . . . . . . . . . . . . . . . . . . . . . . . . . . 23<br />
Jumpstarting a Revolution . . . . . . . . . . . . . . . . . . . . . . . . . . . . . . . . . . . . . . . . . . . . . . . . . . 29<br />
Endnotes . . . . . . . . . . . . . . . . . . . . . . . . . . . . . . . . . . . . . . . . . . . . . . . . . . . . . . . . . . . . . . . . . 37<br />
Index . . . . . . . . . . . . . . . . . . . . . . . . . . . . . . . . . . . . . . . . . . . . . . . . . . . . . . . . . . . . . . . . . . . . 45<br />
Figures, Tables, and Sidebars<br />
Figure 1. Atmospheric Concentration of Carbon Dioxide, 1744–2007 . . . . . . . . . . . . . . . . . 8<br />
Figure 2. Average Annual Growth Rates by Energy Source, 2002–07 . . . . . . . . . . . . . . . . . 18<br />
Figure 3. Cost of Electricity Generation by Source . . . . . . . . . . . . . . . . . . . . . . . . . . . . . . . . 20<br />
Figure 4. Estimates of Available Energy Resources Using Today’s Technology . . . . . . . . . 21<br />
Figure 5. U.S. Electricity Generation by Source, 2007 and Two Scenarios for 2030 . . . . . 27<br />
Figure 6. Annual Investment in New Renewable Energy Capacity, 1995–2007 . . . . . . . . . 30<br />
Figure 7. Electricity Use Per Capita in California and Rest of United States, 1960–2007 . 33<br />
Table 1. Global Energy Use and Carbon Dioxide Emissions, 2007<br />
and Two Scenarios for 2050 . . . . . . . . . . . . . . . . . . . . . . . . . . . . . . . . . . . . . . . . . . . . . . 10<br />
Table 2. Energy-Related Carbon Dioxide Emissions, Selected Countries, 1990 and 2007 . 11<br />
Table 3. Estimates of Potential Contribution of Renewable Energy Resources . . . . . . . . . 22<br />
Table 4. Estimated Employment in the Renewable Energy Sector, 2006 . . . . . . . . . . . . . . 34<br />
Sidebar 1. What About Nuclear Power . . . . . . . . . . . . . . . . . . . . . . . . . . . . . . . . . . . . . . . . 19
Acknowledgments<br />
The author has consulted with and benefited from many pioneering experts in the field,<br />
including Denise Bode, James Dehlsen, Reid Detchon, Mike Eckhardt, Robert Hefner, Suzanne<br />
Hunt, Daniel Kammen, Li Junfeng, Amory Lovins, Eric Martinot, Aubrey McClendon, William<br />
Moomaw, Fred Morse, Richard Munson, Dan Reicher, Joseph Romm, Janet Sawin, Hermann<br />
Scheer, Randy Swisher, and Izaak van Melle.<br />
Many thanks to Stanford MAP Fellows Amanda Chiu and James Russell who provided<br />
extensive and skilled research for this report, and to Kimberly Rogovin who provided additional<br />
research on green buildings and tracked down the photos that appear throughout. Special<br />
thanks also to <strong>Worldwatch</strong> Senior Researcher Janet Sawin and to William Moomaw of the<br />
Fletcher School of Law and Diplomacy for their valuable insights and careful review of the<br />
report and for the material adapted from their chapter, "An Enduring Energy Future," in State<br />
of the World 2009. Deep thanks as well to Senior Editor Lisa Mastny for her masterful editing<br />
of the report and management of the production process.<br />
Support for this project came from the American Clean Skies Foundation, Casten Family<br />
Foundation, Richard and Rhoda Goldman Fund, Steven C. Leuthold Family Foundation,<br />
Shared Earth Foundation, Shenandoah Foundation, Flora L. Thornton Foundation, Wallace<br />
Genetic Foundation, Inc., Johanette Wallerstein <strong>Institute</strong>, and Winslow Foundation.<br />
About the Author<br />
Christopher Flavin is president of the <strong>Worldwatch</strong> <strong>Institute</strong>, a Washington, D.C.-based international<br />
research organization focused on natural resource and environmental issues. Chris is<br />
a leading voice on the potential for new energy technologies and strategies to replace fossil<br />
fuels, increasing energy security and avoiding dangerous climate change. He is co-author of<br />
three books on energy, including Power Surge: Guide to the Coming Energy Revolution, which<br />
anticipated many of the changes now under way in world energy markets. Chris is a founding<br />
member of the Board of Directors of the Business Council for Sustainable Energy and serves<br />
as a board member of the Climate <strong>Institute</strong>. He is on the Advisory Boards of the American<br />
Council on Renewable Energy and the Environmental and Energy Study <strong>Institute</strong>.<br />
Chris has participated in several historic international conferences, including the Earth<br />
Summit in Rio de Janeiro in 1992 and the Climate Change Conference in Kyoto, Japan, in<br />
1997. He speaks frequently to business, university, and policy audiences. He also testifies<br />
before national and state legislatures and meets frequently with government and international<br />
leaders. Chris is a native of Monterey, California, and a cum laude graduate of Williams College,<br />
where he studied economics, biology, and environmental studies.<br />
4<br />
L O W - C A R B O N E N E R G Y : A R O A D M A P w w w . w o r l d w a t c h . o r g
Summary<br />
Technologies available today, and those<br />
expected to become competitive over<br />
the next decade, will permit a rapid<br />
decarbonization of the global energy<br />
economy. New renewable energy technologies,<br />
combined with a broad suite of energy-efficiency<br />
advances, will allow global energy needs<br />
to be met without fossil fuels and by adding<br />
only minimally to the cost of energy services.<br />
The world is now in the early stages of an<br />
energy revolution that over the next few decades<br />
could be as momentous as the emergence of oiland<br />
electricity-based economies a century ago.<br />
Double-digit market growth, annual capital<br />
flows of more than $100 billion, sharp declines<br />
in technology costs, and rapid progress in the<br />
sophistication and effectiveness of government<br />
policies all herald a promising new energy era.<br />
Advanced automotive, electronics, and<br />
buildings systems will allow a substantial<br />
reduction in carbon dioxide (CO 2 ) emissions,<br />
at negative costs once the savings in energy<br />
bills is accounted for. The savings from these<br />
measures can effectively pay for a significant<br />
portion of the additional cost of advanced<br />
renewable energy technologies to replace<br />
fossil fuels, including wind, solar, geothermal,<br />
and bioenergy.<br />
Resource estimates indicate that renewable<br />
energy is more abundant than all of the fossil<br />
fuels combined, and that well before mid-century<br />
it will be possible to run most national<br />
electricity systems with minimal fossil fuels<br />
and only 10 percent of the carbon emissions<br />
they produce today. The development of smart<br />
electricity grids, the integration of plug-in<br />
electric vehicles, and the addition of limited<br />
storage capacity will allow power to be provided<br />
without the baseload plants that are the<br />
foundation of today’s electricity systems.<br />
Recent climate simulations conclude that<br />
CO 2 emissions will need to peak within the<br />
next decade and decline by at least 50 to 80<br />
percent by 2050. This challenge will be greatly<br />
complicated by the fact that China, India, and<br />
other developing countries are now rapidly<br />
developing modern energy systems.<br />
The only chance of slowing the buildup of<br />
CO 2 concentrations soon enough to avoid catastrophic<br />
climate change that could take centuries<br />
to reverse is to transform the energy<br />
economies of industrial and developing countries<br />
almost simultaneously. This would have<br />
seemed nearly impossible a few years ago, but<br />
since then, the energy policies and markets of<br />
China and India have begun to change rapidly—more<br />
rapidly than those in many industrial<br />
countries. Renewable and efficiency<br />
technologies will allow developing countries to<br />
increase their reliance on indigenous resources<br />
and reduce their dependence on expensive and<br />
unstable imported fuels.<br />
Around the world, new energy systems<br />
could become a huge engine of industrial<br />
development and job creation, opening vast<br />
new economic opportunities. Developing<br />
countries have the potential to “leapfrog” the<br />
carbon-intensive development path of the 20th<br />
century and go straight to the advanced energy<br />
systems that are possible today.<br />
Improved technology and high energy<br />
prices have created an extraordinarily favorable<br />
market for new energy systems over the past<br />
few years. But reaching a true economic tipping<br />
point will require innovative public policies<br />
and strong political leadership.<br />
w w w . w o r l d w a t c h . o r g L O W - C A R B O N E N E R G Y : A R O A D M A P 5
The Road to<br />
Low-Carbon Energy<br />
Speaking in Washington on June 23,<br />
2008, James Hansen, the top climate<br />
scientist at the U.S. National Aeronautics<br />
and Space Administration,<br />
had a sharp warning for policymakers: “If we<br />
don’t begin to reduce greenhouse gas emissions<br />
in the next several years, and get on a<br />
very different course, then we are in trouble....<br />
This is the last chance.” 1 *<br />
After two decades of halting and largely<br />
ineffectual efforts to address the world’s climate<br />
crisis, humanity has reached a moment of<br />
truth. As scientific alarm about the probability<br />
and catastrophic consequences of climate<br />
change has grown in recent years, annual fossil<br />
fuel emissions of the most important greenhouse<br />
gas, carbon dioxide, have soared 35 percent<br />
above their 1990 rates. 2 And because we<br />
have waited so long and must now cope with<br />
skyrocketing emissions in China and other<br />
developing countries, the reduction in emissions<br />
will need to be steeper, and the challenge<br />
to societies and economies that much greater.<br />
Stabilizing the climate will require changes<br />
in many sectors of the economy, including<br />
agriculture and forestry. But fossil fuels are<br />
the largest part of the problem, and reducing<br />
their dominance of the global energy system is<br />
the key to climate stability. Leading scientists<br />
have concluded that carbon dioxide emissions<br />
from fossil fuels will have to be cut at least 50<br />
to 80 percent below current levels by 2050—<br />
and possibly to zero—in order to prevent<br />
potentially catastrophic rates of climate<br />
change. 3 And they will have to continue falling<br />
beyond that date.<br />
*Endnotes are grouped by section and begin on page 37.<br />
To call these targets ambitious is to understate<br />
the challenge. Carbon-based fossil fuels<br />
made the modern economy and all of its<br />
material accomplishments possible. Powering<br />
the global economy without those fuels will<br />
require restructuring the energy industry<br />
through technological, economic, and policy<br />
innovations that are as all-encompassing as<br />
the climate change they must address. A<br />
large-scale shift to carbon-free sources of<br />
energy is the essential centerpiece of such a<br />
transformation, together with major advances<br />
in energy efficiency.<br />
The question of whether such a transition is<br />
possible is one of the most complex and hotly<br />
debated issues of our time. Many experts, particularly<br />
those employed by today’s energy<br />
industries, believe that fossil fuels must remain<br />
dominant for decades to come, and that the<br />
only viable energy strategy relies on even more<br />
massive use of coal, coupled with development<br />
of a vast system to capture and store the resulting<br />
carbon dioxide. But since the 1970s, a small<br />
but growing tribe of energy dissidents has<br />
argued that there is another option: that the<br />
solution to our carbon problem is not at the<br />
“end-of-the-pipe” but in an entirely new<br />
energy system. Today, such a transition appears<br />
more feasible—and more imminent—than<br />
ever before.<br />
The technologies that are available today, or<br />
are projected to become available over the next<br />
two decades, will allow a rapid shift in the mix<br />
of energy sources on which the world<br />
depends—and equally dramatic changes in the<br />
systems for transporting, storing, and using<br />
that energy. Solar, wind, geothermal, and biological<br />
resources each have the potential to<br />
6<br />
w w w . w o r l d w a t c h . o r g L O W - C A R B O N E N E R G Y : A R O A D M A P
The Road to Low-Carbon Energy<br />
supply vast quantities of energy that can be<br />
converted to electricity and liquid and gaseous<br />
fuels, as well as used to supply heat directly to<br />
buildings and industry. But new technologies<br />
will need to be complemented by major<br />
changes in the world’s energy infrastructure<br />
and by far more efficient use of energy than<br />
ever before.<br />
At a time when genes can be engineered and<br />
spacecraft sent to Mars, shifting to a new<br />
energy system is hardly an impossible task. But<br />
it will require mobilizing substantial resources,<br />
which in turn will depend on major policy<br />
changes that overcome the decades of subsidies<br />
and structural impediments that prop up the<br />
current energy system. Nor will it be inexpensive,<br />
likely costing several trillion dollars by the<br />
time the transition is complete. 4 * While most<br />
of that investment will come from funds that<br />
otherwise would have gone to additional development<br />
of fossil fuels, upfront costs will be<br />
greater and the price of energy may be somewhat<br />
higher in the short term. But if a new<br />
commitment to renewable sources of energy is<br />
accompanied by a matching commitment to<br />
improved efficiency, energy needs will be<br />
smaller and the bills paid by individuals and<br />
businesses could well be lower than they would<br />
be if we remained addicted to fossil fuels.<br />
To many people, such a transformation<br />
remains unimaginable. For nearly a century—<br />
since the times of Thomas Edison and Henry<br />
Ford—energy has been a relatively static business,<br />
characterized by slow, incremental<br />
change, limited competition, and some of the<br />
lowest rates of research and development of<br />
any major industry. But that is now changing.<br />
Concern about climate change and rising<br />
energy prices have sparked a nascent transformation<br />
of the energy business, with engineers,<br />
entrepreneurs, and investors who would have<br />
been focused on the Internet and biotechnology<br />
a decade ago now focused on energy. Their<br />
skills, energy, and commitment to solving one<br />
of the world’s greatest problems is likely to<br />
prove as revolutionary as their great-grandparents’<br />
work to build a carbon-based economy a<br />
century ago.<br />
Rebuilding the global energy system will be<br />
expensive, but it can also be transformative.<br />
And its sheer scale would create thousands of<br />
new businesses and millions of jobs for<br />
decades to come. At a time of serious economic<br />
troubles, volatile oil prices, and instability<br />
in many fossil fuel producing regions,<br />
building an efficient, low-carbon energy system<br />
can become an engine of economic recovery,<br />
job creation, and international<br />
cooperation. Climate change, energy security,<br />
and economic development should be viewed,<br />
in the words of Common Cause founder John<br />
Gardner, as “breathtaking opportunities disguised<br />
as insoluble problems.” 5<br />
Darling National<br />
Wind Farm in Cape<br />
Town, South Africa.<br />
© Warrensk (Flickr Creative<br />
Commons)<br />
*All dollar amounts are expressed in U.S. dollars unless<br />
indicated otherwise.<br />
w w w . w o r l d w a t c h . o r g L O W - C A R B O N E N E R G Y : A R O A D M A P 7
Avoiding Catastrophe<br />
Carbon Dioxide (ppm)<br />
400.0<br />
367.5<br />
335.0<br />
302.5<br />
Over the past half-million years,<br />
the world’s climate has seen four<br />
ice ages and four warm periods<br />
separating them. Over that vast<br />
sweep of time, extensive glaciers have engulfed<br />
large swaths of North America, Europe, and<br />
Asia and then retreated; thousands of species<br />
were displaced, and the shapes of coastlines<br />
were rearranged as sea levels rose and fell. Yet<br />
throughout these hundreds of thousands of<br />
years, the atmospheric concentration of carbon<br />
dioxide (CO 2 ), which plays a key role in<br />
regulating the climate, has never risen above<br />
300 parts per million. 1<br />
In 2007, the atmospheric concentration of<br />
CO 2 passed 384 parts per million (see Figure<br />
1), and it is already at the equivalent of 430<br />
parts per million if the effect of other greenhouse<br />
gases is included. 2 Humanity is at risk of<br />
Figure 1. Atmospheric Concentration of Carbon Dioxide,<br />
1744–2007<br />
Ice core<br />
measurements<br />
Source: NOAA, ORNL<br />
Atmospheric<br />
measurements<br />
270.0<br />
1740 1770 1800 1830 1860 1890 1920 1950 1980 2010<br />
creating a climate unlike any it has seen before,<br />
unfolding at an unnatural, accelerated pace—<br />
more dramatic than any changes in the climate<br />
since Earth was last struck by a large asteroid<br />
nearly a million years ago. Unless greenhouse<br />
gas emissions begin to decline within the next<br />
decade, we risk triggering a runaway disruption<br />
of the world’s climate—one that could last<br />
centuries and that our descendants would be<br />
powerless to stop.<br />
Only recently have scientists understood<br />
that changes in the concentration of CO 2 ,<br />
methane, and other less common greenhouse<br />
gases could trigger an ecological catastrophe of<br />
staggering proportions. The climate, it turns<br />
out, is not the vast, implacable system it<br />
appears to be.<br />
Past climate changes have been caused by<br />
tiny alterations in the Earth’s orbit and orientation<br />
to the sun—providing, for example, just<br />
enough added energy to warm the planet over<br />
thousands of years, increasing the concentration<br />
of CO 2 in the atmosphere, and in turn<br />
triggering even larger changes in the temperature,<br />
which scientists call a positive feedback.<br />
Today’s massive release of CO 2 and other<br />
greenhouse gases is leading to far greater<br />
changes to the atmosphere in a period of<br />
decades. 3 According to scientist James Hansen,<br />
“More warming is already in the pipeline,<br />
delayed only by the great inertia of the world’s<br />
oceans. And the climate is nearing dangerous<br />
tipping points. Elements of a perfect storm, a<br />
global cataclysm, are now assembled.” 4<br />
Scientists project that in the decades immediately<br />
ahead, the capacity of the Earth and its<br />
oceans to absorb carbon emissions will decline,<br />
while vast changes in the world’s ecosystems<br />
8<br />
w w w . w o r l d w a t c h . o r g L O W - C A R B O N E N E R G Y : A R O A D M A P
Avoiding Catastrophe<br />
Sea ice clogs the gap<br />
between iceberg B-<br />
15A, right, and B-15J,<br />
left, on October 21,<br />
2003. B15 was the<br />
world’s largest<br />
recorded iceberg<br />
until it broke up<br />
after calving from<br />
Antarctica's Ross Ice<br />
Shelf in March 2000.<br />
Brien Barnett, National Science<br />
Foundation<br />
may further accelerate warming. Recent studies<br />
show that frozen soils in the Arctic contain vast<br />
quantities of carbon—60 percent more than<br />
was previously estimated and equivalent to<br />
one-sixth of the carbon now in the atmosphere.<br />
5 Melting tundra could release millions<br />
of tons of carbon dioxide as well as methane—<br />
a greenhouse gas 25 times more powerful than<br />
CO 2 —causing additional warming. 6 *<br />
Another tipping point may lie in the Arctic<br />
Ocean, where the year-round ice cap has been<br />
shrinking dramatically and unexpectedly in<br />
recent years, and may disappear entirely in the<br />
summer months within the next decade. This<br />
will cause an enormous change in the Earth’s<br />
energy balance, with more of the sun’s light<br />
and heat being absorbed, raising temperatures<br />
further in the northern hemisphere. 7 This<br />
could mean the end of the million-year-old<br />
Greenland ice sheet, which by itself contains<br />
enough water to raise worldwide sea levels by<br />
more than seven meters. 8<br />
Exactly when the world will reach such a<br />
tipping point—or whether it already has—is<br />
*Units of measure throughout this report are metric<br />
unless common usage dictates otherwise.<br />
not known. But it is clear that ecological<br />
change of this magnitude would lead to<br />
unprecedented disruptions to the world’s<br />
economies. A groundbreaking 2006 study led<br />
by former World Bank chief economist<br />
Nicholas Stern concluded that climate change<br />
could cut global economic output by between<br />
5 and 20 percent. 9 And in his 2007 book, The<br />
Age of Turbulence, Alan Greenspan, the leading<br />
free-market economist of the day, included climate<br />
change as one of five forces that could<br />
derail the U.S. economy in the 21st century. 10<br />
The uneven and disruptive nature of these<br />
changes could set off additional crises as conflict<br />
both within and between societies undermines<br />
their stability.<br />
In 2007, the combustion of fossil fuels<br />
released nearly 30 billion tons of carbon dioxide<br />
to the atmosphere—more than a million<br />
tons every hour—with coal and oil contributing<br />
roughly 40 percent each and natural gas<br />
accounting for the rest. 11 The manufacture of<br />
cement released nearly another 350 million<br />
tons, while deforestation and agriculture combined<br />
contributed roughly 1.6 billion tons. 12<br />
Annual fossil-fuel carbon emissions have<br />
increased fivefold since 1950 and the rate of<br />
w w w . w o r l d w a t c h . o r g L O W - C A R B O N E N E R G Y : A R O A D M A P 9
Avoiding Catastrophe<br />
increase has actually accelerated since 2002. 13<br />
Today, fossil fuels provide four-fifths of the<br />
energy that powers the global economy. 14<br />
Burning fossil fuels on this scale is a vast<br />
and risky experiment with the Earth’s biosphere.<br />
The United Nations Framework Convention<br />
on Climate Change, adopted in 1992,<br />
commits nations around the globe to preventing<br />
dangerous climate change. Precisely identifying<br />
that point is difficult, but the 2007 report<br />
of the Intergovernmental Panel on Climate<br />
Change (IPCC) as well as more recent assessments<br />
by James Hansen and W.L. Hare of the<br />
Potsdam <strong>Institute</strong> suggest that the increase in<br />
the global temperature must not exceed 1.5 to<br />
2 degrees Celsius above pre-industrial levels. 15<br />
(The increase so far is just under 0.8 degrees<br />
Celsius, with some additional increase locked<br />
in as the greenhouse gases already in the<br />
atmosphere have their full impact. 16 ) This<br />
requires preventing the atmospheric concentration<br />
of CO 2 from exceeding 450 parts per<br />
million and a long-run goal of returning the<br />
concentration to 350 ppm—below the current<br />
level. 17<br />
The bottom line is clear: to keep the world’s<br />
climate within the range it has occupied for at<br />
Table 1. Global Energy Use and Carbon Dioxide Emissions, 2007<br />
and Two Scenarios for 2050<br />
2050 2050<br />
Business Stabilization<br />
Indicator 2007 as Usual Scenario<br />
CO 2 concentration (parts per million) 384 ~550
Avoiding Catastrophe<br />
sil fuels in 2007, and the two together account<br />
for fully 40 percent of global emissions. 27 (See<br />
Table 2.) Emissions are also growing quickly in<br />
other parts of the developing world, particularly<br />
elsewhere in Asia and in the Middle East,<br />
where rapid population growth, rising oil<br />
wealth, and low, subsidized energy prices have<br />
led to skyrocketing energy demand. 28<br />
Providing energy services for the much<br />
larger global economy of 2050 while reducing<br />
CO 2 emissions to 15 billion tons will require<br />
an energy system that is very different from<br />
today’s. 29 For the world as a whole to reduce its<br />
emissions by at least half by 2050, today’s<br />
industrial countries will need to cut theirs by<br />
more than 80 percent. 30 According to most<br />
official assessments, including that of the<br />
IPCC, getting there depends on some combination<br />
of a three-pronged strategy: reducing<br />
energy consumption through new technologies<br />
and lifestyles, shifting to carbon-free energy<br />
technologies, and capturing and storing the<br />
CO 2 released when fossil fuels are combusted.<br />
A variety of combinations of these three<br />
options can in theory do the job. 31 It is now<br />
time to develop a coherent strategy—and to<br />
shape policy and investment accordingly.<br />
Emissions from oil will be limited by supply<br />
constraints. Production of conventional crude<br />
oil is expected to peak and begin declining<br />
within the next decade or two. 32 By 2050, output<br />
could be a third or more below the current<br />
level. 33 This will require that transportation<br />
fleets shift rapidly to other energy options, the<br />
most promising of which are electricity (produced<br />
from renewable energy), advanced biofuels,<br />
and compressed natural gas. Reliance on<br />
natural gas, which has not been as heavily<br />
exploited as oil and which releases half as<br />
much carbon per unit of energy as coal, is<br />
likely to grow. But its potential to be used efficiently<br />
for cogeneration of heat and power will<br />
limit its contribution to emissions.<br />
Unfortunately, the slowdown in the rate of<br />
discovery of oil and gas is pushing world<br />
energy markets toward dirtier, more carbonintensive<br />
fossil fuels. The greatest problem for<br />
the world’s climate is coal, which is both more<br />
abundant and more carbon-intensive than oil,<br />
and the “unconventional” fossil fuels such as<br />
tar sands and oil shale, which at recent oil<br />
prices have become economically viable.<br />
Unless the development of these dirty fossil<br />
Table 2. Energy-Related Carbon Dioxide Emissions, Selected<br />
Countries, 1990 and 2007<br />
CO 2 Emissions, CO 2 Emissions,<br />
CO 2 Emissions Per Capita Per $ GDP<br />
Country or Region 1990 2007 1990 2007 1990 2007<br />
(kilograms per<br />
(billion tons) (tons) $1,000 GDP (PPP))<br />
United States 4.8 6.1 18.7 19.2 823 437<br />
China 2.3 5.9 2.0 4.4 2,523 844<br />
European Union-27 3.6 3.8 7.6 7.6 514 258<br />
India 0.6 1.5 0.8 1.2 898 503<br />
Japan 1.0 1.2 8.3 9.7 446 290<br />
Africa 0.6 1.2 1.0 1.2 864 595<br />
Others 9.0 10.2 – – – –<br />
World 22.0 29.9 4.2 4.3 863 460<br />
* Does not include emissions resulting from gas flaring, cement making, or land use<br />
change.<br />
Source: See Endnote 27 for this section.<br />
fuels is deliberately curtailed in favor of renewable<br />
alternatives, it will be imposible to reach<br />
the declining emission trajectories that scientists<br />
say are needed.<br />
Coal-fired power plants currently supply<br />
more than 40 percent of the world’s electricity,<br />
and their large contribution to CO 2 emissions<br />
has led policymakers and industrialists to focus<br />
on carbon capture and storage (CCS) so that<br />
those plants can be compatible with a low-carbon<br />
economy. 34 Such plants would be<br />
equipped with devices that capture carbon<br />
either before or after the combustion of fossil<br />
fuels, and then pipe the CO 2 into underground<br />
geological reservoirs or into the deep ocean,<br />
where it could in principle remain for millions<br />
of years.<br />
Coal can either be gasified (as it already is in<br />
some advanced power plants), with the carbon<br />
dioxide then separated from the other gases, or<br />
it can be burned directly in a super-critical<br />
pulverized plant that also allows the capture of<br />
as much as 90 percent of the CO 2 . Four CCS<br />
projects are in operation in Algeria, Canada,<br />
w w w . w o r l d w a t c h . o r g L O W - C A R B O N E N E R G Y : A R O A D M A P 11
Avoiding Catastrophe<br />
Germany, and Norway. 35 The facilities in Algeria<br />
and Norway simply capture carbon dioxide<br />
that is extracted together with natural gas. The<br />
small project in Weyburn, Canada, on the<br />
other hand, gasifies coal, extracting CO 2 and<br />
injecting it underground. While these technologies<br />
are advancing, together with advances<br />
in modeling and monitoring of geological<br />
sites, full-scale commercial CCS systems are<br />
still a long way off. And a vast physical infrastructure<br />
will be needed to capture, move, and<br />
store the emissions from even a fraction of<br />
today's fossil fuel combustion.<br />
The United States, European Union, Japan,<br />
and China have all launched governmentfunded<br />
CCS programs in the last few years, but<br />
the pace of these efforts is surprisingly lethargic<br />
given the urgency of the climate problem<br />
and the fact that much of the power industry is<br />
counting on CCS to allow them to continue<br />
burning massive amounts of coal. A 2007 study<br />
by the Massachusetts <strong>Institute</strong> of Technology<br />
concluded that the U.S. Department of<br />
Energy’s main program to demonstrate the<br />
feasibility of large-scale CCS is not on track to<br />
achieve rapid commercialization of key technologies.<br />
37 Locating, testing, and licensing<br />
large-scale reservoirs where CO 2 can be stored<br />
is a particularly urgent task. Also problematic<br />
is the fact that CCS will be water- and energyintensive,<br />
which will limit its attractiveness in<br />
many regions.<br />
It will take at least a decade to develop and<br />
test large-scale CCS technology, which means<br />
that it will be the 2020s or 2030s at the earliest<br />
before significant numbers of low-carbon coal<br />
plants can begin to be built. How large a role<br />
CCS ultimately plays in a low-carbon economy<br />
will depend on how rapidly the technology<br />
develops, how much it costs, and whether governments<br />
and industries are able to successfully<br />
mobilize the massive infrastructure<br />
investment that will be required. In the meantime,<br />
James Hansen and Al Gore have both<br />
called for a moratorium on building new coalfired<br />
power plants until CCS can be included.<br />
12<br />
L O W - C A R B O N E N E R G Y : A R O A D M A P w w w . w o r l d w a t c h . o r g
A Convenient Truth<br />
In 2001, as U.S. Vice President Dick<br />
Cheney was assembling the Bush Administration’s<br />
energy policy proposals, he<br />
described saving energy as a “moral virtue”<br />
not worthy of serious consideration alongside<br />
more robust energy options such as offshore<br />
oil drilling and nuclear power. 1 Cheney’s quick<br />
dismissal of the demand-side approach to<br />
meeting energy needs reflects a widespread<br />
neglect of efficiency by policymakers and<br />
investors since energy prices fell dramatically<br />
in the 1980s.<br />
But as energy prices recently reached alltime<br />
highs, the consensus of expert opinion<br />
has shifted decisively. Reducing the amount of<br />
energy wasted and increasing the amount of<br />
economic output that can be produced with a<br />
given amount of energy is now considered the<br />
most economical way of reducing dependence<br />
on fossil fuels. The monetary savings associated<br />
with boosting energy productivity are<br />
often sufficient to justify the investment even if<br />
the world were not facing a climate crisis.<br />
Given the urgency of the climate problem, that<br />
is indeed a convenient truth.<br />
Energy productivity measures an economy’s<br />
ability to extract useful services from the<br />
energy that is harnessed. From the earliest<br />
stages of the Industrial Revolution, energy productivity<br />
has advanced steadily, a trend that<br />
accelerated dramatically when energy prices<br />
soared in the 1970s. In the United States, the<br />
economy has grown 165 percent since 1973,<br />
while energy use rose just 34 percent, allowing<br />
the nation’s energy productivity to double during<br />
the period. 2 Germany and Japan, starting<br />
with higher productivity levels, have achieved<br />
comparable increases. 3 But even today, well<br />
over half of the energy harnessed worldwide is<br />
converted to waste heat rather than being used<br />
to meet energy needs. 4<br />
This suggests enormous potential to<br />
improve energy productivity in the decades<br />
ahead, and broader trends will boost that<br />
effort. Many technologies are becoming more<br />
and more efficient—from steelmaking to automobiles—and<br />
in<br />
recent decades, the<br />
economies of most<br />
industrial countries<br />
have centered the bulk<br />
of their economic<br />
growth on light<br />
industry and the service<br />
sector, with<br />
energy-intensive<br />
industries such as<br />
smelting metals and<br />
manufacturing petrochemicals<br />
falling as a<br />
share of the total<br />
economy. Even larger<br />
opportunities are<br />
found in developing<br />
nations, where energy<br />
productivity tends to<br />
be lower and much of<br />
the basic infrastructure<br />
is still being built.<br />
However, this potential<br />
will be offset in some countries in the short<br />
term by the fact that they are entering an infrastructure-<br />
and energy-intensive stage of economic<br />
development.<br />
In China, for example, energy growth suddenly<br />
accelerated in 2002—with the bulk of<br />
Smart Car, manufactured<br />
by Daimler AG.<br />
© Chris P. Walsh (Flickr Creative<br />
Commons)<br />
w w w . w o r l d w a t c h . o r g L O W - C A R B O N E N E R G Y : A R O A D M A P 13
A Convenient Truth<br />
Compact fluorescent<br />
lamp (CFL).<br />
© AZAdam (Flickr Creative<br />
Commons)<br />
the growth coming from energy-intensive<br />
industries needed to build the factories, roads,<br />
buildings, and other pillars of an industrial<br />
economy. 5 This abruptly ended two decades of<br />
impressive energy productivity gains in which<br />
China’s energy use and emissions had grown<br />
much slower than the economy as a whole. As<br />
a result, China’s CO 2 emissions nearly doubled<br />
between 2002 and 2007, passing the United<br />
States (if cement emissions are included) two<br />
decades before the International Energy<br />
Agency had projected this would occur. 6<br />
The dramatic acceleration of energy growth<br />
in China has alarmed the country’s leaders,<br />
who are concerned about the economic, security,<br />
and environmental implications of soaring<br />
energy demand. The country’s 11th<br />
Five-Year Plan, adopted in 2006, calls for a 4<br />
percent annual increase in the country’s energy<br />
productivity; new efficiency standards have<br />
been adopted and energy subsidies reduced. 7<br />
With the right policies in place, rapid economic<br />
growth can speed the introduction of a<br />
new generation of efficient electric motors, air<br />
conditioners, automobiles, power plants, computers,<br />
aircraft, and buildings.<br />
Light bulbs are a case in point. Compact<br />
fluorescent lamps (CFLs), first developed in<br />
the early 1980s, have been catching on as an<br />
alternative to the incandescent bulb introduced<br />
to the mass market by Thomas Edison in the<br />
late 19th century. CFLs represent a remarkable<br />
advance in energy efficiency—producing<br />
nearly four times as much light for each watt<br />
of power consumed. 8 Until recently, CFLs were<br />
expensive and did not meet the needs of many<br />
lighting applications, but two decades of<br />
miniaturization of components, improvements<br />
in the quality of light produced, and reductions<br />
in manufacturing costs have largely<br />
closed the gap with incandescents, and sales<br />
are soaring. 9<br />
Although CFL technology was developed in<br />
the United States and has been dominated by<br />
European and U.S. firms, most of the bulbs are<br />
now manufactured in China where they have<br />
become nearly ubiquitous. Chinese production<br />
of CFLs tripled from 750 million units in 2001<br />
to 2.4 billion in 2006. 10 In the United States,<br />
sales rose from 21 million units in 2000 to 397<br />
million in 2007. 11 The CFL share of the lighting<br />
market varies widely, from 80 percent in<br />
Japan, to 50 percent in Germany, to 20 percent<br />
in the United States. 12 Around the world, the<br />
use of CFLs will continue to rise as governments<br />
implement lighting efficiency standards<br />
that promote their use and in some cases virtually<br />
prohibit the sale of incandescent bulbs.<br />
In the meantime, several other new lighting<br />
technologies are under development, including<br />
a semi-conductor device known as a lightemitting<br />
diode (LED) that is as much as 90<br />
percent more efficient than an incandescent.<br />
Currently deployed for a range of specialized<br />
forms of lighting, including stoplights and<br />
electronic devices, LEDs are still too expensive<br />
for widespread use. However, costs are falling,<br />
and engineers are developing a range of new<br />
LEDs that will have much wider application.<br />
The greatest potential for energy savings lies<br />
in the most basic element of the energy economy—buildings—which<br />
consume about 40<br />
percent of global energy and emit a comparable<br />
share of CO 2 emissions. 13 About half of<br />
this energy use is for space and water heating,<br />
and the rest is associated with the production<br />
of electricity for lighting, space cooling, and<br />
powering appliances and office equipment. 14<br />
With technologies available today, such as better<br />
insulation, more-efficient lighting and<br />
appliances, improved doors and windows, and<br />
14<br />
L O W - C A R B O N E N E R G Y : A R O A D M A P w w w . w o r l d w a t c h . o r g
A Convenient Truth<br />
heat recovery ventilators, the fossil energy<br />
needs of buildings can be reduced by 70 percent<br />
or more, with the additional investment<br />
paid for via lower energy bills. 15 Further gains<br />
can be achieved by designing and orienting<br />
buildings so that they can benefit from natural<br />
heating, cooling, and daylighting.<br />
The advent of cheap energy enabled modern<br />
buildings to work in spite of nature rather<br />
than with it. But it is possible to reduce<br />
demand in existing buildings by insulating<br />
them appropriately, controlling unwanted air<br />
infiltration, and improving performance for<br />
space and water heating, lighting, ventilation,<br />
and air conditioning. There is a substantial gap<br />
between economic potential and commercial<br />
reality in the buildings sector, and since the<br />
1970s, national, state, and local governments<br />
have imposed energy building codes to close<br />
that gap. But in recent years, those codes have<br />
themselves fallen short of driving the kind of<br />
advances that are possible.<br />
Studies show that for new construction, the<br />
integration of design with multiple energyefficiency<br />
measures can reduce energy use to<br />
half or less that of a comparable conventional<br />
building, as new offices from New York City to<br />
London to Berlin have demonstrated. 16 Potential<br />
savings in India, China, and elsewhere<br />
could be even greater. India, for example, has<br />
no mandatory efficiency codes for commercial<br />
buildings, and most building contractors have<br />
not been trained to install insulation. 17 But<br />
greener buildings are on the way in India as<br />
well. One of the largest green commercial<br />
developments in the world is under construction<br />
outside of Delhi; it is expected to exceed<br />
international energy performance standards. 18<br />
“Green buildings” that minimize the use of<br />
energy as well as other environmental impacts<br />
have attracted growing attention around the<br />
globe in recent years. In the United States,<br />
green certification is now highly sought by<br />
builders of new commercial buildings, setting<br />
off a wave of advances by architects, engineers,<br />
and builders. The U.S. Green Building Council,<br />
which developed a popular set of voluntary<br />
standards, now includes more than 15,000<br />
member organizations. 19 Efforts are under way<br />
to strengthen the energy efficiency requirements<br />
within these standards. Canada, India,<br />
and other nations are meanwhile developing<br />
their own standards.<br />
European countries are moving particularly<br />
rapidly and with greater government support,<br />
sparking a green building boom. The Passivhaus<br />
<strong>Institute</strong> in Germany, which began<br />
developing criteria for highly efficient houses<br />
in 1990, has built more than 6,000 living and<br />
commercial units that consume about onetenth<br />
the energy of standard German homes. 20<br />
In China, the Ministry of Housing and Urban-<br />
Rural Development has established a goal of<br />
making new city buildings 65 percent more<br />
efficient than existing buildings are, and the<br />
State Council has established a tax and feebate<br />
system for energy hookups that encourages<br />
better efficiency. 21<br />
As peak energy loads for lighting, heating,<br />
and cooling decline, so does the required size<br />
of fans, boilers, and other equipment, providing<br />
additional savings. The modest remaining<br />
energy needs can be met with renewable<br />
energy. In 2008, the European Parliament<br />
called for “all new buildings needing to be<br />
heated and/or cooled be constructed to passive<br />
house or equivalent non-residential standards<br />
from 2011 onwards, and a requirement to use<br />
passive heating and cooling solutions from<br />
Green buildings in<br />
Berlin, Germany.<br />
© Al Hallajo (Flickr Creative<br />
Commons)<br />
w w w . w o r l d w a t c h . o r g L O W - C A R B O N E N E R G Y : A R O A D M A P 15
A Convenient Truth<br />
Energy-efficient<br />
windows at<br />
Lawrence Berkeley<br />
National Laboratory,<br />
California.<br />
© Lawrence Berkeley National<br />
Laboratory (Flickr Creative<br />
Commons)<br />
2008.” 22 This goal is awaiting implementing<br />
laws in member states.<br />
As energy efficiency improves, each unit of<br />
energy is cheaper, so consumers may choose to<br />
use more energy or to spend this savings on<br />
additional goods that require energy. The<br />
resulting rebound effect is measured by the difference<br />
between projected and actual energy<br />
savings that result from an increase in efficiency.<br />
23 This can be countered with progressively<br />
stronger efficiency standards or with<br />
technology advances that offer the potential to<br />
break the mold. Case studies in the United<br />
States have concluded that energy savings in<br />
energy-efficient commercial buildings—from<br />
schools to office towers—have frequently been<br />
greater than projected. 24<br />
Even greater savings can come from “zeroenergy”<br />
or “zero-carbon” buildings that produce<br />
all of their energy on site with renewable<br />
energy, emitting no CO 2 . (Most buildings will<br />
need to have an energy supply from outside to<br />
meet peak demands at particular times of the<br />
day and year, but are considered zero net<br />
energy if they produce as much energy as they<br />
consume over the course of a year.) The United<br />
Kingdom has mandated that all new homes<br />
built after 2016 and all commercial buildings<br />
built after 2019 be zero-carbon. 25<br />
In developing countries, energy use in<br />
buildings is growing particularly rapidly as<br />
people move into improved homes and acquire<br />
amenities such as heating, cooling, and refrigeration.<br />
In China, buildings already account<br />
for 23 percent of energy use, and with 300<br />
million people—equivalent to the entire U.S.<br />
population—expected to move to cities in the<br />
next decade, the largest construction boom in<br />
history will unfold in the coming years. 26<br />
How these buildings are constructed will profoundly<br />
shape CO 2 emissions in China for<br />
decades to come.<br />
Another large opportunity for advancing<br />
energy productivity can be found in the extensive<br />
use of combined heat and power (CHP),<br />
also known as cogeneration. In most power<br />
plants today, two-thirds of the energy contained<br />
in the plant’s fuel is converted into<br />
waste heat or lost in the transmission<br />
process. 27 In the United States, the waste heat<br />
16<br />
L O W - C A R B O N E N E R G Y : A R O A D M A P w w w . w o r l d w a t c h . o r g
A Convenient Truth<br />
from power plants is equivalent to all of the<br />
energy consumed in Japan. 28 By integrating<br />
power generation with factories and buildings,<br />
high-temperature waste heat can be used to<br />
produce electricity, or, in another configuration,<br />
the waste heat from power generation can<br />
be used for industrial and building heat,<br />
increasing total energy efficiency from 33 percent<br />
to as high as 80–90 percent. 29<br />
Some of the world’s first power plants<br />
employed CHP, and while it has since fallen<br />
out of favor in most nations, some have pursued<br />
it aggressively since the early 1980s. Finland<br />
and Denmark obtain 40 and 50 percent<br />
respectively of their electricity from CHP, far<br />
above the levels found in countries such as the<br />
United States (8 percent) and Germany and<br />
China (12 percent each). 30<br />
It is estimated that CHP in Europe reduced<br />
annual CO 2 emissions by 57 million tons<br />
between 1990 and 2005, accounting for 15 percent<br />
of European emissions reductions. 31 If<br />
most industrial countries were to aggressively<br />
pursue CHP, it would eliminate the need for<br />
new coal plants and allow many older plants to<br />
be gradually shut down. At today’s energy<br />
prices, much of the investment can be justified<br />
in energy savings alone. The United States<br />
could get 150 gigawatts, or 15 percent of its<br />
power, from the unused waste heat from heavy<br />
industry as well as from manure, food industry<br />
waste, landfill gas, wastewater, steam, gas<br />
pipeline pressure differentials, fuel pipeline<br />
leakages, and flaring. This is as much power as<br />
the entire U.S. nuclear industry produces. 32<br />
A global assessment by the McKinsey Global<br />
<strong>Institute</strong> of the potential to improve energy<br />
productivity concluded that the rate of annual<br />
improvement between now and 2020 could be<br />
increased from 1 percent to 2 percent, which<br />
would slow the rate of global energy demand<br />
growth to just 1 percent a year. 33 If these gains<br />
are extended to 2050, the growth in world<br />
energy use could be held to roughly 50 percent<br />
above current levels, rather than the doubling<br />
that is projected under most business-as-usual<br />
scenarios. This large difference is equivalent to<br />
the combined current energy consumption of<br />
the European Union, Japan, and North America.<br />
34 By fully exploiting all of the opportunities<br />
described above, the world could likely do<br />
even better than that.<br />
Future increases in energy productivity<br />
will not only reduce consumption of fossil<br />
fuels, they will make it easier and more affordable<br />
to rapidly increase the use of carbon-free<br />
energy. And additional gains can be made by<br />
altering the design of cities—for example, by<br />
increasing the role of public transport, walking,<br />
and cycling while reducing dependence<br />
on automobiles.<br />
w w w . w o r l d w a t c h . o r g L O W - C A R B O N E N E R G Y : A R O A D M A P 17
No-Carbon Energy<br />
Growth Rate (percent)<br />
50.0<br />
37.5<br />
25.0<br />
12.5<br />
0<br />
No matter how efficiently energy<br />
is used, substantial reductions in<br />
carbon dioxide emissions will<br />
require the simultaneous and<br />
rapid introduction of carbon-free sources of<br />
energy. One option that is gaining increased<br />
attention these days is nuclear power, which<br />
already plays a major role in some countries<br />
but faces considerable obstacles to its expansion<br />
in the decades ahead. 1 (See Sidebar 1.)<br />
The more robust carbon-free energy option is<br />
renewable energy, including solar, wind, biomass,<br />
and geothermal energy. In the longer<br />
run, ocean energy—from tides, waves, currents,<br />
and thermal convection—is another<br />
strong possibility.<br />
Assessments of the potential of renewable<br />
energy to replace fossil fuels over the next few<br />
decades vary widely, with skepticism running<br />
Figure 2. Average Annual Growth Rates by Energy Source,<br />
2002–07<br />
40.6<br />
24.1<br />
19.8<br />
5.9<br />
Sources: See Endnote 7 for this section.<br />
Solar PV Wind Biofuels Coal Hydro Natural Gas Oil Nuclear<br />
3.1<br />
3.1<br />
1.8<br />
0.4<br />
18<br />
high among many energy executives. The<br />
World Energy Council, which represents the<br />
large energy companies that dominate today’s<br />
energy economy, declared in 2007 that renewable<br />
energy has “enormous practical challenges.<br />
It is unlikely to deliver a significant decarbonisation<br />
of electricity quickly enough to meet the<br />
climate challenge.” 2 That view is outdated and<br />
inaccurate: rapidly advancing technologies are<br />
making a growing number of renewable energy<br />
options economically competitive in today’s<br />
markets, and the pace of progress continues to<br />
accelerate. This, combined with the vast scale<br />
of the renewable energy resource base, holds<br />
the potential for what can only be described as<br />
an energy revolution.<br />
Modern renewable energy technologies have<br />
been advancing steadily since the late 1970s,<br />
with modest government support and industries<br />
that were concentrated in a handful of<br />
countries. But in the past five years, renewable<br />
energy has entered a super-charged stage of<br />
growth. Soaring energy prices combined with<br />
new government policies and concern about<br />
climate change have spurred a growing army of<br />
small and mid-sized companies and a wide<br />
range of investors who are pouring tens of billions<br />
of dollars into an array of promising<br />
renewables technologies. 3<br />
Coal-fired power plants generate 40 percent<br />
of the world’s electricity and account for a<br />
third of global CO 2 emissions. 4 Replacing<br />
existing plants—and those being planned—<br />
with renewable power would make a big dent<br />
in the world’s climate problem. 5 Renewable<br />
energy sources already supply nearly one-fifth<br />
of the world’s electricity. While most of this<br />
comes from large hydropower, which is groww<br />
w w . w o r l d w a t c h . o r g L O W - C A R B O N E N E R G Y : A R O A D M A P
No-Carbon Energy<br />
ing very slowly, wind capacity is expanding at<br />
24 percent per year and solar at over 40 percent,<br />
rivaling the computer and mobile phone<br />
industries. 7 (See Figure 2.)<br />
Since 2000, wind power has gone from a<br />
tiny niche electricity supplier to become a significant<br />
force in the global power business.<br />
Deploying giant multi-megawatt wind turbines<br />
made by companies such as General<br />
Electric, Siemens, Vestas, and Gamesa, the<br />
wind industry is now booming. 8 Total generating<br />
capacity is estimated to have passed 100<br />
gigawatts in early 2008, double the amount in<br />
2004. 9 An industry that was dominated by California<br />
and Denmark in the 1980s, and by Germany<br />
and Spain in the 1990s, is now<br />
flourishing in the world’s largest power markets,<br />
including China, India, the United States,<br />
and the European Union.<br />
In 2007, wind power represented 40 percent<br />
of new generating capacity installations in<br />
Europe and 35 percent in the United States. 10<br />
Sidebar 1. What About Nuclear Power<br />
Nuclear power is a largely carbon-free energy source that could in theory help phase out fossil fuels. At the beginning of 2008,<br />
there were 372 gigawatts (GW) of nuclear generating capacity, providing roughly 15 percent of the world’s electricity. But nuclear<br />
power has been plagued by a range of problems, from safety concerns, to radioactive waste disposal, to the diversion of technologies<br />
and fuel for the manufacture of nuclear weapons.<br />
Nuclear construction starts peaked in the 1970s with an average of 25 GW annually, falling to an average of less than 5 GW in<br />
the last five years. Over the past decade, global nuclear capacity has expanded at a rate of less than 1 percent a year. In 2006 and<br />
2007, the world added 3 GW of nuclear capacity, compared with 35 GW of wind capacity over the same two-year period. By the<br />
end of 2007, some 34 reactors were being built worldwide, but 12 of these units have been “under construction” for 20 years or<br />
more. In Western Europe, only Finland and France are building nuclear plants. In the United States, one problem-plagued plant<br />
is being built; it has now been under construction for more than a quarter century.<br />
The combination of concern about climate change, high natural gas prices, and a large dose of new government subsidies has<br />
recently revived interest in nuclear power. Several companies are developing modestly revamped plant designs that are intended<br />
to make nuclear plants easier to control, less prone to accidents, and cheaper to build. The most important innovations are to<br />
standardize designs and streamline regulatory procedures. So far, two of the newer nuclear plants are being built in Europe, and<br />
several are under construction in China. In the United States, 23 applications have been filed for construction and operating<br />
licenses since 2004; however, only four of these include actual plant designs, and all are dependent on federal loan guarantees.<br />
The $18.5 billion that Congress has so far made available for loan guarantees is only enough to support two plants.<br />
The largest hurdle facing the nuclear industry is the one that crushed it in the 1980s: economics. In the United States, it is<br />
now estimated that nuclear plants cost twice as much as a coal plant to build and five times what a natural gas plant costs. A<br />
study by a Keystone Center panel composed of academics, energy analysts, and industry representatives estimated the full cost<br />
of new nuclear power at 8–11 cents per kilowatt-hour, which is more than coal, natural gas, biomass, and wind-powered generators.<br />
For nuclear power to be economical, the industry will need to build large numbers of standardized plants, but new orders<br />
are coming sporadically, and utilities are pursuing an array of new designs, which is likely to keep costs stubbornly high. And<br />
because of the large capital requirements and long lead times, nuclear plants face a risk premium that other generators do not—<br />
a risk that will be exacerbated by tight financial conditions in the years ahead. In Finland, ground was broken in 2005 on the first<br />
new European reactor in a decade; three years later, it is two years behind schedule and $2 billion over budget.<br />
Energy planners will also have to reckon with the scale and pace of construction that would be needed to make a serious dent<br />
in the world’s climate problem. MIT researchers estimate that 1,000–1,500 new reactors would be needed by 2050 for nuclear to<br />
play a meaningful role in reducing global emissions—a construction pace 20 times that of the past decade and five times the<br />
peak level in the 1980s. Speed, however, is not one of nuclear power’s virtues. Planning, licensing, and constructing a single<br />
nuclear plant typically takes 10–15 years, and completion deadlines are frequently missed. Due to the dearth of orders in recent<br />
decades, the world currently has limited capacity to manufacture many critical nuclear components. Rebuilding that capacity will<br />
take a decade or more. In the United States, it is estimated that it will be 2012 at the earliest before a construction license is<br />
approved, and that the first plant will not begin operating until 2020 or beyond. By the time a significant number of plants come<br />
on line in the late 2020s or early 2030s, they will largely be replacing today’s plants, which will by then be ready for retirement.<br />
Source: See Endnote 1 for this section.<br />
w w w . w o r l d w a t c h . o r g L O W - C A R B O N E N E R G Y : A R O A D M A P 19
No-Carbon Energy<br />
Cents per Kilowatt-hour<br />
(2007 Dollars)<br />
15<br />
10<br />
5<br />
0<br />
Further growth will come from offshore wind<br />
farms, which are expected to expand rapidly in<br />
the coming decade. And this torrid growth<br />
appears likely to continue as more and more<br />
governments follow the leaders and implement<br />
wind-friendly electricity laws. As the industry<br />
grows, it invests in ever more efficient wind<br />
technologies, driving costs down. In the United<br />
States, wind power now costs just under six<br />
cents per kilowatt-hour on average—less than<br />
natural gas and roughly even with coal. 11 (See<br />
Figure 3.)<br />
The solar industry is starting from a smaller<br />
base but is growing even more rapidly than<br />
wind power. Annual production of solar cells<br />
(semiconductors that turn sunlight into electricity)<br />
rose 41 percent in 2006 and 51 percent<br />
in 2007. 12 Cumulative installations of solar<br />
cells have grown more than fivefold over the<br />
past five years, spurred by strong incentive programs<br />
in Germany, Japan, and Spain. 13 This<br />
Figure 3. Cost of Electricity Generation by Source<br />
5.36<br />
Fuel<br />
Operations & Management<br />
Construction<br />
9.55<br />
7.07<br />
Source: Black & Veatch, EIA, Keystone Center, IEER, E3<br />
5.85<br />
10.08<br />
Coal Natural Gas Nuclear Wind Solar CSP<br />
growth has fueled a powerful wave of innovation<br />
in a technology that was invented only in<br />
the 1950s. From Silicon Valley, California, to<br />
Munich, Germany, and Shenzen, China, scores<br />
of companies are pursuing an extraordinary<br />
array of approaches to improving solar cell<br />
design and lowering costs.<br />
Solar power still requires significant subsidies,<br />
but the Prometheus <strong>Institute</strong> projected in<br />
2007 that as the industry scales up, installed<br />
system prices for large projects will fall 50 percent<br />
by 2010, to $4 per watt (without incentives)<br />
in the best locations. 14 Solar cells are<br />
deployed mainly on rooftops where they provide<br />
power for homes, businesses, and public<br />
institutions, with excess power fed into the<br />
local grid. In regions such as California and<br />
Italy that combine high electricity prices and<br />
ample sunshine, solar power is expected to fall<br />
to less than 25 cents per kilowatt-hour, becoming<br />
cost-competitive with the retail price of<br />
electricity within the next three years. 15<br />
Even as solar cells enter the mainstream,<br />
attention has focused on using solar thermal<br />
energy through large concentrating solar<br />
power (CSP) plants. Built mainly in deserts,<br />
these plants provide wholesale electricity that is<br />
transmitted to cities and industries via highvoltage<br />
power grids, in the same way most<br />
power is today. A wide range of CSP plant<br />
designs are being pursued; most rely on mirrored<br />
parabolic troughs or dishes to concentrate<br />
the sun’s heat, which is then transferred to<br />
water or another fluid, with the resulting steam<br />
used to spin a turbine and produce electricity.<br />
These plants produce power in much the way<br />
that conventional coal or nuclear plants do, but<br />
they operate at lower temperatures and pressures,<br />
which permits cost reduction.<br />
The world’s first modern CSP plant was<br />
built in California’s Mojave Desert in the late<br />
1980s, but it was not until the past few years<br />
that the technology experienced a dramatic<br />
renaissance. 16 More than a dozen projects with<br />
a combined capacity of over 4 GW are under<br />
contract in the southwestern United States<br />
alone, and another 3 GW in other countries<br />
including Spain, China, Egypt, and Israel. 17<br />
Costs are still relatively high at 10 cents or<br />
more per kilowatt-hour, but because the industry<br />
is in the early part of a very steep learning<br />
curve, costs are expected to fall rapidly in the<br />
next 5–10 years. New plant designs continue to<br />
emerge, including a Pacific Gas and Electric<br />
project that will use 800 megawatts of solar<br />
cells rather than thermal systems. 18<br />
Geothermal energy—heat from deep in the<br />
Earth’s crust—is another large potential source<br />
20<br />
L O W - C A R B O N E N E R G Y : A R O A D M A P w w w . w o r l d w a t c h . o r g
No-Carbon Energy<br />
of electricity. Geothermal power currently provides<br />
just 10 GW of power worldwide, with<br />
much of it in the United States, the Philippines,<br />
and Mexico. 19 But a new generation of<br />
enhanced geothermal technologies is now<br />
being developed that makes it possible to tap a<br />
much larger geothermal resource base.<br />
Advanced geological sensing and drilling techniques<br />
developed by the oil industry are being<br />
combined with new heat exchanger materials<br />
and systems. By piping water into porous geological<br />
structures 1 to 10 kilometers beneath<br />
the Earth’s surface and then bringing the<br />
heated water back to a plant at the surface,<br />
electricity can be generated. The Massachusetts<br />
<strong>Institute</strong> of Technology has estimated that the<br />
United States alone has at least 100 GW of<br />
geothermal potential, mainly in the western<br />
states, and similar potential undoubtedly exists<br />
in many other countries. 20<br />
As renewable energy technologies have<br />
advanced, attention has turned to the adequacy<br />
of the resource base available to meet the large<br />
and growing demands of the global economy.<br />
Many are skeptical that these relatively dispersed<br />
and often variable energy sources can<br />
meet such vast energy needs. They need not be<br />
worried. The sunlight alone that strikes the<br />
Earth’s land surface in two hours is equivalent<br />
to total human energy use in a year. 21 While<br />
much of that sunlight becomes heat, solar<br />
energy is also responsible for the energy<br />
embodied in wind, hydro, wave, and biomass,<br />
each with the potential to be harnessed for<br />
human use. Only a small portion of that enormous<br />
daily flux of energy will ever be needed<br />
by humanity. With improved technologies,<br />
greater efficiency, and lower costs, renewable<br />
energy could one day replace all the carbonbased<br />
fuels that are so vital to today’s<br />
economy. 22 (See Figure 4.)<br />
Several studies have assessed the scale of the<br />
major renewable resources and what their<br />
practical contribution to the energy economy<br />
might one day be. 23 (See Table 3.) In the case<br />
of wind power, the Pacific Northwest Laboratory<br />
found that the land-based wind resources<br />
of the U.S. states of Kansas, North Dakota, and<br />
Texas could meet all of the nation’s electricity<br />
needs, even with large areas excluded for environmental<br />
reasons. 24 The U.S. wind resource<br />
base is not limited to those states, however, and<br />
beyond the land-based resource, offshore wind<br />
offers enormous potential—enough in the case<br />
of northern European countries such as the<br />
Energy Flow (exajoules per year)<br />
2000<br />
1500<br />
1000<br />
500<br />
0<br />
Figure 4. Estimates of Available Energy Resources Using<br />
Today’s Technology<br />
477<br />
World<br />
Energy Use<br />
>1600<br />
600<br />
500<br />
Netherlands and the United Kingdom to in<br />
principle provide all of their electricity. 25<br />
China’s wind resources alone are sufficient to<br />
provide more electricity than the country currently<br />
consumes. 26<br />
Solar energy represents an even larger<br />
resource. A study by the National Renewable<br />
Energy Laboratory in the United States identified<br />
159,000 square kilometers of land in seven<br />
southwest states that are suitable for CSP<br />
plants—representing nearly 7,000 GW of generating<br />
capacity, or nearly seven times the<br />
nation’s existing capacity from all sources. 27<br />
One-fifth of U.S. electricity could be produced<br />
on a 1,500 square-kilometer plot of land<br />
slightly larger than the city of Phoenix. 28 While<br />
some regions such as northern Europe do not<br />
have sufficient solar resources to meet more<br />
than a fraction of their energy needs, other<br />
areas could become major exporters of solar<br />
energy. North Africa, for example, has a vast<br />
solar resource, and plans are being laid to<br />
Source: UNDP, Johansson et al., IEA<br />
>250<br />
Biomass<br />
50<br />
Solar Wind Geothermal<br />
Hydropower<br />
No-Carbon Energy<br />
Table 3. Estimates of Potential Contribution of Renewable Energy Resources<br />
Energy Source<br />
Concentrating solar power (CSP)<br />
Solar water heaters<br />
Rooftop solar cells<br />
Wind power<br />
Geothermal heat<br />
Wave and ocean thermal energy<br />
Source: See Endnote 23 for this section.<br />
Potential Contribution<br />
Seven states in the U.S. Southwest could provide more than<br />
7,000 GW of solar generating capacity—nearly seven times U.S.<br />
electric capacity from all sources.<br />
Could easily provide half the world’s hot water.<br />
Could provide 10 percent of grid electricity in the United States<br />
by 2030.<br />
Could easily provide 20 percent of world’s electricity; offshore<br />
wind farms could meet all of the European Union’s electricity<br />
needs.<br />
Could provide 100 GW of generating capacity in the United<br />
States alone.<br />
Contribution could be on same order of magnitude as current<br />
world energy use.<br />
build solar power plants that would transmit<br />
electricity to Europe. 29 An area covering less<br />
than 4 percent of the Sahara Desert could produce<br />
enough solar power to equal global electricity<br />
demand. 30<br />
On average, wind and solar power require<br />
less land to provide a given amount of power<br />
than hydropower or coal do. And sometimes,<br />
renewable energy requires no land at all.<br />
Mounting solar electric generators on just half<br />
of the United States’ suitable rooftop area<br />
could provide 25 percent of the nation’s electricity,<br />
according to one estimate. 31 Solar cells<br />
could also be deployed atop outdoor parking<br />
lots, the median strips along highways, and<br />
other currently unused spaces. Renewable<br />
energy also has a big advantage when it comes<br />
to a resource that is more limited than land is:<br />
most forms of renewable energy have minimal<br />
water requirements compared with fossil fuels<br />
and nuclear power, and as water scarcity grows,<br />
the significance of that advantage will increase.<br />
In contrast with fossil fuels, almost every<br />
country has large-scale domestic sources of<br />
renewable energy—including many developing<br />
countries that have no oil resources. Africa,<br />
Australia, China, India, the Middle East, and<br />
the United States all have vast amounts of<br />
solar energy. 32 Iceland, Indonesia, and the<br />
Philippines are rich in geothermal energy. 33<br />
And scores of countries are rich in biomass<br />
waste materials that flow from their farm and<br />
forest industries.<br />
22<br />
L O W - C A R B O N E N E R G Y : A R O A D M A P w w w . w o r l d w a t c h . o r g
Designing a<br />
New Energy System<br />
For all of their abundance, integrating<br />
renewable energy resources into an<br />
energy system that was designed<br />
around fossil fuels presents challenges.<br />
Fossil fuels have the advantage of being concentrated<br />
and easily stored, and the energy<br />
industry has spent decades building up an<br />
energy delivery system—including massive<br />
pipelines, high-voltage transmission systems,<br />
and local distribution networks—that is<br />
matched to those fuels. Renewable energy<br />
sources are more dispersed, many are available<br />
only part of the time, and the best resources<br />
are often a long distance from where energy is<br />
consumed. These characteristics have not been<br />
a significant impediment to providing as much<br />
as a fifth of the power from wind in some areas<br />
of Europe, but in order to de-carbonize the<br />
energy economy, additional innovation will<br />
be needed.<br />
Electricity is the single most important element<br />
of today’s energy system, essential for<br />
lighting, cooling, electronics, and many industrial<br />
processes. Its role will only grow as air<br />
conditioning and electronics proliferate and as<br />
new technologies allow electricity to be used to<br />
power motor vehicles and to heat and cool<br />
homes efficiently using ground-source heat<br />
pumps. Electricity also happens to be the output<br />
of the largest and most easily replaced contributor<br />
to carbon dioxide emissions:<br />
coal-fired power plants. It is therefore fortuitous<br />
that solar, wind, geothermal, and biomass<br />
are all able to produce electricity.<br />
From the generator’s viewpoint, the main<br />
disadvantage of most of these electricity<br />
sources is their variability—wind and solar, for<br />
example, produce on average only 25–40 percent<br />
of their rated capacity, depending on the<br />
technology and site. 1 Variability turns out,<br />
however, to be not as big a problem for renewable<br />
electricity as utility engineers once anticipated.<br />
Power companies are already<br />
accustomed to dealing with fluctuating<br />
demand, and even the supply of electricity<br />
varies when conventional power plants are<br />
shut down unexpectedly. So variability is not a<br />
new concept, though dealing with it does take<br />
planning and a willingness to strengthen weak<br />
electricity grids and to make adjustments in<br />
grid operation as penetration levels rise.<br />
As reliance on coal is reduced in the decades<br />
ahead, it is likely that many regions will need<br />
to move well beyond the 20-percent threshold<br />
for wind, solar, and other variable power<br />
sources. To do this, they can pursue some combination<br />
of four strategies: 1) add local generating<br />
capacity using combined heat and<br />
power (CHP) systems, including advanced<br />
technologies such as microturbines and fuel<br />
cells that can be turned on and off as needed;<br />
2) integrate variable sources with digital smart<br />
grids that are more flexible in their ability to<br />
balance demand and supply; 3) develop the<br />
capacity to store energy economically so that<br />
it is available when needed—with options<br />
such as pumped hydro, compressed air, and<br />
advanced chemical batteries and fuel cells;<br />
and 4) selectively add a new generation of efficient,<br />
low-cost gas turbines to provide spare<br />
backup power.<br />
Power companies in some regions have<br />
already gained experience in operating grids<br />
that obtain a sizable share of their electricity<br />
from wind energy. Denmark generates about<br />
20 percent of its electricity with the wind, and<br />
w w w . w o r l d w a t c h . o r g L O W - C A R B O N E N E R G Y : A R O A D M A P 23
Designing a New Energy System<br />
Wind farm near San<br />
Jacinto Peak, southern<br />
California.<br />
© Wayfinder_73 (Flickr Creative<br />
Commons)<br />
occasionally wind energy meets more than 100<br />
percent of peak demand on the country’s west<br />
coast. 2 Four German states produced more<br />
than 30 percent of their electricity with wind<br />
power in 2007. 3 And in the U.S. state of California,<br />
renewables make up more than 30 percent<br />
of the portfolios of some large utilities. 4<br />
Utilities in these regions have balanced supply<br />
and demand through interconnection of grid<br />
systems over large regions, using hydro reservoirs<br />
as temporary storage, increasing the use<br />
of gas turbines to meet peak demand. 5<br />
These tools help utilities regulate the electricity<br />
supply, but there is more they can do on<br />
the demand side as well. New technologies<br />
have made it possible to predict and even control<br />
the level of power demand, saving money<br />
for consumers while better matching supply<br />
and demand. 6 But unleashing the full potential<br />
of efficiency and renewable energy will require<br />
upgrading the early 20th century electricity<br />
grids that provide no feedback between consumer<br />
and producer and require a physical<br />
visit just to read the meter. Kurt Yeager, who<br />
directs the Galvin Electricity Initiative, an<br />
effort dedicated to promoting digital grids,<br />
compares today’s electromechanical power<br />
grids to a railroad on which it takes 10 days to<br />
open or close a switch. 7 New digital grids<br />
include electronic controls that smoothly integrate<br />
electricity consumers with all types of<br />
power plants—large, small, and variable—and<br />
with electricity storage facilities.<br />
Digital grids allow the electricity system to<br />
operate much the way the Internet does—as an<br />
electronically controlled network that responds<br />
instantly to decisions made by users, providing<br />
the same kind of efficiency, interconnectivity,<br />
and precision as the digital devices that it powers.<br />
One advantage of such a system is that the<br />
electricity meter can be transformed into a<br />
consumer gateway that transmits price signals<br />
instantaneously and allows unneeded devices<br />
to be turned off when prices are high or<br />
renewable resources are not available. Consumers<br />
can monitor their power use with electronic<br />
meters and choose to have their<br />
appliances turned off at times of day when<br />
prices are high.<br />
The Pacific Gas and Electric utility in California<br />
is in the process of installing 9 million<br />
smart meters for its customers, while Europe is<br />
projected to have 80 million smart meters<br />
installed by 2013. 8 When starting from scratch,<br />
smart grids are cheaper than conventional systems,<br />
and they are already being deployed in<br />
regions of sub-Saharan Africa that are being<br />
electrified for the first time. 9 And digital grids<br />
will allow higher levels of reliance on variable<br />
generators. 10<br />
Some utilities are already making the transition<br />
to greater reliance on renewable energy.<br />
Danish power company DONG, which has<br />
hundreds of wind turbines connected to its<br />
system, is making conventional power plants<br />
more flexible so they can be turned down, or<br />
even off, when the wind is blowing. “In the old<br />
times,” explains Chief Executive Anders<br />
Eldrup, “wind power was just something we<br />
layered on top of our regular production. In<br />
the future, wind will provide a big chunk of<br />
our baseload production.” 11<br />
In order to qualify for capacity credits<br />
earned when power is generated during peak<br />
periods, some wind farm operators have begun<br />
exploring the use of compressed air storage in<br />
underground steel pipes or geological formations.<br />
One company plans to mount a compressor<br />
under the structure that houses the<br />
generating components, and to send the com-<br />
24<br />
L O W - C A R B O N E N E R G Y : A R O A D M A P w w w . w o r l d w a t c h . o r g
Designing a New Energy System<br />
pressed air down the tower, where it will be<br />
stored underground. 12 When electricity is<br />
needed, the compressor is reversed, generating<br />
electricity. TXU, a large electric power company<br />
in Texas, recently canceled eight coalfired<br />
power plants and is planning instead to<br />
build a 3,000 megawatt wind farm—larger<br />
than any now in operation—that may include<br />
compressed air storage. 13<br />
The development of less-expensive, longerlived<br />
batteries will further ease the way to<br />
greater reliance on renewable energy. Portable<br />
electronic devices and hybrid electric cars are<br />
rapidly increasing demand for advanced batteries<br />
made of nickel metal hydride and lithium.<br />
As they become less expensive and more widely<br />
used, these will allow power companies and<br />
consumers to complement distributed microsolar<br />
generation with distributed storage.<br />
Electricity grids can be made even more<br />
robust and reliable by adding more micropower<br />
generators that are connected to the<br />
local grid and reduce dependence on distant<br />
power plants. Small-scale gas turbines, Stirling<br />
engines, and fuel cells can provide large<br />
Solar energy towers<br />
in Seville, Spain.<br />
© Abengoa Solar<br />
amounts of electricity, with the waste heat<br />
available for use in the buildings in which they<br />
are located. 14 And unlike the large power<br />
plants that dominate today’s power system,<br />
micro-generators will be able to respond<br />
quickly to shifts in demand.<br />
Tapping the full potential of renewable<br />
energy will also require expanding the highvoltage<br />
transmission system in many parts of<br />
the world. This is particularly true in sun-rich<br />
North Africa, which is not far from Europe in<br />
distance but currently lacks sufficient electrical<br />
connections. In the United States, electric utilities<br />
have underinvested in transmission for<br />
decades, and the existing grid is not well<br />
matched to the onshore renewable resource<br />
base, which lies mainly in the Great Plains and<br />
Desert Southwest, distant from the nation’s<br />
population and industrial centers. Plans have<br />
been laid to build a new National Electrical<br />
Superhighway using high-voltage, direct current<br />
lines costing $100 billion or more. 15 The<br />
concept is being promoted by everyone from<br />
former vice president Al Gore to energy tycoon<br />
T. Boone Pickens, but will require national legw<br />
w w . w o r l d w a t c h . o r g L O W - C A R B O N E N E R G Y : A R O A D M A P 25
Designing a New Energy System<br />
Wind turbine<br />
mechanic at work<br />
in Germany.<br />
© Vestas Wind Systems A/S<br />
islation to cut through the thicket of federal<br />
and state jurisdictions now in place. 16<br />
Over time, stronger, smarter grids and a<br />
new wave of generators will gradually reduce<br />
the need for the baseload coal and nuclear<br />
plants that typically provide one-third to onehalf<br />
or more of the generating capacity on<br />
today’s power systems. 17 The Combined Power<br />
Plant, a project that links 36 wind, solar, biomass,<br />
and hydropower installations throughout<br />
Germany, has already demonstrated that a<br />
combination of renewable sources and moreeffective<br />
control can balance out short-term<br />
fluctuations and provide reliable electricity<br />
without any traditional baseload power<br />
plants. 18 In a recent interview, S. David Freeman,<br />
former general manager of the Los Angeles<br />
Department of Water and Power, said, “I’m<br />
a utility executive that ran major utilities, and<br />
I can tell you there is no reason why the electric-power<br />
industry can’t be all renewable.” 19<br />
A report by the German Aerospace Center<br />
(DLR) concluded that renewable energy<br />
sources could generate at least 40 percent of<br />
the electricity in most of the world’s 20 largest<br />
economies by 2030. 20<br />
The U.S. Department of Energy (DOE) produced<br />
a detailed study in 2008 showing that<br />
wind power alone could supply 20 percent of<br />
U.S. electricity by 2030. 21 The DOE scenario<br />
relies on 305 gigawatts (GW) of wind farms—<br />
up from roughly 25 GW at the end of 2008—<br />
that would be spread widely across the<br />
country, including 54 GW of offshore wind<br />
generators. To make this possible, extensive<br />
new transmission lines will need to be built,<br />
and the industry’s manufacturing capacity will<br />
need to expand, but the DOE analysts concluded<br />
that both of those are readily achievable<br />
with sufficient private and public support.<br />
As of late 2008, the U.S. wind industry was<br />
well ahead of the DOE study’s projected development<br />
pace, and will only need to double the<br />
current rate of annual installations to reach the<br />
16 GW that would need to be added in 2022<br />
under the DOE scenario. 22 The benefits of<br />
achieving this goal would include 250,000 new<br />
jobs and reducing CO 2 emissions by 825 million<br />
tons in 2030—virtually stopping the<br />
growth in emissions from the power sector. 23<br />
To illustrate what a low-carbon power system<br />
might look like, we have sketched out a<br />
scenario for the United States in 2030. 24 (See<br />
Figure 5.) We assume that improved energy<br />
efficiency will cut the rate of electricity demand<br />
growth to 0.5 percent per year, compared with<br />
26<br />
L O W - C A R B O N E N E R G Y : A R O A D M A P w w w . w o r l d w a t c h . o r g
Designing a New Energy System<br />
the U.S. Energy Information Administration’s<br />
(EIA's) forecast of a 1 percent growth rate, and<br />
actual growth in the 1990s of 2.4 percent per<br />
year. However, we also assume that by 2030,<br />
half of the energy needs of cars and light trucks<br />
will be met by the grid, increasing the demand<br />
for power by 10 percent. Based on technologies<br />
that are already available or soon will be, our<br />
scenario includes a diverse mix of solar, biomass,<br />
geothermal, wind energy, and cogeneration<br />
(small, efficient generators located in<br />
industries and buildings), with hydropower<br />
and nuclear retaining a modest role. The EIA,<br />
on the other hand, projects that coal will still<br />
provide over half the country’s electricity in<br />
2030—causing CO 2 emissions from the power<br />
sector to continue rising. 25<br />
In the <strong>Worldwatch</strong> scenario, emissions from<br />
the U.S. power sector would be 90 percent<br />
lower than they are today. Notably, no single<br />
renewable resource would need to provide<br />
more than 20 percent of the country’s electricity.<br />
A stronger grid, extensive cogeneration,<br />
and modest storage would allow such a system<br />
to operate reliably with only a fraction of the<br />
inflexible baseload plants that dominate<br />
today’s power industry. And if this scenario is<br />
feasible for the United States—which has the<br />
world’s largest electricity system—then something<br />
similar is possible in most countries,<br />
with some achieving a low-carbon power system<br />
somewhat earlier and others a bit later.<br />
Low-carbon electricity is central to a lowcarbon<br />
energy economy, but by itself, it is not<br />
enough. Reducing motor vehicles’ heavy<br />
dependence on oil is another key step, and the<br />
most promising near-term strategy is shifting<br />
to a new generation of electric and hybrid<br />
vehicles. Because of the efficiency of electric<br />
motors, it is estimated that half of motor vehicle<br />
energy needs in 2030 could be met with just<br />
a 10-percent increase in the power supply. 26<br />
Electricity planners believe that plug-in vehicles<br />
would also increase the stability of the<br />
grid: they could be recharged during off-peak<br />
periods and produce power for the grid at<br />
times when demand is high and other<br />
resources are not available—replacing some of<br />
the expensive natural gas-fired “peaking<br />
Figure 5. U.S. Electricity Generation by<br />
Source, 2007 and Two Scenarios for<br />
2030<br />
2007<br />
Total = 4,013 TWh<br />
Other renewables 2%<br />
Oil 1% Cogeneration 4%<br />
Hydro 6%<br />
Coal 50%<br />
Natural gas 17%<br />
Coal 56%<br />
Cogeneration 32%<br />
2030<br />
(EIA Scenario)<br />
Total = 4,923 TWh<br />
Oil 1%<br />
2030<br />
(<strong>Worldwatch</strong> Scenario)<br />
Total = 4,951 TWh<br />
Source: EIA, <strong>Worldwatch</strong><br />
Nuclear 20%<br />
Cogeneration 3%<br />
Other renewables 5%<br />
Hydro 6%<br />
Natural<br />
gas 19%<br />
Nuclear 19%<br />
Geothermal 5%<br />
Biomass 7%<br />
Nuclear 7%<br />
Hydro 7%<br />
Solar CSP 10%<br />
Wind 20% Solar PV 12%<br />
Note: “Other renewables” includes wind, biomass,<br />
geothermal, municipal solid waste, solar CSP, and solar.<br />
w w w . w o r l d w a t c h . o r g L O W - C A R B O N E N E R G Y : A R O A D M A P 27
Designing a New Energy System<br />
plants” that utilities now have to rely on. A<br />
smart grid would, of course, be needed for this<br />
to work most efficiently. The timetable for this<br />
transition has accelerated dramatically in the<br />
past few years as General Motors, Nissan, and<br />
Toyota have all announced plans to quickly<br />
bring plug-in cars to the market. 27<br />
Natural gas will also play an important role<br />
in the transition to low-carbon energy. Natural<br />
gas produces half the carbon dioxide per unit<br />
of energy that coal does, and because it can be<br />
used far more efficiently, natural gas permits as<br />
much as a 75 percent reduction in CO 2 emissions<br />
compared with coal. Ironically, then, the<br />
road to low-carbon energy actually involves<br />
increased use of natural gas over the next few<br />
decades—providing a less carbon-intensive<br />
transition fuel in applications where affordable<br />
renewable alternatives are not yet available.<br />
Natural gas resources have not been as heavily<br />
depleted as oil has, and analysts believe that<br />
substantial production increases are possible in<br />
the coming decades. 28 In the United States,<br />
which has moved much further down the<br />
depletion curve, production is now increasing<br />
sharply as the industry uses new technology to<br />
exploit extensive gas reserves found in shale<br />
rock in several parts of the country.<br />
Natural gas should be viewed as a premium<br />
fuel with an economic value that matches or<br />
exceeds oil and with an environmental profile<br />
that gives it a solid advantage over other fossil<br />
fuels. But much of the natural gas used today is<br />
effectively wasted—burned to produce lowtemperature<br />
heat to warm buildings and heat<br />
water, or consumed in an inefficient singlecycle<br />
power plant. In order to reduce CO 2<br />
emissions, both of those applications can be<br />
reduced substantially—as buildings are made<br />
more efficient; as solar energy, ground-source<br />
heat pumps, and biomass provide much of<br />
the energy for space and water heating; and as<br />
the least efficient natural gas-fired power<br />
plants are closed. This would free up large<br />
amounts of natural gas to fuel a new generation<br />
of high-efficiency CHP plants, particularly<br />
the distributed micro-power systems that<br />
could become ubiquitous in commercial and<br />
residential buildings.<br />
The ability to integrate new low-carbon<br />
energy sources into the existing energy infrastructure<br />
will speed the transition and reduce<br />
its cost. Already, wind power is being blended<br />
into many electric grids, while in the transport<br />
sector, ethanol is being added to gasoline in<br />
many countries. Brazil has made a particularly<br />
significant step toward flexibility by widely<br />
adopting cars that can be run on any mixture<br />
of ethanol and gasoline; drivers can make<br />
instant purchasing decisions based on the relative<br />
prices of the two fuels. 29 And natural gas<br />
can be gradually supplemented with methane<br />
biogas collected from landfills, livestock feedlots,<br />
and sewage treatment plants, which would<br />
have otherwise been released into the atmosphere.<br />
In Germany, methane biogas is already<br />
being added to the country’s natural gas<br />
pipelines. 30<br />
In the longer run, the natural gas that currently<br />
courses through the world’s gas<br />
pipelines may be replaced by hydrogen that is<br />
produced from a broad range of renewable<br />
resources—some of it coming from wind and<br />
solar electricity produced in off-peak hours.<br />
During the transition, hydrogen can be mixed<br />
with natural gas—a blend known as hythane—<br />
in the world’s gas pipelines. 31<br />
28<br />
L O W - C A R B O N E N E R G Y : A R O A D M A P w w w . w o r l d w a t c h . o r g
Jumpstarting a Revolution<br />
If a low-carbon energy economy is possible,<br />
the next question is how we get there<br />
from here. The road ahead will be long<br />
and expensive, but it has become a bit<br />
clearer thanks to the trailblazing initiatives of<br />
pioneering governments and companies over<br />
the past few years. A successful transition will<br />
nonetheless require a powerful combination<br />
of government policy changes, steady technological<br />
progress, and the rechanneling of private<br />
investment.<br />
It is instructive to remember that when oil<br />
was first discovered in western Pennsylvania in<br />
the 1860s, it was virtually useless—far more<br />
expensive than coal and, prior to the development<br />
of the refinery or internal combustion<br />
engine, useless for transportation. Even as<br />
crude oil became widely used for lighting in the<br />
late 19th century, the idea that it would become<br />
a dominant energy source—let alone reshape<br />
the global economy—was inconceivable.<br />
In 1907, only 8 percent of U.S. homes had<br />
electricity, Henry Ford had produced about<br />
3,000 vehicles in his four-year-old factory, and<br />
the mass-produced Model T wasn’t yet introduced.<br />
1 Similarly, when Thomas Edison introduced<br />
his improved lightbulb, skeptics<br />
dismissed it: “Everyone acquainted with the<br />
subject will recognize it as a conspicuous failure,”<br />
said the president of the Stevens<br />
<strong>Institute</strong>. 2 Few would have imagined that by<br />
the mid-20th century, virtually every American<br />
home—and billions of others around the<br />
world—would have electricity and lighting,<br />
and that the automobile would redefine<br />
lifestyles and the economy.<br />
Most economic transitions begin as almost<br />
imperceptible ripples that build into transformative<br />
waves. Dominant technologies and<br />
businesses are protected by a network of institutional<br />
and political support that effectively<br />
resists change. As a result, developers of new<br />
technologies and businesses must start by finding<br />
a niche market to exploit, meeting specialized<br />
needs at a higher cost. But over time, the<br />
new competitor becomes more economical<br />
and widens its share of the market, eventually<br />
undercutting the cost of the dominant player<br />
and gradually remolding the institutional<br />
infrastructure to meet its own needs. The<br />
transition from one generation of technology<br />
to another speeds up as the economic advantage<br />
flips.<br />
According to conventional wisdom, the<br />
energy sector is far from such a transformation.<br />
New renewable energy sources, including<br />
solar, wind, geothermal, and biomass, represent<br />
less than 4 percent of the total energy<br />
supply, and in 2008 total U.S. government support<br />
of renewable energy research and development<br />
(R&D) came to little more than $650<br />
million—about the amount the government<br />
spent in Iraq in a single day. 3 What these figures<br />
fail to capture is the recent infusion of<br />
private-sector capital and technology and the<br />
fact that today’s renewable energy pioneers are<br />
not limited to “energy technology” but rather<br />
draw on fields as diverse as semiconductor<br />
physics, biotechnology, aerodynamics, and<br />
computer engineering.<br />
Rapid growth has turned the new energy<br />
industries into lucrative businesses, with<br />
demand outrunning supply and profits soaring.<br />
An estimated $71 billion was invested in<br />
new renewable electric and heating capacity in<br />
2007, up from just $20 billion in 2002. 4 (See<br />
w w w . w o r l d w a t c h . o r g L O W - C A R B O N E N E R G Y : A R O A D M A P 29
Jumpstarting a Revolution<br />
Billion Dollars<br />
80<br />
60<br />
40<br />
20<br />
Figure 6. Annual Investment in New Renewable Energy<br />
Capacity, 1995–2007<br />
Note: Excludes large hydropower.<br />
Solar PV<br />
Other<br />
Source: REN21<br />
Wind Power<br />
0<br />
1995 1996 1997 1998 1999 2000 2001 2002 2003 2004 2005 2006 2007<br />
Figure 6.) Some of the world’s leading corporations<br />
have made major investments in<br />
renewable energy, including Applied Materials<br />
(solar PV), BP (wind and solar PV), General<br />
Electric (wind), DuPont (biofuels), Goldman<br />
Sachs (wind and concentrating solar), Mitsubishi<br />
(wind), Royal Dutch Shell (wind,<br />
hydrogen, and solar PV), Sharp (solar PV), and<br />
Siemens (wind). 5<br />
Corporate R&D on clean energy technologies<br />
reached $9.8 billion in 2007. 6 This is 15<br />
times U.S. government spending on renewable<br />
energy R&D in 2008. 7 A single company,<br />
Vestas Wind Systems, spent $169 million on<br />
R&D in 2007, while the U.S. government spent<br />
just over $50 million on wind R&D. 8 Even<br />
these comparisons understate private R&D,<br />
which is often embedded in commercial projects,<br />
and they exclude R&D investments by<br />
privately held companies, many of them<br />
funded with venture capital and other forms<br />
of equity investment. Venture capital and private<br />
equity investment in clean energy totaled<br />
$13.2 billion in 2007, 42 percent above the<br />
2006 level and 13 times the 2001 level. 9 By<br />
early 2007, these investments had helped create<br />
253 clean energy start-up companies with<br />
names such as Nanosolar, Celunol, SunPower,<br />
E3 Biofuels, and Miasole, most of them working<br />
to develop and commercialize new energy<br />
technologies. 10<br />
These tiny firms may be the real game<br />
changers, following in the footsteps of companies<br />
like Microsoft and Google, which quickly<br />
came to dominate their more established competitors,<br />
bringing a level of innovation that<br />
larger firms are rarely capable of. In Silicon<br />
Valley, clean energy has become the hottest<br />
new sector for entrepreneurs and investors.<br />
Venture capitalists typically make money by<br />
investing in technologies with small market<br />
shares but high growth potential. They like the<br />
energy sector because of its vast size—far<br />
larger than the I.T. sector—and the fact that<br />
there is a huge gap between the sluggish ways<br />
of the incumbent energy companies and the<br />
game-changing innovations being pursued by<br />
hundreds of upstart challengers. 11 Although it<br />
is regrettable that serious investment in renewable<br />
energy did not begin earlier, the science<br />
and technology available today will allow the<br />
industry to achieve performance and cost goals<br />
that would not have been possible in the past.<br />
The best example is solar photovoltaics,<br />
where producers are pursuing a host of strategies<br />
for reducing materials requirements, raising<br />
efficiency, and lowering manufacturing<br />
costs of the crystalline cells that dominate the<br />
market. Other companies are developing new<br />
thin-film photovoltaic materials that hold the<br />
promise of dramatic cost reductions. With<br />
demand outrunning supplies of PV materials<br />
in the past few years, price trends temporarily<br />
reversed their usual downward course. 12 But<br />
the industry is planning to increase its manufacturing<br />
capacity as much as eightfold over<br />
the next three years, and dramatic price<br />
declines are expected, spurring the industry to<br />
develop new applications and markets that<br />
would not be feasible today. 13<br />
Beyond the advance in technology, the economics<br />
of renewable energy will further<br />
improve as the scale of production grows—the<br />
same phenomenon that has successively turned<br />
televisions, personal computers, and mobile<br />
phones from specialty products for highincome<br />
technology pioneers into mass-market<br />
consumer devices. An analysis of production<br />
30<br />
L O W - C A R B O N E N E R G Y : A R O A D M A P w w w . w o r l d w a t c h . o r g
Jumpstarting a Revolution<br />
costs in several manufacturing industries by<br />
the Boston Consulting Group found that each<br />
time cumulative production of a manufactured<br />
device doubles, production costs fall by 20–30<br />
percent. 14 This is good news for clean energy<br />
industries: the manufacture of wind turbines<br />
has doubled in just the past three years, while<br />
the manufacture of solar cells has doubled in<br />
the last two. 15<br />
The combination of falling technology costs<br />
and rising fossil fuel prices has taken renewable<br />
energy to the threshold of economic competitiveness.<br />
Wind power is already less expensive<br />
than natural gas-fired power in the United<br />
States and nearly even with coal—even without<br />
accounting for the cost of CO 2 emissions. 16<br />
Solar power is on track to be economical both<br />
in wholesale grid and local retail markets<br />
within the next five years. 17 As these thresholds<br />
are crossed, they will fuel additional growth,<br />
expanding markets, reducing the need for government<br />
subsidies, and driving additional<br />
technology development and job creation.<br />
Advancing technology and rising energy<br />
prices have created an extraordinarily favorable<br />
market for new energy systems. But reaching a<br />
true economic tipping point will require new<br />
public policies and strong political leadership.<br />
Energy markets virtually everywhere are regulated,<br />
heavily subsidized, inefficient, and rarely<br />
predictable. What happens to the energy economy,<br />
and to the world’s climate, in the years<br />
ahead will be heavily influenced by hundreds<br />
of policy decisions made at international,<br />
national, and local levels—and whether these<br />
new policies can be sustained.<br />
Many energy economists argue that the reason<br />
fossil fuels dominate today is their inherently<br />
lower cost compared with the<br />
alternatives. This suggests that internalizing<br />
environmental costs by putting a price on carbon—likely<br />
through a carbon dioxide tax or a<br />
regulatory cap on emissions such as the one in<br />
Europe—would solve the climate problem.<br />
Getting the price signals right is an essential<br />
step, but its limits are demonstrated by the<br />
modest impact that the increase in average oil<br />
prices from $30 in 2003 to nearly $100 in 2008<br />
has had on petroleum consumption. 18 That<br />
increase is equivalent to a CO 2 price of $170<br />
per ton; by comparison, the October 2008<br />
price of an emission allowance in Europe was €<br />
€23.5 ($32) per ton. 19 This suggests that any<br />
carbon pricing system likely to be politically<br />
feasible in the next decade or so would have a<br />
relatively minor impact on energy investment<br />
decisions. To be effective, climate policy will<br />
need to address not just the price of emissions<br />
but the failures of energy markets that limit the<br />
ability of prices to send a clear signal.<br />
The neoclassical economic model assumes<br />
an economically frictionless world in which<br />
buyers and sellers have all the information and<br />
capital they need, and there are no serious barriers<br />
to the introduction of new technologies.<br />
Economic research beginning in the 1920s has<br />
shown that the costs of transactions can greatly<br />
limit the effectiveness of markets, while other<br />
research suggests that economic behavior often<br />
fails to follow neoclassical rules. Nobel laureate<br />
economist Douglass North has shown that<br />
laws, customs, and social priorities greatly<br />
influence the working of the economy. 20 Without<br />
them, most markets would work inefficiently<br />
if at all.<br />
Because energy markets have been shaped<br />
more than most others by government policy,<br />
institutional constraints, and the power of<br />
large industrial enterprises, simple economic<br />
theory provides minimal insight about how to<br />
spur change. The electric power industry is<br />
particularly far from the neoclassical model,<br />
governed as it is by extensive government regulation<br />
that is intended to facilitate development<br />
of large, reliable electric systems, with<br />
one company dominating most local grids and<br />
in some cases owning the transmission lines<br />
and power plants as well. Although this economic<br />
model has been broadly successful in<br />
delivering affordable electricity to billions of<br />
people, it has done so mainly by making it easy<br />
to add energy supply—but providing much<br />
less incentive or opportunity to improve<br />
energy efficiency. Regulations have also favored<br />
large fuel-intensive generators at the expense<br />
of smaller, capital-intensive units. The result is<br />
an electricity system that is far from the economic<br />
ideal—and one that will require major<br />
w w w . w o r l d w a t c h . o r g L O W - C A R B O N E N E R G Y : A R O A D M A P 31
Jumpstarting a Revolution<br />
reforms if it is to maximize economic efficiency,<br />
let alone account for the massive environmental<br />
externalities represented by global<br />
climate change.<br />
In a traditionally regulated system, where a<br />
utility produces and distributes electricity at a<br />
fixed rate of return, profits are determined in<br />
part by the amount of power sold. This naturally<br />
makes such utilities proponents of<br />
demand growth—the more electricity consumers<br />
buy, the more profitable the utility is.<br />
And as long as the regulator approves, there is<br />
no risk in building a power plant since there<br />
are no competitors, and costs are borne by the<br />
consumer. The utility also bears little risk if the<br />
plant burns a fuel whose price is volatile—fuel<br />
adjustment clauses allow price increases also to<br />
be passed to the customer. Although consumers<br />
should in theory be interested in making<br />
investments in energy efficiency whenever<br />
it is economical, they face many obstacles,<br />
including a lack of capital to invest in conservation<br />
and a lack of information about which<br />
investments make sense. Perceiving the lack of<br />
demand, potential manufacturers and<br />
installers of energy-efficient equipment have<br />
little incentive to scale up production or build<br />
businesses that would facilitate efficiency<br />
improvements.<br />
One of the easiest ways to overcome these<br />
kinds of market barriers is via simple government<br />
mandates. Since the 1970s, many governments<br />
have required that home appliances,<br />
motor vehicles, and buildings meet minimum<br />
efficiency standards in order to be sold, and<br />
these standards have been gradually ratcheted<br />
up over time. Additional tightening is now in<br />
order, and governments are moving quickly in<br />
that direction. Average auto efficiency standards,<br />
for example, have recently been<br />
increased to 47 miles per gallon in Japan and<br />
49 mpg in Europe. 21 Meanwhile, the U.S. Congress<br />
tightened its standard to 35.7 miles per<br />
gallon by 2015, up from the 27.5 mpg standard<br />
that has been in place for the past two<br />
decades. 22<br />
Another approach to requiring efficiency<br />
can be seen in the law passed in Australia in<br />
2007 to phase out the use of most incandescent<br />
light bulbs, which would be replaced by compact<br />
fluorescent bulbs that are four times as<br />
efficient. 23 Since then, several other countries<br />
have also committed to phasing out incandescent<br />
bulbs. 24<br />
Government mandates are also being used<br />
to compel the construction of more energyefficient<br />
buildings and to require the introduction<br />
of renewable energy into electricity grids<br />
as well as the markets for liquid fuels. Several<br />
national governments and 26 states in the<br />
United States now have binding “renewable<br />
portfolio standards” requiring that specified<br />
amounts of renewable electricity be added to<br />
their grids. 25 In Spain, a 2006 update of building<br />
codes requires all new buildings to incorporate<br />
solar water heaters. 26 As of April 2008,<br />
the state government of Baden-Wurttemberg,<br />
Germany, requires that 20 percent of new<br />
buildings’ heating requirements be met with<br />
renewable energy. 27 And Brazil, the United<br />
States, and the European Union are among the<br />
jurisdictions that require that a minimum proportion<br />
of biofuels be blended with gasoline<br />
and diesel fuel, spurring growth in their use. 28<br />
Such mandates are essential for patching<br />
some of the holes in a market economy, but<br />
they are at best blunt instruments that cannot<br />
by themselves harness the full power of the<br />
market to effect change. While they ensure that<br />
minimum standards are met, they give no<br />
incentive for achieving the best possible efficiencies<br />
and the lowest possible emissions. One<br />
way to provide that kind of incentive is to decouple<br />
electric utilities’ profits from the<br />
amount of power they sell by introducing a<br />
regulatory formula that instead rewards utilities<br />
for providing the best service at the least<br />
cost. California regulators have already made<br />
this change; as a result of this and other policies,<br />
Californians use less than half as much<br />
electricity per person as other Americans do. 29<br />
(See Figure 7.)<br />
Spurred by the recent rise in fuel costs—and<br />
consequently in power prices—electric utilities<br />
have taken a fresh look at energy efficiency as a<br />
strategic investment, something that was last in<br />
favor in the 1980s. This time, the utilities and<br />
their regulators are working together, looking<br />
32<br />
L O W - C A R B O N E N E R G Y : A R O A D M A P w w w . w o r l d w a t c h . o r g
Jumpstarting a Revolution<br />
for ways to align the utilities’ profit motives<br />
with what is needed to reduce customers’<br />
power bills and reduce power plant emissions.<br />
Duke Energy has estimated that utility efficiency<br />
programs will be 10 percent less expensive<br />
than any new source of supply, and has<br />
requested that the North Carolina Utility<br />
Commission allow it to earn a return on 90<br />
percent of the costs avoided via its efficiency<br />
investments. 30 The California Public Utilities<br />
Commission has made similar recent adjustments,<br />
and Pacific Gas and Electric plans to<br />
invest $1 billion in improved energy<br />
efficiency. 31<br />
John Hoffman, an energy efficiency expert<br />
and former U.S. Environmental Protection<br />
Agency official, has proposed an additional<br />
strategy for spurring efficiency investments: a<br />
“transaction bridge” that allows manufacturers<br />
and installers to share in the savings derived<br />
from installing more-efficient equipment in<br />
buildings. 32 This would motivate them to continually<br />
develop better technologies, to work<br />
with utilities to accelerate the development of<br />
new markets, and to scale up both production<br />
and installation in order to lower cost. This<br />
mechanism could also be used to spur introduction<br />
of micro-power technologies such as<br />
photovoltaics, as well as ground-source heat<br />
pumps. And Hoffman has proposed a similar<br />
system for motivating the production and sales<br />
of efficient vehicles.<br />
European governments have developed<br />
another economic tool to spur investment in<br />
renewable energy. In 1979, the Danish government<br />
ordered utilities to give small wind turbines<br />
access to the electric grid and to pay a<br />
higher price for the renewable electricity they<br />
purchased. This law and successive regulations<br />
that established set purchase prices for renewable<br />
power stopped utilities from thwarting<br />
potential competitors, and over two decades<br />
they reduced Denmark’s dependence on fossil<br />
fuels and made the country a leading generator<br />
of wind and biopower. 33<br />
Germany and Spain adopted similar market-access<br />
laws (called feed-in tariffs, or renewable<br />
energy payments) in the 1990s, and they<br />
too moved quickly into the leading ranks of<br />
renewable energy development. 34 Over time,<br />
the prices governments set have been adjusted<br />
downward as the cost of renewable technologies<br />
has fallen. As a result of this law, Germany,<br />
which by international standards has a<br />
mediocre endowment of renewable resources,<br />
Annual Consumption<br />
(megawatt-hours per person)<br />
15<br />
12<br />
9<br />
6<br />
3<br />
Figure 7. Electricity Use Per Capita in California and Rest<br />
of United States, 1960–2007<br />
Source: CEC, DOE, Census Bureau<br />
0<br />
1960 1971 1983 1995 2007<br />
has increased the renewable share of its electricity<br />
supply from just under 5 percent in 1998<br />
to over 14 percent today. 35 This reduced CO 2<br />
emissions from the nation’s power sector by 79<br />
million tons in 2007—enough to cut emissions<br />
from the power sector by 18 percent and total<br />
national emissions by nearly 10 percent. 36<br />
Other countries with a larger renewable<br />
resource base are entering the market at a time<br />
when renewable energy technologies are more<br />
mature. They should, with the right policies, be<br />
able to move even faster. China’s renewable<br />
energy markets have grown far more rapidly in<br />
the past few years than European markets did<br />
at their peak growth rates in the 1990s. In the<br />
United States, the market for wind turbines has<br />
tripled in the past three years, and the market<br />
for solar power is right behind. 37<br />
The economic opportunities presented by<br />
the booming market for new energy technologies<br />
have dramatically increased political support<br />
for these alternatives, which in turn is<br />
driving further growth. This dynamic can be<br />
Rest of United States<br />
California<br />
w w w . w o r l d w a t c h . o r g L O W - C A R B O N E N E R G Y : A R O A D M A P 33
Jumpstarting a Revolution<br />
seen clearly in the United States, where governors<br />
in states such as Iowa, Michigan, Ohio,<br />
and Pennsylvania are working to revive their<br />
economies by attracting the solar, wind, bioenergy,<br />
and electric car industries. By 2006, the<br />
U.S. renewables industry had created 386,000<br />
jobs, compared with 82,000 jobs in the coal<br />
industry. 38 Worldwide, the renewables industries<br />
had created 2.3 million jobs by 2006. 39<br />
(See Table 4.)<br />
Table 4. Estimated Employment in the Renewable Energy Sector,<br />
2006<br />
Renewable Energy Source World* Selected Countries<br />
Biomass 1,174,000 Brazil 500,000<br />
United States 312,200<br />
China 266,000<br />
Germany 95,400<br />
Spain 10,349<br />
Solar Thermal 624,000-plus China 600,000<br />
Germany 13,300<br />
Spain 9,142<br />
United States 1,900<br />
Wind 300,000 Germany 82,100<br />
United States 36,800<br />
Spain 35,000<br />
China 22,200<br />
Denmark 21,000<br />
India 10,000<br />
Solar PV 170,000 ** China 55,000<br />
Germany 35,000<br />
Spain 26,449<br />
United States 15,700<br />
Hydropower 39,000-plus Europe 20,000<br />
United States 19,000<br />
Geothermal 25,000 United States 21,000<br />
Germany 4,200<br />
* Countries for which information is available.<br />
** Under the assumption that Japan’s PV industry employs roughly as many people as<br />
Germany’s PV industry.<br />
Source: See Endnote 39 for this section.<br />
Growing political support for green energy<br />
provides further evidence that the world may<br />
be on the verge of a major transformation of<br />
energy markets. The powerful interaction of<br />
advancing technology, private investment, and<br />
policy reform has led to a pace of change<br />
unseen since men like Thomas Edison and<br />
Henry Ford created the last great energy revolution<br />
a century ago. But is it enough Will the<br />
coming years bring the accelerated change and<br />
trillions of dollars of investment that Nicholas<br />
Stern, the International Energy Agency, and<br />
others estimate is needed to reverse the tide of<br />
climate change 40<br />
The answer to that question will likely be<br />
found not in the messy world of economics<br />
but in the even messier world of politics. Can<br />
the enormous power of today’s industries be<br />
set aside in favor of the common good As<br />
negotiations continue on the international climate<br />
agreement that will follow the first commitment<br />
period of the Kyoto Protocol, which<br />
ends in 2012, the world’s political will to tackle<br />
climate change will be put to an early test. The<br />
politics of climate change are advancing more<br />
rapidly than could have been imagined a few<br />
years ago. But time is growing short.<br />
The world has not yet reached the political<br />
tipping point that would ensure the kind of<br />
economic transformation that is required. But<br />
there are growing indications that it is near. In<br />
the summer of 2008, T. Boone Pickens, a<br />
prominent Texas oil tycoon, proposed deploying<br />
massive wind farms in the Great Plains to<br />
provide at least a fifth of U.S. electricity. 41 A<br />
couple of weeks later, former vice president Al<br />
Gore proposed shutting down all uncontrolled<br />
U.S. coal-fired power plants within a decade<br />
and replacing them mainly with renewables. 42<br />
Then, in early October, Google proposed ending<br />
coal-fired generation in the United States<br />
by 2030, spending $4 trillion to replace it with<br />
efficiency and renewables, with the goal of<br />
making renewables cheaper than coal. 43 In a<br />
speech announcing the plan, Google CEO Eric<br />
Schmidt said, “I’m a computer scientist, and<br />
computer scientists love scale problems.” 44<br />
A week later, the International Energy<br />
Agency, which has for decades dismissed<br />
34<br />
L O W - C A R B O N E N E R G Y : A R O A D M A P w w w . w o r l d w a t c h . o r g
Jumpstarting a Revolution<br />
World's largest solar<br />
energy plant, in<br />
California’s Mojave<br />
Desert.<br />
NREL<br />
renewables as niche sources of energy, called<br />
for these sources to supply half of global electricity<br />
by 2050. “Governments need to do<br />
more,” said Executive Director Nobuo Tanaka.<br />
“Setting a carbon price is not enough. To foster<br />
a smooth and efficient transition of renewables<br />
towards mass market integration, renewable<br />
energy policies should be designed around a<br />
set of fundamental principles, inserted into<br />
predictable, transparent, and stable policy<br />
frameworks [in order to] make the energy<br />
technology revolution happen.” 45<br />
The biggest question for the world’s climate<br />
is whether the energy revolution in industrial<br />
nations will take hold in developing countries<br />
as well. China has already passed the United<br />
States in annual CO 2 emissions, and the developing<br />
world as a whole is on course to produce<br />
the majority of global emissions within the<br />
next decade. Conventional wisdom holds that<br />
developing countries are too poor and lack the<br />
technical sophistication to adopt state-of-theart<br />
energy systems. While superficially convincing,<br />
this argument misses the fact that<br />
although the new energy systems are different—and<br />
will require adaptation by both governments<br />
and the private sector—they are in<br />
the end better matched to the indigenous<br />
resources and capabilities that most developing<br />
countries possess. Renewable technologies and<br />
efficiency will allow developing countries to<br />
increase their reliance on indigenous resources<br />
and reduce their dependence on expensive and<br />
unstable imported fuels. Around the world,<br />
new energy systems could become a huge<br />
engine of economic development and job creation,<br />
opening vast economic opportunities for<br />
developing countries. And the total cost in the<br />
long term will likely be less than following the<br />
current, carbon-laden path.<br />
China is beginning to show the way forward.<br />
Even as it continues to build coal-fired<br />
power plants at the fastest pace in human history—roughly<br />
two per week—the country has<br />
suddenly emerged as a clean energy leader. 46<br />
New laws enacted since 2004 have jumpstarted<br />
the energy-efficiency and renewable energy<br />
industries in China, in some cases creating new<br />
industries from scratch. China now leads the<br />
world in solar water heating, small hydropower,<br />
and the manufacture of efficient CFL<br />
light bulbs. 47 It was among the top producers<br />
of solar cells and the third largest installer of<br />
wind turbines in 2007, and is on track to lead<br />
both sectors by 2010. 48 China is meanwhile<br />
making great strides in its efforts to be a leader<br />
w w w . w o r l d w a t c h . o r g L O W - C A R B O N E N E R G Y : A R O A D M A P 35
Jumpstarting a Revolution<br />
in green buildings and green cars—persuading<br />
U.S. billionaire Warren Buffett in 2008 to<br />
invest $230 million in BYD, a Chinese battery<br />
manufacturer that plans to mass market a<br />
hybrid electric car. 49<br />
Other developing countries lack many of<br />
the extraordinary capabilities that China has<br />
demonstrated. But if China shifts away from<br />
its coal-based energy path to one that favors<br />
efficiency and renewables, it will have an enormous<br />
impact on the global economy, and<br />
will inevitably pull other countries into its<br />
orbit. Developing countries that pay little<br />
attention to what happens in Europe or the<br />
United States may be more influenced by the<br />
policy choices made in Beijing. And the dramatic<br />
cost reductions in renewable energy<br />
technologies that China is likely to spur will<br />
make it much easier for developing nations to<br />
adopt those technologies.<br />
Tipping points are easier to decipher in retrospect<br />
than in advance. No one can say for sure<br />
whether the substantial shifts in energy markets<br />
and energy policies over the past few years are<br />
the precursors to a revolution. Just as the events<br />
of the past few years have surprised us, so will<br />
those ahead. And the financial crisis now breaking<br />
over the global economy will likely have<br />
profound impacts on energy markets.<br />
Even with those substantial caveats, the evidence<br />
presented in this report suggests that<br />
when historians look back on 2008, they will<br />
conclude that a 21st-century energy revolution<br />
was well under way. Whether they will also be<br />
able to say that the world was able to avert catastrophic<br />
climate change will be determined by<br />
the decisions we make in the decade ahead.<br />
Urgency and vision are the twin pillars on<br />
which humanity’s hope now hangs.<br />
36<br />
L O W - C A R B O N E N E R G Y : A R O A D M A P w w w . w o r l d w a t c h . o r g
Endnotes<br />
The Road to Low-Carbon Energy<br />
1. James Hansen, presentation at “Global Warming 20<br />
Years Later,” <strong>Worldwatch</strong> <strong>Institute</strong> event, Washington, DC,<br />
23 June 2008.<br />
2. <strong>Worldwatch</strong> estimate based on G. Marland, T.A.<br />
Boden, and R.J. Andres, “Global, Regional, and National<br />
Fossil Fuel CO2 Emissions,” in Carbon Dioxide<br />
Information Analysis Center, Trends: A Compendium of<br />
Data on Global Change (Oak Ridge, TN: Oak Ridge<br />
National Laboratory, U.S. Department of Energy, 2007)<br />
3. James Hansen et al.,“Dangerous Human-made<br />
Interference with Climate: A GISS ModelE Study,”<br />
Atmospheric Chemistry and Physics, vol. 7, no. 9 (2007);<br />
W.L. Hare, “A Safe Landing for the Climate,” in<br />
<strong>Worldwatch</strong> <strong>Institute</strong>, State of the World 2009 (New York:<br />
W. W. Norton & Company, forthcoming).<br />
4. Author’s estimate.<br />
5. Public Broadcasting Service, “John Gardner–Engineer<br />
of the Great Society,”<br />
www.pbs.org/johngardner/chapters/4.html, viewed 10<br />
October 2008.<br />
Avoiding Catastrophe<br />
1. “Summary for Policymakers,” in Intergovernmental<br />
Panel on Climate Change (IPCC), Climate Change 2007:<br />
The Physical Science Basis (New York: Cambridge<br />
University Press, 2007), p. 2.<br />
2. Figure 1 from the following: K. W. Thoning et al.,<br />
Atmospheric Carbon Dioxide Dry Air Mole Fractions from<br />
Quasi-continuous Measurements at Barrow, Alaska; Mauna<br />
Loa, Hawaii; American Samoa; and South Pole, 1973–2006<br />
(Boulder, CO: Earth System Research Laboratory, U.S.<br />
National Oceanic and Atmospheric Administration,<br />
October 2007); C. D. Keeling and T. P. Whorf,<br />
“Atmospheric CO2 Records from Sites in the SIO Air<br />
Sampling Network,” and A. Neftel et al., “Historical CO2<br />
Record from the Siple Station Ice Core,” both in Carbon<br />
Dioxide Information Analysis Center (CDIAC), Trends: A<br />
Compendium of Data on Global Change (Oak Ridge, TN:<br />
Oak Ridge National Laboratory, U.S. Department of<br />
Energy (U.S. DOE), 2007). Estimate of 430 ppm from<br />
Nicholas Stern, The Economics of Climate Change: The<br />
Stern Review (Cambridge, U.K.: Cambridge University<br />
Press, 2007), p. 2.<br />
3. E. Jansen et al., “Palaeoclimate,” in IPCC, op. cit. note<br />
1, p. 449.<br />
4. James Hansen, presentation at “Global Warming 20<br />
Years Later,” <strong>Worldwatch</strong> <strong>Institute</strong> event, Washington, DC,<br />
23 June 2008.<br />
5. M. Serreze et al., “Perspectives on the Arctic’s<br />
Shrinking Sea-Ice Cover,” Science, 16 March 2007, pp.<br />
1533–36.<br />
6. IPCC, op. cit. note 1, pp. 212, 543–44.<br />
7. Ibid., pp. 350–52.<br />
8. Ibid., pp. 342, 537.<br />
9. Stern, op. cit. note 2, p. 285.<br />
10. Alan Greenspan, The Age of Turbulence: Adventures in<br />
a New World (New York: Penguin Press, 2007).<br />
11. <strong>Worldwatch</strong> estimate based on G. Marland, T.A.<br />
Boden, and R.J. Andres, “Global, Regional, and National<br />
Fossil Fuel CO2 Emissions,” in CDIAC, op. cit. note 2;<br />
shares of coal, oil, and natural gas from BP, Statistical<br />
Review of World Energy (London: 2007).<br />
12. IPCC, op. cit. note 1.<br />
13. Marland, Boden, and Andres, op. cit. note 11.<br />
14. International Energy Agency (IEA), Key World Energy<br />
Statistics (Paris: 2008), p. 6.<br />
15. T. Barker et al., “Technical Summary,” in IPCC,<br />
Climate Change 2007: Mitigation (New York: Cambridge<br />
University Press, 2007), p. 39; James Hansen et al.,<br />
“Dangerous Human-made Interference with Climate: A<br />
GISS ModelE Study,” Atmospheric Chemistry and Physics,<br />
vol. 7, no. 9 (2007); W.L. Hare, “A Safe Landing for the<br />
Climate,” in <strong>Worldwatch</strong> <strong>Institute</strong>, State of the World 2009<br />
(New York: W. W. Norton & Company, forthcoming).<br />
16. Figure of 0.8 degrees Celsius is the midpoint of estimates<br />
of warming, as reported in IPCC, op. cit. note 1, p.<br />
5.<br />
17. Hansen et al., op. cit. note 15; Hansen, op. cit. note 4.<br />
18. Ibid.<br />
19. Commission of the European Communities,<br />
"Communication from the Commission to the Council,<br />
the European Parliament, the European Economic and<br />
Social Committee and the Committee of the Regions:<br />
Limiting Global Climate Change to 2 Degrees Celsius:<br />
The Way Ahead for 2020 and Beyond (Brussels: 10<br />
January 2007); Group of Eight, Hokkaido Toyako Summit<br />
w w w . w o r l d w a t c h . o r g L O W - C A R B O N E N E R G Y : A R O A D M A P 37
Endnotes<br />
Leaders Declaration (Hokkaido Toyako, Japan: 8 July<br />
2008), para 23.<br />
20. James Hansen et al., “Target Atmospheric CO2:<br />
Where Should Humanity Aim” unpublished paper for<br />
the U.S. National Aeronautics and Space Administration,<br />
June 2008; Hare, op. cit. note 15.<br />
21. Table 1 derived from the following sources: “businessas-usual”<br />
case described in IEA, Energy Technology<br />
Perspectives—Scenarios and Strategies to 2050 (Paris:<br />
2008), pp. 64, 113; “stabilization” scenario based on<br />
Category II emission mitigation scenarios described in<br />
Barker et al., op. cit. note 15, on G. A. Meehl, “Global<br />
Climate Projections,” in IPCC, op. cit. note 1, and on<br />
<strong>Worldwatch</strong> calculations using world GDP from<br />
International Monetary Fund (IMF), World Economic<br />
Outlook Database, April 2008. Annual energy growth<br />
from F. Bressand et al., Curbing Global Energy Demand<br />
Growth: The Energy Productivity Opportunity (San<br />
Francisco: McKinsey Global <strong>Institute</strong>, May 2007), p. 13.<br />
22. U.S. DOE, International Energy Outlook 2008<br />
(Washington, DC: 2008), pp. 7, 93.<br />
23. Barker et al., op. cit. note 15, pp. 39, 42.<br />
24. Carbon emissions derived from BP, op. cit. note 11,<br />
and from Marland, Boden, and Andres, op. cit. note 11.<br />
25. Marland, Boden, and Andres, op. cit. note 11.<br />
26. Joanna Lewis, Georgetown University, “China: Energy<br />
Use, Emissions Trends, and Forecasts,” presentation to the<br />
U.S.-China Climate Dialogue, sponsored by the Center<br />
for American Progress, the Heinrich Boell Foundation,<br />
and the <strong>Worldwatch</strong> <strong>Institute</strong>, Washington, DC, 16<br />
September 2008.<br />
27. Table 2 calculated by <strong>Worldwatch</strong> from the following<br />
sources: BP, op. cit. note 11; Marland, Boden, and Andres,<br />
op. cit. note 11; United Nations Population Division,<br />
World Population Prospects: The 2006 Revision and World<br />
Urbanization Prospects: The 2005 Revision, at<br />
http://esa.un.org/unpp, viewed 7 July 2008; IMF, World<br />
Economic Outlook (Washington, DC: April 2008).<br />
28. Bressand et al., op. cit. note 21.<br />
29. Figure of 15 billion tons based on the goal to reduce<br />
emissions by at least 50 percent by 2050, per Group of<br />
Eight, op. cit. note 19, and on 2007 world carbon dioxide<br />
emissions from Table 2, op. cit. note 27.<br />
30. <strong>Worldwatch</strong> <strong>Institute</strong> estimate.<br />
31. S. Pacala and R. Socolow, “Stabilization Wedges:<br />
Solving the Climate Problem for the Next 50 Years with<br />
Current Technologies,” Science, 13 August 2004, pp.<br />
968–72.<br />
32. National Petroleum Council, Facing the Hard Truths<br />
About Energy (Washington, DC: July 2007), pp. 127, 135.<br />
33. Ibid., p. 127.<br />
34. IEA, “Electricity/Heat in World in 2005,” at<br />
www.iea.org/Textbase/stats/electricitydata.aspCOUNTRY<br />
_CODE=29&Submit=Submit, viewed 3 October 2008.<br />
35. IPCC Working Group III, IPCC Special Report on<br />
Carbon Dioxide Capture and Storage (New York:<br />
Cambridge University Press, 2005), pp. 201–04; MIT<br />
Energy Initiative, The Future of Coal: Options for a<br />
Carbon-Constrained World (Cambridge, MA:<br />
Massachusetts <strong>Institute</strong> of Technology, 2007), p. 42.<br />
36. MIT Energy Initiative, op. cit. note 35, pp. 52–54.<br />
37. Ibid., pp. xi–xii.<br />
A Convenient Truth<br />
1. U.S. Vice President Dick Cheney, remarks at the<br />
Annual Meeting of the Associated Press (Toronto,<br />
Canada: 30 April 2001).<br />
2. U.S. Department of Energy (U.S. DOE), Monthly<br />
Energy Review (Washington, DC: October 2008), p. 16.<br />
3. International Energy Agency (IEA), Energy<br />
Technology Perspectives – Scenarios and Strategies to 2050,<br />
(Paris: 2008), pp. 68–82; U.S. DOE, Table E.1 in<br />
International Energy Annual 2004 (Washington, DC:<br />
2006); BP, Statistical Review of World Energy (London:<br />
2007).<br />
4. G. Kaiper, US Energy Flow Trends—2002 (Livermore,<br />
CA: Lawrence Livermore National Laboratory, 2004).<br />
5. Daniel H. Rosen and Trevor Houser, China Energy: A<br />
Guide for the Perplexed (Washington, DC: Center for<br />
Strategic and International Studies and the Peterson<br />
<strong>Institute</strong> for International Economics, May 2007).<br />
6. G. Marland, T.A. Boden, and R. J. Andres, “Global,<br />
Regional, and National Fossil Fuel CO2 Emissions,” in<br />
Trends: A Compendium of Data on Global Change. Carbon<br />
Dioxide Information Analysis Center (Oak Ridge, TN: Oak<br />
Ridge National Laboratory, U.S. DOE, 2007); BP,<br />
Statistical Review of World Energy, (London: 2008);<br />
European Communities, EU Energy and transport in figures,<br />
Statistical Pocketbook 2007/2008 (Brussels: 2008);<br />
International Monetary Fund, World Economic Outlook<br />
Database, April 2008; United Nations Population<br />
Division, World Population Prospects: The 2006 Revision<br />
and World Urbanization Prospects: The 2005 Revision, at<br />
http://esa.un.org/unpp, viewed 7 July 2008.<br />
7. Ma Kai, Minister of National Development and<br />
Reform Commission, “The 11th Five-Year Plan: Targets,<br />
Paths and Policy Orientation,” March 2006, at<br />
http://english.gov.cn/2006-03/23/content_234832.htm.<br />
8. Energy Star, “Compact Fluorescent Light Bulbs,”<br />
www.energystar.gov/index.cfmc=cfls.pr_cfls, viewed 6<br />
October 2008.<br />
9. L. J. Sandahl et al., Compact Fluorescent Lighting in<br />
America: Lessons Learned on the Way to Market (Richland,<br />
WA: Pacific Northwest National Laboratory, June 2006).<br />
10. Peter Du Pont, “Asian Energy Trends and Prospects<br />
for Energy Efficiency,” USAID ECO-Asia presentation at<br />
TBLI Asia Conference, Bangkok, Thailand, 29 May 2008.<br />
11. David Ryan, Energy Star, U.S. Environmental<br />
Protection Agency (EPA), e-mail to Nathan Swire,<br />
<strong>Worldwatch</strong> <strong>Institute</strong>, 25 August 2008. Data based on<br />
trade information from the U.S. International Trade<br />
Commission.<br />
12. Japan and Germany from Sandahl et al., op. cit. note<br />
38<br />
L O W - C A R B O N E N E R G Y : A R O A D M A P w w w . w o r l d w a t c h . o r g
Endnotes<br />
9, p. 1.3; United States from EPA, “EPA and DOE Spread<br />
a Bright Idea: Energy Star Light Bulbs Are Helping to<br />
Change the World,” press release (Washington, DC: 15<br />
January 2008).<br />
13. United Nations Environment Programme (UNEP),<br />
International Environmental Technology Centre, Energy<br />
and Cities: Sustainable Building and Construction (Osaka,<br />
Japan: 2003), p. 1.<br />
14. Ibid.<br />
15. F. Bressand et al., Curbing Global Energy Demand<br />
Growth: The Energy Productivity Opportunity (San<br />
Francisco: McKinsey Global <strong>Institute</strong>, May 2007).<br />
16. Half or less from U.S. DOE, Energy Efficiency and<br />
Renewable Energy, “Technology Fact Sheet: Resources for<br />
Whole Building Design,” GHG Management Workshop,<br />
25–26 February 2003, p. 11.<br />
17. Satish Kumar, Chief of Party, U.S. Agency for<br />
International Development, ECO-III Project in India,<br />
presentation for panel “Harnessing the Power of the<br />
Public Purse,” at Energy Efficiency Global Forum,<br />
Washington, DC, 14 November 2007.<br />
18. William Moomaw and Charles Bralber, Scaling<br />
Alternative Energy: The Role of Emerging Markets,<br />
Dialogue Synthesis Report (Medford, MA: The Fletcher<br />
School, Tufts University, 2008).<br />
19. U.S. Green Building Council, “About USGBC,”<br />
www.usgbc.org/DisplayPage.aspxCMSPageID=124,<br />
viewed 26 September 2008.<br />
20. “Information on Passive Houses,”<br />
www.passivhaustagung.de/Passive_House_E/passiveh<br />
ouse.html, viewed 30 July 2008.<br />
21. Ministry of Housing and Urban-Rural Development<br />
of the People’s Republic of China, “Notice on Strict<br />
Execution of the Design Standard of Energy<br />
Conservation in New Residential Buildings,” 15 April<br />
2005, available at www.cin.gov.cn; State Council of the<br />
People’s Republic of China, “Regulations on Energy<br />
Conservation for Civil Buildings,” 1 August 2008, available<br />
at www.cin.gov.cn.<br />
22. European Parliament, “Action Plan for Energy<br />
Efficiency: Realising the Potential” (Brussels: 31 January<br />
2008).<br />
23. Chris Goodall, “The Rebound Effect,” Carbon<br />
Commentary, 11 November 2007; Steve Sorrell, UK<br />
Energy Research Centre, University of Strathclyde,<br />
Glasgow, Scotland, “The Rebound Effect: Overview of<br />
Existing Research,” PowerPoint presentation, 28 February<br />
2008; Frank Gottron, Energy Efficiency and the Rebound<br />
Effect: Does Increasing Efficiency Decrease Demand<br />
(Washington, DC: Congressional Research Service, 30<br />
July 2001).<br />
24. B. Griffith et al., Assessment of the Technical Potential<br />
for Achieving Zero-Energy Commercial Buildings (Golden,<br />
CO: National Renewable Energy Laboratory, 2006);<br />
Bressand et al., op. cit. note 15, p. 13; Rocky Mountain<br />
<strong>Institute</strong>, “Beating the Energy Efficiency Paradox (Part I),”<br />
Treehugger.com, May 2008.<br />
25. U.K. Department of Communities and Local<br />
Government, Building A Greener Future: Towards Zero<br />
Carbon Development (London: December 2006).<br />
26. David G. Fridley, Nina Zheng, and Nan Zhou,<br />
Estimating Total Energy Consumption and Emissions of<br />
China’s Commercial and Office Buildings (Berkeley, CA:<br />
Lawrence Berkeley National Laboratory, March 2008), p.<br />
1.<br />
27. Thomas Casten, “Recycling Energy to Reduce Costs<br />
and Mitigate Climate Change,” in Michael MacCracken,<br />
Frances Moore, and John C. Topping, Jr., eds., Sudden and<br />
Disruptive Climate Change (Sterling, VA: Earthscan,<br />
2008), pp. 247–48; IEA, Combined Heat and Power:<br />
Evaluating the Benefits of Greater Global Investment (Paris:<br />
2008), p. 10.<br />
28. IEA, “Electricity/Heat in Japan in 2005,”<br />
www.iea.org/Textbase/stats/electricitydata.aspCOUNTRY<br />
_CODE=JP, and IEA, “Electricity/Heat in United States in<br />
2005,”<br />
www.iea.org/Textbase/stats/electricitydata.aspCOUNTRY<br />
_CODE=US, both viewed 29 September 2008.<br />
29. IEA, op. cit. note 27, p. 10.<br />
30. Ibid.<br />
31. Ibid.<br />
32. Ibid; Bruce Hedman, Energy and Environmental<br />
Analysis, Inc., “The Role of CHP in the Nation’s Energy<br />
System,” presentation at U.S. Clean Heat and Power<br />
Association annual meeting, 3 October 2007.<br />
33. Bressand et al., op. cit. note 15, pp. 9–10.<br />
34. Ibid.<br />
No-Carbon Energy<br />
1. Sidebar 1 from the following sources: S. Mufson,<br />
“U.S. Nuclear Power Revival Grows,” Washington Post,<br />
September 2007; <strong>Worldwatch</strong> <strong>Institute</strong> nuclear energy<br />
database compiled from statistics from the International<br />
Atomic Energy Agency, press reports, and Web sites;<br />
“Nuclear Dawn,” The Economist, 6 September 2007;<br />
“Atomic Renaissance,” The Economist, 6 September 2007;<br />
Satu Hassi, European Parliament member, e-mail to<br />
author, 19 February 2007; The Keystone Center, Nuclear<br />
Power Joint Fact-Finding (Keystone, CO: 2007), p. 30;<br />
MIT Energy Initiative, The Future of Nuclear Power<br />
(Cambridge, MA: Massachusetts <strong>Institute</strong> of Technology,<br />
2003), p. 25; U.S. Nuclear Regulatory Commission, “New<br />
Reactor Licensing Applications,” available at www.nrc.gov,<br />
updated 22 October 2008.<br />
2. World Energy Council, Energy and Climate Change<br />
Executive Summary (London: May 2007), p. 5.<br />
3. New Energy Finance, Global Trends in Sustainable<br />
Energy Investment 2008 (London: 2008).<br />
4. International Energy Agency (IEA), “Electricity/Heat<br />
in World in 2005,”<br />
www.iea.org/Textbase/stats/electricitydata.aspCOUNTRY<br />
_CODE=29&Submit=Submit), viewed 30 September<br />
2008.<br />
5. Ibid.<br />
w w w . w o r l d w a t c h . o r g L O W - C A R B O N E N E R G Y : A R O A D M A P 39
Endnotes<br />
6. Renewables share is 18.4 percent per REN21,<br />
Renewables 2007 Global Status Report (Paris: REN21<br />
Secretariat and Washington, DC: <strong>Worldwatch</strong> <strong>Institute</strong>,<br />
2008), p. 6.<br />
7. Figure 2 from the following sources: BP, Statistical<br />
Review of World Energy (London: 2008); nuclear from<br />
<strong>Worldwatch</strong> <strong>Institute</strong> database, International Atomic<br />
Energy Agency, press reports; biofuels from Rodrigo<br />
Pinto and Suzanne C. Hunt, “Biofuel Flows Surge,” in<br />
<strong>Worldwatch</strong> <strong>Institute</strong>, Vital Signs 2007–2008 (New York:<br />
W. W. Norton & Company, 2007), pp. 40–41, and from<br />
REN21, op. cit. note 6, Table R6 and p. 8; wind from BTM<br />
Consult, European Wind Energy Association (EWEA),<br />
American Wind Energy Association (AWEA), Windpower<br />
Monthly, and New Energy, from Global Wind Energy<br />
Council (GWEC), “Global Wind Energy Markets<br />
Continue to Boom—2006 Another Record Year,” press<br />
release (Brussels: 2 February 2007), and from GWEC,<br />
“Global Installed Wind Power Capacity (MW) – Regional<br />
Distribution,” available at www.gwec.net, viewed 4 April<br />
2008; solar from Paul Maycock and Prometheus <strong>Institute</strong>,<br />
PV News, various issues, and from Travis Bradford,<br />
Prometheus <strong>Institute</strong>, communication with Janet Sawin,<br />
<strong>Worldwatch</strong> <strong>Institute</strong>, 29 April 2008.<br />
8. BTM Consult, EWEA, AWEA, Windpower Monthly,<br />
and New Energy; GWEC, “Global Wind Energy Markets<br />
Continue to Boom—2006 Another Record Year,” and<br />
“Global Installed Wind Power Capacity (MW) – Regional<br />
Distribution,” both op. cit. note 7.<br />
9. <strong>Worldwatch</strong> estimate based on ibid.<br />
10. EWEA, “Wind Energy Leads EU Power Installations<br />
in 2007, But National Growth is Inconsistent,” press<br />
release (Brussels: 4 February 2008); Ryan Wiser and Mark<br />
Bolinger, “Annual Report on U.S. Wind Power<br />
Installation, Cost, and Performance Trends: 2007,” prepared<br />
for U.S. Department of Energy (U.S. DOE), Energy<br />
Efficiency and Renewable Energy (Washington, DC: May<br />
2008), p. 4.<br />
11. Figure 3 based on the following sources: coal and natural<br />
gas from Black & Veatch, 20 Percent Wind Energy<br />
Penetration in the United States, prepared for AWEA<br />
(Walnut Creek, CA: October 2007), p. 5–15, and from<br />
U.S. Energy Information Administration (EIA), “Fuel<br />
Prices to Electricity Generators, 1995–2030,” in Annual<br />
Energy Outlook 2008 with Projections to 2030<br />
(Washington, DC: June 2008); nuclear from The Keystone<br />
Center, Nuclear Power Joint Fact-Finding (Keystone, CO:<br />
June 2007), p. 42, and from Arjun Makhijani, Assessing<br />
Nuclear Plant Capital Costs for the Two Proposed NRG<br />
Reactors at the South Texas Project Site (Takoma Park,<br />
MD: <strong>Institute</strong> for Energy and Environmental Research, 24<br />
March 2008), p. 8; wind from Black & Veatch, op. cit. this<br />
note, p. 5–4; solar from Energy and Environmental<br />
Economics, Inc., New Concentrating Solar Power (CSP)<br />
Generation Resource, Cost, and Performance Assumptions,<br />
Part of California Public Utility Commission GHG<br />
Modeling project (San Francisco: 25 October 2007), pp.<br />
3–4. Inflation conversion factor from Robert C. Sahr,<br />
Inflation Conversion Factors for Dollars 1774 to Estimated<br />
2018, updated 5 February 2008. Calculations are based on<br />
a 100 megawatt generating capacity, 20-year loan with 8<br />
percent interest, a discount rate of 10 percent, and a cost<br />
of escalation of 1.02 percent for these technologies<br />
(supercritical pulverized coal, gas combined-cycle,<br />
nuclear, class five onshore wind, and solar trough concentrating<br />
solar power).<br />
12. Prometheus <strong>Institute</strong> and Greentech Media, PV News,<br />
April 2008, p. 6.<br />
13. <strong>Worldwatch</strong> calculation based on data from Paul<br />
Maycock and Prometheus <strong>Institute</strong>, PV News, various<br />
issues, and from Bradford, op. cit. note 7.<br />
14. Travis Bradford, Prometheus <strong>Institute</strong>, e-mails to<br />
Janet Sawin, <strong>Worldwatch</strong> <strong>Institute</strong>, 5 April, 7 April, and 8<br />
April 2007.<br />
15. U.S. DOE expects solar PV to be cost-competitive<br />
with baseload power in the United States by 2015, according<br />
to David Rodgers, Deputy Assistant Secretary for<br />
Energy Efficiency, U.S. DOE, presentation on panel “New<br />
Approaches to Environmentally Conscious Building<br />
Envelope Design and Technologies,” at Energy Efficiency<br />
Global Forum & Exposition 2007, 11–14 November 2007;<br />
PV cost also from Ashley Seager, “Solar Future Brightens<br />
as Oil Soars,” The Guardian, 16 June 2008, and from Ron<br />
Pernick and Clint Wilder, “Utility Solar Assessment<br />
(USA) Study: Reaching Ten Percent by 2025,”<br />
(Washington, DC: Clean Edge, Inc. and Co-op America<br />
Foundation, June 2008).<br />
16. Susan Moran and J. Thomas McKinnon, “Hot Times<br />
for Solar Energy,” World Watch, March/April 2008, pp.<br />
26–31.<br />
17. “Concentrating Solar Power Activity” (Washington,<br />
DC: Morse Associates, Inc., July 2008).<br />
18. California from Rainer Aringhoff, President, Solar<br />
Millennium LLC, presentation for “Concentrating Solar<br />
Power: What Can Solar Thermal Electricity Deliver, and<br />
at What Price” Webcast, 26 June 2008, at<br />
www.renewableenergyworld.com/rea/events/viewid=454<br />
92; China and India from David R. Mills and Robert G.<br />
Morgan, “A Solar-Powered Economy: How Solar Thermal<br />
Can Replace Coal, Gas and Oil,” Renewable Energy World,<br />
3 July 2008.<br />
19. International Geothermal Association, “Installed<br />
Generating Capacity,” at http://iga.igg.cnr.it/geoworld/<br />
geoworld.phpsub=elgen, updated 2 October 2008.<br />
20. Massachusetts <strong>Institute</strong> of Technology, The Future of<br />
Geothermal Energy (Cambridge, MA: 2007).<br />
21. <strong>Worldwatch</strong> estimate based on World Energy<br />
Council, “Solar Radiation Resources,”<br />
www.worldenergy.org/publications/survey_of_energy_res<br />
ources_2007/solar/720.asp, viewed 5 October 2008, and<br />
on IEA, Key World Energy Statistics 2008 (Paris: 2008), p.<br />
35.<br />
22. Figure 4 based on data from United Nations<br />
Development Programme, World Energy Assessment:<br />
Energy and the Challenge of Sustainability (New York:<br />
2000), and from T. B. Johansson et al., “The Potentials of<br />
Renewable Energy; Thematic Background Paper,”<br />
International Conference for Renewable Energies, Bonn,<br />
Germany, January 2004; global energy use is 2005 data<br />
40<br />
L O W - C A R B O N E N E R G Y : A R O A D M A P w w w . w o r l d w a t c h . o r g
Endnotes<br />
from IEA, World Energy Outlook 2007 (Paris: 2007), p. 4.<br />
23. Table 3 from the following sources: Mark S. Mehos<br />
and Brandon Owens, An Analysis of Siting Opportunities<br />
for Concentrating Solar Power Plants in the Southwestern<br />
United States (Golden, CO, and Boulder, CO: National<br />
Renewable Energy Laboratory and Platts Research and<br />
Consulting, 2004); IEA, Photovoltaic Power Systems<br />
Programme, Potential for Building Integrated Photovoltaics,<br />
2002 Summary (Paris: 2002), p. 8; Richard Perez,<br />
Atmospheric Sciences Research Center, State University of<br />
New York at Albany, e-mail to Janet Sawin, <strong>Worldwatch</strong><br />
<strong>Institute</strong>, 11 July 2006; Battelle/Pacific Northwest<br />
Laboratory, An Assessment of Available Windy Land Area<br />
and Wind Energy Potential in the Contiguous United States<br />
(Richland, WA: August 1991), based on 2004 U.S. end-use<br />
demand from EIA, “Annual Electric Power Industry<br />
Report,” Table 7.2, in Electric Power Annual 2005<br />
(Washington, DC: 2005); Massachusetts <strong>Institute</strong> of<br />
Technology, The Future of Geothermal Energy<br />
(Cambridge, MA: 2006), p. 1-1; John D. Isaacs and Walter<br />
R. Schmitt, “Ocean Energy: Forms and Prospects,”<br />
Science, 18 January 1980, pp. 265–73.<br />
24. Battelle/Pacific Northwest Laboratory, op. cit. note 23.<br />
25. <strong>Worldwatch</strong> <strong>Institute</strong> and Center for American<br />
Progress, American Energy: The Renewable Path to Energy<br />
Security (Washington, DC: September 2006); Netherlands<br />
from IEA, “Electricity/Heat in Netherlands in 2005,”<br />
www.iea.org/Textbase/stats/electricitydata.aspCOUNTRY<br />
_CODE=NL, viewed 3 October 2008; United Kingdom<br />
from IEA, “Electricity/Heat in United Kingdom in 2005,”<br />
www.iea.org/Textbase/stats/electricitydata.asp<br />
COUNTRY_CODE=GB, viewed 3 October 2008, and<br />
from British Wind Energy Association, “The Potential of<br />
Offshore Wind,” www.bwea.com/offshore/overview.html,<br />
viewed 9 October 2008; H.J.T. Kooijman et al., “Cost and<br />
Potential of Offshore Wind Energy on the Dutch part of<br />
the North Sea,” presentation at European Wind Energy<br />
Conference and Exhibition, Copenhagen, 2–6 July 2001,<br />
p. 3.<br />
26. China’s wind is a <strong>Worldwatch</strong> calculation based on<br />
3,200 gigawatts (GW) of potential from China<br />
Meteorological Administration, cited in Zijun Li, “China’s<br />
Wind Energy Potential Appears Vast,” Eye on Earth<br />
(<strong>Worldwatch</strong> <strong>Institute</strong>), 2 November 2005, and on 713<br />
GW installed at end of 2007, from “Installed Electric<br />
Capacity Reaches 713m Kilowatts,” China Daily, 14<br />
January 2008.<br />
27. M. Mehos and B. Owens, Siting Utility-Scale<br />
Concentrating Solar Power Projects (Golden, CO: January<br />
2005), p. 2; EIA, Table 2.1 in Energy Power Annual 2006<br />
(Washington, DC: 22 October 2007).<br />
28. Ibid.<br />
29. Trans-Mediterranean Renewable Energy<br />
Cooperation, “The DESERTEC Concept and the Studies,”<br />
(Hamburg: 5 August 2008).<br />
30. Sahara from Schott Solarthermie GmbH, cited in<br />
Ryan O’Keefe, Vice President, Solar Development, FPL<br />
Energy, LLC, presentation at Texas Solar Forum, State<br />
Capitol, Austin, Texas, 25 April 2008, available at<br />
www.texassolarforum.com/powerpoint/okeffe.ppt.<br />
31. EIA, Annual Energy Review 2007 (Washington, DC:<br />
June 2008); IEA, Photovoltaic Power Systems Programme,<br />
Potential for Building Integrated Photovoltaics, 2002<br />
Summary (Paris: 2002), p. 8.<br />
32. Fred Morse, Senior Advisor, U.S. Operations,<br />
Abengoa Solar, presentation for “Concentrating Solar<br />
Power: What Can Solar Thermal Electricity Deliver, and<br />
at What Price” Webcast, 26 June 2008, at<br />
www.renewableenergyworld.com/rea/events/viewid=454<br />
92.<br />
33. International Geothermal Association, op. cit. note<br />
19.<br />
Designing a New Energy System<br />
1. Wind from Black & Veatch, 20 Percent Wind Energy<br />
Penetration in the United States, prepared for American<br />
Wind Energy Agency (AWEA) (Walnut Creek, CA:<br />
October 2007), p. 5–15; solar from Energy and<br />
Environmental Economics, Inc., “New Concentrating<br />
Solar Power (CSP) Generation Resource, Cost, and<br />
Performance Assumptions,” Part of California Public<br />
Utilities Commission GHG Modeling project (San<br />
Francisco: 25 October 2007), pp. 3–4.<br />
2. Denmark from Lise Backer, Vestas Governmental<br />
Relations, “Innovating World-Wide in Wind Energy,”<br />
Session I: Environmentally-related Innovation in Global<br />
Markets: Opportunities and Challenges for Companies,<br />
Workshop on Environmental Innovation and Global<br />
Markets, Berlin, 20–12 September 2007, at<br />
www.oecd.org/dataoecd/4/1/39370312.pdf, and from<br />
Hans Abildgaard, “Wind Power and Its Impact on the<br />
Power System,” presentation for Cross Cutting Session #5:<br />
Grid Integration: Integrating Renewables into Power<br />
Systems Operations, Washington International Renewable<br />
Energy Conference, Washington, DC, March 2008 , available<br />
at www.Energinet.dk, cited in Roger Peters with<br />
Linda O’Malley, “Storing Renewable Power” (Alberta,<br />
Canada: The Pembina <strong>Institute</strong>, June 2008), p. 13.<br />
3. German Wind Energy <strong>Institute</strong> (DEWI),<br />
“Windenergie in Deutschland—Aufstellungszahlen fur<br />
das Jahr 2007,” available at www.dewi.de, viewed 16<br />
August 2008.<br />
4. See, for example, Pacific Gas and Electric, “2008<br />
Renewables,” www.pge.com/renewableRFO, viewed 17<br />
August 2008.<br />
5. Tools used to balance demand and supply from Edgar<br />
A. DeMeo et al., “Accommodating Wind’s Natural<br />
Behavior: Advances in Insights and Methods for Wind<br />
Plant Integration,” IEEE Power & Energy Magazine,<br />
November/December 2007, p. 67, from Abildgaard, op.<br />
cit. note 2, and from J. Charles Smith and Brian Parsons,<br />
“What Does 20% Look Like Developments in Wind<br />
Technology and Systems,” IEEE Power & Energy<br />
Magazine, November/December 2007, p. 24; B. Parsons et<br />
al., Grid Impacts of Wind Power Variability: Recent<br />
Assessments from a Variety of Utilities in the United States<br />
(Golden, CO: National Renewable Energy Laboratory,<br />
2006); P. B. Eriksen et al., “System Operation with High<br />
Wind Penetration,” IEEE Power & Energy Magazine,<br />
November/December 2005, pp. 65–74; C. Archer and M.<br />
w w w . w o r l d w a t c h . o r g L O W - C A R B O N E N E R G Y : A R O A D M A P 41
Endnotes<br />
Jacobson, “Supplying Baseload Power and Reducing<br />
Transmission Requirements by Interconnecting Wind<br />
Farms” (Palo Alto, CA: Stanford University, February<br />
2007).<br />
6. Sheryl Carter, Devra Wang, and Audrey Chang, The<br />
Rosenfeld Effect in California: The Art of Energy Efficiency<br />
(San Francisco: Natural Resources Defense Council,<br />
2006).<br />
7. Kurt Yeager, Executive Director, Galvin Electricity<br />
Initiative, “Facilitating the Transition to a Smart Electric<br />
Grid,” testimony to House Subcommittee on Energy and<br />
Air Quality, 3 May 2007, e-mailed to Janet Sawin,<br />
<strong>Worldwatch</strong> <strong>Institute</strong>, 25 May 2007.<br />
8. Pacific Gas and Electric, “Pacific Gas and Electric<br />
Company’s SmartMeter Proposal Approved by California<br />
Public Utilities Commission,” press release (San<br />
Francisco: 20 July 2006); Europe from Erik Olsen, “Smart<br />
Meters Open Market for Smart Apps,” New York Times, 7<br />
October 2008, and from Michael Setters, “Focus on<br />
European Smart Grids,” RenewableEnergyWorld.com, 9<br />
April 2008.<br />
9. BPL Global, “BPL Global Expands in Africa,” press<br />
release (Pittsburgh, PA: 29 May 2008).<br />
10. Yeager, op. cit. note 7.<br />
11. Leila Abboud, “Thar She Blows: DONG’s Wind<br />
Woes,” blogs.wsj.com, 11 March 2008.<br />
12. D. Marcus, “Moving Wind to the Mainstream:<br />
Leveraging Compressed Air Energy Storage,” Renewable<br />
Energy Access, October 2007.<br />
13. TXU, “TXU Halts Efforts to Obtain Permits for Eight<br />
Coal-Fueled Units,” press release (Dallas, TX: 1 March<br />
2007); TXU, “Luminant and Shell Join Forces to Develop<br />
a Texas-Sized Wind Farm,” press release (Dallas, TX: 27<br />
July 2007).<br />
14. Seth Dunn, Micropower: the Next Electrical Era,<br />
<strong>Worldwatch</strong> Paper 151 (Washington, DC: <strong>Worldwatch</strong><br />
<strong>Institute</strong>, 2000)<br />
15. American Electric Power, “Interstate Transmission<br />
Vision for Wind Integration” (Columbus, OH: 2007).<br />
16. Al Gore, Hearing on Perspectives on Climate Change,<br />
House Committee on Energy and Commerce and House<br />
Committee on Science and Technology, Washington, DC,<br />
21 March 2007; Pickens Plan,<br />
www.pickensplan.com/theplan, viewed 30 September<br />
2008.<br />
17. Coal and nuclear from International Energy Agency<br />
(IEA), “Electricity/Heat in World in 2005,”<br />
www.iea.org/Textbase/stats/electricitydata.aspCOUNTRY<br />
_CODE=29, viewed 3 October 2008.<br />
18. Enercon GmbH, SolarWorld AG, and Schmack Biogas<br />
AG, “The Combined Power Plant – The First Stage in<br />
Providing 100% Power from Renewable Energy,” press<br />
release (Berlin: 9 October 2007); background paper and<br />
other information available at www.kombikraftwerk.de.<br />
19. Dave Gilson (interviewer), “Power Q&A: S. David<br />
Freeman,” Mother Jones, 21 April 2008.<br />
20. Wolfram Krewitt, Sonja Simon, and Thomas Pregger<br />
with contributions from Paul Suding, “Renewable Energy<br />
Deployment Potentials in Large Economies,” prepared for<br />
REN21, German Aerospace Center (DLR), and <strong>Institute</strong><br />
of Technical Thermodynamics (Stuttgart, Germany: April<br />
2008), pp. 8, 18–37.<br />
21. U.S. Department of Energy (U.S. DOE), 20% Wind<br />
Energy by 2030: Increasing Wind Energy’s Contribution to<br />
U.S. Electricity Supply (Washington, DC: May 2008).<br />
22. AWEA, “U.S. Wind Energy Installations Surpass<br />
20,000 Megawatts,” press release (Washington, DC: 3<br />
September 2008).<br />
23. U.S. DOE, op. cit. note 21, pp. 107–08, 204–05.<br />
24. Figure 5 derived from the following sources: 2007<br />
data from U.S. Energy Information Administration (EIA),<br />
“Table 8.2b Electricity Net Generation: Electric Power<br />
Sector, 1949–2007,” in Annual Energy Review<br />
(Washington, DC: 23 June 2008); 2030 non-renewable<br />
generation from EIA, “Table 8. Electricity Supply,<br />
Disposition, Prices, and Emissions,” in Annual Energy<br />
Outlook with Projections to 2030 (Washington, DC: June<br />
2008); 2030 renewable generation from EIA, “Table 16.<br />
Renewable Energy Generating Capacity and Generation,”<br />
in idem.<br />
25. EIA, “Table 8. Electricity Supply, Disposition, Prices,<br />
and Emissions,” op. cit. note 24.<br />
26. <strong>Worldwatch</strong> estimate based on Electric Power<br />
Research <strong>Institute</strong>, Environmental Assessment of Plug-In<br />
Hybrid Electric Vehicles Volume 1: Nationwide Greenhouse<br />
Gas Emissions (Palo Alto, CA: July 2007).<br />
27. Willett Kempton and Jasna Tomiç “Vehicle-to-Grid<br />
Power Implementation: From Stabilizing the Grid to<br />
Supporting Large-scale Renewable Energy,” Journal of<br />
Power Sources, 1 June 2005, pp. 280–94.<br />
28. Robert A. Hefner III, The Great Energy Transition,<br />
unpublished book manuscript, August 2008; Navigant<br />
Consulting, The New North American Ocean of Natural<br />
Gas, brochure, June 2008.<br />
29. U.S. DOE, “Brazil,” in Country Analysis Briefs<br />
(Washington, DC: September 2007).<br />
30. Martin Bensmann, “Green Gas on Tap,” New Energy,<br />
April 2007, pp. 66–69<br />
31. Hythane Company, LLC., “The Hythane System,”<br />
www.hythane.com/system.html, viewed 21 October 2008.<br />
Jumpstarting a Revolution<br />
1. Eight percent of U.S. homes from “Remarkable<br />
Progress in Electrical Development: Notable Features in<br />
the Increase of the Use of Electricity in Small Plants and<br />
Households,” New York Times, 8 January 1905, and from<br />
Edison Electric <strong>Institute</strong>, “Historical Statistics of the<br />
Electric Utility Industry Through 1970,” at<br />
www.eia.doe.gov/cneaf/electricity/page/electric_kid/appe<br />
nd_a.html; 14 vehicles from Ritz Site, “Early Ford<br />
Models,” at www.ritzsite.net/FORD_1/02_eford.htm.<br />
2. Skeptical comments from “Famous Authoritative<br />
Pronouncements,” www.av8n.com/physics/ex-cathe-<br />
42<br />
L O W - C A R B O N E N E R G Y : A R O A D M A P w w w . w o r l d w a t c h . o r g
Endnotes<br />
dra.htm, viewed 9 October 2008.<br />
3. Environmental and Energy Study <strong>Institute</strong> (EESI),<br />
“FY 08 Appropriations for Renewable Energy and Energy<br />
Efficiency: Full House and Senate Committee Vote for<br />
Increase in EE/RE Funding,” Issue Update (Washington,<br />
DC: 18 July 2007).<br />
4. Figure 6 from REN21, Renewables Global Status<br />
Report 2007 (Paris, REN 21 and Washington, DC,<br />
<strong>Worldwatch</strong> <strong>Institute</strong>: May 2007). The figure consists of<br />
capacity data for electricity (wind, solar PV, biomass,<br />
geothermal, small hydro, and solar thermal) and heating<br />
(solar hot water, biomass, and geothermal). Values<br />
approximate real 2007 dollars and are adjusted for historical<br />
capacity costs but do not take into account exchangerate<br />
fluctuations.<br />
5. Applied Materials Energy and Environment Web site,<br />
www.appliedmaterials.com; BP Alternative Energy Web<br />
site, www.bp.com; GE Web site, www.gepower.com;<br />
DuPont Web site, www.dupont.com; Goldman Sachs Web<br />
site, www.goldmansachs.com; Mitsubishi Web site,<br />
www.mpshq.com; Royal Dutch Shell Web site,<br />
www.shell.com; Sharp Web site,<br />
http://solar.sharpusa.com; Siemens Web site,<br />
www.powergeneration.siemens.com.<br />
6. New Energy Finance, Global Trends in Sustainable<br />
Energy Investment (London: 2008), p. 27.<br />
7. U.S. Department of Energy (U.S. DOE), FY 2009<br />
Congressional Budget Request: Budget Highlights<br />
(Washington, DC: 2008), p. 24.<br />
8. Vestas WindSystems, AS, Vestas Annual Report 2006<br />
(Randers, Denmark: 2007), p. 18; U.S. DOE, op. cit. note<br />
7, p. 5.<br />
9. New Energy Finance, op. cit. note 6, p. 23.<br />
10. Ibid.<br />
11. REN 21, op. cit. note 4.<br />
12. Travis Bradford, Prometheus <strong>Institute</strong>, discussions<br />
with Janet Sawin, <strong>Worldwatch</strong> <strong>Institute</strong>, 2 and 6 April<br />
2007; Travis Bradford, Prometheus <strong>Institute</strong>, e-mails to<br />
Janet Sawin, <strong>Worldwatch</strong> <strong>Institute</strong>, 5 April, 7 April, and 8<br />
April 2007.<br />
13. Sasha Rentzing, “Sun Aplenty,” New Energy, June<br />
2007.<br />
14. Boston Consulting Group, The Experience Curve<br />
Reviewed (Boston: reprint, 1972).<br />
15. <strong>Worldwatch</strong> <strong>Institute</strong> calculation of 2004–06 renewable<br />
energy growth rates based on data from American<br />
Wind Energy Association (AWEA), “Wind Power<br />
Capacity in U.S. Increased 27% in 2006 and Is Expected<br />
to Grow an Additional 26% in 2007,” press release<br />
(Washington DC: 23 January 2007), from Birger Madsen,<br />
BTM Consult, e-mail to Janet Sawin, <strong>Worldwatch</strong><br />
<strong>Institute</strong>, 8 March 2007, from European Wind Energy<br />
Association, “European Market for Wind Turbines Grows<br />
23% in 2006,” press release (Brussels: 1 February 2007),<br />
from Christoph Berg, F.O. Licht, e-mails to Rodrigo G.<br />
Pinto, <strong>Worldwatch</strong> <strong>Institute</strong>, 20–22 March 2007, from<br />
Global Wind Energy Council, “Global Wind Energy<br />
Markets Continue to Boom—2006 Another Record Year,”<br />
press release (Brussels: 2 February 2007), and from<br />
Prometheus <strong>Institute</strong>, PV News, April 2007, p. 8.<br />
16. Black & Veatch, 20 Percent Wind Energy Penetration in<br />
the United States, prepared for AWEA (Walnut Creek, CA:<br />
October 2007) pp. 5–4, 5–15; U.S. Energy Information<br />
Administration (EIA), “Fuel Prices to Electricity<br />
Generators, 1995–2030,” in Annual Energy Outlook 2008<br />
with Projections to 2030 (Washington, DC: June 2008).<br />
17. Photovoltaic cost forecast based on Bradford, e-mails<br />
to Janet Sawin, op. cit. note 12.<br />
18. EIA, International Energy Outlook 2008 (Washington,<br />
DC: 2008), pp. 23–35.<br />
19. Equivalent carbon price calculated using crude oil<br />
price for September 2007 and September 2002 from U.S.<br />
DOE, “World Crude Oil Prices” (Washington DC: updated<br />
11 October 2007); approximate crude oil carbon content<br />
from U.S. DOE, Table B4 in Emissions of Greenhouse<br />
Gases in the United States 1998 (Washington, DC:<br />
November 1999); Senator Jeff Bingaman, “Low Carbon<br />
Economy Act of 2007,” proposed legislation (Washington,<br />
DC: July 2007); EU ETS emission allowance price from<br />
Point Carbon, www.pointcarbon.com, viewed 3 October<br />
2008.<br />
20. Douglass C. North, Institutions, Institutional Change,<br />
and Economic Performance (Cambridge, U.K.: Cambridge<br />
University Press, 1990).<br />
21. The Automobile Evaluation Standard Subcommittee,<br />
Energy Efficiency Standards Subcommittee of the<br />
Advisory Committee for Natural Resources and Energy<br />
and The Automobile Fuel Efficiency Standards<br />
Subcommittee, Automobile Transport Section, Land<br />
Transport Division of the Council for Transport Policy,<br />
Final Report of Joint Meeting (Tokyo: February 2007), pp.<br />
4–5; Feng An et al., Passenger Vehicle Greenhouse Gas and<br />
Fuel Economy Standards: A Global Update (Washington,<br />
DC: International Council for Clean Transportation,<br />
2007), pp. 18, 24, 32.<br />
22. Honorable Mary Peters, Secretary of Transportation,<br />
CAFE Standards Announcement, 22 April 2008; Assembly<br />
Member L. Levine, Assembly Bill 722, Sacramento, CA,<br />
introduced February 2007.<br />
23. Department of the Environment and Water<br />
Resources, “World First! Australia Slashes Greenhouse<br />
Gases from Inefficient Lighting,” press release (Canberra:<br />
20 February 2007).<br />
24. “Britain to Start Phasing Out High Energy<br />
Lightbulbs,” Reuters, 27 September 2007; “Chinese Agree<br />
to Nix Incandescents,” Greenbiz.com, 3 October 2007;<br />
“New Zealand to Turn Off Old Light Bulbs,” Reuters, 17<br />
June 2008.<br />
25. U.S. DOE, Energy Efficiency and Renewable Energy,<br />
“States with Renewable Portfolio Standards,” at<br />
http://apps1.eere.energy.gov/states/maps/renewable_portf<br />
olio_states.cfm#chart, updated 2 May 2008.<br />
26. Environmental Technologies Action Plan, “Spain’s<br />
New Building Energy Standards Place the Country<br />
Among the Leaders in Solar Energy in Europe” (Brussels:<br />
w w w . w o r l d w a t c h . o r g L O W - C A R B O N E N E R G Y : A R O A D M A P 43
Endnotes<br />
European Commission, September 2006).<br />
27. “First Heating Law for Renewable Energy in<br />
Germany,” Energy Server (Newsletter for Renewable<br />
Energy and Energy Efficiency), 2 August 2007.<br />
28. Tripartite Task Force – Brazil, European Union, and<br />
United States of America, “White Paper on<br />
Internationally Compatible Biofuel Standards,” 31<br />
December 2007, at www.nist.gov/public_affairs/<br />
biofuels_report.pdf.<br />
29. Figure 7 is a <strong>Worldwatch</strong> calculation based on<br />
California Energy Commission (CEC), California<br />
Electricity Consumption by Sector (Sacramento: 2006), on<br />
U.S. DOE, State Energy Consumption, Price, and<br />
Expenditure Estimates (SEDS) (Washington, DC: 2007),<br />
on U.S. DOE, Annual Energy Review 2006 (Washington,<br />
DC: 2007), on T. Dang, CEC, conversation with Amanda<br />
Chiu, <strong>Worldwatch</strong> <strong>Institute</strong>, 22 September 2008, and on<br />
U.S. Census Bureau estimates.<br />
30. Duke Energy Carolinas, LLC., “Application of Duke<br />
Energy Carolinas, LLC for Approval of Save-a-Watt<br />
Approach, Energy Efficiency Rider and Portfolio of<br />
Energy Efficiency Programs,” filed to North Carolina<br />
Utility Commission, 7 May 2007.<br />
31. California Public Utilities Commission, California<br />
Long Term Energy Efficiency Strategic Plan: Achieving<br />
Maximum Energy Savings in California for 2009 and<br />
Beyond (San Francisco: September 2008); Pacific Gas and<br />
Electric, “PG&E Unveils California’s First Comprehensive<br />
Investment Strategy in Electric Infrastructure Since<br />
Energy Crisis,” press release (San Francisco: 4 April 2006).<br />
32. John S. Hoffman, “Limiting Global Warming: Making<br />
it Easy by Creating Social Infrastructure that Supports<br />
Demand Reductions Through More-Effective Markets,”<br />
unpublished paper, 2007.<br />
33. Janet Sawin, “The Role of Government in the<br />
Development and Diffusion of Renewable Energy<br />
Technologies: Wind Power in the United States,<br />
California, Denmark and Germany, 1970–2000,” Doctoral<br />
Thesis, The Fletcher School of Law and Diplomacy, Tufts<br />
University, September 2001.<br />
34. M. Ragwitz and C. Huber, Feed-In Systems in<br />
Germany and Spain and a Comparison (Karlsruhe,<br />
Germany: Fraunhofer Institut für Systemtechnik und<br />
Innovationsforschung, 2005); ranking based on Bradford,<br />
op. cit. note 12.<br />
35. German Federal Ministry for the Environment,<br />
Nature Conservation and Nuclear Safety (BMU),<br />
Development of Renewable Energies in 2006 in Germany<br />
(Bonn: 21 February 2007) p. 10; BMU, “Renewable<br />
Energy Sources in Figures” (Bonn: June 2008), p. 8.<br />
36. BMU, “Renewable Energy Sources in Figures,” ibid.,<br />
pp. 23–26.<br />
37. <strong>Worldwatch</strong> <strong>Institute</strong> calculation, op. cit. note 15.<br />
38. Michael Renner, Sean Sweeney, and Jill Kubit, Green<br />
Jobs: Working for People and the Environment, <strong>Worldwatch</strong><br />
Report 177 (Washington, DC: <strong>Worldwatch</strong> <strong>Institute</strong>,<br />
October 2008).<br />
39. Table 4 from ibid.<br />
40. Nicholas Stern, The Economics of Climate Change: The<br />
Stern Review (Cambridge, U.K.: Cambridge University<br />
Press, 2007), pp. 233–34; International Energy Agency<br />
(IEA), Energy Technology Perspectives 2008: Scenarios and<br />
Strategies to 2050 (Paris: 2008), p. 39.<br />
41. See Pickens Plan, www.pickensplan.com.<br />
42. Al Gore, “A Generational Challenge to Repower<br />
America,” presented in Washington, DC, 17 July 2008.<br />
43. Jeffery Greenblatt, “Clean Energy 2030: Google’s<br />
Proposal for Reducing U.S. Dependence on Fossil Fuels,”<br />
available at http://knol.google.com.<br />
44. Schmidt cited in Braden Reddall, “Google Uses Brand<br />
Power to Lobby for Changes in Energy Policy,”<br />
International Herald Tribune, 2 October 2008.<br />
45. IEA, “IEA Urges Governments to Adopt Effective<br />
Policies Based on Key Design Principles to Accelerate the<br />
Exploitation of the Large Potential for Renewable<br />
Energy,” press release (Berlin: 29 September 2008).<br />
46. EIA, “Country Analysis Briefs: China” (Washington,<br />
DC: August 2006); Eric Martinot and Junfeng Li,<br />
Powering China’s Development: The Role of Renewable<br />
Energy, <strong>Worldwatch</strong> Paper 175 (Washington, DC:<br />
<strong>Worldwatch</strong> <strong>Institute</strong>, 2007).<br />
47. Solar water heating and small hydro from Martinot<br />
and Li, op. cit. note. 46, pp. 16, 25–27; CFLs from Peter<br />
Du Pont, “Asian Energy Trends and Prospects for Energy<br />
Efficiency,” U.S. Agency for International Development<br />
ECO-Asia presentation at TBLI Asia Conference,<br />
Bangkok, Thailand, 29 May 2008.<br />
48. Solar from Du Pont, ibid.; wind from Shi Pengfei,<br />
“Wind Power in China,” presentation in Guangzhou,<br />
China, 23 March 2007, and from Shi Pengfei, “2006 Wind<br />
Installations in China” (Beijing: China General<br />
Certification Center, 2007), both cited in Martinot and Li,<br />
op. cit. note 46.<br />
49. Keith Bradsher, “Warren Buffett to Buy a 10 Percent<br />
Stake in Chinese Battery Maker,” International Herald<br />
Tribune, 29 September 2008.<br />
44<br />
L O W - C A R B O N E N E R G Y : A R O A D M A P w w w . w o r l d w a t c h . o r g
Index<br />
A<br />
Africa<br />
carbon dioxide emissions, 11<br />
electrical transmission systems, 25<br />
smart electric grids, 24<br />
solar energy potential, 21–22<br />
Age of Turbulence, The (Greenspan), 9<br />
Algeria, 11<br />
Antarctica, 9<br />
Applied Materials, 30<br />
Arctic Ocean, 9<br />
Australia, 32<br />
automobile efficiency standards, 32<br />
B<br />
batteries, 23, 25, 36<br />
biofuels, 32<br />
biomass, 21, 34<br />
Boston Consulting Group, 31<br />
BP (British Petroleum), 30<br />
Brazil, 28, 32<br />
Buffet, Warren, 36<br />
buildings<br />
cogeneration, 25, 27<br />
energy productivity of, 14–17, 32<br />
micro-power systems, 28<br />
Bush administration, 13<br />
BYD, 36<br />
C<br />
California<br />
electricity, 20, 32, 33<br />
percentage renewable energy, 24<br />
solar electricity, 20, 35<br />
wind power, 24<br />
Canada, 11, 15<br />
carbon capture and storage (CCS), 11–12<br />
carbon dioxide concentrations, 8, 10<br />
carbon dioxide emissions<br />
climate change, 6<br />
coal burning, 23<br />
sources and rates, 9–11, 14, 28<br />
tax/cap, 31<br />
Celunol, 30<br />
cement manufacture, 9<br />
Cheney, Dick, 13<br />
China<br />
buildings, 15, 16<br />
carbon capture and storage, 12<br />
carbon dioxide emissions, 10–11, 13–14, 35<br />
combined heat and power, 12, 17<br />
concentrating solar plants, 20<br />
government policies, 35<br />
renewable energy market growth, 33<br />
wind power resources, 21<br />
climate change acceleration, 8–10<br />
coal burning<br />
carbon dioxide contribution, 9, 11, 18, 27, 28<br />
power plants, 11–12, 19, 22, 31, 34<br />
coal gasification, 12<br />
cogeneration, 11, 16, 27. see also combined heat and<br />
power (CHP)<br />
combined heat and power (CHP), 16–17, 23, 28. see<br />
also cogeneration<br />
Combined Power Plant, 26<br />
compact fluorescent lamps (CFLs), 14<br />
compressed air, 23, 24–25<br />
concentrating solar power (CSP), 20, 21, 22, 25, 30, 35<br />
cost internalization, 31<br />
D<br />
Darling National Wind Farm, 7<br />
Denmark, 17, 23–24, 33<br />
developing countries, 10, 13, 35. see also specific countries<br />
digital smart grids, 23, 24<br />
DONG, 24<br />
Duke Energy, 33<br />
DuPont, 30<br />
E<br />
Earth orbit and orientation, 8<br />
E3 Biofuels, 30<br />
Edison, Thomas, 29<br />
Egypt, 20<br />
Eldrup, Anders, 24<br />
electricity. see also specific sources<br />
economics, 20, 31–32<br />
supply scenarios, 26–27<br />
w w w . w o r l d w a t c h . o r g L O W - C A R B O N E N E R G Y : A R O A D M A P 45
Index<br />
transmission grids, 22, 23, 24, 25–26, 28, 31<br />
use trends, 33<br />
employment, 34<br />
energy efficiency, 13–17, 32–33<br />
energy markets, 30–34<br />
energy sources. see also specific sources<br />
available resources, 21<br />
growth rates, 18<br />
output variability, 23<br />
energy system design, 23–28<br />
ethanol, 28<br />
European Union<br />
carbon dioxide emissions, 11<br />
combined heat and power, 17<br />
energy efficiency standards, 15–16, 32<br />
greenhouse gas emissions goal, 10<br />
renewable energy investment incentives, 33<br />
F<br />
Finland, 17, 19<br />
Ford, Henry, 29<br />
fossil fuels. see also specific fuels<br />
carbon dioxide releases, 9–12<br />
economics, 13, 31<br />
necessity for, 6<br />
water scarcity, 22<br />
France, 19<br />
Freeman, S. David, 26<br />
fuel cells, 23, 25<br />
G<br />
Galvin Electricity Initiative, 24<br />
Gamesa, 19<br />
Gardner, John, 7<br />
gas turbines, 23<br />
G8 Economic Summit, 10, 11<br />
General Electric, 19, 30<br />
General Motors, 28<br />
geothermal energy, 20, 21, 22, 34<br />
German Aerospace Center (DLR), 26<br />
Germany<br />
building standards, 15, 32<br />
carbon capture and storage, 12<br />
combined heat and power, 17<br />
Combined Power Plant, 26<br />
compact fluorescent lamps, 14<br />
energy productivity, 13<br />
market-access laws, 33<br />
methane biogas, 28<br />
solar cell incentives, 20<br />
wind power, 24<br />
Goldman Sachs, 30<br />
Google, 34<br />
Gore, Al, 12, 26, 34<br />
government policies, 29, 30, 31–36. see also specific<br />
countries<br />
green certification, 15<br />
Greenland ice sheet, 9<br />
Greenspan, Alan, 9<br />
ground-source heat pumps, 28, 33<br />
H<br />
Hansen, James, 6, 8, 10, 12<br />
Hare, W. L., 10<br />
heating, 14, 15<br />
heat recovery ventilators, 15<br />
Hoffman, John, 33<br />
hydroelectric power, 21, 22, 34<br />
hydrogen, 28<br />
I<br />
India, 10, 11, 15, 22, 34<br />
Intergovernmental Panel on Climate Change (IPCC),<br />
10<br />
International Energy Agency (IEA), 34–35<br />
Iowa, 34<br />
Israel, 20<br />
Italy, 20<br />
J<br />
Japan<br />
automobile efficiency standards, 32<br />
carbon capture and storage, 12<br />
carbon dioxide emissions, 11<br />
compact fluorescent lamps, 14<br />
energy productivity, 13<br />
solar cell incentives, 20<br />
K<br />
Kyoto Protocol, 34<br />
L<br />
Lawrence Berkeley National Laboratory, 16<br />
lighting/light bulbs, 14, 15, 32, 35<br />
M<br />
McKinsey Global <strong>Institute</strong>, 17<br />
McMurdo Station, 9<br />
methane, 8, 9, 28<br />
Miasole, 30<br />
microturbines, 23, 25<br />
Middle East, 11<br />
Mitsubishi, 30<br />
N<br />
Nanosolar, 30<br />
NASA (National Aeronautics and Space<br />
Administration), 6<br />
National Electrical Superhighway, 25<br />
National Renewable Energy Laboratory, 21<br />
natural gas<br />
carbon dioxide contribution, 9<br />
electricity generation costs, 20<br />
growth rate as energy source, 18<br />
as transition fuel, 28<br />
transportation, 11<br />
46<br />
L O W - C A R B O N E N E R G Y : A R O A D M A P w w w . w o r l d w a t c h . o r g
Index<br />
Netherlands, 21<br />
Nissan, 28<br />
no-carbon energy, 18–22<br />
North, Douglass, 31<br />
North Carolina Utility Commission, 33<br />
Norway, 12<br />
nuclear power, 17, 18, 19<br />
O<br />
ocean energy, 18, 21, 22<br />
Ohio, 34<br />
oil, 9, 11, 29<br />
oil shale, 11<br />
P<br />
Pacific Gas and Electric, 20, 24, 33<br />
Pacific Northwest Laboratory, 21<br />
Pasivhaus <strong>Institute</strong>, 15<br />
Pennsylvania, 34<br />
Pickens, T. Boone, 26, 34<br />
plug-in vehicles, 27<br />
positive feedback, 8<br />
Potsdam <strong>Institute</strong>, 10<br />
power plants. see specific types<br />
Prometheus <strong>Institute</strong>, 20<br />
pumped hydro, 23<br />
R<br />
renewable energy. see also specific types and aspects of<br />
economics, 29–31<br />
government policies, 32–36<br />
job creation, 34<br />
land and water requirements, 22<br />
sunlight energy content, 21<br />
vs. fossil fuels, 18<br />
“zero-carbon” buildings, 16<br />
research and development rates, 7, 29–30<br />
Royal Dutch Shell, 30<br />
S<br />
Schmidt, Eric, 34<br />
sea level rise, 9<br />
Seville (Spain), 25<br />
Sharp, 30<br />
Siemens, 19, 30<br />
Smart Car, 13<br />
solar cells, 20, 22, 30, 31, 35<br />
solar energy<br />
concentrating solar power, 20, 21, 22, 25, 30, 35<br />
employment, 34<br />
output variability, 23<br />
resource potential, 19, 20, 21–22<br />
South Africa, 7<br />
Spain, 19, 25, 32, 33, 34<br />
Stern, Nicholas, 9, 34<br />
Stevens <strong>Institute</strong>, 29<br />
sunlight energy content, 21<br />
SunPower, 30<br />
T<br />
Tanaka, Nobuo, 35<br />
tar sands, 11<br />
Toyota, 28<br />
transmission systems, 23, 25<br />
transportation, 11, 17, 27, 32<br />
tundra melting, 9<br />
TXU, 25<br />
U<br />
United Kingdom, 16, 21<br />
United Nations Framework Convention on Climate<br />
Change, 10<br />
United States<br />
carbon capture and storage, 12<br />
carbon dioxide emissions, 9, 10–11<br />
combined heat and power, 16–17<br />
compact fluorescent lamps, 14<br />
concentrating solar power, 20<br />
electrical transmission systems, 25–26<br />
energy efficiency, 13, 32<br />
energy scenario, 26, 27<br />
geothermal energy, 21<br />
green certification, 15<br />
natural gas, 28<br />
nuclear power plants, 19<br />
renewable energy employment, 34<br />
renewable energy mandates, 32<br />
wind power, 21, 33<br />
U.S. Department of Energy (DOE), 10, 12, 26<br />
U.S. Energy Information Administration (EIA), 26, 27<br />
U.S. Green Building Council, 15<br />
V<br />
Vestas Wind Systems, 19, 30<br />
W<br />
waste heat, 13<br />
water requirements, 22<br />
Weyburn (Canada), 12<br />
wind power<br />
economics, 31, 33, 34<br />
energy potential, 21, 22, 26<br />
growth rate, 19–20<br />
output variability, 23–25<br />
World Energy Council, 18<br />
<strong>Worldwatch</strong> <strong>Institute</strong>, 26, 27<br />
Y<br />
Yeager, Kurt, 24<br />
w w w . w o r l d w a t c h . o r g L O W - C A R B O N E N E R G Y : A R O A D M A P 47
Other <strong>Worldwatch</strong> Reports<br />
<strong>Worldwatch</strong> Reports provide in-depth, quantitative, and qualitative analysis of the major issues<br />
affecting prospects for a sustainable society. The Reports are written by members of the<br />
<strong>Worldwatch</strong> <strong>Institute</strong> research staff or outside specialists and are reviewed by experts unaffiliated<br />
with <strong>Worldwatch</strong>. They are used as concise and authoritative references by governments, nongovernmental<br />
organizations, and educational institutions worldwide.<br />
On Climate Change, Energy, and Materials<br />
175: Powering China’s Development: the Role of Renewable Energy, 2007<br />
169: Mainstreaming Renewable Energy in the 21st Century, 2004<br />
160: Reading the Weathervane: Climate Policy From Rio to Johannesburg, 2002<br />
157: Hydrogen Futures: Toward a Sustainable Energy System, 2001<br />
151: Micropower: The Next Electrical Era, 2000<br />
149: Paper Cuts: Recovering the Paper Landscape, 1999<br />
144: Mind Over Matter: Recasting the Role of Materials in Our Lives, 1998<br />
138: Rising Sun, Gathering Winds: Policies To Stabilize the Climate and Strengthen Economies, 1997<br />
On Ecological and Human Health<br />
174: Oceans in Peril: Protecting Marine Biodiversity, 2007<br />
165: Winged Messengers: The Decline of Birds, 2003<br />
153: Why Poison Ourselves: A Precautionary Approach to Synthetic Chemicals, 2000<br />
148: Nature’s Cornucopia: Our Stakes in Plant Diversity, 1999<br />
145: Safeguarding the Health of Oceans, 1999<br />
142: Rocking the Boat: Conserving Fisheries and Protecting Jobs, 1998<br />
141: Losing Strands in the Web of Life: Vertebrate Declines and the Conservation of Biological Diversity, 1998<br />
140: Taking a Stand: Cultivating a New Relationship With the World’s Forests, 1998<br />
On Economics, Institutions, and Security<br />
177: Green Jobs: Working for People and the Environment, 2008<br />
168: Venture Capitalism for a Tropical Forest: Cocoa in the Mata Atlântica, 2003<br />
167: Sustainable Development for the Second World: Ukraine and the Nations in Transition, 2003<br />
166: Purchasing Power: Harnessing Institutional Procurement for People and the Planet, 2003<br />
164: Invoking the Spirit: Religion and Spirituality in the Quest for a Sustainable World, 2002<br />
162: The Anatomy of Resource Wars, 2002<br />
159: Traveling Light: New Paths for International Tourism, 2001<br />
158: Unnatural Disasters, 2001<br />
On Food, Water, Population, and Urbanization<br />
176: Farming Fish for the Future, 2008<br />
172: Catch of the Day: Choosing Seafood for Healthier Oceans, 2007<br />
171: Happer Meals: Rethinking the Global Meat Industry, 2005<br />
170: Liquid Assets: The Critical Need to Safeguard Freshwater Ecosytems, 2005<br />
163: Home Grown: The Case for Local Food in a Global Market, 2002<br />
161: Correcting Gender Myopia: Gender Equity, Women’s Welfare, and the Environment, 2002<br />
156: City Limits: Putting the Brakes on Sprawl, 2001<br />
154: Deep Trouble: The Hidden Threat of Groundwater Pollution, 2000<br />
150: Underfed and Overfed: The Global Epidemic of Malnutrition, 2000<br />
147: Reinventing Cities for People and the Planet, 1999<br />
To see our complete list of Reports, visit www.worldwatch.org/taxonomy/term/40<br />
48<br />
L O W - C A R B O N E N E R G Y : A R O A D M A P w w w . w o r l d w a t c h . o r g
About <strong>Worldwatch</strong><br />
The <strong>Worldwatch</strong> <strong>Institute</strong> is an independent research organization recognized by opinion leaders<br />
around the world for its accessible, fact-based analysis of critical global issues. Its mission is to<br />
generate and promote insights and ideas that empower decision makers to build an ecologically<br />
sustainable society that meets human needs.<br />
<strong>Worldwatch</strong> has catalyzed effective environmental decision making since 1974. The <strong>Institute</strong>’s<br />
interdisciplinary research is based on the best available science and focuses on the challenges that<br />
climate change, resource degradation, and population growth pose for meeting human needs in<br />
the 21st century. <strong>Worldwatch</strong> seeks innovative solutions to intractable problems-emphasizing a<br />
blend of government leadership, private sector enterprise, and citizen action that can make a sustainable<br />
future a reality.<br />
Based in Washington, D.C., <strong>Worldwatch</strong> leverages its Internet presence and strong network of<br />
partners in more than a dozen countries for wider global impact. Its research is disseminated in<br />
over 20 languages through innovative use of print and online media.<br />
Financial support for the <strong>Institute</strong> is provided by the American Clean Skies Foundation, the Blue<br />
Moon Fund, the Casten Family Foundation, the Compton Foundation, Inc., the German<br />
Government, the Richard and Rhoda Goldman Fund, The Goldman Environmental Prize, the Jake<br />
Family Fund, the W. K. Kellogg Foundation, the Steven C. Leuthold Family Foundation, the<br />
Norwegian Royal Ministry of Foreign Affairs, the V. Kann Rasmussen Foundation, The Shared<br />
Earth Foundation, The Shenandoah Foundation, the Sierra Club, Stonyfield Farm, the TAUPO<br />
Fund, the Flora L. Thornton Foundation, the United Nations Population Fund, the United Nations<br />
Environment Programme, the Wallace Genetic Foundation, Inc., the Wallace Global Fund, the<br />
Johanette Wallerstein <strong>Institute</strong>, and the Winslow Foundation. The <strong>Institute</strong> also receives financial<br />
support from many individual donors who share our commitment to a more sustainable society.<br />
w w w . w o r l d w a t c h . o r g L O W - C A R B O N E N E R G Y : A R O A D M A P 49
R E L E A S E S J A N U A R Y 2 0 0 9 !<br />
STATE OF THE WORLD 2009<br />
Into a Warming World<br />
“State of the World 2009 is a research masterpiece,<br />
the single most important reference guide to<br />
climate change yet published.”<br />
—Alex Steffen, Executive Editor, Worlchanging.com<br />
“Top-ranked annual book on sustainable development.”<br />
—GlobeScan survey of sustainability experts<br />
This comprehensive guide conveys the profound, long-term consequences<br />
of global warming for humanity and our planet and investigates a wide range<br />
of potential paths to change including: new technologies, policy changes,<br />
consumption practices, and finance—with the ultimate goal of mobilizing<br />
nations and citizens around the world to work together towards combating<br />
global warming before it’s too late.<br />
• Available January 2009<br />
• $19.95 plus shipping<br />
and handling<br />
ORDER TODAY!<br />
Four Easy Ways to Order:<br />
• Phone:<br />
toll free 1-877-539-9946<br />
within the U.S.<br />
or 301-747-2340<br />
internationally<br />
• Fax:<br />
1-301-567-9553<br />
• E-mail:<br />
wwpub@worldwatch.org<br />
• Online:<br />
www.worldwatch.org<br />
Table of Contents:<br />
Chapter 1. The Perfect Storm<br />
Chapter 2. Safe Landing<br />
Chapter 3. Using Land to Cool the Earth<br />
Chapter 4. Harnessing Low-Carbon Energy on a Grand Scale<br />
Chapter 5. Building Resilience<br />
Chapter 6. Sealing the Deal to Save the Climate<br />
From the Foreword:<br />
“This publication comes at a time when governments are focused on reaching<br />
an agreement in Copenhagen at the end of 2009 to tackle the challenge<br />
of climate change. It will undoubtedly influence the negotiators from different<br />
countries to look beyond narrow and short-term concerns that are far<br />
too often the reason for inaction. We all need to encourage and join them<br />
in showing a commitment to meet this global challenge before it is too late.”<br />
—R.K. Pachauri, Chairman, Intergovernmental Panel on Climate Change<br />
Special Features:<br />
STATE OF THE WORLD 2009 includes<br />
Climate Connections,<br />
22 essays by experts on topics including:<br />
• Biodiversity<br />
• Economics of Climate Change<br />
• Cap and Trade<br />
• Health Implications<br />
• Carbon Tax<br />
• Green Jobs<br />
• Carbon Capture and • Technology Transfer<br />
Sequestration (CCS) • Other Greenhouse Gases<br />
• Cities: Mitigation and Adaptation<br />
Plus a Quick-Reference Climate Change Guide and Glossary<br />
of 38 key terms for understandingclimate change.<br />
www.worldwatch.org<br />
Visit our website at www.worldwatch.org for information<br />
on all of our publications or to sign up for our e-newsletter.<br />
DAIFLY
WO R L DWATC H R E P O RT 178<br />
Low-Carbon Energy:<br />
A Roadmap<br />
The world is now in the early stages of an energy revolution that over the<br />
next few decades could be as momentous as the emergence of oil- and<br />
electricity-based economies a century ago. Double-digit market growth,<br />
annual capital flows of more than $100 billion, sharp declines in technology<br />
costs, and rapid progress in government policies all herald a promising<br />
new energy era.<br />
Technologies available today, and those expected to become competitive<br />
over the next decade, will permit a rapid decarbonization of the global<br />
energy economy. New renewable energy technologies, combined with a<br />
broad suite of energy-efficiency advances, will allow global energy needs<br />
to be met without fossil fuels and by adding only minimally to the cost of<br />
energy services.<br />
Advanced automotive, electronics, and buildings systems will allow a substantial<br />
reduction in carbon dioxide emissions. The savings from these<br />
measures can effectively pay for a significant portion of the additional<br />
cost of advanced renewable energy technologies to replace fossil fuels,<br />
including wind, solar, geothermal, and bio energy.<br />
WWW.WORLDWATCH.ORG