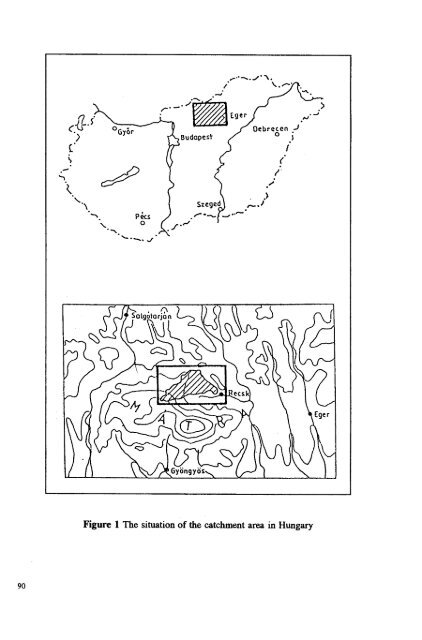
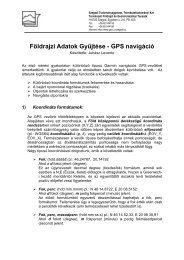
,/ ,.° -- ,...0 /", (l - ro- Eger oN°-J ( J-- , \.) Debrcccn ... "> BudQpe~t o j tO i \ ( i o-° / '-1- . ,;' ~ ' " '\ szeg '-- pecs ..-' '\. o ,J -', °-. ../ Figure 1 The situation of <strong>the</strong> catchment area <strong>in</strong> Hungary 90
The basic ecological conditions are not modified by <strong>the</strong> changes <strong>in</strong> ownership and th erefore a catchment area (Fig. 1) was chosen as <strong>the</strong> test site unit. Consider<strong>in</strong>g this fact, <strong>the</strong> USLE formula was applied to <strong>the</strong> catchment area. The ma<strong>in</strong> aim of <strong>the</strong> study was to locate those areas which are endangered by <strong>soil</strong> <strong>erosion</strong> <strong>in</strong>dependently of <strong>the</strong> borders of land parcels and to f<strong>in</strong>d areas <strong>in</strong> which <strong>the</strong> dynamic equilibrium is upset. METHODS In <strong>the</strong> <strong>in</strong>vestigation <strong>the</strong> unitied <strong>soil</strong> loss equation (USLE - Wischmeier, W. H. -Smith, D.D. 1978) was used. The USLE is an <strong>erosion</strong> model, which assesses <strong>the</strong> <strong>soil</strong>loss for a given site as <strong>the</strong> product of six major factors, whose most likely values at a particul ar location can be expressed numericaIly. The <strong>soil</strong>loss per unit area is (A): A=R*K*Ls*C*P where R - <strong>the</strong> ra<strong>in</strong>fall and runoff factor (most important part is <strong>the</strong> ra<strong>in</strong>fall erosioff <strong>in</strong>dex), K - <strong>the</strong> <strong>soil</strong> erodibility factor, Ls - slope length and steepness factor, C - surf ace cover<strong>in</strong>g and management factor, P - support practice factor. The two complicated factors K and C were controlled with <strong>the</strong> help of remote <strong>sens<strong>in</strong>g</strong> <strong>methods</strong>. The K factor was simultaneously experimentally measured <strong>in</strong> <strong>the</strong> tieId us<strong>in</strong>g a tield-plot ra<strong>in</strong>fall simulator. The K factor depends ma<strong>in</strong>lyon <strong>soil</strong> type and texture, which allows <strong>the</strong> use of remote <strong>sens<strong>in</strong>g</strong> <strong>methods</strong>. There are a lot of formulae to express <strong>the</strong> NDVI or <strong>the</strong> biomass value of a surface by measur<strong>in</strong>g <strong>the</strong> vegetation cover characteristics and from <strong>the</strong>se, <strong>the</strong> regional differences of <strong>the</strong> C factor can be assessed. The C value was also calculated from <strong>the</strong> suggested tables <strong>in</strong> Wischmeier and Smith (1978). AlI bands of <strong>the</strong> Landsat TM image recorded on 7 July, 1987 were used because <strong>the</strong> ra<strong>in</strong>fall <strong>in</strong>tensity (EI) and <strong>the</strong> predicted <strong>soil</strong> <strong>erosion</strong> give <strong>the</strong> highest rate <strong>in</strong> this early summer period. The LS values were measured us<strong>in</strong>g tieId <strong>methods</strong>. The maps were digitized <strong>in</strong> AutoCAD and <strong>the</strong> results were transferred to IDRlSI v. 4.0 (Eastman, J.R. 1992). In IDRISI <strong>the</strong> vector database was con verted <strong>in</strong>to a raster database, and stored <strong>in</strong> GIS. The rasterized database was <strong>the</strong>n used to compare tieid measurement data with <strong>the</strong> remotely sensed data. The best composite of different TM bands which substitute <strong>the</strong> slow process of <strong>the</strong> experimental tieid measurement data can <strong>the</strong>n be dist<strong>in</strong>guished . RES UL TS Some factors <strong>in</strong> <strong>the</strong> USLE formula can be easily calculated or, ow<strong>in</strong>g to <strong>the</strong> <strong>in</strong>signiticant differences, <strong>the</strong> factor value can be constant. For example, <strong>the</strong> P factor is equal to 1 for <strong>the</strong> entire catchment area because <strong>the</strong>re was no special <strong>soil</strong> conservation management. O<strong>the</strong>r factors, such as L and S, were measured at <strong>the</strong> test site: <strong>the</strong> value of steepness of land slope ranges from 10 to 12 %, while <strong>the</strong> length of land slope ranges from 300 to 500 m. The LS vaIues <strong>the</strong>refore, are more than 3 and less than 5. It may also be deduced that <strong>the</strong> steepness of <strong>the</strong> land slope is greater <strong>in</strong> <strong>the</strong> western part of <strong>the</strong> catchment than on <strong>the</strong> cultivated eastern part. 91


![TAVAK [Kompatibilitási mód]](https://img.yumpu.com/31087107/1/190x135/tavak-kompatibilitasi-mad.jpg?quality=85)