Remote sensing methods in soil erosion assessment in the Mátra ...
Remote sensing methods in soil erosion assessment in the Mátra ...
Remote sensing methods in soil erosion assessment in the Mátra ...

You also want an ePaper? Increase the reach of your titles
YUMPU automatically turns print PDFs into web optimized ePapers that Google loves.
N<br />
i<br />
')nit ro j<br />
o 1 k~<br />
. .<br />
. . . . I I ri :1 ~;~<br />
.\ L 3 " ". , !I I , 10<br />
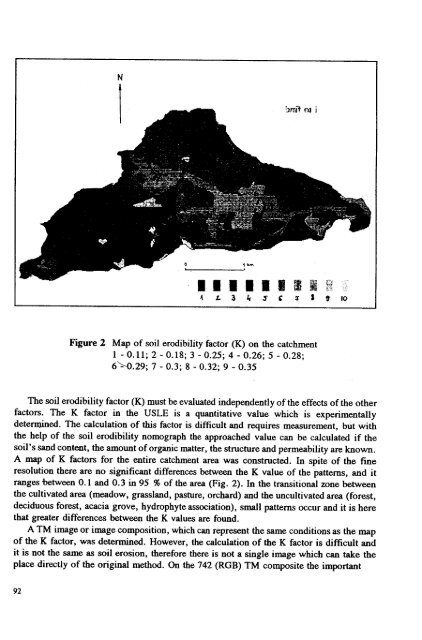
Figure 2 Map of <strong>soil</strong> erodibility factor (K) on <strong>the</strong> catchment<br />
1 - 0.11; 2 - 0.18; 3 - 0..25; 4 - 0.26; 5 co 0.28;<br />
6~.29; 7 - 0.3; 8 - 0.32; 9 - 0.35<br />
The <strong>soil</strong> erodibility factor (K) must be evaluated <strong>in</strong>dependently of <strong>the</strong> effects of <strong>the</strong> o<strong>the</strong>r<br />
factors. The K factor <strong>in</strong> <strong>the</strong> USLE is a quantitative value which is experimentally<br />
detern)<strong>in</strong>ed. The calculation of this factor is difficult and requires measurement, but with<br />
<strong>the</strong> help of <strong>the</strong> <strong>soil</strong> erodibility nomograph <strong>the</strong> approached value can be calculated if <strong>the</strong><br />
<strong>soil</strong>' s sand content, <strong>the</strong> amount of organic matter, <strong>the</strong> structure and permeability are known.<br />
A map of K factors for <strong>the</strong> entire catchment area was constructed. In spite of <strong>the</strong> f<strong>in</strong>e<br />
resolution <strong>the</strong>re are no significant differences between <strong>the</strong> K value of <strong>the</strong> patterns, and it<br />
ranges between 0.1 and 0.3 <strong>in</strong> 95 % of <strong>the</strong> area (Fig. 2). In <strong>the</strong> transitional zone between<br />
<strong>the</strong> cultivated area (meadow, grass land, pasture, orchard) and <strong>the</strong> uncultivated area (forest,<br />
deciduous forest, acacia grove, hydrophyte association), small patterns occur and it is here<br />
that greater differences between <strong>the</strong> K values are found.<br />
A TM image or image composition, which can represen<strong>the</strong> same conditions as <strong>the</strong> map<br />
of <strong>the</strong> K factor, was determ<strong>in</strong>ed. However, <strong>the</strong> calculation of <strong>the</strong> K factor is difficult and<br />
it is not <strong>the</strong> game as <strong>soil</strong> <strong>erosion</strong>, <strong>the</strong>refore <strong>the</strong>re is not a s<strong>in</strong>gle image which can take <strong>the</strong><br />
place directly of <strong>the</strong> orig<strong>in</strong>al method. on <strong>the</strong> 742 (RGB) TM composite <strong>the</strong> important<br />
92


![TAVAK [Kompatibilitási mód]](https://img.yumpu.com/31087107/1/190x135/tavak-kompatibilitasi-mad.jpg?quality=85)