2011-2012 Annual Report - Dr. Stirling McDowell Foundation for ...
2011-2012 Annual Report - Dr. Stirling McDowell Foundation for ...
2011-2012 Annual Report - Dr. Stirling McDowell Foundation for ...

Create successful ePaper yourself
Turn your PDF publications into a flip-book with our unique Google optimized e-Paper software.
the writing of the final report as one of the most difficult and least satisfying parts of their<br />
research experience, the <strong>Foundation</strong> offers report-writing assistance to interested<br />
researchers. On January 28, <strong>2012</strong> eight <strong>McDowell</strong> researchers came together <strong>for</strong> a<br />
report-writing workshop in Saskatoon. The style and <strong>for</strong>mat of final reports, along<br />
with the transition from raw data to a completed research report, were examined.<br />
Participants had the opportunity to share their experiences with one another which<br />
supported the ongoing research process.<br />
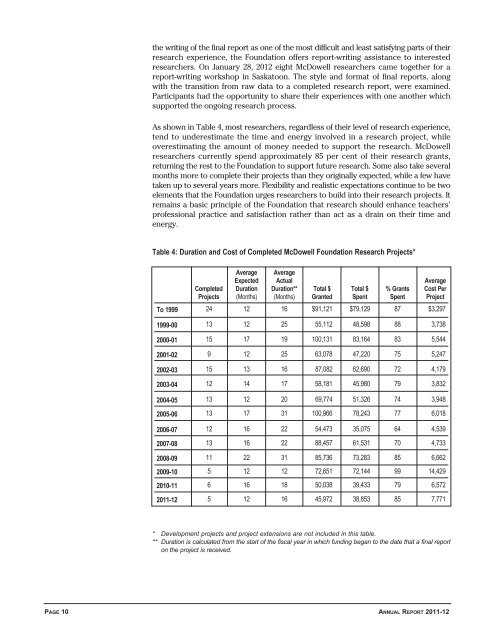
As shown in Table 4, most researchers, regardless of their level of research experience,<br />
tend to underestimate the time and energy involved in a research project, while<br />
overestimating the amount of money needed to support the research. <strong>McDowell</strong><br />
researchers currently spend approximately 85 per cent of their research grants,<br />
returning the rest to the <strong>Foundation</strong> to support future research. Some also take several<br />
months more to complete their projects than they originally expected, while a few have<br />
taken up to several years more. Flexibility and realistic expectations continue to be two<br />
elements that the <strong>Foundation</strong> urges researchers to build into their research projects. It<br />
remains a basic principle of the <strong>Foundation</strong> that research should enhance teachers’<br />
professional practice and satisfaction rather than act as a drain on their time and<br />
energy.<br />
Table 4: Duration and Cost of Completed <strong>McDowell</strong> <strong>Foundation</strong> Research Projects*<br />
To 1999<br />
1999-00<br />
2000-01<br />
2001-02<br />
2002-03<br />
2003-04<br />
2004-05<br />
2005-06<br />
2006-07<br />
2007-08<br />
2008-09<br />
2009-10<br />
2010-11<br />
<strong>2011</strong>-12<br />
Completed<br />
Projects<br />
Average<br />
Expected<br />
Duration<br />
(Months)<br />
Average<br />
Actual<br />
Duration**<br />
(Months)<br />
Total $<br />
Granted<br />
Total $<br />
Spent<br />
% Grants<br />
Spent<br />
Average<br />
Cost Per<br />
Project<br />
24 12 16 $91,121 $79,129 87 $3,297<br />
13 12 25 55,112 48,598 88 3,738<br />
15 17 19 100,131 83,164 83 5,544<br />
9 12 25 63,078 47,220 75 5,247<br />
15 13 16 87,082 62,690 72 4,179<br />
12 14 17 58,181 45,980 79 3,832<br />
13 12 20 69,774 51,326 74 3,948<br />
13 17 31 100,966 78,243 77 6,018<br />
12 16 22 54,473 35,075 64 4,539<br />
13 16 22 88,457 61,531 70 4,733<br />
11 22 31 85,736 73,283 85 6,662<br />
5 12 12 72,651 72,144 99 14,429<br />
6 16 18 50,038 39,433 79 6,572<br />
5 12 16 45,972 38,853 85 7,771<br />
* Development projects and project extensions are not included in this table.<br />
** Duration is calculated from the start of the fiscal year in which funding began to the date that a final report<br />
on the project is received.<br />
pAge 10 AnnuAl RepoRt <strong>2011</strong>-12