State estimation with Kalman Filter
State estimation with Kalman Filter
State estimation with Kalman Filter

You also want an ePaper? Increase the reach of your titles
YUMPU automatically turns print PDFs into web optimized ePapers that Google loves.
Chapter 8<br />
<strong>State</strong> <strong>estimation</strong> <strong>with</strong><br />
<strong>Kalman</strong> <strong>Filter</strong><br />
8.1 Introduction<br />
This chapter describes how to estimate the values of state variables of a<br />
dynamic system. Why can such state estimators be useful<br />
• Supervision: <strong>State</strong> estimates can provide valuable information<br />
about important variables in a physical process, for example feed<br />
composition to a reactor, flow variations to a separator, etc.<br />
• Control: In general, the more information the controller has about<br />
the process it controls, the better (mor accurate) it can control it.<br />
<strong>State</strong> estimators can be a practical or economical alternative to real<br />
measurements. For example, the environmental forces acting on a<br />
vessel can be used by the controller to better control the position of<br />
the vessel, as in Dynamic Positioning systems.<br />
Because the state estimators are kind of sensors implemented in software<br />
(computer programs) they are some times denoted soft sensors.<br />
This chapter describes the <strong>Kalman</strong> <strong>Filter</strong> which is the most important<br />
algorithm for state <strong>estimation</strong>. The <strong>Kalman</strong> <strong>Filter</strong> was developed by<br />
Rudolf E. <strong>Kalman</strong> around 1960 [7]. There is a continuous-time version of<br />
the <strong>Kalman</strong> <strong>Filter</strong> and several discrete-time versions. (The discrete-time<br />
versions are immediately ready for implementation in a computer<br />
program.) Here the predictor-corrector version of the discrete-time <strong>Kalman</strong><br />
101
F. Haugen: Kompendium for Kyb. 2 ved Høgskolen i Oslo 102<br />
<strong>Filter</strong> will be described. This version seems to be the most commonly used<br />
version.<br />
8.2 Observability<br />
A necessary condition for the <strong>Kalman</strong> <strong>Filter</strong> to work correctly is that the<br />
system for which the states are to be estimated, is observable. Therefore,<br />
you should check for observability before applying the <strong>Kalman</strong> <strong>Filter</strong>.<br />
(There may still be other problems that prevent the <strong>Kalman</strong> <strong>Filter</strong> from<br />
producing accurate state estimates, as a faulty or inaccurate mathematical<br />
model.)<br />
Observability for the discrete-time systems can be defined as follows [13]:<br />
The discrete-time system<br />
x(k +1)=Ax(k)+Bu(k) (8.1)<br />
y(k) =Cx(k)+Du(k) (8.2)<br />
is observable if there is a finite number of time steps k so that knowledge<br />
about the input sequence u(0),...,u(k − 1) and the output sequence<br />
y(0),...,y(k − 1) is sufficient to determine the initial state state of the<br />
system, x(0).<br />
Let us derive a criterion for the system to be observable. Since the<br />
influende of input u on state x is known from the model, let us for<br />
simplicity assume that u(k) =0. From the model (8.1) — (8.2) we get<br />
y(0) = Cx(0) (8.3)<br />
y(1) = Cx(1) = CAx(0) (8.4)<br />
.<br />
y(n − 1) = CA n−1 x(0) (8.5)<br />
whichcanbeexpressedcompactlyas<br />
⎡ ⎤ ⎡<br />
C<br />
CA<br />
⎢ ⎥x(0) = ⎢<br />
⎣ . ⎦ ⎣<br />
CA n−1<br />
| {z }<br />
M obs<br />
y(0)<br />
y(1)<br />
⎤<br />
⎥<br />
⎦<br />
.<br />
|<br />
y(n − 1)<br />
{z }<br />
Y<br />
(8.6)
F. Haugen: Kompendium for Kyb. 2 ved Høgskolen i Oslo 103<br />
Let us make a definition:<br />
Observability matrix:<br />
⎡ ⎤<br />
C<br />
CA<br />
M obs = ⎢ ⎥<br />
⎣ . ⎦<br />
CA n−1<br />
(8.7)<br />
(8.6) has a unique solution only if the rank of M obs is n. Therefore:<br />
Observability Criterion:<br />
The system (8.1) — (8.2) is observable if and only if the observability<br />
matrix has rank equal to n where n is the order of the system model (the<br />
number state variables).<br />
The rank can be checked by calculating the determinant of M obs .Ifthe<br />
determinant is non-zero, the rank is full, and hence, the system is<br />
observable. If the determinant is zero, system is non-observable.<br />
Non-observability has several concequences:<br />
• The transfer function from the input variable y to the output variable<br />
y has an order that is less than the number of state variables (n).<br />
• There are state variables or linear combinations of state variables<br />
that do not show any response.<br />
• The steady-state value of the <strong>Kalman</strong> <strong>Filter</strong> gain can not be<br />
computed. This gain is used to update the state estimates from<br />
measurements of the (real) system.<br />
Example 18 Observability<br />
Given the following state space model:<br />
· ¸ · ¸<br />
x1 (k +1) 1 a<br />
=<br />
x 2 (k +1) 0 1<br />
| {z }<br />
A<br />
·<br />
x1 (k)<br />
x 2 (k)<br />
y(k) = £ c 1 0 ¤ ·<br />
x1 (k)<br />
| {z } x 2 (k)<br />
C<br />
¸<br />
¸<br />
+ [0]<br />
· 0<br />
+<br />
1<br />
|{z}<br />
D<br />
| {z }<br />
B<br />
¸<br />
u(k) (8.8)<br />
u(k) (8.9)
F. Haugen: Kompendium for Kyb. 2 ved Høgskolen i Oslo 104<br />
The observability matrix is (n =2)<br />
⎡ £<br />
·<br />
¸<br />
c1 0 ¤ ⎤<br />
· ¸<br />
C<br />
M obs =<br />
CA 2−1 = ⎢ −−−−−−−−−−−<br />
= CA ⎣ £<br />
c1 0 ¤ · ¸ ⎥<br />
1 a ⎦ = c1 0<br />
c 1 ac 1<br />
0 1<br />
(8.10)<br />
The determinant of M obs is<br />
det (M obs )=c 1 · ac 1 − c 1 · 0=ac 1<br />
2<br />
(8.11)<br />
The system is observable only if ac 1 2 6=0.<br />
• Assume that a 6= 0which means that the first state variable, x 1 ,<br />
contains some non-zero information about the second state variable,<br />
x 2 . Then the system is observable if c 1 6=0,i.e.ifx 1 is measured.<br />
• Assume that a =0which means that x 1 contains no information<br />
about x 2 . In this case the system is non-observable despite that x 1 is<br />
measured.<br />
[End of Example 18]<br />
8.3 The <strong>Kalman</strong> <strong>Filter</strong> algorithm<br />
The <strong>Kalman</strong> <strong>Filter</strong> is a state estimator which produces an optimal<br />
estimate in the sense that the mean value of the sum (actually of any<br />
linear combination) of the <strong>estimation</strong> errors gets a minimal value. In other<br />
words, The <strong>Kalman</strong> <strong>Filter</strong> gives the following sum of squared errors:<br />
a minimal value. Here,<br />
E[e x T (k)e x (k)] = E £ e x1 2 (k)+···+ e xn 2 (k) ¤ (8.12)<br />
e x (k) =x est (x) − x(k) (8.13)<br />
is the <strong>estimation</strong> error vector. (The Kaman <strong>Filter</strong> estimate is sometimes<br />
denoted the “least mean-square estimate”.) This assumes actually that the<br />
model is linear, so it is not fully correct for nonlinear models. It is assumed<br />
the that the system for which the states are to be estimated is excited by<br />
random (“white”) disturbances ( or process noise) and that the
F. Haugen: Kompendium for Kyb. 2 ved Høgskolen i Oslo 105<br />
measurements (there must be at least one real measurement in a <strong>Kalman</strong><br />
<strong>Filter</strong>) contain random (“white”) measurement noise.<br />
The <strong>Kalman</strong> <strong>Filter</strong> has many applications, e.g. in dynamic positioning of<br />
ships where the <strong>Kalman</strong> <strong>Filter</strong> estimates the position and the speed of the<br />
vessel and also environmental forces. These estimates are used in the<br />
positional control system of the ship. The <strong>Kalman</strong> <strong>Filter</strong> is also used in<br />
soft-sensor systems used for supervision, in fault-detection systems, and in<br />
Model-based Predictive Controllers (MPCs) which is an important type of<br />
model-based controllers.<br />
The <strong>Kalman</strong> <strong>Filter</strong> algorithm was originally developed for systems<br />
assumed to be represented <strong>with</strong> a linear state-space model. However, in<br />
many applications the system model is nonlinear. Furthermore the linear<br />
model is just a special case of a nonlinear model. Therefore, I have decided<br />
to present the <strong>Kalman</strong> <strong>Filter</strong> for nonlinear models, but comments are given<br />
about the linear case. The <strong>Kalman</strong> <strong>Filter</strong> for nonlinear models is denoted<br />
the Extended <strong>Kalman</strong> <strong>Filter</strong> because it is an extended use of the original<br />
<strong>Kalman</strong> <strong>Filter</strong>. However, for simplicity we can just denote it the <strong>Kalman</strong><br />
<strong>Filter</strong>, dropping “extended” in the name. The <strong>Kalman</strong> <strong>Filter</strong> will be<br />
presented <strong>with</strong>out derivation.<br />
The <strong>Kalman</strong> <strong>Filter</strong> presented below assumes that the system model<br />
consists of this discrete-time (possibly nonlinear) state space model:<br />
x(k +1)=f[x(k), u(k)] + Gw(k) (8.14)<br />
and this (possibly nonlinear) measurement model:<br />
y(k) =g[x(k), u(k)] + Hw(k)+v(k) (8.15)<br />
A linear model is just a special case:<br />
x(k +1)=Ax(k)+Bu(k) + Gw(k) (8.16)<br />
| {z }<br />
=f<br />
and<br />
y(k) =Cx(k)+Du(k) + Hw(k)+v(k) (8.17)<br />
| {z }<br />
=g<br />
The models above contains the following variables and functions:
F. Haugen: Kompendium for Kyb. 2 ved Høgskolen i Oslo 106<br />
• x is the state vector of n state variables:<br />
⎡ ⎤<br />
x 1<br />
x 2<br />
x = ⎢ ⎥<br />
⎣ . ⎦<br />
x n<br />
• u is the input vector of m input variables:<br />
⎡ ⎤<br />
u 1<br />
u 2<br />
u = ⎢ ⎥<br />
⎣ . ⎦<br />
u m<br />
(8.18)<br />
(8.19)<br />
It is assumed that the value of u is known. u includes control<br />
variables and known disturbances.<br />
• f is the system vector function:<br />
⎡<br />
f = ⎢<br />
⎣<br />
f 1 ()<br />
f 2 ()<br />
.<br />
f n ()<br />
⎤<br />
⎥<br />
⎦<br />
(8.20)<br />
where f i () is any nonlinear or linear function.<br />
• w is random (white) disturbance (or process noise) vector:<br />
⎡ ⎤<br />
w 1<br />
w 2<br />
w = ⎢ ⎥<br />
⎣ . ⎦<br />
w q<br />
(8.21)<br />
<strong>with</strong> auto-covariance<br />
R w (L) =Qδ(L) (8.22)<br />
where Q (a q × q matrix of constants) is the auto-covariance of w at<br />
lag L =0. δ(L) is the unit pulse function, cf. (6.25). A standard<br />
assumption is that<br />
⎡<br />
⎤<br />
Q 11 0 0 0<br />
0 Q 22 0 0<br />
Q = ⎢<br />
⎣<br />
.<br />
0 0 ..<br />
⎥<br />
0 ⎦ = diag(Q 11,Q 22 , ··· ,Q nn ) (8.23)<br />
0 0 0 Q nn<br />
Hence, the number q of process disturbances is assumed to be equal<br />
to the number n of state variables. Q ii is the variance of w i .
F. Haugen: Kompendium for Kyb. 2 ved Høgskolen i Oslo 107<br />
• G is the process noise gain matrix relating the process noise to the<br />
state variables. It is common to assume that q = n, makingG square:<br />
⎡<br />
⎤<br />
G 11 0 0 0<br />
0 G 22 0 0<br />
G = ⎢<br />
⎣<br />
.<br />
0 0 ..<br />
⎥<br />
(8.24)<br />
0 ⎦<br />
0 0 0 Q nn<br />
In addition it is common to set the elements of G equal to one:<br />
making G an identity matrix:<br />
⎡<br />
G = ⎢<br />
⎣<br />
G ii =1 (8.25)<br />
1 0 0 0<br />
0 1 0 0<br />
0 0 . . . 0<br />
0 0 0 1<br />
⎤<br />
⎥<br />
⎦ = I n (8.26)<br />
• y is the measurement vector of r measurement variables:<br />
⎡ ⎤<br />
y 1<br />
y 2<br />
y = ⎢ ⎥<br />
⎣ . ⎦<br />
y r<br />
(8.27)<br />
• g is the measurement vector function:<br />
⎡<br />
g 1 ()<br />
g 2 ()<br />
g = ⎢<br />
⎣ .<br />
g r ()<br />
⎤<br />
⎥<br />
⎦<br />
(8.28)<br />
where g i () is any nonlinear or linear function. Typically, g is a linear<br />
function on the form<br />
g(x) =Cx (8.29)<br />
where C is the measurement gain matrix.<br />
• H is a gain matrix relating the disturbances directly to the<br />
measurements (there will in addition be an indirect relation because<br />
the disturbances acts on the states, and some of the states are<br />
measured). It is however common to assume that H is a zero matrix<br />
of dimension (r × q):<br />
⎡<br />
⎤<br />
0 0 0 0<br />
⎢<br />
H = ⎣<br />
.<br />
0 0 ..<br />
⎥<br />
. ⎦ (8.30)<br />
0 0 ··· H rq
F. Haugen: Kompendium for Kyb. 2 ved Høgskolen i Oslo 108<br />
• v is a random (white) measurement noise vector:<br />
⎡ ⎤<br />
v 1<br />
v 2<br />
v = ⎢ ⎥<br />
⎣ . ⎦<br />
v r<br />
(8.31)<br />
<strong>with</strong> auto-covariance<br />
R v (L) =Rδ(L) (8.32)<br />
where R (a r × r matrix of constants) is the auto-covariance of v at<br />
lag L =0. A standard assumption is that<br />
⎡<br />
⎤<br />
R 11 0 0 0<br />
0 R 22 0 0<br />
R = ⎢<br />
⎣<br />
.<br />
0 0 ..<br />
⎥<br />
0 ⎦ = diag(R 11,R 22 , ··· ,R rr ) (8.33)<br />
0 0 0 R rr<br />
Hence, R ii isthevarianceofv i .<br />
Note: If you need to adjust the “strength” or power of the process noise w<br />
or the measurement noise v, you can do it by increasing the variances, Q<br />
and R, respectively.<br />
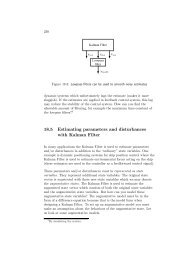
Here you have the <strong>Kalman</strong> <strong>Filter</strong>: (The formulas (8.35) — (8.37) below are<br />
represented by the block diagram shown in Figure 8.1.)<br />
<strong>Kalman</strong> <strong>Filter</strong> state <strong>estimation</strong>:<br />
1. This step is the initial step, and the operations here are executed only<br />
once. Assume that the initial guess of the state is x init . The initial<br />
value x p (0) of the predicted state estimate x p (which is calculated<br />
continuously as described below) is set equal to this initial value:<br />
Initial state estimate<br />
x p (0) = x init (8.34)<br />
2. Calculate the predicted measurement estimate from the predicted<br />
state estimate:<br />
Predicted measurement estimate:<br />
y p (k) =g [x p (k)] (8.35)<br />
(It is assumed that the noise terms Hv(k) and w(k) are not known or<br />
are unpredictable (since they are white noise), so they can not be<br />
used in the calculation of the predicted measurement estimate.)
F. Haugen: Kompendium for Kyb. 2 ved Høgskolen i Oslo 109<br />
3. Calculate the so-called innovation process or variable – it is actually<br />
the measurement estimate error – as the difference between the<br />
measurement y(k) and the predicted measurement y p (k):<br />
Innovation variable:<br />
e(k) =y(k) − y p (k) (8.36)<br />
4. Calculate the corrected state estimate x c (k) by adding the corrective<br />
term Ke(k) to the predicted state estimate x p (k):<br />
Corrected state estimate:<br />
x c (k) =x p (k)+Ke(k) (8.37)<br />
Here, K is the <strong>Kalman</strong> <strong>Filter</strong> gain. The calculation of K is described<br />
below.<br />
Note: Itisx c (k) that is used as the state estimate in applications 1 .<br />
About terminology: The corrected estimate is also denoted the<br />
posteriori estimate because it is calculated after the present<br />
measurement is taken. It is also denoted the measurement-updated<br />
estimate.<br />
Due to the measurement-based correction term of the <strong>Kalman</strong> <strong>Filter</strong>,<br />
you can except the errors of the state estimates to be smaller than if<br />
there were no such correction term. This correction can be regarded<br />
as a feedback correction of the estimates, and it is well known from<br />
dynamic system theory, and in particular control systems theory,<br />
that feedback from measurements reduces errors. This feedback is<br />
indicated in Figure 8.1.<br />
5. Calculate the predicted state estimate for the next time step,<br />
x p (k +1), using the present state estimate x c (k) and the known<br />
input u(k) in process model:<br />
Predicted state estimate:<br />
x p (k +1)=f[x c (k), u(k)] (8.38)<br />
(It is assumed that the noise term Gv(k) is not known or is<br />
unpredictable, since it is random, so it can not be used in the<br />
calculation of the state estimate.)<br />
About terminology: The predicted estimate is also denoted the priori<br />
estimate because it is calculated before the present measurement is<br />
taken. It is also denoted the time-updated estimate.
F. Haugen: Kompendium for Kyb. 2 ved Høgskolen i Oslo 110<br />
Real system (process)<br />
Process noise<br />
(disturbances)<br />
w(k)<br />
(Commonly no connection)<br />
Measurement<br />
noise<br />
v(k)<br />
u(k)<br />
Known inputs<br />
(control variables<br />
and disturbances)<br />
Process<br />
x(k)<br />
x(k+1) = f[x(k),u(k)] + Gw(k)<br />
(Commonly no connection)<br />
<strong>State</strong> variable<br />
(unknown value)<br />
Sensor<br />
y(k) = g[x(k),u(k)]<br />
+ Hw(k) + v(k)<br />
Measurement<br />
variable<br />
y(k)<br />
(Commonly no connection)<br />
<strong>Kalman</strong> <strong>Filter</strong><br />
f()<br />
System<br />
function<br />
x p (k+1)<br />
1/z<br />
Corrected<br />
estimate<br />
x c (k)<br />
Unit<br />
delay<br />
x c (k)<br />
x p (k)<br />
Predicted<br />
estimate<br />
Applied state<br />
estimate<br />
Ke(k)<br />
g()<br />
K<br />
y p (k)<br />
Measurement<br />
function<br />
<strong>Kalman</strong> gain<br />
e(k)<br />
Innovation<br />
variable<br />
or ”process”<br />
Feedback<br />
correction<br />
of estimate<br />
Figure 8.1: The <strong>Kalman</strong> <strong>Filter</strong> algorithm (8.35) — (8.38) represented by a block<br />
diagram<br />
(8.35) — (8.38) can be represented by the block diagram shown in Figure<br />
8.1.<br />
The <strong>Kalman</strong> <strong>Filter</strong> gain is a time-varying gain matrix. It is given by the<br />
algorithm presented below. In the expressions below the following matrices<br />
are used:<br />
• Auto-covariance matrix (for lag zero) of the <strong>estimation</strong> error of the<br />
corrected estimate:<br />
P c = R ex c (0) = E n(x − m xc )(x − m xc ) T o (8.39)<br />
1 Therefore, I have underlined the formula.
F. Haugen: Kompendium for Kyb. 2 ved Høgskolen i Oslo 111<br />
• Auto-covariance matrix (for lag zero) of the <strong>estimation</strong> error of the<br />
predicted estimate:<br />
n<br />
o<br />
P d = R exd (0) = E (x − m xd )(x − m xd ) T (8.40)<br />
• The transition matrix A of a linearized model of the original<br />
nonlinear model (8.14) calculated <strong>with</strong> the most recent state<br />
estimate, which is assumed to be the corrected estimate x c (k):<br />
A = ∂f(·)<br />
¯<br />
∂x<br />
¯xc (k),u(k)<br />
(8.41)<br />
• The measurement gain matrix C of a linearized model of the original<br />
nonlinear model (8.15) calculated <strong>with</strong> the most recent state<br />
estimate:<br />
C = ∂g(·)<br />
¯<br />
(8.42)<br />
∂x<br />
¯xc(k),u(k)<br />
However, it is very common that C = g(), and in these cases no<br />
linearization is necessary.<br />
The <strong>Kalman</strong> <strong>Filter</strong> gain is calculated as follows (these calculations are<br />
repeated each program cycle):<br />
<strong>Kalman</strong> <strong>Filter</strong> gain:<br />
1. This step is the initial step, and the operations here are executed<br />
only once. The initial value P p (0) can be set to some guessed value<br />
(matrix), e.g. to the identity matrix (of proper dimension).<br />
2. Calculation of the <strong>Kalman</strong> Gain:<br />
<strong>Kalman</strong> <strong>Filter</strong> gain:<br />
K(k) =P p (k)C T [CP p (k)C T + R] −1 (8.43)<br />
3. Calculation of auto-covariance of corrected state estimate error:<br />
Auto-covariance of corrected state estimate error:<br />
P c (k) =[I − K(k)C] P p (k) (8.44)<br />
4. Calculation of auto-covariance of the next time step of predicted state<br />
estimate error:<br />
Auto-covariance of predicted state estimate error:<br />
P p (k +1)=AP c (k)A T + GQG T (8.45)
F. Haugen: Kompendium for Kyb. 2 ved Høgskolen i Oslo 112<br />
Here are comments to the <strong>Kalman</strong> <strong>Filter</strong> algorithm presented above:<br />
1. Order of formulas in the program cycle: The <strong>Kalman</strong> <strong>Filter</strong><br />
formulas can be executed in the following order:<br />
• (8.43), <strong>Kalman</strong> <strong>Filter</strong> gain<br />
• (8.36), innovation process (variable)<br />
• (8.37), corrected state estimate, which is the state estimate to be<br />
used in applications<br />
• (8.38), predicted state estimate of next time step<br />
• (8.44), auto-covarience of error of corrected estimate<br />
• (8.41),transitionmatrixinlinearmodel<br />
• (8.42), measurement matrix in linear model<br />
• (8.45), auto-covarience of error of predicted estimate of next<br />
time step<br />
2. Steady-state <strong>Kalman</strong> <strong>Filter</strong> gain. If the model is linear and time<br />
invariant (i.e. system matrices are not varying <strong>with</strong> time) the<br />
auto-covariances P c and P p will converge towards steady-state values.<br />
Consequently, the <strong>Kalman</strong> <strong>Filter</strong> gain will converge towards a<br />
steady-state <strong>Kalman</strong> <strong>Filter</strong> gain value, K 2 s ,whichcanbe<br />
pre-calculated. It is quite common to use only the steady-state gain<br />
in applications.<br />
For a nonlinear system K s may vary <strong>with</strong> the operating point (if the<br />
system matrix A of the linearized model varies <strong>with</strong> the operating<br />
point). In practical applications K s may be re-calculated as the<br />
operating point changes.<br />
Figure 8.2 illustrates the information needed to compute the<br />
steady-state <strong>Kalman</strong> <strong>Filter</strong> gain, K s .<br />
3. Model errors. There are always model errors since no model can<br />
give a perfect description of a real (practical system). It is possible to<br />
analyze the implications of the model errors on the state estimates<br />
calculated by the <strong>Kalman</strong> <strong>Filter</strong>, but this will not be done in this<br />
book. However, in general, the <strong>estimation</strong> errors are smaller <strong>with</strong> the<br />
<strong>Kalman</strong> <strong>Filter</strong> than <strong>with</strong> a so-called ballistic state estimator, whichis<br />
the state estimator that you get if the <strong>Kalman</strong> <strong>Filter</strong> gain K is set to<br />
zero. In the latter case there is no correction of the estimates. It is<br />
only the predictions (8.38) that make up the estimates. The <strong>Kalman</strong><br />
<strong>Filter</strong> then just runs as a simulator.<br />
2 MATLAB and LabVIEW have functions for calculating the steady-state <strong>Kalman</strong> Gain.
F. Haugen: Kompendium for Kyb. 2 ved Høgskolen i Oslo 113<br />
Transition matrix<br />
Process noise gain matrix<br />
Measurement gain matrix<br />
Process noise auto-covariance<br />
Measurement noise auto -covariance<br />
A<br />
G<br />
C<br />
Q<br />
R<br />
Steady state<br />
<strong>Kalman</strong><br />
<strong>Filter</strong> gain<br />
K s<br />
K s<br />
Figure 8.2: Illustration of what information is needed to compute the steadystate<br />
<strong>Kalman</strong> <strong>Filter</strong> gain, K s .<br />
Note that you can try to estimate model errors by augmenting the<br />
states <strong>with</strong> states representing the model errors. Augmented <strong>Kalman</strong><br />
<strong>Filter</strong> is described in Section 8.4.<br />
4. How to tune the <strong>Kalman</strong> <strong>Filter</strong>: Usually it is necessary to<br />
fine-tune the <strong>Kalman</strong> <strong>Filter</strong> when it is connected to the real system.<br />
The process disturbance (noise) auto-covariance Q and/or the<br />
measurement noise auto-covariance R arecommonlyusedforthe<br />
tuning. However, since R is relatively easy to calculate from a time<br />
series of measurements (using some variance function in for example<br />
LabVIEW or MATLAB), we only consider adjusting Q here.<br />
What is good behaviour of the <strong>Kalman</strong> <strong>Filter</strong> How can good<br />
behaviour be observed It is when the estimates seems to have<br />
reasonable values as you judge from your physical knowledge about<br />
the physical process. In addition the estimates must not be too<br />
noisy! What is the cause of the noise In real systems it is mainly<br />
the measurement noise that introduces noise into the estimates. How<br />
do you tune Q to avoid too noisy estimates The larger Q the<br />
stronger measurement-based updating of the state estimates because<br />
a large Q tells the <strong>Kalman</strong> <strong>Filter</strong> that the variations in the real state<br />
variables are assumed to be large (remember that the process noise<br />
influences on the state variables, cf. (8.15)). Hence, the larger Q the<br />
larger <strong>Kalman</strong> Gain K and the stronger updating of the estimates.<br />
But this causes more measurement noise to be added to the<br />
estimates because the measurement noise is a term in the innovation<br />
process e which is calculated by K:<br />
x c (k) = x p (k)+Ke(k) (8.46)<br />
= x p (k)+K {g [x(k)] + v(k) − g [x p (k)]} (8.47)<br />
where v is real measurement noise. So, the main tuning rule is as<br />
follows: Select as large Q as possible <strong>with</strong>out the state estimates<br />
becoming too noisy.
F. Haugen: Kompendium for Kyb. 2 ved Høgskolen i Oslo 114<br />
But Q is a matrix! How to select it “large” or “small”. Since each of<br />
the process disturbances typically are assumed to act on their<br />
respective state independently, Q can be set as a diagonal matrix:<br />
⎡<br />
⎤<br />
Q 11 0 0 0<br />
0 Q 22 0 0<br />
Q = ⎢<br />
⎣<br />
.<br />
0 0 ..<br />
⎥<br />
0 ⎦ = diag(Q 11,Q 22 , ··· ,Q nn ) (8.48)<br />
0 0 0 Q nn<br />
where each of the diagonal elements can be adjusted independently.<br />
If you do not have any idea about numerical values, you can start by<br />
setting all the diagonal elements to one, and hence Q is<br />
⎡<br />
⎤<br />
1 0 0 0<br />
0 1 0 0<br />
Q = Q 0 ⎢<br />
⎣ 0 0 . .<br />
⎥<br />
(8.49)<br />
. 0 ⎦<br />
0 0 0 1<br />
where Q 0 is the only tuning parameter. If you do not have any idea<br />
about a proper value of Q 0 you may initially try<br />
Q 0 =0.01 (8.50)<br />
Then you may adjust Q 0 or try to fine tune each of the diagonal<br />
elements individually.<br />
5. The error-model: Assuming that the system model is linear and<br />
that the model is correct (giving a correct representation of the real<br />
system), it can be shown that the behaviour of the error of the<br />
corrected state <strong>estimation</strong>, e xc (k), cf. (8.13), is given by the following<br />
error-model: 3<br />
Error-model of <strong>Kalman</strong> <strong>Filter</strong>:<br />
e xc (k +1)=(I − KC) Ae xc (k)+(I − KC) Gv(k) − Kw(k +1)<br />
(8.51)<br />
This model can be used to analyze the <strong>Kalman</strong> <strong>Filter</strong>.<br />
Note: (8.13) is not identical to the auto-covariance of the <strong>estimation</strong><br />
error which is<br />
P c (k) =E{[e xc (k) − m xc (k)][e xc (k) − m xc (k)] T } (8.52)<br />
But (8.13) is the trace of P c (the trace is the sum of the diagonal<br />
elements):<br />
e xc = trace [ P c (k)] (8.53)<br />
3 You can derive this model by subtracting the model describing the corrected state<br />
estimate from the model that describes the real state (the latter is simply the process<br />
model).
F. Haugen: Kompendium for Kyb. 2 ved Høgskolen i Oslo 115<br />
6. The dynamics of the <strong>Kalman</strong> <strong>Filter</strong>. The error-model (8.51) of<br />
the <strong>Kalman</strong> <strong>Filter</strong> represents a dynamic system. The dynamics of the<br />
<strong>Kalman</strong> <strong>Filter</strong> is given can be analyzed by calculating the eigenvalues<br />
of the system matrix of (8.51). These eigenvalues are<br />
{λ 1 ,λ 2 ,...,λ n } = eig [(I − KC)A] (8.54)<br />
7. The stability of the <strong>Kalman</strong> <strong>Filter</strong>. It can be shown that the<br />
<strong>Kalman</strong> <strong>Filter</strong> always is an asymptotically stable dynamic system<br />
(otherwise it could not give an optimal estimate). In other words,<br />
the eigenvalues defined by (8.54) are always inside the unity circle.<br />
8. Testing the <strong>Kalman</strong> <strong>Filter</strong> before practical use: As<strong>with</strong>every<br />
model-based algorithm (as controllers) you should test your <strong>Kalman</strong><br />
<strong>Filter</strong> <strong>with</strong> a simulated process before applying it to the real system.<br />
You can implement a simulator in e.g. LabVIEW or<br />
MATLAB/Simulink since you already have a model (the <strong>Kalman</strong><br />
<strong>Filter</strong> is model-based).<br />
Firstly, you should test the <strong>Kalman</strong> <strong>Filter</strong> <strong>with</strong> the nominal model in<br />
the simulator, including process and measurement noise. This is the<br />
model that you are basing the <strong>Kalman</strong> <strong>Filter</strong> on. Secondly, you<br />
should introduce some reasonable model errors by making the<br />
simulator model somewhat different from the <strong>Kalman</strong> <strong>Filter</strong> model,<br />
and observe if the <strong>Kalman</strong> <strong>Filter</strong> still produces usable estimates.<br />
9. Predictor type <strong>Kalman</strong> <strong>Filter</strong>. In the predictortypeofthe<br />
<strong>Kalman</strong> <strong>Filter</strong> there is only one formula for the calculation of the<br />
state estimate:<br />
x est (k +1)=Ax est (k)+K[y(k) − Cx est (k)] (8.55)<br />
Thus, there is no distinction between the predicted state estimate<br />
and the corrected estimate (it the same variable). (Actually, this is<br />
the original version of the <strong>Kalman</strong> <strong>Filter</strong>[7].) The predictor type<br />
<strong>Kalman</strong> <strong>Filter</strong> has the drawback that there is a time delay of one<br />
time step between the measurement y(k) and the calculated state<br />
estimate x est (k +1).<br />
8.4 Estimating parameters and disturbances <strong>with</strong><br />
<strong>Kalman</strong> <strong>Filter</strong><br />
In many applications the <strong>Kalman</strong> <strong>Filter</strong> is used to estimate parameters<br />
and/or disturbances in addition to the “ordinary” state variables. One
F. Haugen: Kompendium for Kyb. 2 ved Høgskolen i Oslo 116<br />
example is dynamic positioning systems for ship position control where the<br />
<strong>Kalman</strong> <strong>Filter</strong> is used to estimate environmental forces acting on the ship<br />
(these estimates are used in the controller as a feedforward control signal).<br />
These parameters and/or disturbances must be represented as state<br />
variables. They represent additional state variables. The original state<br />
vector is augmented <strong>with</strong> these new state variables which we may denote<br />
the augmentative states. The <strong>Kalman</strong> <strong>Filter</strong> is used to estimate the<br />
augmented state vector which consists of both the original state variables<br />
and the augmentative state variables. But how can you model these<br />
augmentative state variables The augmentative model must be in the<br />
form of a difference equation because that is the model form of state<br />
variables are defined. To set up an augmentative model you must make an<br />
assumption about the behaviour of the augmentative state. Let us look at<br />
some augmentative models.<br />
• Augmentative state is (almost) constant: The most common<br />
augmentative model is based on the assumption that the<br />
augmentative state variable x a is slowly varying, almost constant.<br />
The corresponding differential equation is<br />
ẋ a (t) =0 (8.56)<br />
Discretizing this differential equation <strong>with</strong> the Euler Forward method<br />
gives<br />
x a (k +1)=x a (k) (8.57)<br />
which is a difference equation ready for <strong>Kalman</strong> <strong>Filter</strong> algorithm. It<br />
is however common to assume that the state is driven by some noise,<br />
hence the augmentative model become:<br />
x a (k +1)=x a (k)+w a (k) (8.58)<br />
where w a is white process noise <strong>with</strong> assumed auto-covariance on the<br />
form R wa (L) =Q a δ(L). As pointed out in Section 8.3, the variance<br />
Q a can be used as a tuning parameter of the <strong>Kalman</strong> <strong>Filter</strong>.<br />
• Augmentative state has (almost) constant rate: The<br />
corresponding differential equation is<br />
or, in state space form, <strong>with</strong> x a1 ≡ x a ,<br />
ẍ a =0 (8.59)<br />
ẋ a1 = x a2 (8.60)<br />
ẋ a2 =0 (8.61)
F. Haugen: Kompendium for Kyb. 2 ved Høgskolen i Oslo 117<br />
where x a2 is another augmentative state variable. Applying Euler<br />
Forward discretization <strong>with</strong> sampling interval h [sec] to (8.60) —<br />
(8.61) and including white process noise to the resulting difference<br />
equations gives<br />
x a1 (k +1)=x a1 (k)+hx a2 (k)+w a1 (k) (8.62)<br />
x a2 (k +1)=x a2 (k)+w a2 (k) (8.63)<br />
Once you have defined the augmented model, you can design and<br />
implement the <strong>Kalman</strong> <strong>Filter</strong> in the usual way. The <strong>Kalman</strong> <strong>Filter</strong> then<br />
estimates both the original states and the augmentative states.<br />
The following example shows how the state augementation can be done in<br />
a practical application. The example also shows how to use functions in<br />
LabVIEW and in MATLAB to calculate the steady state <strong>Kalman</strong> <strong>Filter</strong><br />
gain.<br />
Example 19 <strong>Kalman</strong> <strong>Filter</strong><br />
Figure 8.3 shows a liquid tank. We will design a steady state <strong>Kalman</strong><br />
<strong>Filter</strong> to estimate the outflow F out .Thelevelh is measured.<br />
Mass balance of the liquid in the tank is (mass is ρAh)<br />
ρA tank ḣ(t) = ρK p u − ρF out (t) (8.64)<br />
= ρK p u − ρF out (t) (8.65)<br />
After cancelling the density ρ the model is<br />
ḣ(t) = 1<br />
A tank<br />
[K p u − F out (t)] (8.66)<br />
We assume that the unknown outflow is slowly changing, almost constant.<br />
We define the following augmentative model:<br />
˙ F out (t) =0 (8.67)<br />
The model of the system is given by (8.66) — (8.67). Although it is not<br />
necessary, it is convenient to rename the state variables using standard<br />
names. So we define<br />
x 1 = h (8.68)<br />
x 2 = F out (8.69)
F. Haugen: Kompendium for Kyb. 2 ved Høgskolen i Oslo 118<br />
u [V]<br />
K p [m 3 /V]<br />
F in [m 3 /s]<br />
h [m]<br />
0<br />
A [m 2 ]<br />
F out [m 3 /s]<br />
Level<br />
sensor<br />
m [kg]<br />
[kg/m 3 ]<br />
Measured<br />
h [m]<br />
<strong>Kalman</strong><br />
<strong>Filter</strong><br />
Estimated<br />
F out<br />
Figure 8.3: Example 19: Liquid tank<br />
The model (8.66) — (8.67) is now<br />
ẋ 1 (t) = 1 [K p u(t) − x 2 (t)] (8.70)<br />
A tank<br />
ẋ 2 (t) =0 (8.71)<br />
Applying Euler Forward discretization <strong>with</strong> time step T and including<br />
white disturbance noise in the resulting difference equations yields<br />
x 1 (k +1)=x 1 (k)+<br />
T [K p u(k) − x 2 (k)] + w 1 (k) (8.72)<br />
A<br />
| tank<br />
{z }<br />
f 1 (·)<br />
x 2 (k +1)=x 2 (k) + w<br />
| {z } 2 (k) (8.73)<br />
f 2 (·)<br />
or<br />
x(k +1)=f [x(k),u(k)] + w(k) (8.74)<br />
w 1 and w 2 are independent (uncorrelated) white process noises <strong>with</strong><br />
assumed variances R w1 (L) =Q 1 δ(L) and R w2 (L) =Q 2 δ(L) respectively.<br />
Here, Q 1 and Q 2 are variances. The multivariable noise model is then<br />
· ¸<br />
w1<br />
w =<br />
(8.75)<br />
w 2
F. Haugen: Kompendium for Kyb. 2 ved Høgskolen i Oslo 119<br />
<strong>with</strong> auto-covariance<br />
where<br />
R w (L) =Qδ(L) (8.76)<br />
Q =<br />
· ¸<br />
Q11 0<br />
0 Q 22<br />
(8.77)<br />
Assuming that the level x 1 is measured, we add the following measurement<br />
equation to the state space model:<br />
y(k) =g [x p (k),u(k)] + v(k) =x 1 (k)+v(k) (8.78)<br />
where v is white measurement noise <strong>with</strong> assumed variance<br />
where R is the measurement variance.<br />
The following numerical values are used:<br />
R v (L) =Rδ(L) (8.79)<br />
Sampling time: T =0.1 s (8.80)<br />
A tank =0.1 m 2 (8.81)<br />
K p =0.001 (m 3 /s)/V (8.82)<br />
· ¸<br />
0.01 0<br />
Q =<br />
(initally, may be adjusted)<br />
0 0.01<br />
(8.83)<br />
R =0.0001 m 2 (Gaussian white noise) (8.84)<br />
We will set the initial estimates as follows:<br />
x 1p (0) = x 1 (0) = y(0) (from the sensor) (8.85)<br />
x 2p (0) = 0 (assuming no information about initial value (8.86)<br />
The <strong>Kalman</strong> <strong>Filter</strong> algorithm is as follows: The predicted level<br />
measurement is calculated according to (8.35):<br />
y p (k) =g [x p (k),u(k)] = x 1p (k) (8.87)<br />
<strong>with</strong> initial value as given by (8.85). The innovation variable is calculated<br />
according to (8.36), where y is the level measurement:<br />
e(k) =y(k) − y p (k) (8.88)<br />
The corrected state estimate is calculated according to (8.37):<br />
x c (k) =x p (k)+Ke(k) (8.89)
F. Haugen: Kompendium for Kyb. 2 ved Høgskolen i Oslo 120<br />
or, in detail:<br />
·<br />
x1c (k)<br />
x 2c (k)<br />
This is the applied esimate!<br />
¸<br />
=<br />
·<br />
x1p (k)<br />
x 2p (k)<br />
¸<br />
· ¸<br />
K11<br />
+ e(k) (8.90)<br />
K 21<br />
| {z }<br />
K<br />
Thepredictedstateestimateforthenexttimestep,x p (k +1), is calculated<br />
accordingto(8.38):<br />
x p (k +1)=f[x c (k), u(k)] (8.91)<br />
or, in detail:<br />
·<br />
x1p (k +1)<br />
x 2p (k +1)<br />
¸<br />
=<br />
· ¸ ·<br />
f1 x1c (k)+<br />
=<br />
A T<br />
tank<br />
[K p u(k) − x 2c (k)]<br />
f 2 x 2c (k)<br />
¸<br />
(8.92)<br />
To calculate the steady state <strong>Kalman</strong> <strong>Filter</strong> gain K s the following<br />
information is needed, cf. Figure 8.2:<br />
A = ∂f(·)<br />
¯<br />
∂x<br />
¯xp(k),u(k)<br />
⎡<br />
⎤<br />
∂f 1 ∂f 1<br />
∂x<br />
⎢ 1 ∂x 2<br />
⎥<br />
= ⎣<br />
⎦¯<br />
Q =<br />
G =<br />
=<br />
⎡<br />
⎣<br />
· 1 0<br />
0 1<br />
· 0.01 0<br />
0 0.01<br />
∂f 2<br />
∂x 1<br />
∂f 2<br />
∂x 2<br />
1 − T<br />
A tank<br />
0 1<br />
¯<br />
¯xp (k),u(k)<br />
⎤<br />
(8.93)<br />
(8.94)<br />
⎦ (8.95)<br />
¸<br />
= I 2 (identity matrix) (8.96)<br />
C = ∂g(·)<br />
¯<br />
(8.97)<br />
∂x<br />
¯xp (k),u(k)<br />
= £ 1 0 ¤ (8.98)<br />
¸<br />
(initially, may be adjusted) (8.99)<br />
R =0.001 m 2 (8.100)<br />
Figure 8.4 shows the front panel of a LabVIEW simulator of this example.<br />
The outflow F out = x 2 was changed during the simulation, and the <strong>Kalman</strong><br />
<strong>Filter</strong> estimates the correct steady state value (the estimate is however
F. Haugen: Kompendium for Kyb. 2 ved Høgskolen i Oslo 121<br />
Figure 8.4: Example 19: Front panel of a LabVIEW simulator of this example<br />
noisy). During the simulations, I found that (8.99) gave too noise estimate<br />
of x 2 = F out . I ended up <strong>with</strong><br />
· ¸<br />
0.01 0<br />
Q =<br />
0 10 −6 (8.101)<br />
as a proper value.<br />
Figure 8.5 shows how the steady state <strong>Kalman</strong> <strong>Filter</strong> gain K s is calculated<br />
using the <strong>Kalman</strong> Gain function. The figure also shows how to check for<br />
observability <strong>with</strong> the Observability Matrix function. Figure 8.6 shows<br />
the implementation of the <strong>Kalman</strong> <strong>Filter</strong> equations in a Formula Node.<br />
Below is MATLAB code that calculates the steady state <strong>Kalman</strong> <strong>Filter</strong><br />
gain. It is calculated <strong>with</strong> the dlqe 4 function (in Control System Toolbox).<br />
A=[1,-1;0,1]<br />
G=[1,0;0,1]<br />
C=[1,0]<br />
4 dlqe = Discrete-time linear quadratic estimator.
F. Haugen: Kompendium for Kyb. 2 ved Høgskolen i Oslo 122<br />
Figure 8.5: Example 19: Calculation of the steady state <strong>Kalman</strong> <strong>Filter</strong> gain <strong>with</strong><br />
the <strong>Kalman</strong> Gain function, and checking for observability <strong>with</strong> the Observability<br />
Matrix function.<br />
Q=[0.01,0;0,1e-6]<br />
R=[0.0001];<br />
[K,Pp,Pc,E] = dlqe(A,G,C,Q,R)<br />
K is the steady state <strong>Kalman</strong> <strong>Filter</strong> gain. (Pp and Pc are steady state<br />
<strong>estimation</strong> error auto-covariances, cf. (8.45) and (8.44). E is a vector<br />
containing the eigenvalues of the <strong>Kalman</strong> <strong>Filter</strong>, cf. (8.54).)<br />
MATLAB answers<br />
K =<br />
0.9903<br />
-0.0099<br />
Which is the same as calculated by the LabVIEW function <strong>Kalman</strong><br />
Gain, cf. Figure 8.5.
F. Haugen: Kompendium for Kyb. 2 ved Høgskolen i Oslo 123<br />
Figure 8.6: Example 19: Implementation of the <strong>Kalman</strong> <strong>Filter</strong> equations in a<br />
Formula Node. (The <strong>Kalman</strong> <strong>Filter</strong> gain is fetched from the While loop in the<br />
Block diagram using local variables.)<br />
[End of Example 19]<br />
8.5 <strong>State</strong> estimators for deterministic systems:<br />
Observers<br />
Assume that the system (process) for which we are to calculate the state<br />
estimate has no process disturbances:<br />
and no measurement noise signals:<br />
w(k) ≡ 0 (8.102)<br />
v(k) ≡ 0 (8.103)<br />
Then the system is not a stochastic system any more. In stead we can say<br />
is is non-stochastic or deterministic. Anobserver is a state estimator for a<br />
deterministic system. It is common to use the same estimator formulas in
F. Haugen: Kompendium for Kyb. 2 ved Høgskolen i Oslo 124<br />
an observer as in the <strong>Kalman</strong> <strong>Filter</strong>, namely (8.35), (8.36), (8.37) and<br />
(8.38). For convenience these formulas are repeated here:<br />
Predicted measurement estimate:<br />
y p (k) =g [x p (k)] (8.104)<br />
Innovation variable:<br />
e(k) =y(k) − y p (k) (8.105)<br />
Corrected state estimate:<br />
x c (k) =x p (k)+Ke(k) (8.106)<br />
Predicted state estimate:<br />
x p (k +1)=f[x c (k), u(k)] (8.107)<br />
The estimator gain K (corresponding to the <strong>Kalman</strong> <strong>Filter</strong> gain in the<br />
stochastic case) is calculated from a specification of the eigenvalues of the<br />
error-model of the observer. The error-model is given by (8.51) <strong>with</strong><br />
w(k) =0and v(k) =0,hence:<br />
Error-model of observers:<br />
e xc (k +1)=(I − KC) Ae | {z }<br />
xc (k) =A e e xc (k) (8.108)<br />
A e<br />
where A e is the transition matrix of the error-model. The error-model<br />
shows how the state <strong>estimation</strong> error develops as a function of time from<br />
an initial error e xc (0). If the error-model is asymptotically stable, the<br />
steady-state <strong>estimation</strong> errors will be zero (because (8.108) is an<br />
autonomous system.) The dynamic behaviour of the <strong>estimation</strong> errors is<br />
given by the eigenvalues of the transition matrix A e (8.108).<br />
But how to calculate a proper value of the estimator gain K Wecanno<br />
longer use the formulas (8.43) — (8.45). In stead, K can be calculated from<br />
the specified eigenvalues {z 1 ,z 2 ,...,z n } of A e :<br />
eig [A e ]=eig [(I − KC) A] ={z 1 ,z 2 ,...,z n } (8.109)<br />
As is known from mathematics, the eigenvalues are the λ-roots of the<br />
characteristic equation:<br />
det [zI − (I − KC) A] =(z − z 1 )(z − z 2 ) ···(z − z n )=0 (8.110)<br />
In (8.110) all terms except K are known or specified. To actually calculate<br />
K from (8.109) you should use computer tools as Matlab or LabVIEW. In
F. Haugen: Kompendium for Kyb. 2 ved Høgskolen i Oslo 125<br />
Matlab you can use the function place (in Control System Toobox). In<br />
LabVIEW you can use the function CD Place.vi (in Control Design<br />
Toolkit), and in MathScript (LabVIEW) you can use place. But how to<br />
specify the eigenvalues {z i } One possibility is to specify discrete-time<br />
Butterworth eigenvalues {z i }. Alternatively you can specify<br />
continuous-time eigenvalues {s i } which you transform to discrete-time<br />
eigenvalues using the transformation<br />
z i = e s ih<br />
(8.111)<br />
where h [s] is the time step.<br />
Example 20 Calculating the observer gain K<br />
The following MathScript-script or Matlab-script calculates the estimator<br />
gain K using the place function. Note that place calculates the gain K 1<br />
so that the eigenvalues of the matrix (A 1 − B 1 K 1 ) are as specified. place<br />
is used as follows:<br />
K=place(A,B,z)<br />
But we need to calculate K so that the eigenvalues of (I − KC) A =<br />
A − KCA are as specified. The eigenvalues of A − KCA are the same as<br />
the eigenvalues of<br />
Therefore we must use place as follows:<br />
K1=place(A’,(C*A)’,z);<br />
K=K1’<br />
Here is the script:<br />
(A − KCA) T = A T − (AC) T K T (8.112)<br />
h=0.05; %Time step<br />
s=[-2+2j, -2-2j]’; %Specified s-eigenvalues<br />
z=exp(s*h); %Corresponding z-eigenvalues<br />
A = [1,0.05;0,0.95]; %Transition matrix<br />
B = [0;0.05]; %Input matrix<br />
C = [1,0]; %Output matrix<br />
D = [0]; %Direct-output matrix<br />
K1=place(A’,(C*A)’,z); %Calculating gain K1 using place<br />
K=K1’ %Transposing K<br />
The result is
F. Haugen: Kompendium for Kyb. 2 ved Høgskolen i Oslo 126<br />
K =<br />
0.13818<br />
0.22376<br />
The function CD Place.vi on the Control Design Toolkit palette in<br />
LabVIEW can also be used to calculate the estimator gain K. Figure 8.7<br />
shows the front panel and Figure 8.8 shows the block diagram of a<br />
LabVIEW program that calculates K for the same system as above. The<br />
same K is obtained.<br />
Figure 8.7: Example 20: Front panel of the LabVIEW program to calculate the<br />
estimator gain K<br />
Figure 8.8: Example 20: Block diagram of the LabVIEW program to calculate<br />
the estimator gain K<br />
[End of Example 20]
F. Haugen: Kompendium for Kyb. 2 ved Høgskolen i Oslo 127<br />
8.6 <strong>Kalman</strong> <strong>Filter</strong> or Observer<br />
Now you have seen two ways to calculate the estimator gain K of a state<br />
estimator:<br />
• K is the <strong>Kalman</strong> Gain in a <strong>Kalman</strong> <strong>Filter</strong><br />
• K is the estimator gain in an observer<br />
The formulas for calculating the state estimate are the same in both cases:<br />
• <strong>Kalman</strong> <strong>Filter</strong>: (8.35), (8.36), (8.37), (8.38).<br />
• Observer: (8.104), (8.105), (8.106), (8.107).<br />
The observer may seem simpler than the <strong>Kalman</strong> <strong>Filter</strong>, but there is a<br />
potential danger in using the observer: The observer does not calculate<br />
any optimal state estimate in the least mean square sense, and hence the<br />
state estimate may become too noisy due to the inevitable measurement<br />
noise if you specify too fast error models dynamics (i.e. too large absolute<br />
value of the error-model eigenvalues). This is because fast dynamics<br />
requires a large estimator gain K, causing the measurement noise to give<br />
large influence on the state estimates. In my opinion, the <strong>Kalman</strong> <strong>Filter</strong><br />
gives a better approach to state <strong>estimation</strong> because it is easier and more<br />
intuitive to tune the filter in terms of process and measurement noise<br />
variances than in terms of eigenvalues of the error-model.