Intercalation of Lithium Ions into Graphite Electrodes Studied by AC ...
Intercalation of Lithium Ions into Graphite Electrodes Studied by AC ...
Intercalation of Lithium Ions into Graphite Electrodes Studied by AC ...

Create successful ePaper yourself
Turn your PDF publications into a flip-book with our unique Google optimized e-Paper software.
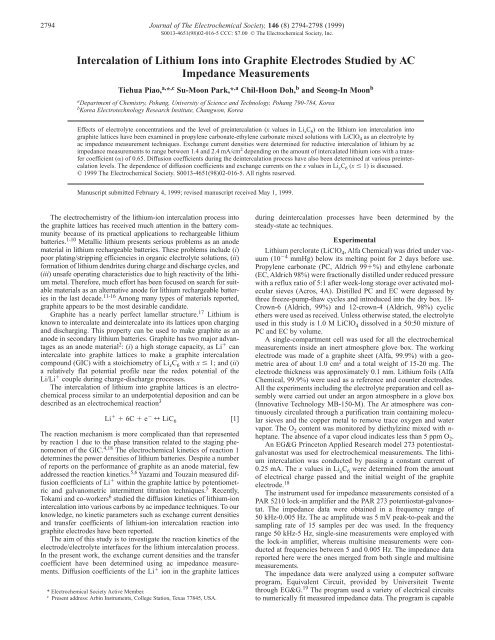
2794 Journal <strong>of</strong> The Electrochemical Society, 146 (8) 2794-2798 (1999)<br />
S0013-4651(98)02-016-5 CCC: $7.00 © The Electrochemical Society, Inc.<br />
<strong>Intercalation</strong> <strong>of</strong> <strong>Lithium</strong> <strong>Ions</strong> <strong>into</strong> <strong>Graphite</strong> <strong>Electrodes</strong> <strong>Studied</strong> <strong>by</strong> <strong>AC</strong><br />
Impedance Measurements<br />
Tiehua Piao, a, * ,c Su-Moon Park,* ,a Chil-Hoon Doh, b and Seong-In Moon b<br />
a Department <strong>of</strong> Chemistry, Pohang, University <strong>of</strong> Science and Technology, Pohang 790-784, Korea<br />
b Korea Electrotechnology Research Institute, Changwon, Korea<br />
Effects <strong>of</strong> electrolyte concentrations and the level <strong>of</strong> preintercalation (x values in Li x C 6 ) on the lithium ion intercalation <strong>into</strong><br />
graphite lattices have been examined in propylene carbonate-ethylene carbonate mixed solutions with LiClO 4 as an electrolyte <strong>by</strong><br />
ac impedance measurement techniques. Exchange current densities were determined for reductive intercalation <strong>of</strong> lithium <strong>by</strong> ac<br />
impedance measurements to range between 1.4 and 2.4 mA/cm 2 depending on the amount <strong>of</strong> intercalated lithium ions with a transfer<br />
coefficient (�) <strong>of</strong> 0.65. Diffusion coefficients during the deintercalation process have also been determined at various preintercalation<br />
levels. The dependence <strong>of</strong> diffusion coefficients and exchange currents on the x values in Li x C 6 (x � 1) is discussed.<br />
© 1999 The Electrochemical Society. S0013-4651(98)02-016-5. All rights reserved.<br />
Manuscript submitted February 4, 1999; revised manuscript received May 1, 1999.<br />
The electrochemistry <strong>of</strong> the lithium-ion intercalation process <strong>into</strong><br />
the graphite lattices has received much attention in the battery community<br />
because <strong>of</strong> its practical applications to rechargeable lithium<br />
batteries. 1-10 Metallic lithium presents serious problems as an anode<br />
material in lithium rechargeable batteries. These problems include (i)<br />
poor plating/stripping efficiencies in organic electrolyte solutions, (ii)<br />
formation <strong>of</strong> lithium dendrites during charge and discharge cycles, and<br />
(iii) unsafe operating characteristics due to high reactivity <strong>of</strong> the lithium<br />
metal. Therefore, much effort has been focused on search for suitable<br />
materials as an alternative anode for lithium rechargeable batteries<br />
in the last decade. 11-16 Among many types <strong>of</strong> materials reported,<br />
graphite appears to be the most desirable candidate.<br />
<strong>Graphite</strong> has a nearly perfect lamellar structure. 17 <strong>Lithium</strong> is<br />
known to intercalate and deintercalate <strong>into</strong> its lattices upon charging<br />
and discharging. This property can be used to make graphite as an<br />
anode in secondary lithium batteries. <strong>Graphite</strong> has two major advantages<br />
as an anode material 2 :(i) a high storage capacity, as Li � can<br />
intercalate <strong>into</strong> graphite lattices to make a graphite intercalation<br />
compound (GIC) with a stoichiometry <strong>of</strong> Li x C 6 with x � 1; and (ii)<br />
a relatively flat potential pr<strong>of</strong>ile near the redox potential <strong>of</strong> the<br />
Li/Li � couple during charge-discharge processes.<br />
The intercalation <strong>of</strong> lithium <strong>into</strong> graphite lattices is an electrochemical<br />
process similar to an underpotential deposition and can be<br />
described as an electrochemical reaction 3<br />
Li � � 6C � e � } LiC 6<br />
The reaction mechanism is more complicated than that represented<br />
<strong>by</strong> reaction 1 due to the phase transition related to the staging phenomenon<br />
<strong>of</strong> the GIC. 4,18 The electrochemical kinetics <strong>of</strong> reaction 1<br />
determines the power densities <strong>of</strong> lithium batteries. Despite a number<br />
<strong>of</strong> reports on the performance <strong>of</strong> graphite as an anode material, few<br />
addressed the reaction kinetics. 5,6 Yazami and Touzain measured diffusion<br />
coefficients <strong>of</strong> Li � within the graphite lattice <strong>by</strong> potentiometric<br />
and galvanometric intermittent titration techniques. 5 Recently,<br />
Tokami and co-workers 6 studied the diffusion kinetics <strong>of</strong> lithium-ion<br />
intercalation <strong>into</strong> various carbons <strong>by</strong> ac impedance techniques. To our<br />
knowledge, no kinetic parameters such as exchange current densities<br />
and transfer coefficients <strong>of</strong> lithium-ion intercalation reaction <strong>into</strong><br />
graphite electrodes have been reported.<br />
The aim <strong>of</strong> this study is to investigate the reaction kinetics <strong>of</strong> the<br />
electrode/electrolyte interfaces for the lithium intercalation process.<br />
In the present work, the exchange current densities and the transfer<br />
coefficient have been determined using ac impedance measurements.<br />
Diffusion coefficients <strong>of</strong> the Li � ion in the graphite lattices<br />
* Electrochemical Society Active Member.<br />
c Present address: Arbin Instruments, College Station, Texas 77845, USA.<br />
[1]<br />
during deintercalation processes have been determined <strong>by</strong> the<br />
steady-state ac techniques.<br />
Experimental<br />
<strong>Lithium</strong> perclorate (LiClO 4 , Alfa Chemical) was dried under vacuum<br />
(10 �4 mmHg) below its melting point for 2 days before use.<br />
Propylene carbonate (PC, Aldrich 99�%) and ethylene carbonate<br />
(EC, Aldrich 98%) were fractionally distilled under reduced pressure<br />
with a reflux ratio <strong>of</strong> 5:1 after week-long storage over activated molecular<br />
sieves (Acros, 4A). Distilled PC and EC were degassed <strong>by</strong><br />
three freeze-pump-thaw cycles and introduced <strong>into</strong> the dry box. 18-<br />
Crown-6 (Aldrich, 99%) and 12-crown-4 (Aldrich, 98%) cyclic<br />
ethers were used as received. Unless otherwise stated, the electrolyte<br />
used in this study is 1.0 M LiClO 4 dissolved in a 50:50 mixture <strong>of</strong><br />
PC and EC <strong>by</strong> volume.<br />
A single-compartment cell was used for all the electrochemical<br />
measurements inside an inert atmosphere glove box. The working<br />
electrode was made <strong>of</strong> a graphite sheet (Alfa, 99.9%) with a geometric<br />
area <strong>of</strong> about 1.0 cm 2 and a total weight <strong>of</strong> 15-20 mg. The<br />
electrode thickness was approximately 0.1 mm. <strong>Lithium</strong> foils (Alfa<br />
Chemical, 99.9%) were used as a reference and counter electrodes.<br />
All the experiments including the electrolyte preparation and cell assembly<br />
were carried out under an argon atmosphere in a glove box<br />
(Innovative Technology MB-150-M). The Ar atmosphere was continuously<br />
circulated through a purification train containing molecular<br />
sieves and the copper metal to remove trace oxygen and water<br />
vapor. The O 2 content was monitored <strong>by</strong> diethylzinc mixed with nheptane.<br />
The absence <strong>of</strong> a vapor cloud indicates less than 5 ppm O 2.<br />
An EG&G Princeton Applied Research model 273 potentiostatgalvanostat<br />
was used for electrochemical measurements. The lithium<br />
intercalation was conducted <strong>by</strong> passing a constant current <strong>of</strong><br />
0.25 mA. The x values in Li xC 6 were determined from the amount<br />
<strong>of</strong> electrical charge passed and the initial weight <strong>of</strong> the graphite<br />
electrode. 18<br />
The instrument used for impedance measurements consisted <strong>of</strong> a<br />
PAR 5210 lock-in amplifier and the PAR 273 potentiostat-galvanostat.<br />
The impedance data were obtained in a frequency range <strong>of</strong><br />
50 kHz-0.005 Hz. The ac amplitude was 5 mV peak-to-peak and the<br />
sampling rate <strong>of</strong> 15 samples per dec was used. In the frequency<br />
range 50 kHz-5 Hz, single-sine measurements were employed with<br />
the lock-in amplifier, whereas multisine measurements were conducted<br />
at frequencies between 5 and 0.005 Hz. The impedance data<br />
reported here were the ones merged from both single and multisine<br />
measurements.<br />
The impedance data were analyzed using a computer s<strong>of</strong>tware<br />
program, Equivalent Circuit, provided <strong>by</strong> Universiteit Twente<br />
through EG&G. 19 The program used a variety <strong>of</strong> electrical circuits<br />
to numerically fit measured impedance data. The program is capable
<strong>of</strong> conducting analysis <strong>of</strong> heavily convoluted frequency dispersion<br />
data <strong>by</strong> deconvoluting the complex responses <strong>into</strong> those <strong>of</strong> simple<br />
subcomponents. This approach combined with the general nonlinear<br />
least-squares fitting procedure allowed us to construct equivalent circuits<br />
whose simulated responses describe actually measured data<br />
well. From this simulation, values <strong>of</strong> various circuit components<br />
were obtained.<br />
In the present work, a constant phase element (CPE or Q) is used<br />
for equivalent circuits except for resistors, R. The general expression<br />
for the admittance response <strong>of</strong> the CPE is 19<br />
YCPE � Yc�n cos(n�/2) � jYC�n sin(n�/2) [2]<br />
where � is the angular frequency, which is 2�f with f being frequency<br />
and j � (�1) 1/2 . Depending on the n value, the CPE can have<br />
a variety <strong>of</strong> responses. If n � 0, it represents a resistance with R �<br />
Y �1<br />
c ; if n � 1, a capacitance with C � YC, and if n � 0.5, a Warburg<br />
response.<br />
Results and Discussion<br />
Chronopotentiometric responses.—A major problem encountered<br />
during the electrochemical lithium intercalation reaction in the PCbased<br />
electrolytes is the excessive electrolyte decomposition reaction<br />
during the first lithiation process. Much effort has been expended to<br />
overcome these problems. 7-10,20 Fong et al. 10 reported that introducing<br />
a cosolvent, EC, <strong>into</strong> the PC-based electrolyte improves the reversibility<br />
<strong>of</strong> Li/graphite cells. Other workers8,9,20 suggested that<br />
crown ethers reduce the degree <strong>of</strong> PC decomposition reactions when<br />
used as an additive. We examined effects <strong>of</strong> the electrolyte composition<br />
on the PC decomposition <strong>by</strong> recording chronopotentiograms in<br />
four different electrolyte solutions (see Fig. 1) under otherwise-identical<br />
experimental conditions. In Fig. 1, the period during which the<br />
potential plateau is maintained at around �0.8 V corresponding to the<br />
PC decomposition reaction21 changes with the electrolyte composition.<br />
In 0.1 M LiClO4-PC/EC with 0.1 M 12-crown-4 added, the period<br />
for the plateau is the shortest. A serious capacity loss is observed<br />
in the 0.1 M LiClO4-PC solution, as can be seen from the long potential<br />
plateau corresponding to the PC decomposition reaction. Similar<br />
results were reported <strong>by</strong> Shu and co-workers. 9 Fong et al. 10 concluded<br />
that the PC decomposition reaction at the graphite electrode is<br />
associated with Li� solvated with PC molecules which become cointercalated<br />
<strong>into</strong> the graphite layers. The addition <strong>of</strong> EC or crown ethers<br />
to the electrolyte may change the solvation structure and appears to<br />
suppress the cointercalation process, resulting in the reduction <strong>of</strong> the<br />
PC decomposition reaction.<br />
According to Fong et al., 10 the PC decomposition reaction results<br />
in the formation <strong>of</strong> passive films on the graphite electrode surface. Reversible<br />
Li intercalation still takes place on the film-covered graphite<br />
Figure 1. Chronopotentiometric results obtained at graphite electrodes with an<br />
applied current <strong>of</strong> 0.2 mA in (a) 0.1 M LiClO 4 in PC, (b) 0.1 M LiClO 4 in<br />
PC/EC (50:50), (c) 0.1 M LiClO 4 in PC/EC (50:50) with 0.1 M 18-crown-6<br />
added, and (d) 0.1 M LiClO 4 in PC/EC with 0.1 M 12-crown-4 added.<br />
Journal <strong>of</strong> The Electrochemical Society, 146 (8) 2794-2798 (1999) 2795<br />
S0013-4651(98)02-016-5 CCC: $7.00 © The Electrochemical Society, Inc.<br />
Figure 2. Chronopotentiometric results obtained at the graphite electrode at an<br />
applied current <strong>of</strong> 0.2 mA in 0.1 M LiClO 4 in PC/EC during (a) first and (b)<br />
second cycles.<br />
surface even after the surface is passivated. Figure 2 shows the<br />
chronopotentiograms recorded at the graphite electrode for the first<br />
two consecutive runs. It is clearly seen in this figure that the length <strong>of</strong><br />
the plateau at about �0.8 V is significantly shorter during the second<br />
than the first run. This means that the PC decomposition reaction<br />
mainly takes place during the first intercalation cycle. After the first<br />
cycle, the dominant process is the lithium intercalation reaction. For<br />
this reason, we used a 1.0 M LiClO4 solution in PC/EC (50:50) as an<br />
electrolyte in order to minimize the effect <strong>of</strong> solvent decomposition<br />
reactions on the electrochemical measurements and ran each electrochemical<br />
experiment after the first cycle, during which the PC decomposition<br />
is a predominant reaction. For kinetic measurements, crown<br />
ethers were not added to the electrolyte solutions.<br />
<strong>AC</strong> impedance studies.—Shown in Fig. 3 are (a) a typical electrochemical<br />
impedance spectrum at a preintercalated graphite electrode<br />
with x � 0.330 at an open-circuit potential and (b) an equivalent<br />
circuit obtained <strong>by</strong> fitting the impedance responses. The GIC,<br />
LixC6 , with various x values was prepared <strong>by</strong> passing a given amount<br />
<strong>of</strong> cathodic charge. The x value is then calculated from the increase<br />
in mass <strong>of</strong> the electrode from the Faraday law using the amount <strong>of</strong><br />
current applied and the duration <strong>of</strong> the current flow. 18 The irreversible<br />
capacity loss was not taken <strong>into</strong> account in the calculation<br />
<strong>of</strong> x values, assuming that the loss is not significant compared to the<br />
total amount <strong>of</strong> Li� intercalated.<br />
The impedance responses shown in Fig. 3a consist <strong>of</strong> a depressed<br />
semicircle in the high-frequency range (50 kHz-0.35 Hz) and a linear<br />
portion with a slope close to unity in the low-frequency range<br />
(0.41-0.005 Hz). The features shown here are in good agreement<br />
with those reported in the literature6,22 under similar experimental<br />
conditions. The depressed semicircle is shown to consist <strong>of</strong> two arcs<br />
from the curve-fitting procedure. The small arc in the high-frequency<br />
range (50 kHz-150 Hz) is attributed to the formation <strong>of</strong> a passive<br />
film on the graphite surface. 22 The large semicircle in the mediumfrequency<br />
range (0.5-145 Hz) is ascribed to the charge-transfer reaction<br />
<strong>of</strong> Li intercalation <strong>into</strong> graphite. 6,22 The linear portion observed<br />
in the low-frequency region (0.41-0.005 Hz) is characteristic <strong>of</strong> a<br />
diffusion-limited process, which is discussed in more detail later.<br />
The equivalent circuit presented in Fig. 3b describes the impedance<br />
spectra shown in Fig. 3a; solid lines are calculated responses using the<br />
circuit shown in Fig. 3b. Values obtained from the simulation for various<br />
circuit elements shown in Fig. 3b at various x values in LixC6 are<br />
listed in Table I. The equivalent circuit consists <strong>of</strong> two parallel RC circuits<br />
in series, one for the passive film formation and the other for<br />
lithium intercalation, respectively, as pointed out previously. Three<br />
CPEs, Q1 � Q3 , are included in the equivalent circuit. From Table I<br />
we see that Q3 is basically the Warburg impedance with n � 0.5. The<br />
charge-transfer resistance (R2) associated with Li intercalation varies<br />
depending on the composition <strong>of</strong> the graphite electrode.
2796 Journal <strong>of</strong> The Electrochemical Society, 146 (8) 2794-2798 (1999)<br />
S0013-4651(98)02-016-5 CCC: $7.00 © The Electrochemical Society, Inc.<br />
Figure 3. (a) Impedance responses recorded at the graphite electrode in 1.0<br />
M LiClO 4 in PC/EC at an x value <strong>of</strong> 0.33 in Li x C 6 at an open-circuit potential<br />
<strong>of</strong> 0.20 V; (b) an equivalent circuit describing the impedance responses<br />
shown in (a).<br />
The charge-transfer resistance, R CT , is related to the exchange<br />
current (i 0 ) <strong>by</strong> the equation 23a<br />
R CT � RT/(nFi 0 ) [3]<br />
The exchange current densities were calculated using Eq. 3 for various<br />
x values in Li x C 6 as listed in Table I. The result is shown in Fig.<br />
4. The exchange current densities range between 1.4 and 2.4 mA/cm 2<br />
and decrease monotonously with an increase in the x value <strong>of</strong> Li x C 6<br />
with some scattered points. The dependence <strong>of</strong> the exchange current<br />
on the amount <strong>of</strong> Li � is readily expected because <strong>of</strong> the different<br />
equilibrium potentials at the interface. While we found no reported<br />
exchange current density data for lithium intercalation <strong>into</strong> the<br />
graphite electrode in the literature, there are reports 6,24 about the<br />
charge-transfer resistance at various carbon electrodes determined <strong>by</strong><br />
ac impedance methods. These values were reported to range between<br />
5 and 20 � depending on the carbon types, which are in good agreement<br />
with ours listed in Table I. A similar but more drastic change in<br />
the exchange current has been reported <strong>by</strong> Colson et al. 25 for sodium<br />
intercalation in sodium molybdates. This result suggests that the<br />
interfacial charge-transfer process is associated with the electron<br />
transfer rather than the Li � transfer.<br />
Shown in Fig. 5 are the impedance spectra recorded at fresh electrodes<br />
(without preintercalation) in 0.1, 0.2, 0.5, 0.8, and 1.0 M<br />
LiClO 4 in the PC/EC mixed solvent at an applied potential <strong>of</strong> 0.20 V<br />
with no crown ethers added. The equivalent circuit presented in Fig.<br />
3b also applies to the data shown in Fig. 5. Values obtained for the<br />
various circuit elements at different LiClO 4 concentrations are listed<br />
in Table II. As expected, the solution resistance (R s ) estimated from<br />
the high-frequency intercept and the charge-transfer resistance (R 2 )<br />
obtained from the larger semicircle for the Li intercalation decrease<br />
as the Li � concentration increases in solution. The exchange current<br />
also increases with an increase in the Li � concentration as shown in<br />
Fig. 6. From the dependence <strong>of</strong> i 0 on the Li � concentration, one can<br />
calculate the transfer coefficient (�) for the Li intercalation process<br />
represented <strong>by</strong> Eq. 1. The relationship between the exchange current,<br />
i 0 , and the concentrations is 23<br />
i0 � nFk0C Li�<br />
(l��) �<br />
CLi While this equation is for solution species, it should be applicable to<br />
the interfacial electron transfer as the equilibrium potential at the elec-<br />
Table I. Values obtained for simulation <strong>of</strong> the elements in equivalent circuit shown in Fig. 6 at various x in Li x C 6 . a,b<br />
Open-circuit<br />
Q1 Q2 Q3 x in LixC6 potential, V R1 , � R2 , � Y, S n Y S n Y, S n x2 0.000 — 2.01 10.77 1.35 � 10 �4 0.858 6.82 � 10 �3 0.614 0.125 0.543 1.3 � 10 �3<br />
0.166 0.20 2.91 11.20 6.70 � 10 �4 0.676 6.53 � 10 �3 0.613 0.141 0.555 1.7 � 10 �4<br />
0.330 0.20 3.02 14.65 6.27 � 10 �4 0.702 6.51 � 10 �3 0.619 0.167 0.588 2.5 � 10 �4<br />
0.429 0.077 3.44 14.35 2.40 � 10 �4 0.808 5.91 � 10 �3 0.652 0.266 0.514 1.9 � 10 �4<br />
0.444 0.080 4.10 11.70 8.36 � 10 �4 0.649 5.32 � 10 �3 0.675 0.216 0.401 4.1 � 10 �4<br />
0.576 0.070 4.42 12.99 7.89 � 10 �4 0.661 4.97 � 10 �3 0.679 0.253 0.490 4.3 � 10 �4<br />
0.680 0.060 2.96 9.46 6.13 � 10 �4 0.704 5.63 � 10 �3 0.624 0.203 0.453 2.0 � 10 �4<br />
0.740 0.072 4.46 15.83 3.75 � 10 �3 0.547 5.10 � 10 �3 0.762 0.219 0.394 2.7 � 10 �4<br />
1.000 0.061 4.37 18.68 4.37 � 10 �4 0.928 6.14 � 10 �3 0.717 0.188 0.481 2.6 � 10 �4<br />
a Rs values are constant to 13.50 ∀ 1.0 �.<br />
b Impedance measurement under dc potential stepped to �0.2 V.<br />
Figure 4. The exchange current plotted vs. x in Li x C 6 .<br />
[4]
Figure 5. Impedance spectra recorded at the graphite electrode at 0.20 V in<br />
1.0 M LiClO 4 in PC/EC at various Li � concentrations.<br />
trode is determined <strong>by</strong> the activity <strong>of</strong> Li intercalated and the concentration<br />
<strong>of</strong> Li � in solution. From the log(i 0 ) vs. log(C Li�) plot shown in<br />
Fig. 6, we calculate the transfer coefficient (�) <strong>of</strong> 0.65 for the intercalation<br />
process, indicating that the electron transfer is reasonably<br />
reversible.<br />
From the analysis <strong>of</strong> the impedance spectrum shown in Fig. 3a, the<br />
diffusion coefficient <strong>of</strong> Li � in the graphite electrode can also be determined.<br />
As mentioned already, the impedance responses (see Fig. 3a)<br />
contain linear portions in the low-frequency range with an angle close<br />
to 45� from which diffusion coefficients can be obtained. This straight<br />
line in the low-frequency region is caused <strong>by</strong> the Warburg impedance<br />
due to the diffusion. The slope <strong>of</strong> the straight line in the Randles plot<br />
(Z � vs. � 2 plot) in the low-frequency region is related to the Warburg<br />
coefficient, �, according to the equation 26<br />
Journal <strong>of</strong> The Electrochemical Society, 146 (8) 2794-2798 (1999) 2797<br />
S0013-4651(98)02-016-5 CCC: $7.00 © The Electrochemical Society, Inc.<br />
� � RT/{n 2 F 2 A 1/2 [1/(D O 1/2 CO ) � 1/(D R 1/2 CR )]} [5]<br />
where R is the gas constant, T the absolute temperature, n the number<br />
<strong>of</strong> electrons transferred, A the electrode area, and C the concentrations<br />
with subscripts representing the oxidant (O) and reductant (R), respectively.<br />
Since D O 1/2 CO >> D R 1/2 CR under the experimental conditions<br />
used in this experiment, Eq. 5 reduces to<br />
� � RT/(n 2 F 2 A 1/2 D R 1/2 CR ) [6]<br />
The value <strong>of</strong> C R (mol/cm 3 ) is calculated from the molar volume <strong>of</strong><br />
graphite and the quantity <strong>of</strong> lithium intercalated. A typical Randles<br />
plot is shown in Fig. 7. While this equation was for the solution redox<br />
species, a reasonably good linearity observed in the frequency range<br />
0.025-0.145 Hz indicates that it is applicable to situations like the one<br />
currently considered. Nonetheless, use <strong>of</strong> Eq. 4-6 may provide only an<br />
indication <strong>of</strong> how the calculated parameters vary depending on the experimental<br />
conditions. The data points deviate from the linearity at<br />
Figure 6. Effects <strong>of</strong> [Li � ] on exchange current densities.<br />
Table II. Values obtained for simulation <strong>of</strong> the elements in equivalent circuit (Fig. 6) for data shown in Fig. 8. a<br />
very low frequencies (
2798 Journal <strong>of</strong> The Electrochemical Society, 146 (8) 2794-2798 (1999)<br />
S0013-4651(98)02-016-5 CCC: $7.00 © The Electrochemical Society, Inc.<br />
Figure 7. A typical Randles plot in a lower frequency region shown in Fig. 5b.<br />
et al. 28 This is perhaps because the structures <strong>of</strong> the carbon they used<br />
were different from ours and Takami’s. In our case, the diffusion coefficient<br />
is seen to decrease significantly between x � 0.1 and 0.4 and<br />
then levels <strong>of</strong>f when x is greater than 0.4. We believe that the break<br />
point <strong>of</strong> the two domains is related to the structural change <strong>of</strong> graphite<br />
during intercalation. Also, the intercalation between Li � and the<br />
graphite host lattice would be responsible for the changes in diffusion<br />
coefficients. 25,29 While abrupt changes in diffusion coefficients were<br />
observed due to the structural modification in the host material during<br />
the intercalation <strong>of</strong> Li <strong>into</strong> a cathode material such as V 2 O 5 25 or that<br />
Na <strong>into</strong> molybdates 29 depending on the x values, the change is relatively<br />
smooth and continuous in our case. This means that graphite undergoes<br />
its structural modification gradually in a continuous fashion<br />
rather than an abrupt change in the crystal structure.<br />
Conclusion<br />
We see from our results that the diffusion coefficients are strongly<br />
dependent on the electrode composition. The diffusion coefficients decrease<br />
with an increase in x in the GIC, Li x C 6 . There are two domains<br />
in how the diffusion coefficients are distributed depending on the level<br />
<strong>of</strong> preintercalation. When x < �0.4 or so, the diffusion coefficients<br />
decrease rapidly with an increase <strong>of</strong> the x value. Above this, the diffusion<br />
coefficients stay approximately constant.<br />
The kinetic parameters <strong>of</strong> lithium intercalation have been obtained<br />
from ac impedance measurements. The exchange current densities are<br />
in the range 1.4-2.4 mA/cm 2 depending on the Li content <strong>of</strong> the graphite<br />
electrode, and the transfer coefficient was determined to be 0.65.<br />
Overall, the lithium intercalation/deintercalation reaction is electrochemically<br />
reversible, although it displays chemical irreversibility at<br />
initial stages due to the effective reaction <strong>of</strong> intercalated lithium with<br />
solvent. Once its surface is passivated, a reasonably reversible lithium<br />
intercalation reaction takes place.<br />
The solution resistance decreases as the electrolyte concentration<br />
increases. The decrease, however, slows down beyond about 0.8 M<br />
LiClO 4 . It appears that the electrolyte concentration higher than 1 M<br />
does not provide benefits in terms <strong>of</strong> solution resistance for actual battery<br />
operations. The drastic decrease in diffusion coefficients beyond<br />
x > 0.4 would result in a decrease in power densities <strong>of</strong> the lithium-ion<br />
intercalation batteries.<br />
Acknowledgment<br />
This work was supported <strong>by</strong> a grant from Korea Electrotechnology<br />
Research Institute (KERI) and Research and Development Man-<br />
Figure 8. Effects <strong>of</strong> x values in Li x C 6 on diffusion coefficients. The values<br />
determined <strong>by</strong> the ac impedance method refer to diffusion coefficients <strong>of</strong> Li<br />
atom, while those determined <strong>by</strong> the chronoamperometric method refer to diffusion<br />
coefficients <strong>of</strong> Li � ion.<br />
agement Center for Energy and Resources (R<strong>AC</strong>ER). This work was<br />
performed at the Department <strong>of</strong> Chemistry, University <strong>of</strong> New Mexico,<br />
Albuquerque, NM, as part <strong>of</strong> the T.P.’s dissertation.<br />
Pohang University <strong>of</strong> Science and Technology assisted in meeting the publication<br />
costs <strong>of</strong> this article.<br />
References<br />
1. B. Scrosati, J. Electrochem. Soc., 139, 2776 (1992).<br />
2. D. Aurbach and Y. Ein-Eli, J. Electrochem. Soc., 142, 1746 (1995).<br />
3. K. Tatsumi, N. Iwashita, H. Sakaebe, H. Shioyama, and S. Higuchi, J. Electrochem.<br />
Soc., 142, 716 (1995).<br />
4. T. Ohzuku, Y. Iwakoshi, and K. Sawai, J. Electrochem. Soc., 140, 2490 (1993).<br />
5. R. Yazami and Ph. Touzain, J. Power Sources, 9, 365 (1983).<br />
6. N. Takami, A. Satoh, M. Hara, and T. Ohsaki, J. Electrochem. Soc., 142, 371 (1995).<br />
7. Z. Jiang, M. Alamgir, and K. M. Abraham, J. Electrochem. Soc., 142, 333 (1995).<br />
8. M. Morita, H. Hayashida, and Y. Matsuda, J. Electrochem. Soc., 134, 2107 (1987).<br />
9. Z. X. Shu, R. S. McMillan, and J. J. Murray, J. Electrochem. Soc., 140, 922 (1993).<br />
10. R. Fong, U. von Sacken, and J. R. Dahn, J. Electrochem. Soc., 137, 2009 (1990).<br />
11. J. Farcy, R. Messina, and J. Perichon, J. Electrochem. Soc., 137, 1337 (1990).<br />
12. N. Kumagai, Y. Matsuura, and K. Tanno, J. Electrochem. Soc., 139, 3553 (1992).<br />
13. N. Kumagai, T. Fujiwara, and K. Tanno, J. Electrochem. Soc., 140, 3194 (1993).<br />
14. K. Kanehori, F. Kirino, T. Kudo, and K. Miyauchi, J. Electrochem. Soc., 138, 2216<br />
(1991).<br />
15. D. Guyomard and J. M. Tarascon, J. Electrochem. Soc., 139, 937 (1992).<br />
16. A. S. Baranski and W. R. Fawcett, J. Electrochem. Soc., 129, 901 (1982).<br />
17. J. E. Fischer and T. E. Thompson, Physics Today, 31, 36 (1978).<br />
18. J. R. Dahn, Phys. Rev. B, 44, 9170 (1991).<br />
19. B. A. Boukamp, Equivalent Circuit User’s Manual, University <strong>of</strong> Twente, 2nd ed.,<br />
(1989).<br />
20. J. R. Dahn, R. Fong, and M. J. Spoon, Phys. Rev. B, 42, 6424 (1990).<br />
21. A. N. Dey and B. P. Sullivan, Phys. Rev., 117, 222 (1970).<br />
22. R. Yazami and D. Guerard, J. Power Sources, 43-44, 39 (1993).<br />
23. A. J. Bard and L. R. Faulkner, Electrochemical Methods, Fundamentals and Applications,<br />
Chap. 3 and 9, John Wiley & Sons, Inc., New York (1980).<br />
24. N. Takami, A. Satoh, M. Hara, and T. Ohsaki, J. Electrochem. Soc., 142, 2564 (1995).<br />
25. S. Colson, L. C. Klein, J. M. Tarascon, and D. Guyomard, J. Electrochem. Soc., 139,<br />
2359 (1992).<br />
26. A. J. Bard and L. R. Faulkner, Electrochemical Methods, Fundamentals and Applications,<br />
p. 328, John Wiley and Sons, Inc., New York (1980).<br />
27. C. Ho, I. D. Raistrick, and R. A. Huggins, J. Electrochem. Soc., 127, 343 (1980).<br />
28. M. Jean, C. Desnoyer, A. Tranchant, and R. Messina, J. Electrochem. Soc., 142, 2122<br />
(1995).<br />
29. J. Farcy, R. Messina, and J. Perichon, J. Electrochem. Soc., 137, 1337 (1990).