Short Articles (PDF) - Excellence in Financial Management
Short Articles (PDF) - Excellence in Financial Management
Short Articles (PDF) - Excellence in Financial Management

You also want an ePaper? Increase the reach of your titles
YUMPU automatically turns print PDFs into web optimized ePapers that Google loves.
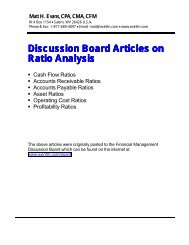
Asset Ratio Analysis<br />
The ability to generate revenues and earn profits on assets can be measured<br />
through ratio analysis. Several types of ratios can be calculated regard<strong>in</strong>g the<br />
utilization of assets.<br />
Example: Asset Turnover gives an <strong>in</strong>dication of how often assets are converted <strong>in</strong>to<br />
sales. The Asset Turnover Ratio is calculated as follows: Sales / Average Assets. If<br />
annual sales were $ 200,000 and the average asset balance for the year was $<br />
160,000, the asset turnover rate would be 1.25. A higher turnover rate implies<br />
effective use of assets to generate sales.<br />
Receivable and Inventory ratios are part of asset ratio analysis. Inventory Turnover<br />
gives an <strong>in</strong>dication of how much <strong>in</strong>ventory is held dur<strong>in</strong>g the report<strong>in</strong>g period.<br />
Example: Cost of Goods Sold for the Year was $ 270,000 and the average <strong>in</strong>ventory<br />
balance dur<strong>in</strong>g the year was $ 90,000. This results <strong>in</strong> an <strong>in</strong>ventory turnover rate of 3<br />
($ 270,000 / $ 90,000). The average number of days <strong>in</strong>ventory is held is calculated<br />
as follows: 365 days <strong>in</strong> the report<strong>in</strong>g period / <strong>in</strong>ventory turnover rate. In our example,<br />
this would be 122 days.<br />
F<strong>in</strong>ally, you can look at the use of capital for generat<strong>in</strong>g revenues. Two common<br />
ratios are Total Capital Turnover and Investment Rate. Total Capital Turnover is<br />
calculated as: Sales / Average Total Capital. Average Total Capital consists of both<br />
debt and equity. The Investment Rate is the rate of change <strong>in</strong> capital. The Investment<br />
Rate is calculated by simply divid<strong>in</strong>g the amount of change <strong>in</strong> capital / total beg<strong>in</strong>n<strong>in</strong>g<br />
capital. A high <strong>in</strong>vestment rate would imply an aggressive program for generat<strong>in</strong>g<br />
future sales.<br />
Accounts Payable Ratio Analysis<br />
Ratio analysis can be used to determ<strong>in</strong>e the time required to pay accounts payable<br />
<strong>in</strong>voices. This ratio is calculated as follows: Accounts Payables / Purchases per Day.<br />
For example, assume we have total accounts payables of $ 20,000 and our annual<br />
purchases on account total $ 400,000. Our purchases per day are $ 400,000 / 365<br />
days <strong>in</strong> the annual report<strong>in</strong>g period or $ 1,096. The average number of days to pay<br />
accounts payable is $ 20,000 / $ 1096 or 18 days. The result of this ratio should be<br />
compared to the average terms available from creditors.<br />
If the average number of days is close to the average credit terms, this may <strong>in</strong>dicate<br />
aggressive work<strong>in</strong>g capital management; i.e. us<strong>in</strong>g spontaneous sources of<br />
f<strong>in</strong>anc<strong>in</strong>g. However, if the number of days is well beyond the average credit terms,<br />
this could <strong>in</strong>dicate difficulty <strong>in</strong> mak<strong>in</strong>g payments to creditors.<br />
24