Quality in Face and Iris Research Ensemble (Q ... - Clarkson University
Quality in Face and Iris Research Ensemble (Q ... - Clarkson University
Quality in Face and Iris Research Ensemble (Q ... - Clarkson University

Create successful ePaper yourself
Turn your PDF publications into a flip-book with our unique Google optimized e-Paper software.
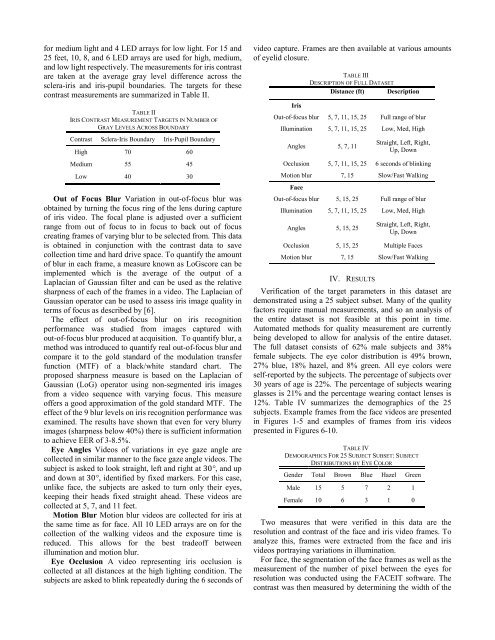
for medium light <strong>and</strong> 4 LED arrays for low light. For 15 <strong>and</strong><br />
25 feet, 10, 8, <strong>and</strong> 6 LED arrays are used for high, medium,<br />
<strong>and</strong> low light respectively. The measurements for iris contrast<br />
are taken at the average gray level difference across the<br />
sclera-iris <strong>and</strong> iris-pupil boundaries. The targets for these<br />
contrast measurements are summarized <strong>in</strong> Table II.<br />
TABLE II<br />
IRIS CONTRAST MEASUREMENT TARGETS IN NUMBER OF<br />
GRAY LEVELS ACROSS BOUNDARY<br />
Contrast Sclera-<strong>Iris</strong> Boundary <strong>Iris</strong>-Pupil Boundary<br />
High 70 60<br />
Medium 55 45<br />
Low 40 30<br />
Out of Focus Blur Variation <strong>in</strong> out-of-focus blur was<br />
obta<strong>in</strong>ed by turn<strong>in</strong>g the focus r<strong>in</strong>g of the lens dur<strong>in</strong>g capture<br />
of iris video. The focal plane is adjusted over a sufficient<br />
range from out of focus to <strong>in</strong> focus to back out of focus<br />
creat<strong>in</strong>g frames of vary<strong>in</strong>g blur to be selected from. This data<br />
is obta<strong>in</strong>ed <strong>in</strong> conjunction with the contrast data to save<br />
collection time <strong>and</strong> hard drive space. To quantify the amount<br />
of blur <strong>in</strong> each frame, a measure known as LoGscore can be<br />
implemented which is the average of the output of a<br />
Laplacian of Gaussian filter <strong>and</strong> can be used as the relative<br />
sharpness of each of the frames <strong>in</strong> a video. The Laplacian of<br />
Gaussian operator can be used to assess iris image quality <strong>in</strong><br />
terms of focus as described by [6].<br />
The effect of out-of-focus blur on iris recognition<br />
performance was studied from images captured with<br />
out-of-focus blur produced at acquisition. To quantify blur, a<br />
method was <strong>in</strong>troduced to quantify real out-of-focus blur <strong>and</strong><br />
compare it to the gold st<strong>and</strong>ard of the modulation transfer<br />
function (MTF) of a black/white st<strong>and</strong>ard chart. The<br />
proposed sharpness measure is based on the Laplacian of<br />
Gaussian (LoG) operator us<strong>in</strong>g non-segmented iris images<br />
from a video sequence with vary<strong>in</strong>g focus. This measure<br />
offers a good approximation of the gold st<strong>and</strong>ard MTF. The<br />
effect of the 9 blur levels on iris recognition performance was<br />
exam<strong>in</strong>ed. The results have shown that even for very blurry<br />
images (sharpness below 40%) there is sufficient <strong>in</strong>formation<br />
to achieve EER of 3-8.5%.<br />
Eye Angles Videos of variations <strong>in</strong> eye gaze angle are<br />
collected <strong>in</strong> similar manner to the face gaze angle videos. The<br />
subject is asked to look straight, left <strong>and</strong> right at 30°, <strong>and</strong> up<br />
<strong>and</strong> down at 30°, identified by fixed markers. For this case,<br />
unlike face, the subjects are asked to turn only their eyes,<br />
keep<strong>in</strong>g their heads fixed straight ahead. These videos are<br />
collected at 5, 7, <strong>and</strong> 11 feet.<br />
Motion Blur Motion blur videos are collected for iris at<br />
the same time as for face. All 10 LED arrays are on for the<br />
collection of the walk<strong>in</strong>g videos <strong>and</strong> the exposure time is<br />
reduced. This allows for the best tradeoff between<br />
illum<strong>in</strong>ation <strong>and</strong> motion blur.<br />
Eye Occlusion A video represent<strong>in</strong>g iris occlusion is<br />
collected at all distances at the high light<strong>in</strong>g condition. The<br />
subjects are asked to bl<strong>in</strong>k repeatedly dur<strong>in</strong>g the 6 seconds of<br />
video capture. Frames are then available at various amounts<br />
of eyelid closure.<br />
<strong>Iris</strong><br />
TABLE III<br />
DESCRIPTION OF FULL DATASET<br />
Distance (ft) Description<br />
Out-of-focus blur 5, 7, 11, 15, 25 Full range of blur<br />
Illum<strong>in</strong>ation 5, 7, 11, 15, 25 Low, Med, High<br />
Angles 5, 7, 11<br />
Straight, Left, Right,<br />
Up, Down<br />
Occlusion 5, 7, 11, 15, 25 6 seconds of bl<strong>in</strong>k<strong>in</strong>g<br />
Motion blur<br />
<strong>Face</strong><br />
7, 15 Slow/Fast Walk<strong>in</strong>g<br />
Out-of-focus blur 5, 15, 25 Full range of blur<br />
Illum<strong>in</strong>ation 5, 7, 11, 15, 25 Low, Med, High<br />
Angles 5, 15, 25<br />
Straight, Left, Right,<br />
Up, Down<br />
Occlusion 5, 15, 25 Multiple <strong>Face</strong>s<br />
Motion blur 7, 15 Slow/Fast Walk<strong>in</strong>g<br />
IV. RESULTS<br />
Verification of the target parameters <strong>in</strong> this dataset are<br />
demonstrated us<strong>in</strong>g a 25 subject subset. Many of the quality<br />
factors require manual measurements, <strong>and</strong> so an analysis of<br />
the entire dataset is not feasible at this po<strong>in</strong>t <strong>in</strong> time.<br />
Automated methods for quality measurement are currently<br />
be<strong>in</strong>g developed to allow for analysis of the entire dataset.<br />
The full dataset consists of 62% male subjects <strong>and</strong> 38%<br />
female subjects. The eye color distribution is 49% brown,<br />
27% blue, 18% hazel, <strong>and</strong> 8% green. All eye colors were<br />
self-reported by the subjects. The percentage of subjects over<br />
30 years of age is 22%. The percentage of subjects wear<strong>in</strong>g<br />
glasses is 21% <strong>and</strong> the percentage wear<strong>in</strong>g contact lenses is<br />
12%. Table IV summarizes the demographics of the 25<br />
subjects. Example frames from the face videos are presented<br />
<strong>in</strong> Figures 1-5 <strong>and</strong> examples of frames from iris videos<br />
presented <strong>in</strong> Figures 6-10.<br />
TABLE IV<br />
DEMOGRAPHICS FOR 25 SUBJECT SUBSET: SUBJECT<br />
DISTRIBUTIONS BY EYE COLOR<br />
Gender Total Brown Blue Hazel Green<br />
Male 15 5 7 2 1<br />
Female 10 6 3 1 0<br />
Two measures that were verified <strong>in</strong> this data are the<br />
resolution <strong>and</strong> contrast of the face <strong>and</strong> iris video frames. To<br />
analyze this, frames were extracted from the face <strong>and</strong> iris<br />
videos portray<strong>in</strong>g variations <strong>in</strong> illum<strong>in</strong>ation.<br />
For face, the segmentation of the face frames as well as the<br />
measurement of the number of pixel between the eyes for<br />
resolution was conducted us<strong>in</strong>g the FACEIT software. The<br />
contrast was then measured by determ<strong>in</strong><strong>in</strong>g the width of the