Characterization of HgCdTe MWIR Back-Illuminated II-VI-07 ... - Voxtel
Characterization of HgCdTe MWIR Back-Illuminated II-VI-07 ... - Voxtel
Characterization of HgCdTe MWIR Back-Illuminated II-VI-07 ... - Voxtel
- No tags were found...

You also want an ePaper? Increase the reach of your titles
YUMPU automatically turns print PDFs into web optimized ePapers that Google loves.
<strong>Characterization</strong> <strong>of</strong> <strong>HgCdTe</strong> <strong>MWIR</strong> <strong>Back</strong>-<strong>Illuminated</strong><br />
Electron-Initiated Avalanche Photodiodes<br />
M. B. Reine (Email: marion.reine@baesystems.com), J. W. Marciniec, K. K. Wong, T. Parodos,<br />
J. D. Mullarkey, P. A. Lamarre, S. P. Tobin, R. W. Minich and K. A. Gustavsen<br />
BAE Systems<br />
Lexington, Massachusetts 02421<br />
M. Compton and G. M. Williams<br />
<strong>Voxtel</strong> Inc.<br />
Beaverton, Oregon 97005<br />
Presented at:<br />
U.S. Workshop on the Physics and Chemistry <strong>of</strong> <strong>II</strong>-<strong>VI</strong> Materials<br />
Baltimore, Maryland<br />
October 30 – November 1, 20<strong>07</strong><br />
To be published in: Journal <strong>of</strong> Electronic Materials 37, June 2008<br />
Dr. Marion B. Reine<br />
Principal Engineering Fellow<br />
BAE Systems<br />
2 Forbes Road<br />
Lexington, Massachusetts 02421<br />
781-863-3043 (-3638 FAX)<br />
marion.reine@baesystems.com<br />
-1-
<strong>Characterization</strong> <strong>of</strong> <strong>HgCdTe</strong> <strong>MWIR</strong> <strong>Back</strong>-<strong>Illuminated</strong><br />
Electron-Initiated Avalanche Photodiodes<br />
M. B. Reine (Email: marion.reine@baesystems.com), J. W. Marciniec, K. K. Wong, T. Parodos,<br />
J. D. Mullarkey, P. A. Lamarre, S. P. Tobin, R. W. Minich and K. A. Gustavsen<br />
BAE Systems, Lexington, Massachusetts 02421<br />
M. Compton and G. M. Williams<br />
<strong>Voxtel</strong> Inc., Beaverton, Oregon 97005<br />
ABSTRACT<br />
This paper reports new characterization data for large-area (250×250 µm²) back-illuminated planar n-<br />
on-p <strong>HgCdTe</strong> electron-initiated avalanche photodiodes (e-APDs). These e-APDs were fabricated in p-type<br />
<strong>HgCdTe</strong> films grown by LPE on CdZnTe substrates, and were bump-mounted to fanout boards and<br />
characterized in the back-illuminated mode. We previously reported [J. Electronic Materials 36, 1059 (20<strong>07</strong>)]<br />
that these arrays exhibit avalanche gain that increases exponentially with reverse bias voltage, with gainversus-bias<br />
curves that are quite uniform from element to element, and with a maximum gain <strong>of</strong> 648 at -11.7<br />
V at 160 K for a cut<strong>of</strong>f wavelength <strong>of</strong> 4.06 µm. In this paper we report new data on these large-area backilluminated<br />
e-APDs, including devices from a third LPE film with a longer cut<strong>of</strong>f wavelength, 4.29 µm at 160<br />
K, whose data support the exponential dependence <strong>of</strong> gain on cut<strong>of</strong>f wavelength for the same bias voltage we<br />
reported for the first two films with cut<strong>of</strong>f wavelengths <strong>of</strong> 3.54 and 4.06 µm at 160 K, in agreement with<br />
Beck’s empirical model for gain versus voltage and cut<strong>of</strong>f wavelength in <strong>HgCdTe</strong> e-APDs. Our lowest gainnormalized<br />
current density at 80 K and zero FOV is 0.3 µA/cm² at -10.0 V for a cut<strong>of</strong>f wavelength <strong>of</strong> 4.23 µm<br />
at 80 K. We report data for the temperature dependence <strong>of</strong> gain over the 80-200 K temperature range. We<br />
report, for the first time, the dependence <strong>of</strong> measured gain on junction area for widely-spaced circular diodes<br />
with radii from 20 µm to 175 µm. We interpret the variation <strong>of</strong> measured gain with junction area in terms <strong>of</strong><br />
edge-enhanced electric field, and fit the gain versus junction radius data with a two-gain model with a lower<br />
interior gain and a higher edge gain. We report data for F(M)≈1 for gain up to 150 at 196 K. We describe the<br />
features <strong>of</strong> the abrupt breakdown phenomenon seen in most <strong>of</strong> our devices at high reverse bias voltages.<br />
Keywords: <strong>HgCdTe</strong>, photodiode, avalanche photodiode, APD, infrared detector<br />
-2-
INTRODUCTION<br />
The Hg 1-x Cd x Te electron-initiated avalanche photodiode 1,2 (e-APD) has attracted considerable<br />
attention over the past seven years, from both a technological and a device physics perspective. As a highperformance<br />
infrared avalanche photodiode, the <strong>HgCdTe</strong> e-APD has ideal properties. It exhibits essentially<br />
single-carrier multiplication, hence the gain is an exponential function <strong>of</strong> reverse bias voltage. The gain<br />
mechanism is such that the excess noise multiplication factor F(M) is independent <strong>of</strong> gain, and is essentially<br />
unity for many conditions. The bandwidth is a weak function <strong>of</strong> gain, and gain-bandwidths <strong>of</strong> 1.1 THz have<br />
recently been reported. These remarkable properties <strong>of</strong> the <strong>HgCdTe</strong> e-APD are made possible by the unique<br />
features <strong>of</strong> the electron energy band structure <strong>of</strong> this widely-applicable semiconductor alloy. Inspired by the<br />
seminal papers from Beck et al. 1 and Kinch et al., 2 many other groups have since corroborated these ideal<br />
properties in a variety <strong>of</strong> <strong>HgCdTe</strong> device configurations, with cut<strong>of</strong>f wavelengths ranging from 2.2 µm to<br />
10.3 µm.<br />
In previous papers, 3,4 we reported data for <strong>HgCdTe</strong> <strong>MWIR</strong> back-illuminated planar n-on-p e-APD<br />
4×4 arrays with large unit cell area, 250×250 µm², fabricated by ion beam milling in single-layer p-type<br />
<strong>HgCdTe</strong> films grown by LPE on CdZnTe substrates. These are the largest-area <strong>HgCdTe</strong> e-APD photodiodes<br />
yet reported. The 4×4 arrays were bump-mounted to fanout boards and characterized in the back-illuminated<br />
mode. The maximum gain measured is 648 at -11.7 V for a device in a 4×4 array with a cut<strong>of</strong>f wavelength <strong>of</strong><br />
4.06 µm at 160 K. Gain versus bias voltage curves are quite uniform from element to element. For the same<br />
reverse bias voltage, the gains measured at 160 K for elements in 4×4 arrays with two different cut<strong>of</strong>f<br />
wavelengths (3.54 and 4.06 µm at 160 K) increase exponentially with cut<strong>of</strong>f wavelength, in agreement with<br />
Beck’s empirical model 1 for avalanche gain in <strong>HgCdTe</strong> e-APDs. Spot scan data at 79 K show that both the<br />
V=0 response and the gain at V=-5.0 V are quite uniform and well-behaved over the junction area, with<br />
evidence <strong>of</strong> edge-enhanced gain. These were the first spot scan data for avalanche gain ever reported for<br />
<strong>HgCdTe</strong> e-APDs. Capacitance versus voltage data are consistent with an ideal abrupt junction having an n-<br />
region donor concentration equal to the indium counterdoping concentration in the LPE film.<br />
-3-
In this paper we report new data on <strong>MWIR</strong> back-illuminated e-APDs, both the 250×250 µm²<br />
elements we reported previously as well as widely-spaced variable-area circular photodiodes. We report data<br />
over an expanded temperature range, 80-200 K; our previous data were all for 160 K. We report data for<br />
devices from a new LPE film with a longer cut<strong>of</strong>f wavelength, 4.29 µm at 160 K, which support the<br />
exponential increase <strong>of</strong> gain with cut<strong>of</strong>f wavelength for the same bias voltage that we reported previously for<br />
two films with shorter cut<strong>of</strong>f wavelengths <strong>of</strong> 3.54 and 4.06 µm at 160 K. We report data for gain-normalized<br />
current density at 80 K and zero FOV, with our lowest value being 0.3 µA/cm² at -10.0 V for a cut<strong>of</strong>f<br />
wavelength <strong>of</strong> 4.23 µm at 80 K. We report data for the temperature dependence <strong>of</strong> gain over the 80-200 K<br />
temperature range. We report, for the first time, the dependence <strong>of</strong> measured gain on junction area for a<br />
family <strong>of</strong> widely-spaced circular diodes with diameters ranging from 40 µm to 350 µm. We interpret the<br />
variation <strong>of</strong> measured gain with junction area in terms <strong>of</strong> edge-enhanced electric field, which is consistent<br />
with edge features seen in our spot scan data for gain. We obtain a good fit the data for gain versus junction<br />
area with a two-gain model, having a lower interior gain and a higher edge gain. We report data for the noise<br />
multiplication factor F(M), which show F(M)≈1 for gain up to 150 at 196 K, for a cut<strong>of</strong>f wavelength <strong>of</strong> 4.06<br />
µm at 160 K. We describe the characteristics <strong>of</strong> an abrupt breakdown phenomenon that is seen in nearly all<br />
our devices at sufficiently high reverse bias voltage.<br />
HISTORICAL BACKGROUND<br />
Reports <strong>of</strong> avalanche gain in reverse-biased <strong>HgCdTe</strong> photodiodes appeared in the literature as early<br />
as 1977. Tredwell 5 reported “…avalanche multiplication in photoresponse as large as 30…” at large reverse<br />
bias in front-illuminated planar n-on-p photodiodes with a cut<strong>of</strong>f wavelength <strong>of</strong> 2.15 µm at 295 K, formed by<br />
Hg in-diffusion in bulk-grown p-type <strong>HgCdTe</strong>. In 1982, Shin et al. 6 reported a gain <strong>of</strong> 15 at -77 V reverse<br />
bias for a back-illuminated planar n-on-p <strong>HgCdTe</strong> photodiode with a cut<strong>of</strong>f wavelength <strong>of</strong> 1.25 µm. formed<br />
by boron implant in an LPE film grown on a CdTe substrate.<br />
The physics <strong>of</strong> avalanche multiplication in <strong>HgCdTe</strong> began to become better understood with the<br />
efforts <strong>of</strong> the French groups to develop <strong>HgCdTe</strong> APDs for fiber optic detection at 1.3-1.5 µm. 7-14 The relative<br />
-4-
advantages <strong>of</strong> the <strong>HgCdTe</strong> energy band structure for both electron-initiated and hole-initiated APDs were<br />
elucidated through the theoretical analyses <strong>of</strong> Leveque et al. 14<br />
They describe two regimes in which the ratio<br />
k=α h /α e <strong>of</strong> the hole ionization coefficient α h to the electron ionization coefficient α e is either much greater<br />
than unity or much less than unity. For cut<strong>of</strong>f wavelengths shorter than approximately 1.9 µm (x=0.56 at 300<br />
K), they predict that α h >>α e because <strong>of</strong> resonant enhancement <strong>of</strong> the hole ionization coefficient when the<br />
energy bandgap is near or equal to the spin-orbit splitting energy ∆ 0 (=0.938 eV from Ref. 15). This regime,<br />
with k=α h /α e >>1, is favorable for low-noise APDs with hole-initiated avalanche. de Lyon et al. 15 exploited<br />
this resonant enhancement regime with back-illuminated six-layer <strong>HgCdTe</strong> hole-initiated SAM (Separate<br />
Avalanche and Multiplication) APD 25-element arrays with 50×50 µm² unit cells, grown in situ by MBE on<br />
CdZnTe, with an absorber cut<strong>of</strong>f wavelength <strong>of</strong> 1.6 µm and a multiplication region cut<strong>of</strong>f wavelength <strong>of</strong> 1.3<br />
µm (matched to the spin-orbit splitting energy), which exhibited gains <strong>of</strong> 30-40 at 85-90 V reverse bias at 300<br />
K.<br />
For cut<strong>of</strong>f wavelengths longer than approximately 1.9 µm, Leveque et al. 14 predict that the hole<br />
ionization coefficient is non-resonant and decreases with increasing cut<strong>of</strong>f wavelength, while the electron<br />
ionization coefficient increases rapidly because <strong>of</strong> the decreasing electron effective mass, so that the ratio<br />
k=α h /α e is quite small, also a condition favorable for low-noise APDs, but now with electron-initiated<br />
avalanche.<br />
There were several early reports <strong>of</strong> experimental verification <strong>of</strong> the predicted small values <strong>of</strong> k=α h /α e<br />
in <strong>HgCdTe</strong> with cut<strong>of</strong>f wavelengths longer than 1.9 µm. Nguyen Duy et al. 8 reported k=α h /α e =0.1 for a 2.5<br />
µm front-illuminated planar implanted n-on-p photodiode at 300 K, with a gain <strong>of</strong> 30 at -30 V bias.<br />
DeWames et al. 16 reported avalanche gain with an exponential dependence on reverse bias voltage, with a<br />
gain <strong>of</strong> 4 at -5 V, and estimated a value for k=α h /α e < 0.1 for back-illuminated implanted n-on-p <strong>HgCdTe</strong><br />
photodiodes grown by LPE on a CdTe/sapphire substrate with a cut<strong>of</strong>f wavelength <strong>of</strong> 4.64 µm at 120 K. By<br />
fitting M(V) and I NOISE (V) <strong>of</strong> p-absorber lateral-collection “loophole” diodes with a cut<strong>of</strong>f wavelength <strong>of</strong> 11<br />
-5-
µm at 77 K, Elliott et al. 17 deduced that the reverse bias I(V) curves (for reverse bias beyond -1.4 V) are<br />
limited by avalanche (impact ionization) mainly due to one carrier (electron); the largest gain reported is 5.9<br />
at -1.4 V. Reisinger et al. 18 measured a gain <strong>of</strong> 50 at -5 V in their front-illuminated Hg-diffused n-on-p<br />
photodiodes with a cut<strong>of</strong>f <strong>of</strong> 11.95 µm at 77 K, and concluded that α e >100×α h from analysis <strong>of</strong> the shape <strong>of</strong><br />
spectral response curve as function <strong>of</strong> reverse bias voltage.<br />
It was, however, the paper by Beck et al. 1 in 2001 that first reported the clear and compelling<br />
advantages <strong>of</strong> the electron-initiated avalanche process, based on data on <strong>MWIR</strong> <strong>HgCdTe</strong> lateral-collection “paround-n”<br />
photodiodes with p-type absorber regions: avalanche gain increases exponentially with reverse bias<br />
voltage, is quite uniform from element to element, and is essentially noiseless (i.e., F(M)≈1.0). Soon<br />
thereafter, a theory by Kinch et al. 2,19,20 <strong>of</strong> the physics <strong>of</strong> electron and hole avalanche multiplication in<br />
<strong>HgCdTe</strong> related the large inequity between α e and α h to three key features <strong>of</strong> the <strong>HgCdTe</strong> energy band<br />
structure: the electron effective mass is much smaller than the heavy hole effective mass, which means that<br />
electrons have a much higher mobility, a much lower scattering rate by optical phonons, and a factor-<strong>of</strong>-two<br />
lower ionization threshold energy; there are no subsidiary minima in the conduction band to which energetic<br />
electrons can scatter; and the light holes are not important. The key features <strong>of</strong> this theory were substantiated<br />
by Monte Carlo simulations by the group at the University <strong>of</strong> Texas at Austin. 21<br />
Since the seminal papers <strong>of</strong> Beck et al. 1 and Kinch et al., 2,19,20 there have been reports <strong>of</strong> <strong>HgCdTe</strong> e-<br />
APDs in other configurations and architectures, all <strong>of</strong> which corroborate the essential features <strong>of</strong> the electroninitiated<br />
avalanche process initially reported by Beck et al. 1<br />
Baker et al. 22,23 report a 1.55 µm range-gated<br />
320×256 FPA for 3D imaging with a lateral-collection “loophole” <strong>HgCdTe</strong> e-APD array having 24×24 µm²<br />
unit cells, cut<strong>of</strong>f wavelengths <strong>of</strong> 4.2-4.6 µm, and gains over 100 at -7 V, operating at 90 K. <strong>Back</strong>-illuminated<br />
implanted planar n + -n - -p e-APD 1×64 arrays grown by MBE on CdZnTe are reported by Vaidyanathan et al. 24<br />
with a gain <strong>of</strong> 1000 at -10.5 V for a 4.2 µm cut<strong>of</strong>f at 78 K, and a gain >100 at -3.5 V for a 10.3 µm cut<strong>of</strong>f at<br />
78 K. Hall et al. 25 report gain at 78 K <strong>of</strong> 100 at -12 V for a back-illuminated <strong>MWIR</strong> n-p-P structure grown in<br />
situ by MOVPE on GaAs with an x=0.36 gain layer.<br />
-6-
More recent results on <strong>HgCdTe</strong> e-APDs in the front-illuminated lateral-collection “p-around-n”<br />
architecture from the DRS group include characterization 26-28 <strong>of</strong> both SWIR (2.2 µm) and LWIR (9.7 and 10.8<br />
µm), and a 128×128 gated IR imaging FPA 29,30 with 40×40 µm² unit cells, cut<strong>of</strong>f wavelengths <strong>of</strong> 4.2 to 5 µm,<br />
median gains <strong>of</strong> 946 at -11 V, and a sensitivity <strong>of</strong> less than one photon for a 1 µs gate width.<br />
A gain <strong>of</strong> 5300 at -12.5 V is reported in the paper by Perrais et al. 31,32 for a back-illuminated planar p-<br />
i-n 30×30 µm² photodiodes with cut<strong>of</strong>f wavelength <strong>of</strong> 5.0 µm at 78 K, formed by boron implantation in a<br />
<strong>HgCdTe</strong> film grown by MBE. This is the highest reported gain for a <strong>HgCdTe</strong> e-APD, and is consistent with<br />
the gains reported for all other e-APDs with shorter cut<strong>of</strong>f wavelengths, given that the e-APD gain increases<br />
exponentially with both cut<strong>of</strong>f wavelength and reverse bias voltage. Recently, this group reported 32,33 the first<br />
measurements <strong>of</strong> pulse response and bandwidth in <strong>HgCdTe</strong> e-APDs, with a bandwidth value <strong>of</strong> ~400 MHz for<br />
1.55 µm radiation, in a device with a 5.3 µm cut<strong>of</strong>f wavelength at 80 K, and with a gain <strong>of</strong> ~2800 at -11 V,<br />
corresponding to a gain-bandwidth product <strong>of</strong> ~ 1.1 THz. The bandwidth exhibits only a weak decrease with<br />
increasing gain, dropping from 500 MHz at unity gain to 400 MHz at 2800, in agreement with the theoretical<br />
predictions for a k=0 APD. 26,27 This group also reported 34 gain <strong>of</strong> 4 at -1.3 V for a cut<strong>of</strong>f wavelength <strong>of</strong> 9.2<br />
µm at 77 K, and a gain <strong>of</strong> 20 at -22.5 V for a cut<strong>of</strong>f wavelength <strong>of</strong> 2.4 µm at 150 K.<br />
<strong>HgCdTe</strong> e-APD DESIGN<br />
The device cross section for our back-illuminated planar n-on-p <strong>HgCdTe</strong> e-APD is shown in Figure 1.<br />
It is fabricated in a single-layer p-type <strong>HgCdTe</strong> film grown on an IR-transparent CdZnTe substrate. Radiation<br />
is incident on the CdZnTe surface, which may have a thin-film antireflection coating or interference filter.<br />
Radiation is absorbed within the p-type region, creating electron-hole pairs that diffuse and drift toward the<br />
depletion region. The p-side is much more heavily doped than the n-side, so nearly the entire width W <strong>of</strong> the<br />
depletion region lies within the n-region. When the photogenerated minority carrier (electron) reaches the<br />
edge <strong>of</strong> the depletion region, it is accelerated by the strong electric field. It gains energy rapidly and begins<br />
the avalanche multiplication process. As reverse bias voltage is applied, the depletion region expands further<br />
into the n-region, toward the surface, and the field increases, resulting in higher avalanche gain.<br />
-7-
This architecture has a number <strong>of</strong> advantages. It is a planar structure. It has high fill factor and high<br />
quantum efficiency, with spatially uniform response over its active area. It can be bump-mounted onto a<br />
fanout board or onto a Readout Integrated Circuit (ROIC) chip for high-gain multiplexed Focal Plane Arrays.<br />
The vertical geometry allows high bandwidth because photocarriers have only a short distance to traverse to<br />
the depletion region, and the traversal time may be shortened by acceleration in the effective electric field set<br />
up by the favorable compositional grading in the LPE film. 35<br />
ARRAY FABRICATION<br />
Both individual 4×4 array chips and Test Chips with circular variable-area diagnostic diodes and 4×4<br />
arrays were fabricated in single-layer p-type <strong>HgCdTe</strong> films grown by horizontal-slider Liquid Phase Epitaxy<br />
(LPE) from Te-solution onto 4×6 cm² near-lattice-matched CdZnTe substrates. (Ref. 35 reviews LPE<br />
<strong>HgCdTe</strong> technology at BAE Systems.) The unit cell size in the 4×4 arrays is 250×250 µm². The acceptor is<br />
the doubly-ionized Hg vacancy. The Hg vacancy concentration in the p-layer is 2×10 16 cm -3 . Indium<br />
counterdoping at a concentration <strong>of</strong> 4.5×10 14 cm -3 was introduced during film growth to establish the donor<br />
concentration in the n-region. SIMS pr<strong>of</strong>iles confirmed that the indium is uniformly distributed through the<br />
thickness <strong>of</strong> the p-layer at the target concentration. Planar junctions were formed by ion beam milling. No<br />
antireflection coating was used on these first devices, hence there is a 21% reflection loss at the CdZnTe<br />
entrance surface.<br />
EXPERIMENTAL DETAILS<br />
Both individual 4×4 arrays and Test Chips were hybridized to fanout boards and packaged in flat<br />
packs, which were mounted into bottom-looking variable-temperature pour-fill liquid-nitrogen dewars for<br />
characterization in the back-illuminated mode. A sapphire window was used, with either an F/5 cold shield or<br />
zero-FOV arrangement. Dark current and dark current plus dc photocurrent were measured versus bias<br />
voltage with an HP4155A Parameter Analyzer. The dc photocurrent was generated by radiation from an<br />
unfiltered 1000 K blackbody. Gain versus voltage curves were determined from successive traces <strong>of</strong> dark<br />
-8-
current and dark current plus dc photocurrent versus bias voltage by the method described in our previous<br />
papers (Ref. 3-4).<br />
ARRAY CHARACTERIZATION DATA<br />
Dependence <strong>of</strong> Gain on Cut<strong>of</strong>f Wavelength<br />
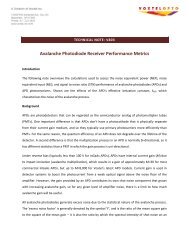
Fig. 2 shows data for gain versus reverse bias voltage, for T=160 K, for the two films from our<br />
previous work 3,4 along with new gain data for a third film with a longer cut<strong>of</strong>f wavelength. The gain data for<br />
this new film show the same behavior as we reported for the first two films: an exponential increase in gain<br />
with reverse bias, and excellent uniformity <strong>of</strong> gain from element to element. As expected, the gain at a given<br />
bias voltage is higher for the new film with the longer cut<strong>of</strong>f wavelength.<br />
Fig. 2 shows that there is reasonably good agreement between our M(V) data at 160 K for these three<br />
films and the empirical model <strong>of</strong> Beck 1 (dashed curves) for avalanche gain M(V) in <strong>HgCdTe</strong> e-APDs:<br />
M(V)<br />
= 1+<br />
2<br />
[2(V−V<br />
th ) / Vth<br />
]<br />
, Vth<br />
= 6.8 ×<br />
E<br />
G<br />
(1)<br />
where the values for the energy band gap E G that appear in the equation for the threshold voltage V th were<br />
calculated from the measured cut<strong>of</strong>f wavelengths λ CO for the three films with the usual relationship<br />
E G =hc/λ CO . Beck’s model has only one adjustable parameter, the constant <strong>of</strong> proportionality between the<br />
threshold voltage V th and the energy gap E G . Beck uses a value <strong>of</strong> 6.8 to fit their M(V) data at T=77 K for<br />
their front-illuminated “p-around-n” <strong>HgCdTe</strong> e-APDs with cut<strong>of</strong>f wavelengths ranging between 2.6 µm and<br />
10.8 µm. The plots <strong>of</strong> Beck’s model in Fig. 2 (dashed curves) are done with this same value <strong>of</strong> 6.8.<br />
Dark Current at F/5 and FOV=0<br />
Fig. 3 shows I(V) data for a 250×250 µm² photodiode taken at 80 K for both F/5 and FOV=0<br />
conditions. Also shown are I(V) data for F/5 with the device illuminated by a 1000 K unfiltered blackbody,<br />
from which gain was determined. Gain data are plotted on the right-hand axis. At -10.0 V the gain is 3<strong>07</strong>,<br />
about a factor <strong>of</strong> two higher than the gain <strong>of</strong> 150 at 160 K, shown in Fig. 2, measured for the same bias<br />
-9-
voltage in other devices from this same film (163). This is consistent with the general trend for higher gain at<br />
lower temperatures.<br />
It can be seen in Fig. 3 that the 80 K dark current for F/5 is dominated by gain-multiplied<br />
photocurrent from the room background photon flux, except at the highest bias voltages. This is more easily<br />
seen by the plot <strong>of</strong> the gain-normalized dark current for F/5, which is basically independent <strong>of</strong> bias voltage,<br />
except at the highest bias voltages. The I(V) data for FOV=0, however, show a more rapid rise with reverse<br />
bias voltage than the gain, probably due to a tunneling-related leakage current mechanism, and it is this<br />
mechanism which is responsible for the upturn in the F/5 dark current near -10 V.<br />
The dark current measured at FOV=0 and 80 K for the device in Fig. 3 is 0.13 µA at -10.0 V, which,<br />
for a gain <strong>of</strong> 3<strong>07</strong>, corresponds to a gain-normalized dark current <strong>of</strong> 0.42 nA and a gain-normalized dark<br />
current density <strong>of</strong> 0.67 µA/cm². The lowest values we have seen among our 250×250 µm² devices from this<br />
film are about a factor <strong>of</strong> two below this. The data in Fig. 3 show that this FOV=0 dark current is probably a<br />
tunneling-related leakage current, which we believe can be lowered through improvements in device design<br />
and processing.<br />
Dependence <strong>of</strong> Gain on Temperature<br />
Fig. 4 shows data for gain versus reverse bias voltage taken for three 250×250 µm² elements in Test<br />
Chip 235-G for four temperatures: 80, 120, 160 and 200 K. The trend for higher gain at lower temperatures is<br />
clearly shown by the data.<br />
Data for gain -9.0 V are plotted versus temperature in Fig. 4, for the devices <strong>of</strong> Fig. 3 and for devices<br />
from another film with a shorter cut<strong>of</strong>f wavelength. Both films show a similar dependence <strong>of</strong> gain on<br />
temperature.<br />
The dashed curves in Fig. 4 are calculated from the Beck model 1 in Eq. 1 for fixed values <strong>of</strong> Hg 1-<br />
xCd x Te alloy composition. These curves show the decrease in gain that would result if the only change with<br />
temperature were the change in energy band gap. The data show a stronger decrease with increasing<br />
-10-
temperature than the dashed curves, due to the additional effect <strong>of</strong> the reduction in ionization rate at higher<br />
temperature.<br />
The only other published data 28 for temperature dependence <strong>of</strong> gain in <strong>HgCdTe</strong> e-APDs are those <strong>of</strong><br />
the DRS group for a device with a cut<strong>of</strong>f wavelength <strong>of</strong> 2.63 µm at 300 K. Their data, also plotted in Fig. 4,<br />
show a similar dependence on temperature.<br />
Dependence <strong>of</strong> Gain on Diode Area<br />
In our e-APD Test Chip design, there is a family <strong>of</strong> widely-spaced circular diagnostic photodiodes<br />
with diameters ranging from 40 µm to 350 µm. We noticed a small but significant decrease in gain with<br />
increasing area among the variable-area devices within a given Test Chip. This dependence <strong>of</strong> the gain versus<br />
voltage curves on junction area is shown in Fig. 6 for four photodiodes from Test Chip 235G at 160 K. This<br />
dependence is also shown in Fig. 7, where the gains at -7.0 V for a set <strong>of</strong> variable-area diodes in this Test<br />
Chip at 80 K are plotted versus junction area. The gains at -7.0 V range from 50 for the largest diode to 70<br />
for the smallest.<br />
It is customary to use variable-area diodes 36 to determine the lateral optical collection length L OPT<br />
from the dependence <strong>of</strong> measured photocurrent on junction area. This is illustrated in Fig. 8, which shows<br />
data for the photocurrent, due to a 1000 K blackbody, measured at V=0 and 80 K for the variable-area diodes<br />
in the Test Chip <strong>of</strong> Figs. 6 and 7, plotted versus junction area. With no lateral collection, the measured<br />
photocurrent would be a linear function <strong>of</strong> junction area. With lateral collection, the smaller-area diodes have<br />
larger photocurrent than expected. The solid curve in Fig. 8 is a best fit to the data <strong>of</strong> the equation<br />
I PH =I PH-1D (1+L OPT /R J )², where I PH is the measured photocurrent, I PH-1D /(πR J ²) is the one-dimensional<br />
photocurrent per unit area collected by a diode with no lateral collection, and R J is the diode radius. The best<br />
fit to the data in Fig. 8 gives a value for L OPT <strong>of</strong> 12 µm, which is acceptably close to the 6 µm value calculated<br />
with the model for p-type <strong>HgCdTe</strong> described in our previous papers. 3,4<br />
We interpret the observed dependence <strong>of</strong> gain on junction area, shown in Fig. 7, as being due to each<br />
diode having two regions with different gains, an interior region with gain M 1D and an edge region with gain<br />
-11-
M E . The edge gain would be higher than the interior gain due to the higher electric field at the edge arising,<br />
for example, from junction curvature or from a narrower n-region at the surface. Minority photocarriers<br />
collected laterally over a length L OPT by diffusion from beyond the edge <strong>of</strong> the junction would experience the<br />
edge gain, whereas those collected within the interior <strong>of</strong> the junction area would experience the interior gain.<br />
This leads to a simple expression for the measured gain as a function <strong>of</strong> diode radius:<br />
M<br />
2<br />
2 2<br />
M1DR<br />
J<br />
+ M<br />
E[(R<br />
J<br />
+ LOPT<br />
) − R<br />
J<br />
]<br />
= (2)<br />
2<br />
(R<br />
J<br />
+ LOPT<br />
)<br />
The solid curve in Fig. 7 is the best fit <strong>of</strong> this equation to the gain data. With L OPT set equal to 12 µm, the<br />
value determined from the analysis in Fig. 8, the best fit <strong>of</strong> this equation to the data <strong>of</strong> Fig. 7 yields values for<br />
the edge gain <strong>of</strong> 45 and the interior gain <strong>of</strong> 85.<br />
Spatial Dependence <strong>of</strong> Avalanche Gain<br />
Our previous papers 3,4 reported spot scan data for avalanche gain at V=-5 V in these large-area diodes<br />
at 80 K. Those data (Fig. 9 in Ref. 34) showed that the gain is uniform within the interior <strong>of</strong> the junction area,<br />
but that there is a hint <strong>of</strong> higher gain at the edges. This higher gain at the edges is seen more clearly in the<br />
spot scan data in Fig. 9 <strong>of</strong> another element in that same 4×4 array. The spatially-dependent avalanche gain,<br />
defined as the ratio <strong>of</strong> the pr<strong>of</strong>ile at -5.0 V to the pr<strong>of</strong>ile for V=0, is plotted in Fig. 9 on the right-hand axis.<br />
The avalanche gain is spatially uniform over the interior <strong>of</strong> the photodiode, with an average value <strong>of</strong> 10.8,<br />
which is in close agreement with the gain data at 80 K for this film taken in the full-illumination configuration<br />
(see Fig. 3). There is a small but consistently observed increase in the FWHM at -5.0 V compared to the V=0<br />
case, with the value <strong>of</strong> 3.8 µm for the data in Fig. 9, which is responsible for the small increases in the gain<br />
pr<strong>of</strong>ile at the edges <strong>of</strong> the junction seen in Fig. 9. This increase is most probably not due to the voltageinduced<br />
increase in the depletion width, because the higher doping <strong>of</strong> the p-region causes the depletion region<br />
width to increase inward, toward the n-contact. We interpret this increase as due to higher gain at the edges<br />
<strong>of</strong> the diode, which is consistent with the dependence <strong>of</strong> measured gain on junction area in Fig. 7.<br />
Excess Noise Factor F(M)<br />
-12-
Noise measurements were done at <strong>Voxtel</strong>, Inc. A Test Chip from film 163, packaged in a flatpack,<br />
was mounted inside a windowed vacuum cryochamber. Stable, switchable flood illumination is projected<br />
through the window with an OZ Optics OZ-2000 1550 nm stabilized fiber-coupled diode laser. Bias voltage<br />
is applied to the diode by an HP4145A semiconductor parameter analyzer (SPA). A bias-T couples the DC<br />
component <strong>of</strong> the diode current to the SPA, and sends the AC component to an HP8447D high-speed preamp.<br />
The preamp can feed either a spectrum analyzer or a noise figure meter. In this way, both the average gain<br />
(calculated in the usual way from the DC component <strong>of</strong> the photocurrent) and the noise power spectral<br />
intensity at a given frequency and bias voltage can be read simultaneously. An HP8566B spectrum analyzer<br />
is used to choose frequency bands with low environmental noise, and an HP8970B noise figure meter makes<br />
calibrated noise power measurements.<br />
Noise power measurements are taken both in the dark and under illumination. By subtracting the<br />
noise power <strong>of</strong> the dark current, the noise power <strong>of</strong> the photocurrent can be isolated. This allows one to<br />
measure the multiplication noise and reject environmental noise. The HP8970B noise figure meter outputs<br />
noise power spectral intensity (S P in W/Hz), and the impedance <strong>of</strong> the test circuit must be found to convert<br />
these measurements to noise current spectral intensity (S I in A²/Hz). We use the noise measurement at unity<br />
gain (low bias voltage) for this normalization, rather than a measurement <strong>of</strong> the diode impedance in isolation,<br />
because this gives the most direct measurement <strong>of</strong> the relevant impedance – including effects from the<br />
mounting <strong>of</strong> the detector, its interaction with the preamplifier and noise figure meter, and anything specific to<br />
the frequency band used for the noise power measurement. The normalization is accomplished using<br />
Schottky’s theorem, S I = 2 q I (A²/Hz), along with a direct measurement <strong>of</strong> the DC photocurrent I PH :<br />
R = S P / S I = S P / (2 q I PH ) (3)<br />
Between 20 and 30 independent measurements <strong>of</strong> the light and dark noise power at unity gain are used to find<br />
R. Subsequently, noise current spectral intensity S I is measured at a variety <strong>of</strong> different values <strong>of</strong> M, taking<br />
10 independent measurements <strong>of</strong> light and dark noise power for each gain point. Finally, excess noise factor<br />
F(M) is calculated using the noise current spectral intensity theorem for avalanche multiplication:<br />
-13-
S I = R S P = 2 q M² F(M) I PH (4)<br />
The effect <strong>of</strong> our methodology to accurately measure the test circuit impedance under the same conditions as<br />
the noise measurements is that the excess noise factor curve is normalized so that F(M)=1 at M=1. However,<br />
there is always experimental variation associated with the noise power measurement, so this measurement <strong>of</strong><br />
the test circuit impedance is not absolutely accurate. Accordingly, one finds some scatter in the F(M) data at<br />
higher gain, and instances in which F(M) appears to fall below 1. This is an experimental limitation which<br />
we attempt to minimize by averaging a large number <strong>of</strong> noise measurements, and by selecting relatively<br />
‘quiet’ RF frequency bands for our measurements, but it cannot be eliminated entirely.<br />
Data for the excess noise factor F(M) obtained by this methodology for a large-area diode at 196 K<br />
are shown in Fig. 10 plotted versus gain. Data were taken at a frequency <strong>of</strong> 20 MHz with a bandwidth <strong>of</strong> 1<br />
MHz. F(M) is nearly independent <strong>of</strong> gain and is close to unity out to a gain <strong>of</strong> 150, corresponding to -9.0 V<br />
bias.<br />
Observations on Abrupt Breakdown<br />
A common feature seen in the reverse-bias I(V) characteristics <strong>of</strong> the diodes from these films is an<br />
abrupt increase in dark current at large reverse bias voltage. This abrupt breakdown occurs over a narrow<br />
range <strong>of</strong> bias voltage, with the current rising abruptly its “normal” value to the upper limit set by the<br />
HP4155A over a 0.1-0.2 V voltage interval. This abrupt breakdown is illustrated for several devices in Fig.<br />
11. This abrupt breakdown limits the largest reverse bias voltage that can be applied to a given diode, and<br />
hence limits the highest achievable gain. The importance <strong>of</strong> this abrupt breakdown was emphasized recently<br />
by DeWames. 37<br />
This abrupt breakdown is seen in all our diodes at sufficiently large reverse bias, unless other leakage<br />
current mechanisms, all <strong>of</strong> which vary much less rapidly with bias voltage, cause excessive current at lower<br />
bias voltages and prohibit voltages large enough to reach the abrupt breakdown.<br />
-14-
The breakdown voltage increases with increasing temperature in a given diode. This can be seen in<br />
the data in the upper plot in Fig. 11, where the breakdown voltage increases from -10.4 V at 80 K to -11.7 V<br />
at 160 K.<br />
The breakdown voltage increases with energy band gap for devices <strong>of</strong> comparable design and<br />
processing. This can be seen in Fig. 11. The lower plot shows a breakdown voltage <strong>of</strong> -12.8 V for a cut<strong>of</strong>f<br />
wavelength <strong>of</strong> 3.54 µm at 160 K, whereas the upper plot shows a breakdown voltage <strong>of</strong> -11.7 at 160 K for a<br />
cut<strong>of</strong>f <strong>of</strong> 4.05 µm at 160 K.<br />
The breakdown voltage may vary somewhat from element to element within an array or within a film,<br />
but <strong>of</strong>ten the breakdown voltages tend to be the same within an array or within a film. For example, the lower<br />
plot in Fig. 11 shows I(V) data for a set <strong>of</strong> variable-area diodes, all with the same breakdown voltage.<br />
After experiencing breakdown, some diodes recover immediately, while some diodes are permanently<br />
shorted.<br />
Based on these observations, we believe the abrupt breakdown is not a fundamental limit to the<br />
largest bias voltage that can be applied. We believe that this breakdown can be pushed to larger voltages<br />
through modifications to device design and processing.<br />
SUMMARY AND CONCLUSIONS<br />
This paper has presented new characterization data for <strong>MWIR</strong> back-illuminated planar <strong>HgCdTe</strong> e-<br />
APDs.<br />
Gain versus voltage data for a new film with a longer cut<strong>of</strong>f wavelength, 4.29 µm at 160 K, support<br />
the exponential increase <strong>of</strong> gain with cut<strong>of</strong>f wavelength for the same bias voltage that we reported previously<br />
for two films with shorter cut<strong>of</strong>f wavelengths <strong>of</strong> 3.54 and 4.06 µm at 160 K. The gain versus voltage data at<br />
160 K for all three films agree reasonably well with the Beck empirical model.<br />
Dark current versus voltage data at 80 K for F/5 are dominated by the gain-multiplied photocurrent<br />
due to background radiation, while at FOV=0 the dark current increases more rapidly than the gain,<br />
suggesting a tunneling-related leakage current. The lowest values <strong>of</strong> gain-normalized dark current density at<br />
-15-
80 K we measured are about 0.3 µA/cm² at -10.0 V for 250×250 µm² devices with a cut<strong>of</strong>f wavelength <strong>of</strong><br />
4.23 µm at 80 K. This is about one to two orders <strong>of</strong> magnitude above the lowest values reported by DRS 26 for<br />
80 K and -10.0 V, for comparable cut<strong>of</strong>f wavelengths. We believe that lower dark currents at large reverse<br />
bias will result from improved device designs and processing.<br />
We reported data for gain versus temperature for 250×250 µm² devices from two films over the 80-<br />
200 K temperature range.<br />
This paper presented the first report <strong>of</strong> the dependence <strong>of</strong> measured gain on junction area for a family<br />
<strong>of</strong> widely-spaced circular diodes with diameters ranging from 40 µm to 350 µm, with measured gains <strong>of</strong> 70<br />
for the smallest diodes and 50 for the largest. We interpret the variation <strong>of</strong> measured gain with junction area<br />
in terms <strong>of</strong> edge-enhanced electric field, which is consistent with edge features seen in our data for the spatial<br />
behavior <strong>of</strong> gain. We obtain a good fit the data for measured gain versus junction area with a simple two-gain<br />
model, having a lower interior gain and a higher edge gain for laterally collected minority photocarriers.<br />
We reported data for the noise multiplication factor F(M), which show F(M)≈1 for gain up to 150 at<br />
196 K, for a cut<strong>of</strong>f wavelength <strong>of</strong> 4.06 µm at 160 K.<br />
We described the characteristics <strong>of</strong> an abrupt breakdown phenomenon that is seen in nearly all our<br />
devices at sufficiently high reverse bias voltage. The breakdown voltage increases with increasing<br />
temperature, is larger for shorter cut<strong>of</strong>f wavelength, and tends to be the same within a film. Some diodes<br />
recover after breakdown while others are permanently shorted. We believe the abrupt breakdown in our<br />
devices is technological, not fundamental, and that higher breakdown voltages will result from improved<br />
device designs and processing.<br />
ACKNOWLEDGEMENTS<br />
<strong>Characterization</strong> <strong>of</strong> <strong>MWIR</strong> <strong>HgCdTe</strong> e-APDs was done at the BAE Systems facility in Lexington,<br />
Massachusetts, and was funded by BAE Systems internal funds. Data were also taken <strong>Voxtel</strong>, Inc. in<br />
Beaverton, Oregon. The devices were made and initially characterized under funding from <strong>Voxtel</strong>, Inc. under<br />
-16-
NASA Contract CA28C from the Jet Propulsion Laboratory, Pasadena, California. We acknowledge the<br />
collaboration and support <strong>of</strong> our colleagues at BAE Systems, Gary R. Woodward and Dr. Paul LoVecchio.<br />
REFERENCES<br />
1. J.D. Beck, C-F Wan, M.A. Kinch and J.E. Robinson, "<strong>MWIR</strong> <strong>HgCdTe</strong> avalanche photodiodes," Proc.<br />
SPIE 4454, 188-197 (2001).<br />
2. M.A. Kinch, J.D. Beck, C-F Wan, F. Ma and J. Campbell, "<strong>HgCdTe</strong> Electron Avalanche Photodiodes," J.<br />
Electronic Mat. 33, 630-639 (2004).<br />
3. M.B. Reine, J.W. Marciniec, K.K. Wong, T. Parodos, J.D. Mullarkey, P.A. Lamarre, S.P. Tobin, K.A.<br />
Gustavsen and G.M. Williams, “<strong>HgCdTe</strong> <strong>MWIR</strong> <strong>Back</strong>-<strong>Illuminated</strong> Electron-Initiated Avalanche Photodiode<br />
Arrays,” Proc. SPIE 6294, 629503 (2006).<br />
3. M. B. Reine, J. W. Marciniec, K. K. Wong, T. Parodos, J. D. Mullarkey, P. A. Lamarre, S. P. Tobin, K. A.<br />
Gustavsen and G. M. Williams, “<strong>HgCdTe</strong> <strong>MWIR</strong> <strong>Back</strong>-<strong>Illuminated</strong> Electron-Initiated Avalanche Photodiode<br />
Arrays,” J. Electronic Materials 36, 1059 (20<strong>07</strong>).<br />
5. T.J. Tredwell, "(Hg,Cd)Te Photodiodes for Detection <strong>of</strong> Two-Micrometer Infrared Radiation," Optical<br />
Engineering 16, 237 (1977).<br />
6. S.H. Shin, J.G. Pasko, H.D. Law and D.T. Cheung, “1.22 µm <strong>HgCdTe</strong>/CdTe Avalanche Photodiodes,”<br />
Appl. Phys. Lett. 40, 965 (1982).<br />
7. C. Verie, F. Raymond, J. Besson and T.N. Duy, “Bandgap Spin-Orbit Splitting Resonance Effect in Hg 1-<br />
xCd x Te Alloys,” J. Crystal Growth 59, 342 (1982).<br />
-17-
8. T. Nguyen Duy, A. Durand and J.L. Lyot, "Bulk Crystal Growth <strong>of</strong> Hg 1-x Cd x Te for Avalanche Photodiode<br />
Applications," Mat. Res. Soc. Symp. Proc. 90, 81 (1987).<br />
9. R. Alabedra, B. Orsal, G. Lecoy, G. Pichard, J. Meslage and P. Fragnon, "An Hg 0.3 Cd 0.7 Te Avalanche<br />
Photodiode for Optical-Fiber Transmission Systems at λ = 1.3 µm," IEEE Trans. Electron Devices ED-32,<br />
1302 (1985).<br />
10. G.P. Lecoy, B. Orsal and R. Alabedra, "Impact Ionization Resonance and Auger Recombination in Hg 1-<br />
xCd x Te (0.6 ≤ x ≤ 0.7)," IEEE Trans. Quantum Electronics QE-23, 1145 (1987).<br />
11. B. Orsal, R. Alabedra, M. Valenza, G.P. Lecoy, J. Meslage and C.Y. Boisrobert, "Hg 0.4 Cd 0.6 Te 1.55-µm<br />
Avalanche Photodiode Noise Analysis in the Vicinity <strong>of</strong> Resonant Impact Ionization Connected with Spin-<br />
Orbit Split-Off Band," IEEE Trans. Electron Devices ED-35, 101 (1988).<br />
12. B. Orsal, R. Alabedra, A. Maatougui and J.C. Flachet, "Hg 0.56 Cd 0.44 Te 1.6- to 2.5-µm Avalanche<br />
Photodiode and Noise Study Far from Resonant Impact Ionization," IEEE Trans. Electron Devices ED-38,<br />
1748 (1991).<br />
13. Y. Liu, S. R. Forest, R. Loo, G. Tangonan and H. Yen, "Anomalous multiplication in Hg 0.56 Cd 0.44 Te<br />
avalanche photodiodes," Appl. Phys. Lett. 61, 2878 (1992).<br />
14. G. Leveque, M. Nasser, D. Bertho, B. Orsal and R. Alabedra, “Ionization energies in Cd x Hg 1-x Te<br />
avalanche photodiodes,” Semicond. Sci. Technol. 8, 1317 (1993).<br />
-18-
15. T.J. de Lyon, B. Baumgratz, G. Chapman, E. Gordon, A.T. Hunter, M. Jack, J.E. Jensen, W. Johnson, B.<br />
Johs, K. Kosai, W. Larsen, G.L. Olson, M. Sen and B. Walker, “Epitaxial Growth <strong>of</strong> <strong>HgCdTe</strong> 1.55 µ<br />
Avalanche Photodiodes by Molecular-Beam Epitaxy,” Proc. SPIE 3629, 256-67 (1999).<br />
16. R.E. DeWames, J.G. Pasko, D.L. McConnell, J.S. Chen, J. Bajaj, L.O. Bubulac, E.S. Yao, G.L. Bostrup,<br />
R. Zucca, G.M. Williams, A.M. Blume and T.P. Weismuller, “Radiatively Limited <strong>MWIR</strong> Photovoltaic<br />
Detectors Fabricated on Sapphire Substrates,” Extended Abstracts, 1989 U.S. Workshop on the Physics and<br />
Chemistry <strong>of</strong> <strong>II</strong>-<strong>VI</strong> Materials, San Diego, California, Oct. 3-5, 1989.<br />
17. C.T. Elliott, N.T. Gordon, R.S. Hall and G. Crimes, "Reverse breakdown in long wavelength lateral<br />
collection Cd x Hg 1-x Te diodes," J. Vac, Sci. Technol. A8, 1251-3 (1990).<br />
18. A.R. Reisinger, F.J. Weaver, J.J. Voelker, S.J. Caputi and T.H. Myers, “Avalanche Multiplication in Hg-<br />
Diffused Long-Wave Infrared <strong>HgCdTe</strong> Heterodyne Photodiodes,” 1995 (unpublished).<br />
19. M. A. Kinch, Fundamentals <strong>of</strong> Infrared Detector Materials, Chap. 7, “<strong>HgCdTe</strong> Electron Avalanche<br />
Photodiodes (EAPDs)” (SPIE Press, Bellingham, Washington, 20<strong>07</strong>).<br />
20. M. Kinch, “A Theoretical Model for the <strong>HgCdTe</strong> Electron Avalanche Photodiode,” J. Electronic<br />
Materials 37, this issue (2008).<br />
21. F. Ma, X. Li, J.C. Campbell, J.D. Beck, C-F Wan and M.A. Kinch, “Monte Carlo simulations <strong>of</strong><br />
Hg 0.7 Cd 0.3 Te avalanche photodiodes and resonance phenomenon in the multiplication noise,” Appl. Phys.<br />
Lett. 83, 785 (2003).<br />
-19-
22. I. Baker, S. Duncan and J. Copley, “A Low Noise, Laser-Gated Imaging System for Long Range Target<br />
Identification,” Proc. SPIE 5406, 133 (2004).<br />
23. I. Baker, P. Thorne, J. Henderson, J. Copley, D. Humphreys and A. Millar, “Advanced multifunctional<br />
detectors for laser-gated imaging applications,” Proc. SPIE 6206, 620608 (2006).<br />
24. M. Vaidyanathan, A. Joshi, S. Xue, B. Hanyaloglu, M. Thomas, M. Zandian, D. Edwall, G. Williams, J.<br />
Blackwell, W. Tennant and G. Hughes, “High Performance Ladar Focal Plane Arrays for 3D Range<br />
Imaging,” 2004 IEEE Aerospace Conference Proceedings, pp. 1776-81 (2004).<br />
25. R.S. Hall, N.T. Gordon, J. Giess, J.E. Hails, A. Graham, D.C. Herbert, D.J. Hall, P. Southern, J.W.<br />
Cairns, D.J. Lees and T. Ashley, “Photomultiplication with low excess noise factor in <strong>MWIR</strong> to optical fiber<br />
compatible wavelengths in cooled <strong>HgCdTe</strong> mesa diodes,” Proc. SPIE 5783, 412 (2005).<br />
26. J. Beck, C. Wan, M. Kinch, J. Robinson, P. Mitra, R. Scritchfield, F. Ma and J. Campbell, “The <strong>HgCdTe</strong><br />
Electron Avalanche Photodiode,” Proc. SPIE 5564, 44 (2004).<br />
27. J. Beck, C. Wan, M. Kinch, J. Robinson, P. Mitra, R. Scritchfield, F. Ma and J. Campbell, “The <strong>HgCdTe</strong><br />
Electron Avalanche Photodiode,” J. Electronic Mat. 35, 1166 (2006).<br />
28. P. Mitra, J.D. Beck, M.R. Skokan, J.E. Robinson, C.A. Musca, J.M. Dell and L. Faraone, “SWIR<br />
hyperspectral detection with integrated <strong>HgCdTe</strong> detector and tunable MEMS filter,” Proc. SPIE 6295,<br />
62950G (2006).<br />
-20-
29. J. Beck, M. Woodall, R. Scritchfield, M. Ohlson, L. Wood, P. Mitra and J. Robinson, “Gated IR imaging<br />
with 128 × 128 <strong>HgCdTe</strong> electron avalanche photodiode FPA,” Proc. SPIE 6542, 654217 (20<strong>07</strong>).<br />
30. J. Beck, M. Woodall, R. Scritchfield, M. Ohlson, L. Wood, P. Mitra and J. Robinson, “Gated IR Imaging<br />
with 128 × 128 <strong>HgCdTe</strong> Electron Avalanche Photodiode FPA,” J. Electronic Materials 37, this issue (2008).<br />
31. G. Perrais, O. Gravrand, J. Baylet, G. Destefanis and J. Rothman, “Gain and Dark Current Characteristics<br />
<strong>of</strong> Planar <strong>HgCdTe</strong> Avalanche Photo Diodes,” J. Electronic Materials 36, 963 (20<strong>07</strong>).<br />
32. J. Rothman, G. Perrais, P. Ballet, L. Mollard, S. Gout and J.-P. Chamonal, “Latest Development <strong>of</strong><br />
<strong>HgCdTe</strong> APDs at CEA LETI-Minatec,” J. Electronic Materials 37, this issue (2008).<br />
33. G. Perrais, J. Rothman, J. Baylet, J. P. Chamonal and G. Destefanis, “<strong>HgCdTe</strong> Avalanche Photodiodes<br />
Response Time Depending on Gain and Temperature,” J. Electronic Materials 37, this issue (2008).<br />
34. J. Rothman, G. Perrais, G. Destefanis, J. Baylet, P. Castelein, and J.-P. Chamonal, “High performance<br />
characteristics in pin MW <strong>HgCdTe</strong> e-APDs,” Proc. SPIE 6542, 654219 (20<strong>07</strong>).<br />
35. P. LoVecchio, K. Wong, T. Parodos, S.P. Tobin, M.A. Hutchins and P.W. Norton, “Advances in liquid<br />
phase epitaxial growth <strong>of</strong> Hg 1-x Cd x Te for SWIR through VLWIR photodiodes,” Proc. SPIE 5564, 65 (2004).<br />
36. M. B. Reine, K. R. Maschh<strong>of</strong>f, S. P. Tobin, P. W. Norton, J. A. Mroczkowski and E. E. Krueger, "The<br />
Impact <strong>of</strong> <strong>Characterization</strong> Techniques on <strong>HgCdTe</strong> Infrared Detector Technology," Semicond. Sci. Technol.<br />
8, 788 (1993).<br />
-21-
37. R. DeWames, “Properties <strong>of</strong> <strong>HgCdTe</strong> Avalanche Photodiodes,” J. Electronic Materials 37, this issue<br />
(2008).<br />
-22-
Unit Cell<br />
CdTe Passivation Indium Bump N-Contact Metal<br />
P-Contact<br />
N + <strong>HgCdTe</strong> Layer<br />
N- <strong>HgCdTe</strong> W(V)<br />
P-<strong>HgCdTe</strong><br />
CdZnTe Substrate<br />
IR Radiation<br />
Fig. 1. Cross-section <strong>of</strong> the back-illuminated planar n-on-p <strong>HgCdTe</strong> e-APD.<br />
1000<br />
235-G, λ CO =4.29 µm<br />
Els 32, 34, 40, 44, 85, 89<br />
n-on-p e-APDs<br />
<strong>Voxtel</strong> Test Chips Lots 1, 2<br />
T=160 K<br />
Area=250x250 µm²<br />
100<br />
163-A1, λ CO =4.06 µm<br />
Els 49, 51, 54, 62<br />
Gain<br />
177-A2, λ CO =3.54 µm<br />
Els 36, 38, 48, 88<br />
10<br />
1<br />
Beck model :<br />
M(V) = 1+<br />
2<br />
V<br />
th<br />
= 6.8×<br />
E<br />
[2(V−Vth<br />
) / Vth<br />
]<br />
G<br />
-13 -12 -11 -10 -9 -8 -7 -6 -5 -4 -3 -2 -1 0<br />
Bias Voltage (V)<br />
Fig. 2. Data for gain versus reverse bias voltage at 160 K for elements from three 4×4 e-APD arrays<br />
fabricated in films with different cut<strong>of</strong>f wavelengths. The three dashed curves are calculated from the<br />
phenomenological model <strong>of</strong> Beck et al. for avalanche gain in <strong>HgCdTe</strong> e-APDs.<br />
-23-
1E-4<br />
1E-5<br />
F/5, with BB<br />
163A1-B1-15, T=80 K<br />
λ CO =4.23 µm at 80 K<br />
250x250 µm²<br />
1E+9<br />
1E+8<br />
1E-6<br />
1E+7<br />
Current (abs value) (A)<br />
1E-7<br />
1E-8<br />
1E-9<br />
1E-10<br />
I DARK /M<br />
F/5, Dark<br />
FOV=0<br />
1E+6<br />
1E+5<br />
1E+4<br />
1E+3<br />
Gain<br />
1E-11<br />
1E-12<br />
I DARK /M<br />
Gain<br />
1E+2<br />
1E+1<br />
1E-13<br />
1E+0<br />
-10 -9 -8 -7 -6 -5 -4 -3 -2 -1 0<br />
Voltage (V)<br />
Fig. 3. Data at 80 K for I(V) and I(V)/M(V) for both F/5 and FOV=0 conditions. Also shown are I(V) data<br />
for F/5 with radiation from a 1000 K blackbody. Gain data are plotted on the right-hand axis. The dark<br />
current data for FOV=0 may have been affected by our measurement apparatus between -5 V and 0 V.<br />
1E+3<br />
T=80 K<br />
T=120 K<br />
235-G<br />
λ CO =4.54 µm at 80 K<br />
Elements 32, 44, 85<br />
Area = 250x250 µm²<br />
F/5<br />
1E+2<br />
Gain<br />
1E+1<br />
T=160 K<br />
T=200 K<br />
1E+0<br />
-11 -10 -9 -8 -7 -6 -5 -4 -3 -2 -1 0<br />
Voltage (V)<br />
Fig. 4. Gain versus reverse bias voltage data for three elements in Test Chip 235-G, for temperatures <strong>of</strong> 80,<br />
120, 160 and 200 K.<br />
-24-
1000<br />
100<br />
Gain at -9.0 V<br />
10<br />
235-G, El 32, Lco=4.53 µm at 80 K<br />
163A1-B1, El 8, Lco=4.23 µm at 80 K<br />
DRS, Lco=2.63 µm at 300 K<br />
Beck model, x fixed<br />
1<br />
0 50 100 150 200 250 300<br />
Temperature (K)<br />
Fig. 5. Data for gain at -9.0 V plotted versus temperature for large-area photodiodes from two films with<br />
cut<strong>of</strong>f wavelengths <strong>of</strong> 4.53 and 4.23 µm at 80 K, along with published data for a DRS device at 300 K with a<br />
cut<strong>of</strong>f wavelength <strong>of</strong> 2.63 µm.<br />
1E+3<br />
1E+2<br />
Test Chip 235G<br />
λ CO =4.29 µm at 160 K<br />
Els 4, 8, 12, 24<br />
Circular diodes<br />
T=160 K<br />
Gain<br />
1E+1<br />
40 µm dia, El 4<br />
60 µm dia, El 8<br />
100 µm dia, El 12<br />
350 µm dia, El 24<br />
1E+0<br />
-11 -10 -9 -8 -7 -6 -5 -4 -3 -2 -1 0<br />
Voltage (V)<br />
Fig. 6. Data for gain versus reverse bias voltage at 160 K for four widely-spaced circular diagnostic diodes<br />
with diameters <strong>of</strong> 40, 60, 100 and 350 µm. Gain increases monotonically with decreasing diameter.<br />
-25-
80<br />
70<br />
M(-7.0 V) data<br />
Best fit, Lopt=12.0 µm<br />
60<br />
Gain at -7.0 V<br />
50<br />
40<br />
30<br />
20<br />
10<br />
Curve is best fit to :<br />
M<br />
M =<br />
with<br />
M<br />
1D<br />
1D<br />
R<br />
2<br />
J<br />
+ M<br />
= 45,<br />
E<br />
(R<br />
J<br />
M<br />
[(R<br />
+ L<br />
E<br />
+ L<br />
= 85,<br />
L<br />
)<br />
2<br />
J OPT<br />
2<br />
OPT<br />
)<br />
OPT<br />
− R<br />
2<br />
J<br />
]<br />
= 12.0 µ m<br />
235G<br />
λ CO = 4.54 µm at 80 K<br />
Circular, R J = 20-175 µm<br />
T = 80 K, F/5<br />
0<br />
1E-5 1E-4 1E-3<br />
Junction Area (cm²)<br />
Fig. 7. Data for the gains measured at V=-7.0 V for widely-spaced circular diagnostic diodes at 80 K. Solid<br />
curve is the best fit to the data with a two-gain model.<br />
1E-5<br />
Curve: least-squares fit to:<br />
I PH = I PH1D (1+L OPT /R J )²<br />
with L OPT = 12.0 µm<br />
A J =200x200 µm²<br />
Photocurrent at V=0 (A)<br />
1E-6<br />
1E-7<br />
235G<br />
λ CO = 4.54 µm at 80 K<br />
slope=1<br />
Circular, R J = 20-175 µm<br />
T = 80 K, F/5<br />
1E-8<br />
1E-5 1E-4 1E-3<br />
Junction Area (cm²)<br />
Fig. 8. Data for photocurrent at V=0 for widely-spaced circular diagnostic diodes at 80 K, due to incident<br />
radiation from a 1000 K blackbody, plotted versus junction area. The solid curve is the best fit to the data,<br />
yielding a value for the lateral optical collection length L OPT <strong>of</strong> 12 µm. The data for the 250×250 µm² devices<br />
are shown for comparison.<br />
-26-
1E-7<br />
10000<br />
Relative Response<br />
1E-8<br />
1E-9<br />
1E-10<br />
V = -5 V<br />
V = 0<br />
Gain, avg = 10.8<br />
163-A1, El 56<br />
λ CO =4.24 µm at 80 K<br />
T=79 K<br />
With filter 1000<br />
FWHM:<br />
210.97 µm at 0 V<br />
214.73 µm at -5 V<br />
∆=3.76 µm<br />
100<br />
10<br />
Ratio<br />
1E-11<br />
1<br />
-250 -200 -150 -100 -50 0 50 100 150 200 250<br />
Distance (µm)<br />
Fig. 9. Spot scan pr<strong>of</strong>iles for a 250×250 µm² unit cell in a 4×4 e-APD array at 79 K, for V=0 and V=-5.0 V.<br />
The ratio <strong>of</strong> the -5.0 V data to the V=0 data is defined as the gain, and is plotted on the right-hand axis. The<br />
gain is spatially uniform in the interior <strong>of</strong> the diode, with an average value <strong>of</strong> 10.8 at -5.0 V. There is<br />
evidence <strong>of</strong> gain enhancement seen at the edges <strong>of</strong> the junction.<br />
5<br />
4<br />
3<br />
163A1, El 80<br />
λ CO =4.06 µm at 160 K<br />
250x250 µm²<br />
T = 196 K<br />
V = -0.1 V to -9.0 V<br />
<strong>Voxtel</strong> data<br />
k=0<br />
k=0.025<br />
El 80<br />
F(M)<br />
2<br />
1<br />
F(M) normailzed to 1 at V=-0.1 V<br />
0<br />
0 20 40 60 80 100 120 140 160<br />
Gain<br />
Fig. 10. Data for the excess noise multiplication factor F(M) plotted versus gain, at T=196 K, taken at <strong>Voxtel</strong><br />
Inc. The two solid curves are plots <strong>of</strong> the standard McIntyre equation for F(M).<br />
-27-
Current, absolute value (A)<br />
1E-4<br />
1E-5<br />
1E-6<br />
1E-7<br />
1E-8<br />
200 K<br />
160 K<br />
120 K<br />
163A1-B1, El 15<br />
λ CO =4.05 µm at 160 K<br />
250x250 µm²<br />
FOV=0<br />
80 K<br />
1E-9<br />
-14 -13 -12 -11 -10 -9 -8 -7 -6 -5 -4 -3 -2 -1 0<br />
Voltage (V)<br />
1E-3<br />
Current (absolute value) (A)<br />
1E-4<br />
1E-5<br />
1E-6<br />
1E-7<br />
177A2<br />
λ CO =3.54 µm at 160 K<br />
T = 173 K<br />
<strong>Voxtel</strong> Data<br />
350 µm dia.<br />
250 µm dia.<br />
150 µm dia.<br />
100 µm dia.<br />
60 µm dia.<br />
40 µm dia.<br />
1E-8<br />
1E-9<br />
-14 -13 -12 -11 -10 -9 -8 -7 -6 -5 -4 -3 -2 -1 0<br />
Voltage(V)<br />
Fig. 11. Data illustrating general features <strong>of</strong> the abrupt breakdown phenomena seen in most <strong>of</strong> our devices.<br />
Upper plot: Data for dark current (FOV=0) for a diode with a cut<strong>of</strong>f wavelength <strong>of</strong> 4.05 at 160 K, for<br />
temperatures <strong>of</strong> 80, 120, 160 and 200 K, illustrating the increase <strong>of</strong> breakdown voltage with increasing<br />
temperature. Lower plot: Data for dark current versus reverse bias voltage, for T=173 K, for widely-spaced<br />
circular diagnostic photodiodes with a shorter cut<strong>of</strong>f wavelength <strong>of</strong> 3.54 µm at 160 K, illustrating the general<br />
increase in breakdown voltage with decreasing cut<strong>of</strong>f wavelength.<br />
-28-