The GAMCO Global Telecommunications Fund - Gabelli
The GAMCO Global Telecommunications Fund - Gabelli
The GAMCO Global Telecommunications Fund - Gabelli
Create successful ePaper yourself
Turn your PDF publications into a flip-book with our unique Google optimized e-Paper software.
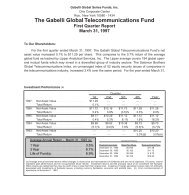
<strong>The</strong> <strong>GAMCO</strong> <strong>Global</strong> <strong>Telecommunications</strong> <strong>Fund</strong><br />
First Quarter Report — March 31, 2012<br />
Mario J. <strong>Gabelli</strong>, CFA Sergey Dluzhevskiy, CFA, CPA Evan Miller, CFA<br />
To Our Shareholders,<br />
For the quarter ended March 31, 2012, the net asset value (“NAV”) per Class AAA Share of <strong>The</strong> <strong>GAMCO</strong> <strong>Global</strong> <strong>Telecommunications</strong><br />
<strong>Fund</strong> increased 6.7% compared with an increase of 1.8% for the Morgan Stanley Capital International (“MSCI”) All Country<br />
(“AC”) World <strong>Telecommunications</strong> Services Index.<br />
Enclosed is the schedule of investments as of March 31, 2012.<br />
Comparative Results<br />
Average Annual Returns through March 31, 2012 (a) (Unaudited)<br />
Since<br />
Inception<br />
Quarter 1 Year 5 Year 10 Year (6/30/95)<br />
Class AAA (GABTX) ......................................... 6.67% (5.70)%(1.55)% 6.20% 7.60%<br />
MSCI AC World Telecommunication Services Index .................... 1.83 (7.91) (3.09) 2.01 N/A<br />
MSCI AC World Free Index ..................................... 11.96 (0.28) 0.29 5.80 4.36(e)<br />
Class A (GTCAX). ........................................... 6.67 (5.72) (1.54) 6.21 7.61<br />
With sales charge (b) ......................................... 0.54 (11.14) (2.70) 5.59 7.26<br />
Class B (GTCBX). ........................................... 6.38 (6.46) (2.31) 5.39 7.09<br />
With contingent deferred sales charge (c) ........................... 1.38 (11.14) (2.70) 5.39 7.09<br />
Class C (GTCCX). ........................................... 6.46 (6.37) (2.29) 5.40 7.09<br />
With contingent deferred sales charge (d) ........................... 5.46 (7.31) (2.29) 5.40 7.09<br />
Class I (GGTIX) ............................................. 6.73 (5.46) (1.33) 6.32 7.67<br />
In the current prospectus dated April 27, 2012, the expense ratios for Class AAA, A, B, C, and I Shares are 1.61%, 1.61%, 2.36%, 2.36%, and 1.36%,<br />
respectively. Class AAA and Class I Shares do not have a sales charge. <strong>The</strong> maximum sales charge for Class A, B, and C Shares is 5.75%, 5.00%, and<br />
1.00%, respectively.<br />
(a) Returns represent past performance and do not guarantee future results. Total returns and average annual returns reflect changes in share price,<br />
reinvestment of distributions, and are net of expenses. Investment returns and the principal value of an investment will fluctuate. When shares are redeemed,<br />
they may be worth more or less than their original cost. <strong>The</strong> <strong>Fund</strong> imposes a 2% redemption fee on shares sold or exchanged within seven days after the date<br />
of purchase. Performance returns for periods of less than one year are not annualized. Current performance may be lower or higher than performance data<br />
presented. Visit www.gabelli.com for performance information as of the most recent month end. Investors should carefully consider the investment<br />
objectives, risks, charges, and expenses of the <strong>Fund</strong> before investing. <strong>The</strong> prospectus contains information about these and other matters and<br />
should be read carefully before investing. Investing in foreign securities involves risks not ordinarily associated with investments in domestic issues, including<br />
currency fluctuation, economic, and political risks. <strong>The</strong> Class AAA Share NAVs per share are used to calculate performance for the periods prior to the issuance<br />
of Class A Shares, Class B Shares, Class C Shares, and Class I Shares on March 12, 2000, March 13, 2000, June 2, 2000, and January 11, 2008, respectively.<br />
<strong>The</strong> actual performance for the Class B Shares and Class C Shares would have been lower due to the additional expenses associated with these classes of<br />
shares. <strong>The</strong> MSCI AC World Telecommunication Services Index is an unmanaged index that measures the performance of the global telecommunication<br />
securities from around the world. <strong>The</strong> MSCI AC World Free Index is a free float adjusted market capitalization weighted index that is designed to measure the<br />
equity market performance of developed and emerging markets. <strong>The</strong> MSCI AC World Free Index consists of 45 country indices comprising 24 developed and 21<br />
emerging market country indices. Dividends are considered reinvested. You cannot invest directly in an index.<br />
(b) Performance results include the effect of the maximum 5.75% sales charge at the beginning of the period.<br />
(c) Assuming payment of the maximum contingent deferred sales charge (CDSC). <strong>The</strong> maximum CDSC for Class B Shares is 5% which is gradually reduced to 0%<br />
after six years.<br />
(d) Assuming payment of the 1% maximum CDSC imposed on redemptions made within one year of purchase.<br />
(e) MSCI AC World Free Index performance are as of inception of the indices since October 29, 1993.


