The GAMCO Global Telecommunications Fund - Gabelli
The GAMCO Global Telecommunications Fund - Gabelli
The GAMCO Global Telecommunications Fund - Gabelli

Create successful ePaper yourself
Turn your PDF publications into a flip-book with our unique Google optimized e-Paper software.
<strong>The</strong> <strong>GAMCO</strong> <strong>Global</strong> <strong>Telecommunications</strong> <strong>Fund</strong><br />
Notes to Schedule of Investments (Unaudited) (Continued)<br />
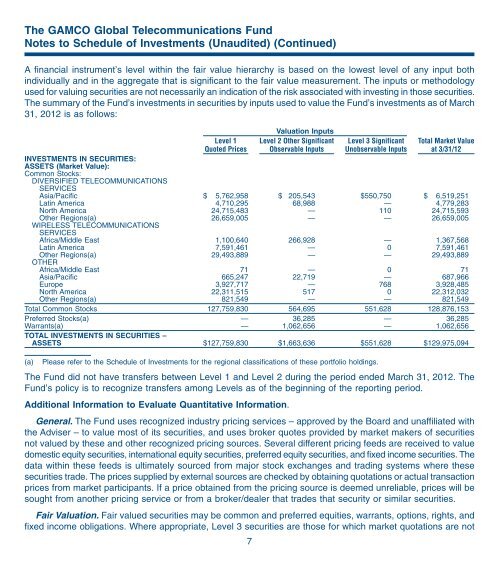
A financial instrument’s level within the fair value hierarchy is based on the lowest level of any input both<br />
individually and in the aggregate that is significant to the fair value measurement. <strong>The</strong> inputs or methodology<br />
used for valuing securities are not necessarily an indication of the risk associated with investing in those securities.<br />
<strong>The</strong> summary of the <strong>Fund</strong>’s investments in securities by inputs used to value the <strong>Fund</strong>’s investments as of March<br />
31, 2012 is as follows:<br />
Valuation Inputs<br />
Level 1<br />
Quoted Prices<br />
Level 2 Other Significant<br />
Observable Inputs<br />
Level 3 Significant<br />
Unobservable Inputs<br />
Total Market Value<br />
at 3/31/12<br />
INVESTMENTS IN SECURITIES:<br />
ASSETS (Market Value):<br />
Common Stocks:<br />
DIVERSIFIED TELECOMMUNICATIONS<br />
SERVICES<br />
Asia/Pacific $ 5,762,958 $ 205,543 $550,750 $ 6,519,251<br />
Latin America 4,710,295 68,988 — 4,779,283<br />
North America 24,715,483 — 110 24,715,593<br />
Other Regions(a) 26,659,005 — — 26,659,005<br />
WIRELESS TELECOMMUNICATIONS<br />
SERVICES<br />
Africa/Middle East 1,100,640 266,928 — 1,367,568<br />
Latin America 7,591,461 — 0 7,591,461<br />
Other Regions(a) 29,493,889 — — 29,493,889<br />
OTHER<br />
Africa/Middle East 71 — 0 71<br />
Asia/Pacific 665,247 22,719 — 687,966<br />
Europe 3,927,717 — 768 3,928,485<br />
North America 22,311,515 517 0 22,312,032<br />
Other Regions(a) 821,549 — — 821,549<br />
Total Common Stocks 127,759,830 564,695 551,628 128,876,153<br />
Preferred Stocks(a) — 36,285 — 36,285<br />
Warrants(a) — 1,062,656 — 1,062,656<br />
TOTAL INVESTMENTS IN SECURITIES –<br />
ASSETS $127,759,830 $1,663,636 $551,628 $129,975,094<br />
(a)<br />
Please refer to the Schedule of Investments for the regional classifications of these portfolio holdings.<br />
<strong>The</strong> <strong>Fund</strong> did not have transfers between Level 1 and Level 2 during the period ended March 31, 2012. <strong>The</strong><br />
<strong>Fund</strong>’s policy is to recognize transfers among Levels as of the beginning of the reporting period.<br />
Additional Information to Evaluate Quantitative Information.<br />
General. <strong>The</strong> <strong>Fund</strong> uses recognized industry pricing services – approved by the Board and unaffiliated with<br />
the Adviser – to value most of its securities, and uses broker quotes provided by market makers of securities<br />
not valued by these and other recognized pricing sources. Several different pricing feeds are received to value<br />
domestic equity securities, international equity securities, preferred equity securities, and fixed income securities. <strong>The</strong><br />
data within these feeds is ultimately sourced from major stock exchanges and trading systems where these<br />
securities trade. <strong>The</strong> prices supplied by external sources are checked by obtaining quotations or actual transaction<br />
prices from market participants. If a price obtained from the pricing source is deemed unreliable, prices will be<br />
sought from another pricing service or from a broker/dealer that trades that security or similar securities.<br />
Fair Valuation. Fair valued securities may be common and preferred equities, warrants, options, rights, and<br />
fixed income obligations. Where appropriate, Level 3 securities are those for which market quotations are not<br />
7