DND RPP 2011-12
DND RPP 2011-12
DND RPP 2011-12
- No tags were found...

Create successful ePaper yourself
Turn your PDF publications into a flip-book with our unique Google optimized e-Paper software.
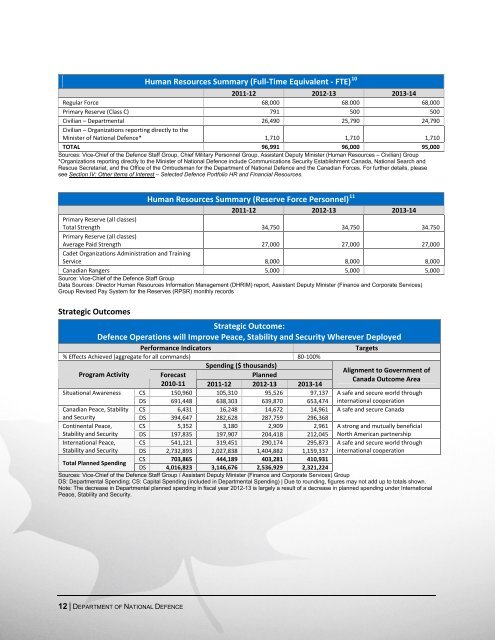
Human Resources Summary (Full‐Time Equivalent ‐ FTE) 10<br />
<strong>2011</strong>‐<strong>12</strong> 20<strong>12</strong>‐13 2013‐14<br />
Regular Force 68,000 68.000 68,000<br />
Primary Reserve (Class C) 791 500 500<br />
Civilian – Departmental 26,490 25,790 24,790<br />
Civilian – Organizations reporting directly to the<br />
Minister of National Defence* 1,710 1,710 1,710<br />
TOTAL 96,991 96,000 95,000<br />
Sources: Vice-Chief of the Defence Staff Group, Chief Military Personnel Group, Assistant Deputy Minister (Human Resources – Civilian) Group<br />
*Organizations reporting directly to the Minister of National Defence include Communications Security Establishment Canada, National Search and<br />
Rescue Secretariat, and the Office of the Ombudsman for the Department of National Defence and the Canadian Forces. For further details, please<br />
see Section IV: Other Items of Interest – Selected Defence Portfolio HR and Financial Resources.<br />
Human Resources Summary (Reserve Force Personnel) 11<br />
<strong>2011</strong>‐<strong>12</strong> 20<strong>12</strong>‐13 2013‐14<br />
Primary Reserve (all classes)<br />
Total Strength 34,750 34,750 34.750<br />
Primary Reserve (all classes)<br />
Average Paid Strength 27,000 27,000 27,000<br />
Cadet Organizations Administration and Training<br />
Service 8,000 8,000 8,000<br />
Canadian Rangers 5,000 5,000 5,000<br />
Source: Vice-Chief of the Defence Staff Group<br />
Data Sources: Director Human Resources Information Management (DHRIM) report, Assistant Deputy Minister (Finance and Corporate Services)<br />
Group Revised Pay System for the Reserves (RPSR) monthly records<br />
Strategic Outcomes<br />
Strategic Outcome:<br />
Defence Operations will Improve Peace, Stability and Security Wherever Deployed<br />
Performance Indicators<br />
Targets<br />
% Effects Achieved (aggregate for all commands) 80‐100%<br />
Program Activity<br />
Spending ($ thousands)<br />
Alignment to Government of<br />
Forecast<br />
Planned<br />
Canada Outcome Area<br />
2010‐11 <strong>2011</strong>‐<strong>12</strong> 20<strong>12</strong>‐13 2013‐14<br />
Situational Awareness CS 150,960 105,310 95,526 97,137 A safe and secure world through<br />
DS 691,448 638,303 639,870 653,474 international cooperation<br />
Canadian Peace, Stability CS 6,431 16,248 14,672 14,961 A safe and secure Canada<br />
and Security DS 394,647 282,628 287,759 296,368<br />
Continental Peace, CS 5,352 3,180 2,909 2,961 A strong and mutually beneficial<br />
Stability and Security DS 197,835 197,907 204,418 2<strong>12</strong>,045 North American partnership<br />
International Peace, CS 541,<strong>12</strong>1 319,451 290,174 295,873 A safe and secure world through<br />
Stability and Security DS 2,732,893 2,027,838 1,404,882 1,159,337 international cooperation<br />
Total Planned Spending<br />
CS 703,865 444,189 403,281 410,931<br />
DS 4,016,823 3,146,676 2,536,929 2,321,224<br />
Sources: Vice-Chief of the Defence Staff Group / Assistant Deputy Minister (Finance and Corporate Services) Group<br />
DS: Departmental Spending; CS: Capital Spending (included in Departmental Spending) | Due to rounding, figures may not add up to totals shown.<br />
Note: The decrease in Departmental planned spending in fiscal year 20<strong>12</strong>-13 is largely a result of a decrease in planned spending under International<br />
Peace, Stability and Security.<br />
<strong>12</strong> | DEPARTMENT OF NATIONAL DEFENCE