Fiscal Year 2013-14 - Lake Tahoe Community College
Fiscal Year 2013-14 - Lake Tahoe Community College
Fiscal Year 2013-14 - Lake Tahoe Community College
- No tags were found...

Create successful ePaper yourself
Turn your PDF publications into a flip-book with our unique Google optimized e-Paper software.
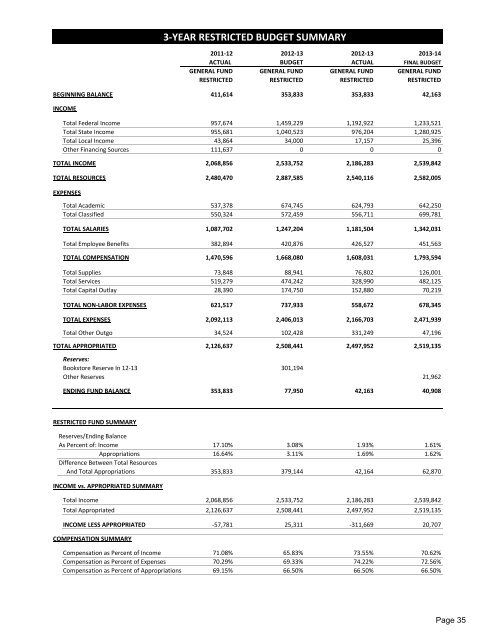
2011-12 2012-13 2012-13 <strong>2013</strong>-<strong>14</strong><br />
ACTUAL BUDGET ACTUAL FINAL BUDGET<br />
GENERAL FUND GENERAL FUND GENERAL FUND GENERAL FUND<br />
RESTRICTED RESTRICTED RESTRICTED RESTRICTED<br />
BEGINNING BALANCE 411,6<strong>14</strong> 353,833 353,833 42,163<br />
INCOME<br />
Total Federal Income 957,674 1,459,229 1,192,922 1,233,521<br />
Total State Income 955,681 1,040,523 976,204 1,280,925<br />
Total Local Income 43,864 34,000 17,157 25,396<br />
Other Financing Sources 111,637 0 0 0<br />
TOTAL INCOME 2,068,856 2,533,752 2,186,283 2,539,842<br />
TOTAL RESOURCES 2,480,470 2,887,585 2,540,116 2,582,005<br />
EXPENSES<br />
3-YEAR RESTRICTED BUDGET SUMMARY<br />
Total Academic 537,378 674,745 624,793 642,250<br />
Total Classified 550,324 572,459 556,711 699,781<br />
TOTAL SALARIES 1,087,702 1,247,204 1,181,504 1,342,031<br />
Total Employee Benefits 382,894 420,876 426,527 451,563<br />
TOTAL COMPENSATION 1,470,596 1,668,080 1,608,031 1,793,594<br />
Total Supplies 73,848 88,941 76,802 126,001<br />
Total Services 519,279 474,242 328,990 482,125<br />
Total Capital Outlay 28,390 174,750 152,880 70,219<br />
TOTAL NON-LABOR EXPENSES 621,517 737,933 558,672 678,345<br />
TOTAL EXPENSES 2,092,113 2,406,013 2,166,703 2,471,939<br />
Total Other Outgo 34,524 102,428 331,249 47,196<br />
TOTAL APPROPRIATED 2,126,637 2,508,441 2,497,952 2,519,135<br />
Reserves:<br />
Bookstore Reserve In 12-13 301,194<br />
Other Reserves 21,962<br />
ENDING FUND BALANCE 353,833 77,950 42,163 40,908<br />
RESTRICTED FUND SUMMARY<br />
Reserves/Ending Balance<br />
As Percent of: Income 17.10% 3.08% 1.93% 1.61%<br />
Appropriations 16.64% 3.11% 1.69% 1.62%<br />
Difference Between Total Resources<br />
And Total Appropriations 353,833 379,<strong>14</strong>4 42,164 62,870<br />
INCOME vs. APPROPRIATED SUMMARY<br />
Total Income 2,068,856 2,533,752 2,186,283 2,539,842<br />
Total Appropriated 2,126,637 2,508,441 2,497,952 2,519,135<br />
INCOME LESS APPROPRIATED -57,781 25,311 -311,669 20,707<br />
COMPENSATION SUMMARY<br />
Compensation as Percent of Income 71.08% 65.83% 73.55% 70.62%<br />
Compensation as Percent of Expenses 70.29% 69.33% 74.22% 72.56%<br />
Compensation as Percent of Appropriations 69.15% 66.50% 66.50% 66.50%<br />
Page 35