JTWC Report PDF - Weather Underground
JTWC Report PDF - Weather Underground
JTWC Report PDF - Weather Underground
- No tags were found...

You also want an ePaper? Increase the reach of your titles
YUMPU automatically turns print PDFs into web optimized ePapers that Google loves.
AN”NUALTROIW13AL<br />
CYCLONE REli(MiitT<br />
/“<br />
. KINT ‘TY-PHCK)N WA.R.NIN13 CENTER<br />
GUAM., /<br />
MARMNA ISILANDS
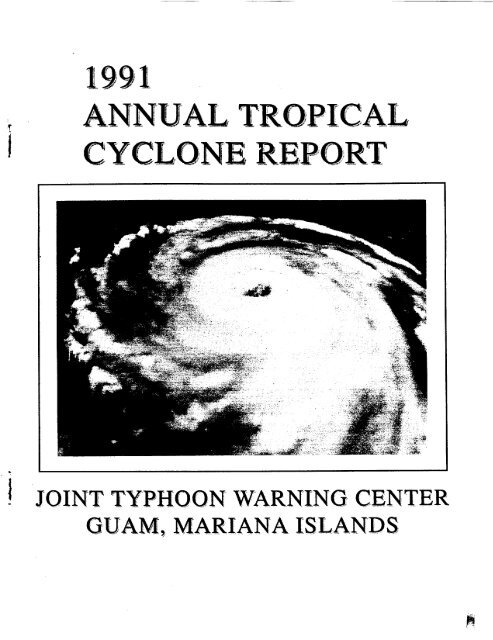
FRONT COVER CAPTION: This visual NOAA satellite image of Typhoon Pat (24W) at 070511Z<br />
October 1991 is transformed by the Meteorological Imagery, Data Display, and Analysis System<br />
(MIDDAS) soflsvare into a three-dimensional cloud map by vertically shifting each pixel according to<br />
its infrared brighmess temperature-derived height. The map is then rotated to produce this dramatic<br />
psuedo-perspective.
U. S. NAVAL OCEANOGRAPHY COMMAND CENTER<br />
JOINT TYPHOON WARNING CENTER<br />
COMNAWARIANAS<br />
PSC 489, BOX 12<br />
FPO AP 96540-0051<br />
DIETER K. RUDOLPH<br />
CAPTAIN, UNITED STATES NAVY<br />
COMMANDING OFFICER<br />
CHARLES<br />
P. GUARD<br />
LIEUTENANT COLONEL, UNITED STATES AIR FORCE<br />
DIRECTOR, JOINT TYPHOON WARNING CENTER<br />
COMMANDER, DETACHMENT 1, 633 OPERATIONS SUPPORT SQUADRON
* LCDR<br />
LCDR<br />
LCDR<br />
* cm<br />
* cm<br />
cm<br />
cm<br />
LT<br />
LT<br />
* LT<br />
LT<br />
AGCS<br />
AG2<br />
AG3<br />
* AG3<br />
SRA<br />
AIC<br />
AIC<br />
*AIC<br />
AGAN<br />
AGAA<br />
STAFF<br />
JOINT TYPHOON WARNING CENTER<br />
NICHOLASD.GURAL USN DEPUTYDIRECX)R<br />
LESTERE.CARRrIII USN DEPUTYDIRECIT)R<br />
ROBEmL.BEARD<br />
USN<br />
ANNR.GOETZ<br />
USAF TDO,BESTTRACKOFFICER<br />
BRUCEW.THOMPSON USAF<br />
ELIZABETHB.BORELLI USAF<br />
STEPHENC.HALLJN USAF<br />
DAVIDJ.STREMLER USN<br />
STACYR.STEWART USNR ~**<br />
RICHARDA.JEFFRIES USN<br />
THOMAS H.CECERE USN<br />
PXI’RJCK J.HENDRICKS, JR. USN LCPO<br />
RONALDH.BRY~<br />
USN ‘m& LPo<br />
HOLLYL.HOULIHAN USN TD~ STAI’ISTICS<br />
TRACEYR.DUNCAN USN TD&STAI’ISTICS<br />
CORNELIUS MASSEY USAF TDA<br />
Tr.Mm J.GALLAGHER USAF TD#LSTKI’ISTICS<br />
JANETE.KEMBLE USAF TDA<br />
JEREMYA.ENTWISTLE USAF TDA<br />
BONNIEJ.CAMPBELL USN TDA<br />
DAVID L HAZEL<br />
USN TDA<br />
DET 1, PACAF<br />
cm<br />
CAPT<br />
* CAPT<br />
lLT<br />
* MSGT<br />
MSGT<br />
TSGT<br />
* TSGT<br />
TSGT<br />
TSGT<br />
TSGT<br />
* SSGT<br />
* SSGT<br />
SSGT<br />
* SSGT<br />
SSGT<br />
SSGT<br />
DANIELN. SHOEMAKER USAF TDO,TECHNIQUE DEVELOPMENT<br />
ROBERTG.HUDSON USAF Iusc<br />
JOSEPHA.HANSER USAF DATADEVEM)PMENT<br />
SCO’ITC.JACOBS<br />
USAF DATADEVELOPMENT<br />
CHARLESP.BONJNI USAF TECHNIQUE DEVELOPMENT, NCOIC<br />
JOYL HARDING<br />
USAF ANALYfl,NCOIC<br />
DANILO.MONTILLANO USAF INFORMAI’ION MANAGEMENT<br />
BRIANP.BURKE<br />
USAF ANALYST, NCOIC<br />
WILLIAMG/U’ES, JR. USAF ANALY!rr<br />
PHILLIPA.ROSEBERRY USAF ANALYST<br />
JEPFERYE.OAKES USAF ANALYSI’<br />
MICHELLER.TJMPERIO USAF ANALYSI’<br />
PAULF.HARPER<br />
USAF ANALYST<br />
RAYMONDL.SOU~ JR. USAF ANALYST<br />
WAYNE I.GENTRY USAF ANALYST<br />
DANIELT. EBBERT USAF ANALYST<br />
JAMESG.BROCK<br />
USAF ANALYST<br />
ATCR STAFF<br />
CAPT<br />
MR<br />
SGT<br />
SGT<br />
* SOT<br />
DANB.MUNDELL<br />
FRANKH.WELLS<br />
BRIANL.McDONALD<br />
CARLOSA.DELANUEZ<br />
RAY O. BELEW<br />
USAF<br />
Cxv<br />
USAF<br />
USAF<br />
USAF<br />
TDO,STA~STICS<br />
OFFICER, EDITOR<br />
TECHNICAL EDITOR<br />
SENIORTDA,GRAPHICS<br />
TD&GRAPHICS<br />
TD/$LGRAPHICS<br />
ONR POST - DOCTORATE<br />
FELLOW<br />
DR<br />
MARK A. LANDER CIv UNIVERSITY OFGUAM<br />
* TRANSFERRED DURING1991<br />
** ACI’IVEDUTYTRAINING<br />
ii
FOREWORD<br />
The Annual Tropical Cyclone <strong>Report</strong> is<br />
prepared by the staff of the Joint Typhoon<br />
Warning Center (<strong>JTWC</strong>), a combined Air<br />
Force/Navy organization operating under the<br />
command of the Commanding Officer, U.S.<br />
Naval Oceanography Command Center/Joint<br />
Typhoon Warning Center, Guam. The <strong>JTWC</strong><br />
was founded 1 May 1959 when USCINCPAC<br />
directed that a single tropical cyclone warning<br />
center be established for the western North<br />
Pacific region. The operations of <strong>JTWC</strong> are<br />
guided by CINCPACINST 3140.lU.<br />
The mission of the Joint Typhoon<br />
Warning Center is multi-faceted and includes:<br />
1. Continuous monitoring of all tropical<br />
weather activity in the Northern and Southern<br />
Hemispheres, from 180 degrees east longitude<br />
westward to the east coast of Africa, and the<br />
prompt issuance of appropriate advisories and<br />
alerts when tropical cyclone development is<br />
anticipated.<br />
2. Issuance of warnings on all significant<br />
tropical cyclones in the above area of<br />
responsibility.<br />
3. Determination of requirements for<br />
tropical cyclone reconnaissance and assignment<br />
of appropriate priorities.<br />
4. Post-storm analysis of significant<br />
tropical cyclones Occurnng within the western<br />
North Pacific and North Indian Oceans, which<br />
includes an in-depth analysis of tropical<br />
cyclones of note and all typhoons.<br />
5. Cooperation with the Naval Research<br />
Laboratory (NRL), Monterey, California on the<br />
operational evaluation of tropical cyclone<br />
models and forecast aids, and the development<br />
of new techniques to support operational<br />
forecast scenarios.<br />
Changes in this year’s publication<br />
include: 1) In Chapter 3, extended captions have<br />
been used for most western North Pacific<br />
...<br />
m<br />
tropical depressions and tropical storms to<br />
reduce the amount of text; 2) a summary of<br />
individual warning statistics (formerly Annex<br />
A) has been added as Chapter 6 to provide a<br />
printout of 6-hourly positions and verification<br />
statistics; 3) the tables in Chapter 6 were<br />
expanded to include cross- and along-track<br />
errors; 4) the mean errors for each tropical<br />
cyclone appear in Chapter 6 instead of Chapter<br />
5 to improve the presentation of error statistics<br />
5) the cross- and along-track errors prior to<br />
1986 were calculated for the Indian Ocean and<br />
western South Pacific to establish a longer term<br />
of record; and, 6) western South Pacific<br />
verification statistics only include <strong>JTWC</strong><br />
performance, and do not include<br />
NAVWESTOCEANCEN forecasts.<br />
Special thanks to: the men and women at<br />
the Fleet Numerical Oceanography Center for<br />
their unfaltering operational and software<br />
support; the Naval Research Laboratory at<br />
Monterey for their dedicated research and<br />
forecast improvement initiatives the Air Force<br />
Global <strong>Weather</strong> Central for continued satellite<br />
support and microwave imagery enhancements;<br />
the 633 Communications Squadron, Operating<br />
Location Charlie and the Operations and<br />
Equipment Support departments of the Naval<br />
Oceanography Command Center, Guam for<br />
their high quality support; personnel of the<br />
Pacific Fleet Audio-Visual Center, Guam for<br />
their assistance in the reproduction of satellite<br />
data for this repo~ the Navy Publications and<br />
Printing Service Branch OffIce, Guany Dr. Bob<br />
Abbey and the Office of Naval Research for<br />
their support to the University of Guam for the<br />
Post Doctorate Fellow at <strong>JTWC</strong>; Dr. Mark<br />
Lander for his training efforts, suggestions and<br />
valuable insights; and to Sgt. Brian L.<br />
McDonald for his continuing excellent support<br />
in the <strong>JTWC</strong> graphics department.
EXECUTIVE SUMMARY<br />
The Joint Typhoon Warning Center,<br />
Guam (<strong>JTWC</strong>) experienced an extremely busy<br />
year during 1991, both in terms of the number<br />
of tropical cyclone warnings issued and in terms<br />
of collateral contingency support. <strong>JTWC</strong><br />
warnings were critical to the safe deployment of<br />
ships and aircraft involved in operations<br />
DESERT STORM and DESERT SHIELD, and<br />
to the safe and successful employment of ships<br />
and aircraft supporting operations SEA ANGEL<br />
(Bangladesh relief) and FIERY VIGIL<br />
(Philippine evacuation due to the Mount<br />
Pinatubo eruption).<br />
In 1990, <strong>JTWC</strong> set a record for<br />
workload by issuing 1139 warnings during the<br />
year. That record was short-lived as the Center<br />
prepared 1155 warnings in 1991. During the<br />
year, the western North Pacific experienced 32<br />
tropical cyclones — 5 super typhoons, 15 less<br />
intense typhoons, 10 tropical storms and 2<br />
tropical depressions — which resulted in 835<br />
warnings, not including amendments. North<br />
Indian Ocean totals were 56 warnings on 4<br />
tropical cyclones including a rare super cyclone<br />
(02B), that killed over 138,000 people in<br />
Bangladesh. In the Southern Hemisphere, the<br />
Center issued 265 warnings on 22 cyclones.<br />
<strong>JTWC</strong> was in warning status a total of 254<br />
days. One-hundred-ten of those days had at<br />
least two storms, 20 days at least 3 storms at the<br />
same time, and 4 days had 4 storms occurring<br />
simultaneously.<br />
<strong>JTWC</strong>’S track forecast perfomxmce for<br />
the western North Pacific during 1991 was the<br />
best in its 32-year history. Errors were 96 nm at<br />
24 hours, 185 nm at 48 hours, and 287 nm at 72<br />
hours. This represents an improvement of 20,<br />
23, and 20 percent over the long term average<br />
errors of 120 nm, 240 nm, and 360 nm. When<br />
compared to the climatology-persistence model,<br />
CLIPER, <strong>JTWC</strong> forecasts were 20 percent<br />
better across the board. Over 55 percent of the<br />
tropical cyclones recurved, making 1991 a<br />
relatively difficult forecast year. While <strong>JTWC</strong>’s<br />
cross track (directional accuracy) was<br />
outstanding, improvement is still needed in<br />
forecasting along-track (speed) errors. In the<br />
Southern Hemisphere, forecast errors were the<br />
lowest in its 1l-year history, 115 nm at 24 hours<br />
and 220 nm at 48 hours. This is 17 percent<br />
below normal.<br />
As in the previous two years, <strong>JTWC</strong><br />
forecasters out-performed every forecast aid at<br />
every forecast period. Routine boguses of<br />
tropical cyclone location, intensity, and wind<br />
distribution (size) provided to the the Fleet<br />
Oceanography Center at 6-hour intervals have<br />
significantly improved the performance of the<br />
Navy Operational Global Atmospheric<br />
Prediction System (NOGAPS), especially in the<br />
tropics. As a result, the One-Way (interactive)<br />
Tropical Cyclone Model (OTCM) performed<br />
well.<br />
Intensity forecast errors for western<br />
North Pacific tropical cyclones were 10 percent<br />
better than average at 24 and 48 hours, and<br />
average at 72 hours. These values were below<br />
the 1990 improvements of 22, 19 and 15<br />
percent for the respective periods. In-house<br />
techniques developed during 1989 and 1990 to<br />
improve intensity forecasts worked well,<br />
however the large turnover of experienced<br />
personnel and an above average number of<br />
midget typhoons proved to be a challenge.<br />
Once again, <strong>JTWC</strong> has seen many<br />
changes over the past year. Perhaps one of the<br />
most significant was the operational acceptance<br />
by Detachment 1, 633 0SS on 1 April of the<br />
Meteorological Imagery, Data Display, and<br />
Analysis System (MIDDAS) which continues to<br />
improve satellite reconnaissance support to<br />
JTwc.<br />
iv
TABLE OF CONTENTS<br />
121iiIi<br />
...<br />
FOREWORD . . . . . . . . . . . . . . . . . . . . . . . . . . . . . . . . . . . . . . . . . . . . . . . . . . . . Ill<br />
EXECUTIVE SUMMARY . . . . . . . . . . . . . . . . . . . . . . . . . . . . . . . . . . . . . . . . . iv<br />
1.<br />
2.<br />
3.<br />
OPEW~ONWPRO~D~S . . . . . . . . . . . . . . . . . . . . . . . . . . . . . . . . . ..l<br />
1.1 General . . . . . . . . . . . . . . . . . . . . . . . . . . . . . . . . . . . . . . . . . . . ...1<br />
1.2 DataSources . . . . . . . . . . . . . . . . . . . . . . . . . . . . . . . . . . . . . . . . . . 1<br />
1.3<br />
1.4<br />
1.5<br />
1.6<br />
1.7<br />
Communications . . . . . . . . . . . . . . . . . . . . . . . . . . . . . . . . . . . . . . . 2<br />
DataDisplays . . . . . . . . . . . . . . . . . . . . . . . . . . . . . . . . . . . . . . . ...4<br />
Analyses . . . . . . . . . . . . . . . . . . . . . . . . . . . . . . . . . . . . . . . . . . . ..s<br />
Forecast Procedures . . . . . . . . . . . . . . . . . . . . . . . . . . . . . . . . . . . . .5<br />
Warnings . . . . . . . . . . . . . . . . . . . . . . . . . . . . . . . . . . . . . . . . . . ...8<br />
1.8 Prognostic ReasoningMessages. . . . . . . . . . . . . . . . . . . . . . . ...9<br />
1.9 Tropical Cyclone Formation Alerts. . . . . . . . . . . . . . . . . . . . . . ...9<br />
1.10 SignificantTropical <strong>Weather</strong>Advisories. . . . . . . . . . . . . . . . . . ...9<br />
RECONNAISSANCE AND FIXES . . . . . . . . . . . . . . . . . . . . . . . . . . . . . ...11<br />
2.1 General . . . . . . . . . . . . . . . . . . . . . . . . . . . . . . . . . . . . . . . . . . ...11<br />
2.2 ReconnaissanceAvailability.... . . . . . . . . . . . . . . . . . . . . . ...11<br />
2.3 Satellite Reconnaissance Summary . . . . . . . . . . . . . . . . . . . . . . . 11<br />
2.4 RadarReconnaissance Suxnxnary. . . . . . . . . . . . . . . . . . . . . . ...16<br />
2.5 Tropical CycloneFixData . . . . . . . . . . . . . . . . . . . . . . . . . . . ...16<br />
SUMMARY OF NORTHWEST PACIFIC AND<br />
NORTH INDIAN OCEAN TROPICAL Cyclones . . . . . . . . . . . . . . . . . . 19<br />
3.1 General . . . . . . . . . . . . . . . . . . . . . . . . . . . . . . . . . . . . . . . . . . ...19<br />
3.2 Western North Pacific TropicalCyclones . . . . . . . . . . . . . . . . ...24<br />
INDIVIDUAL TROPICAL CYCLONES<br />
TRoCAL CYC LONE M TROPICALCYCLONE PAGIj<br />
(Ol;TSSHARON . . . . . . . ...36<br />
(16W)TSHARRY. . . . . . . . . ..9O<br />
(02W)TYTIM. . . . . . . . . . . ...38 (17W)TYIVẎ. . . . . . . . . . . . . 92<br />
(03W)TSVANESSA. . . . . . ...42 (18W)TSJOEL. . . . . . . . . . . . . %<br />
(04W)STYWALṪ. . . . . . . . ...44 (19W)TYKINNA. . . . . . . . ...98<br />
(W$W)T YUNYA. . . . . . . . ...48<br />
(20W)TSLUKE. . . . . . . . . . ..1O2<br />
(06W)TYZEKE. . . . . . . . . . ...54 (21W)STYMIREILLE.. . . ...108<br />
(07W)TYAMY...58. . . . . . ...58 (22W)TYNAT. . . . . . . . . . ...112<br />
(08W)TYBRENDAN. . . . . ...62 (23W)TYORCHID. . . . . . . . . 116<br />
(09w)TY cAITLIN. . . . . . . ...66<br />
(24W)TYPAṪ. . . . . . . . . . . ..12O<br />
(06E)TS ENRIQUE. . . . . . . . ..7O (25W)STYRUTH. . . . . . . ...124<br />
(lOW)TSDOUG. . . . . . . . . . ...72<br />
(26W)STYSETH. . . . . . . . . ..I2II<br />
(llW)TYELLIE. . . . . . . . . ...74 (27W)TSTHELMA. . . . . . ...132<br />
(12W)TYFRED.., . . . . . . . ...78 (28W)TSVERNE. . . . . . . . ...136<br />
(13W)TD13W,. . . . . . . . . . ...82 (29W)TSWILDA. . . . . . . . ...138<br />
(14W)TYGLADYS. . . . . . . ...84<br />
(30W)STYYURI. . . . . . . . . ..14O<br />
(15W)TD15W. . . . . . . . . . . ...88 (31W)TYZELDA. . . . . . . . ...146<br />
v
PAGE<br />
3.3 North Indian Ocean Tkopical Cyclones . . . . . . . . . . . . . . . . . ...150<br />
INDIVIDUAL TROPICAL CYCLONES<br />
TROPICALCYCJ.ONE<br />
Pm<br />
TCOIA. . . . . . . . . . . . . . . . ...152<br />
TC02B . . . . . . . . . . . . . . . . ...154<br />
TC03B . . . . . . . . . . . . . . . . ...158<br />
TC04B . . . . . . . . . . . . . . . . . ..16O<br />
4. SUMMARY OF SOUTH PACIFIC AND SOUTH INDIAN OCEAN<br />
~OPICAL CYCLO~S . . . . . . . . . . . . . . . . . . . . . . . . . . . . . . . . . . . . . . . 163<br />
4.1 General . . . . . . . . . . . . . . . . . . . . . . . . . . . . . . . . . . . . . . . . . . . . 163<br />
4.2 South Pacflcand SouthIndianOcean TmpicalCyclones . . . . 163<br />
5. SUMMARY OF FORECAST VERIFICA~ON . . . . . . . . . . . . . . . . . . . . ..l69<br />
5.1 Annual Forecast Verification . . . . . . . . . . . . . . . . . . . . . . . . . . . 169<br />
5.2 Comparison of Objective Techniques . . . . . . . . . . . . . . . . . . . . 184<br />
5.3 Testing and Results . . . . . . . . . . . . . . . . . . . . . . . . . . . . . . . . . . 186<br />
6. TROPICAL CYCLONE WARNING VERIFICATION STATISTICS... .. 191<br />
7. TROPICAL CYCLONE SUPPORT SUMMARY . . . . . . . . . . . . . . . . . ...221<br />
BIBLIOGRAPHY . . . . . . . . . . . . . . . . . . . . . . . . . . . . . . . . . . . . . . . . . . . . . . . .228<br />
APPENDIX A -Definitions . . . . . . . . . . . . . . . . . . . . . . . . . . . . . . . . . . . . . . . . 230<br />
APPENDIX B- Names for Tropical Cyclones. . . . . . . . . . . . . . . . . . . . . . . ...232<br />
APPENDIX C - Contractions. . . . . . . . . . . . . . . . . . . . . . . . . . . . . . . . . . . . . . . 233<br />
APPENDIX D - Past Annual Tropical Cyclone <strong>Report</strong>s. . . . . . . . . . . . . . . . ...236<br />
APPENDIX E - Distribution List. . . . . . . . . . . . . . . . . . . . . . . . . . . . . . . . . . . . 237<br />
vi
1.OPERATIONAL<br />
PROCEDURES<br />
1.1 GENERAL<br />
The Joint Typhoon Warning Center<br />
(<strong>JTWC</strong>) provides a variety of routine products<br />
and services to the organizations within its area<br />
of responsibility (AOR), including:<br />
1.1.1 SIGNIFICANT TROPICAL WEA~-<br />
ER ADVISORIES — Issued daily or as<br />
needed, to describe all tropical disturbances and<br />
their potential for further development during<br />
the advisory period.<br />
1.1.2 TROPICAL CYCLONE FORMATION<br />
ALERTS — Issued when synoptic or satellite<br />
data indicate the development of a tropical<br />
cyclone is likely within 24 hours in a specified<br />
area.<br />
1.1.3 TROPICAL CYCLONE/ TROPICAL<br />
DEPRESSION WARNINGS — Issued<br />
periodically throughout each day to provide<br />
forecasts of position, intensity, and wind<br />
distribution for tropical cyclones in <strong>JTWC</strong>’S<br />
AOR.<br />
1.1.4 PROGNOSTIC REASONING MES-<br />
SAGES — Issued with warnings for tropical<br />
depressions, tropical storms, typhoons and super<br />
typhoons in the western North Pacific to discuss<br />
the rationale for the content of <strong>JTWC</strong>’S<br />
warnings.<br />
1.1.5 PRODUCT CHANGES — The<br />
contents and availability of the above <strong>JTWC</strong><br />
products are set forth in USCINCPACINST<br />
3140.lU. Changes to USCINCPACINST<br />
3140. lU and <strong>JTWC</strong> products and services are<br />
proposed and discussed at the Annual Tropical<br />
Cyclone Conference.<br />
1.2 DATA SOURCES<br />
1.2.1 COMPUTER PRODUCTS —<br />
Numerical and statistical guidance are available<br />
from the USN Fleet Numerical Oceanography<br />
Center (FNOC) at Monterey, California. These<br />
products along with selected ones from the<br />
National Meteorological Center (NMC) are<br />
received through the Naval Environmental Data<br />
Network (NEDN), the Naval Environmental<br />
Satellite Network (NESN), and by<br />
microcomputer dial-up connections using<br />
military and commercial telephone lines.<br />
Numerical guidance is also received from Air<br />
Force Global <strong>Weather</strong> Center (AFGWC) at<br />
Omaha, Nebraska via the Pacific Digital<br />
Information Graphics System (PACDIGS), and<br />
horn indigenous sources within our AOR<br />
1.2.2 CONVENTIONAL DATA — These data<br />
sets are comprised of land and shipboard<br />
surface observations, and enroute<br />
meteorological observations from commercial<br />
and military aircraft (AIR.EPS) recorded within<br />
six hours of synoptic times, and cloud-motion<br />
winds derived from satellite data. The<br />
conventional data is hand- and computerplotted,<br />
and hand-analyzed in the tropics for the<br />
surface/gradient and 200-mb levels. These<br />
analyses are prepared twice daily from 0000Z<br />
and 1200Z synoptic data. Also, FNOC supplies<br />
<strong>JTWC</strong> with computer generated analyses and<br />
prognoses, from 0000Z and 1200Z synoptic<br />
data, at the surface, 850-mb, 700-mb, 500-mb,<br />
400-mb, and 200-mb levels, and deep-layermean<br />
winds.<br />
1.2.3 SATELLITE RECONNAISSANCE —<br />
Meteorological satellite imagery recorded at<br />
USAF/USN ground sites and USN ships supply<br />
day and night coverage in <strong>JTWC</strong>’S area of<br />
responsibility. Interpretation of these satellite
data provides tropical cyclone positions and<br />
estimates of current and forecast intensities<br />
(Dvorak, 1984). The USAF tactical satellite<br />
sites and Air Force Global <strong>Weather</strong> Central<br />
currently receive and analyze special sensor<br />
microwave/imager (S SM/I) data to provide<br />
estimates of 30-kt (15 m/see) wind radii near<br />
tropical cyclones. Use of satellite reconnaissance<br />
is discussed further in section 2.3,<br />
Satellite Reconnaissance Summary.<br />
1.2.4 RADAR RECONNAISSANCE —<br />
Land-based radar observations are used to<br />
position tropical cyclones. Once a well-defiied<br />
tropical cyclone moves within the range of<br />
land-based radar sites, radar reports are<br />
invaluable for determination of position and<br />
movement. Use of radar reports during 1991 is<br />
discussed in section 2.4, Radar Reconnaissance<br />
summary.<br />
1.2.5 AIRCRAFT RECONNAISSANCE —<br />
One radar fix was logged for Super Typhoon<br />
Walt (04W). In support of the NASA Global<br />
Tropospheric Experiment, Pacific Exploratory<br />
Measurements -West (GTE/PEM-West), a<br />
NASA DC-8 aircraft provided an airborne radar<br />
fix of Super Typhoon Mireille (21W).<br />
1.2.6 DRIFTING METEOROLOGICAL<br />
BUOYS — In 1989, the Commander, Naval<br />
Oceanography Command put the<br />
NAVOCEANCOM Integrated Drifting Buoy<br />
Plan (1989-1994) “into action to meet<br />
CINCPACFLT requirements that included<br />
tropical cyclone warning support. In 1991, 16<br />
mini-drifting buoys were deployed during the<br />
peak period of the WESTPAC tropical cyclone<br />
season. P-3 aircraft from Kadena deployed 12<br />
while P-3s assigned to Cubi Point and the Naval<br />
Oceanographic Office deployed the remaining<br />
4.<br />
The buoys transmit data to NOAA’s<br />
TIROS-N polar orbiting satellites, which in turn<br />
both store and immediately retransmit the data.<br />
2<br />
If the satellite retransmission can be received on<br />
Guam, <strong>JTWC</strong> acquires the mini-drifting buoy<br />
data directly through its Local User Terminal<br />
(LUT), and enters the processed buoy data into<br />
the AWN under the header SSVE 01 PGTW.<br />
Additionally, the stored data aboard the<br />
satellites are later recovered via Service<br />
ARGOS, processed, and then distributed to<br />
operational centers worldwide over the GTS.<br />
The National Meteorological Center (NMC) at<br />
Suitland, Maryland collects these data from the<br />
GTS and enters it into the AWN.<br />
1.2.7 AUTOMATED METEOROLOGICAL<br />
OBSERVING STATIONS (AMOS) —<br />
Through a cooperative effort between the Naval<br />
Oceanography Command, the Department of<br />
the Interior, and NOAA (NWS) to increase data<br />
available for tropical analysis and forecasting, a<br />
network of 20 AMOS stations is being installed<br />
in the Micronesia Islands. (Previous to this<br />
effort, two sites were installed in the Northern<br />
Mariana Islands at Saipan and Rota through a<br />
joint venture between the Navy and NOAA/<br />
NWS.) <strong>JTWC</strong> receives data from all AMOS<br />
sites via the AWN under the KWBC bulletin<br />
headers SMPWO1, SIPWO1 and SNPWO1<br />
(SXMY1O for Saipan and Rota). In September<br />
of 1991, the capability to transmit data via<br />
System ARGOS and NOAA polar orbiting<br />
satellites became available for new AMOS<br />
sites, as a backup to regular data transmission<br />
via GOES-West. ARGOS upgrades to older<br />
existing sites are also being accomplished as the<br />
opportunity arises. An AMOS summary<br />
appears in Table 1-1.<br />
1.3 COMMUNICATIONS<br />
Primary communications support is<br />
provided by the Naval Telecommunications<br />
Center (NTCC), Nimitz Hill, a component of<br />
the Naval Computers and Telecommunications<br />
Area Master Station, Western Pacific<br />
(NCTAMS WESTPAC). <strong>JTWC</strong> uses several
communications systems.<br />
1.3.1 AUTOMATED DIGITAL NETWORK<br />
(AUTODIN) — AUTODIN is used for<br />
dissemination of warnings, alerts and other<br />
related bulletins to Department of Defense<br />
(DOD) and other US Government installations.<br />
These messages are relayed for further<br />
transmission over Navy Fleet Broadcasts, and<br />
Coast Gutid continuous wave Morse code and<br />
voice broadcasts. AUTODIN messages can be<br />
relayed to commercial telecommunications for<br />
delivery to non-DOD users. Inbound message<br />
traffic for <strong>JTWC</strong> is received via AUTODIN<br />
addressed to NAVOCEANCOMCEN<br />
GQ//<strong>JTWC</strong>// or DET 1 6330SS NTMITZHILL<br />
GQ//CC//.<br />
1.3.2 AUTOMATED WEATHER NET-<br />
WORK (AWN) — The AWN provides weather<br />
data over the Pacific Meteorological Data<br />
System (PACMEDS). The PACMEDS,<br />
operational at <strong>JTWC</strong> since April 1988, allows<br />
Pacific-Theater agencies to receive weather<br />
information at 1200 baud. <strong>JTWC</strong> uses a<br />
software package called AWNCOM/WINDS on<br />
a microcomputer to send and receive data via<br />
the PACMEDS. This system will eventually<br />
provide effective storage and manipulation of<br />
the large volume of meteorological reports<br />
available from throughout <strong>JTWC</strong>’S vast AOR.<br />
Through the AWN, <strong>JTWC</strong> has access to data<br />
available on the Global Telecommunications<br />
System (GTS). <strong>JTWC</strong>’S AWN station identifier<br />
is PGTW.<br />
1.3.3 DEFENSE SWITCHED NETWORK<br />
(DSN) – DSN, formerly AUTOVON, is a<br />
world-wide general purpose switched<br />
telecommunications network for the DOD. The<br />
network provides a rapid and vital voice link for<br />
<strong>JTWC</strong> to communicate tropical cyclone<br />
information to DOD installations. The DSN<br />
telephone numbers for <strong>JTWC</strong> are 344-4224 or<br />
321-2345.<br />
1.3.4 NAVAL ENVIRONMENTAL DATA<br />
NETWORK (NEDN) — The NEDN is the<br />
primary link to FNOC to obtain computer<br />
generated analyses and prognoses. It is also a<br />
backup communication line for requesting and<br />
receiving the objective tropical cyclone forecast<br />
aids from FNOC’S mainfkame computers. The<br />
Table 1-1.<br />
AUTOMATIC WEATHER OBSERVING STATIONS SUMMARY<br />
Site L9@.kn Calk&n IIMm SM!an -<br />
Saipan (15.2°N,145.7”E) 15D151D2 ..... HANDAR ARc 1986<br />
Rota (14.2”N,145.2”E) 15D16448 ----- HAN-DAR ARc 1987<br />
Faraulep* ( 8.6”N,144.6”E) FARP2 52005 AMos C-MAN/ARGOS1988<br />
Ujae ( 8.9”N,165.8°E) UJAP2 91365 AMos c-MAN 1989<br />
Enewetak (11.4”N,162.3”E) ENIP2 91251 AMos c-MAN 1989S<br />
Pagan (18.1°N,145.8°E) PAGP2 91222 AMos c-MAN 1990<br />
Kosrae ( 5.3”N,163.O”E) KOSP2 91356 AMos c-MAN 1990$<br />
Mili ( 6.l”N, 171.8°E) MILP2 91377 AMos c-MAN 1990<br />
Oroluk ( 7.6”N,155.l”E) 0RKP2 91343 AMos c-MAN 1991<br />
Pingelap ( 6.3”N,160.7”E) PIGP2 91353 AMos c-MAN 1991<br />
* Prototypesite,whichwasdestroyed2$November1990duringSTYOwen,willnotbereestablished.<br />
s Siteswereupgradedin 1991.<br />
ARc = AutomatedRemoteCollectionsystem(viaGOESWest)<br />
ARGOS= SystemARGOSdatacollection(viaNOAA’sTIROS-Nspawzraft)<br />
c-MAN= Coastal-MarineAutomatedNetwork(viaGOESWest)<br />
3
NEDN allows <strong>JTWC</strong> to communicate directly<br />
to the other Naval Oceanography Command<br />
Centers around the world.<br />
1.3.5 PUBLIC DATA NETWORK (PDN) —<br />
A commercial packet switching network that<br />
provides low-speed interactive transmission to<br />
users of FNOC products. The PDN is now the<br />
primary method for <strong>JTWC</strong> to request and<br />
receive FNOC produced objective tropical<br />
cyclone forecast aids. The PDN allows direct<br />
access of FNOC products via the Automated<br />
Tropical Cyclone Forecast (ATCF) system. The<br />
PDN also serves as an alternate method of<br />
obtaining FNOC analyses and forecast fields.<br />
TYMNET is the contractor providing PDN<br />
services to FNOC.<br />
1.3.6 DEFENSE DATA NETWORK (DDN)<br />
— The DDN is a DOD computer communications<br />
network utilized to exchange data files.<br />
Because the DDN has links, or gateways, to<br />
non-military information networks, it is<br />
frequently used to exchange data with the<br />
research community, <strong>JTWC</strong>’S intemet address is<br />
26.19.0.250 and E-Mail account is<br />
jtops@NOCC.NAVY. MIL. The Det 1, 633<br />
0SS address is <strong>JTWC</strong>GUAM@KADENA-<br />
EMH.AF.MIL.<br />
1.3.7 TELEPHONE FACSIMILE —<br />
TELEFAX provides the capability to rapidly<br />
scan and transmit, or receive, documents over<br />
commercial telephone lines or DSN.<br />
TELEFAX is used to disseminate tropical<br />
cyclone advisories and warnings to key<br />
agencies on Guam and, in special situations, the<br />
other Micronesia Islands. Inbound documents<br />
for <strong>JTWC</strong> are received via commercial<br />
telephone at (671) 477-6186. If inbound<br />
through DSN, the Guam DSN operator 322-<br />
1110 can transfer the call to the-commercial<br />
number 477-6186.<br />
4<br />
1.3.8 NAVAL ENVIRONMENTAL SATEL-<br />
LITE NETWORK (NESN) — The NESN’S<br />
primary function is to pass satellite data from<br />
the satellite global data base at FNOC to<br />
regional centers. Similarly, it can pass satellite<br />
data from NOCC/<strong>JTWC</strong> to FNOC or other<br />
regional centers. It also provides a limited<br />
back-up for the NEDN.<br />
1.3.9 AIRFIELD FIXED TELECOMMUN-<br />
ICATIONS NETWORK (AFTN) — AFTN<br />
was installed at <strong>JTWC</strong> in January 1990.<br />
Though it is primarily for the exchange of<br />
aviation information, weather information and<br />
warnings are also distributed via this network.<br />
It also provides point-to-point communication<br />
with other warning agencies. <strong>JTWC</strong>’S AFI’N<br />
identifier is PGUMYMYT.<br />
1.3.10 LOCAL USER TERMINAL (LUT) —<br />
<strong>JTWC</strong> uses a LUT, provided by the Naval<br />
Oceanographic Office, as the prirnmy means of<br />
receiving real-time data from drifting<br />
meteorological buoys and ARGOS-equipped<br />
AMOS via the polar orbiting NOAA satellites.<br />
1.3.11 COMPUTER FACSIMILE — The<br />
<strong>JTWC</strong> Rapid Response Team (RRT) uses a<br />
microcomputer to transmit facsimile messages<br />
to agencies on Guam and the Northern Marianas<br />
when a typhoon threatens the Mariana Islands.<br />
The RRT can be reached at (671)-344-7116 or<br />
(671)-344-71 19.<br />
1.3.12 TELEX — The address for inbound<br />
TELEX messages is 197873NOCC GQ.<br />
1.4 DATA DISPLAYS<br />
1.4.1 NAVAL ENVIRONMENTAL DIS-<br />
PLAY STATION (NEDS) — The NEDS<br />
receives, processes, stores, displays and prints<br />
copies of FNOC environmental products. It<br />
drives the fleet facsimile broadcast and can also<br />
be used to generate the requests for objective
tropical cyclone forecast techniques.<br />
1.4.2 AUTOMATED TROPICAL CYCLONE<br />
FORECAST SYSTEM (ATCF) — The ATCF<br />
cuts message preparation time and reduces the<br />
number of corrections to <strong>JTWC</strong>’s alerts and<br />
warnings. The ATCF automatically computes<br />
the myriad of statistics calculated by <strong>JTWC</strong>.<br />
Links have been established through a Local<br />
Area Network (LAN) to the NOCC Operations<br />
watch team to facilitate the generation of<br />
tropical cyclone warning graphics for the fleet<br />
facsimile broadcasts and for NOCC’S local<br />
metwatch program and warning products for<br />
Micronesia. A module permits satellite<br />
reconnaissance fixes to be input from Det 1,633<br />
0SS into the LAN. Several other modules are<br />
still under development including: direct links<br />
to NTCC, the LUT, and AWNCOMAWNDS.<br />
1.4.3 PACIFIC DIGITAL INFORMATION<br />
GRAPHICS SYSTEM (PACDIGS) — The<br />
PACDIGS is a communications circuit that was<br />
expanded to include <strong>JTWC</strong> in 1988. Air Force<br />
Global <strong>Weather</strong> Central (AFGWC) at Omaha,<br />
Nebraska provides a standard set of numerical<br />
products to the PACDIGS circuit which can be<br />
used for additional evaluation in the<br />
development of tropical cyclone warnings.<br />
1.4.4 NAVAL SATELLITE DISPLAY<br />
SYSTEM (NSDS) — The NSDS functions as a<br />
display of FNOC stored Defense<br />
Meteorological Satellite Program (DMSP)<br />
imagery and low resolution geostationary<br />
imagery. It is the primary means for <strong>JTWC</strong> to<br />
observe areas of cloudiness in the western<br />
Indian Ocean.<br />
1.4.5 NAVAL SATELLITE DISPLAY<br />
SYSTEM-GEOSTATIONARY(NSDS-G) —<br />
The NSDS-G is the backup system used to<br />
process high resolution geostationary imagery<br />
for tropical cyclone positions and intensity<br />
estimates for the western Pacific Ocean. Its<br />
5<br />
built-in sectorizer allows scale expansion and<br />
downloading of electronic files to evaluate the<br />
data effectively, and monitor several cyclones or<br />
suspect areas at once.<br />
15 ANALYSES<br />
The <strong>JTWC</strong> Typhoon Duty Officer<br />
(TDO) routinely performs manual streamline<br />
analyses of composite surface/gradient-level<br />
(3000 ft (914 m)) and upper-tropospheric<br />
(centered on the 200-mb level) data for 0000Z<br />
and 1200Z each day. Manual sea-level pressure<br />
analyses concentrating on the mid-latitudes are<br />
available from the NOCC Operations watch<br />
team. Computer analyses of the surface, 925-,<br />
850-, 700-, 500-, 400-, and 200-mb levels,<br />
deep-layer-mean winds, and frontal boundaries<br />
depiction are available from the 00002 and<br />
1200Z FNOC data bases. Additional sectional<br />
charts at intermediate synoptic times and<br />
auxiliary charts, such as station-time plot<br />
diagrams and pressure-change charts, are<br />
analyzed during periods of significant tropical<br />
cyclone activity.<br />
1.6 FORECAST PROCEDURES<br />
1.6.1 INITIAL POSITIONING — The<br />
warning position is the best estimate of the<br />
center of the surface circulation at synoptic<br />
time. It is estimated from an analysis of all fix<br />
information received from one hour before to<br />
one and one-half hours after that synoptic time.<br />
The analysis is aided by a computer-generated<br />
objective best track scheme that weights fix<br />
information based on its statistical accuracy.<br />
The TDO includes synoptic observations and<br />
other information to adjust the position, testing<br />
consistency with the past direction, speed of<br />
movement and the influence of the different<br />
scales of motions. If the fix data are not<br />
available due to reconnaissance platform<br />
malfunction or communication problems, or are<br />
considered unrepresentative, synoptic data
and/or extrapolation from previous fixes are<br />
used.<br />
1.6.2 TRACK FORECASTING — In<br />
preparing the <strong>JTWC</strong> official forecast, the TDO<br />
evaluates a wide variety of information, and<br />
employs a number of objective and subjective<br />
techniques. Because tropical cyclone track<br />
forecasting has and continues to require a<br />
significant amount of subjective input horn the<br />
TDO, detailed aspects of the forecastdevelopment<br />
process will vary somewhat from<br />
TDO to TDO, particularly with respect to the<br />
weight given to any of the available guidance.<br />
However, throughout 1990, <strong>JTWC</strong> has<br />
developed a standardized, three phase tropical<br />
cyclone motion forecasting process to improve<br />
not only track forecast accuracy, but also<br />
intensity forecast accuracy and forecast-toforecast<br />
consistency.<br />
1.6.2.1 Field Analysis Phase — Navy<br />
Operational Global Atmospheric Prediction<br />
System (NOGAPS) analyses and prognoses at<br />
various levels are evaluated for position,<br />
development, and movement of not only the<br />
tropical cyclone, but also relevant synoptic<br />
features such as: 1) subtropical ridge<br />
circulations 2) mid-latitude short/long-wave<br />
troughs and associated weaknesses in the<br />
subtropical ridge, 3) monsoon surges, 4)<br />
influences of cyclonic cells in the Tropical<br />
Upper Tropospheric Trough (TUTT), and 5)<br />
other tropical cyclones. This process permits the<br />
TDO to develop an initial impression of the<br />
environmental steering influences to which the<br />
tropical cyclone is and will be subjected to as<br />
depicted by NOGAPS. The NOGAPS analyses<br />
are then compared to the hand-plotted and<br />
analyzed charts prepared by the TDO and to the<br />
latest satellite imagery in order to determine<br />
how well the NoGAPS-initialization process<br />
has conformed to the available synoptic data,<br />
and how well the resultant analysis fields agree<br />
with the synoptic situation inferred from the<br />
imagery. Finally, the TDO compares both the<br />
computer and hand-analyzed charts to monthly<br />
climatology in order to make a preliminary<br />
determination of to what degree the tropical<br />
cyclone is and will continue to be (according to<br />
NOGAPS) subjected to a climatological or<br />
nonclimatological synoptic environment.<br />
Noting latitudinal and longitudinal<br />
displacements of subtropical ridge and longwave<br />
midlatitude features is of particular<br />
importance, and will partially determine the<br />
relative weights given to climatologically or<br />
dynamically-based objective forecast guidance.<br />
1.6.2.2 Objective Techniques Analysis Phase<br />
— After displaying the latest set of forecasts<br />
given by <strong>JTWC</strong>’S suite of objective techniques,<br />
the TDO then evaluates the pattern produced by<br />
the set of forecasts according to the following<br />
principles. First, the degree to which the current<br />
situation is considered to be and will continue to<br />
be climatological is further refined by<br />
comparing the forecasts of the climatologybased<br />
objective techniques, dynamically-based<br />
techniques, and past motion of the present<br />
storm. This assessment partially determines the<br />
relative weighting given the different classes of<br />
objective techniques. Second, the spread of the<br />
pattern determined by the set of objective<br />
forecasts is used to provide a measure of the<br />
predictability of subsequent motion, and the<br />
advisability of including a low or moderate<br />
probability alternate forecast scenario in the<br />
prognostic reasoning message or warning<br />
(outside the western North Pacific). The spread<br />
of the objective techniques pattern is typically<br />
small well-before or well-after recurvature<br />
(providing high forecast confidence) and large<br />
near recurvature or during a quasi-stationary or<br />
erratic movement phase (increasing the<br />
likelihood of alternate scenarios).<br />
1.6.2.3 Construct Forecast Phase — The TDO<br />
then constructs the <strong>JTWC</strong> official forecast<br />
giving due consideration to the: 1) extent to
which the synoptic situation is and is expected<br />
to remain climatological, 2) past statistical<br />
performance of the various objective techniques<br />
on the current storm, and 3) known properties of<br />
individual objective techniques given the<br />
present synoptic situation. The following<br />
guidance for weighting the objective techniques<br />
is applied:<br />
a) Weight persistence strongly in the fiit<br />
12 to 24 hours of the forecast period.<br />
b) Give significant weight to the last<br />
<strong>JTWC</strong> forecast at all forecast times, unless there<br />
is significant evidence to warrant a departure.<br />
(Also utilize latest forecasts from regional<br />
warning centers, if applicable.)<br />
c) Give more weight to the techniques that<br />
have been performing well on the current<br />
tropical cyclone and/or are expected to perform<br />
well in the current and expected synoptic<br />
situation.<br />
d) Stay within the “envelope” determined<br />
by the spread of objective techniques forecasts<br />
unless there is a specific reason for not doing so<br />
(eg., all objective forecasts start out at a<br />
significant angle relative to past motion of the<br />
current tropical cyclone).<br />
1.6.3 INTENSITY FORECASTING — The<br />
empirically derived Dvorak (1984) technique is<br />
used as a first guess for the intensity forecast.<br />
The TDO then adjusts the forecast after<br />
evaluating climatology and the synoptic<br />
situation. An interactive conditional<br />
climatology scheme allows the TDO to define a<br />
situation similar to the system being forecast in<br />
terms of location, time of year, current intensity,<br />
and intensity trend. Synoptic influences such as<br />
the location of major troughs and ridges, and the<br />
position and intensity of the TUTI’ all play a<br />
large part in intensifying or weakening a<br />
tropical cyclone. <strong>JTWC</strong> incorporates a<br />
checklist into the intensity forecast procedure.<br />
Such criteria as upper-level outflow patterns,<br />
neutral points, sea-surface temperatures,<br />
enhanced monsoonal or cross-equatorial flow,<br />
7<br />
and vertical wind shear are evaluated for their<br />
tendency to enhance or inhibit normal<br />
development, and are incorporated into the<br />
intensity forecast process through locally<br />
developed thumb rules. In addition to<br />
climatology and synoptic influences, the first<br />
guess is modified for interactions with land,<br />
with other tropical cyclones, and with<br />
extratropical features. Digital pixel information<br />
from meteorological satellite data is used to<br />
help assess the potential for development, rapid<br />
intensification, and time of peak intensity.<br />
Climatologica.1 and statistical methods are also<br />
used to assess the potential for rapid<br />
intensification (Mundell, 1990).<br />
1.6.4 WIND-RADII FORECASTING —<br />
After the loss of dedicated aircraft reconnaissance,<br />
<strong>JTWC</strong> began over-estimating the<br />
extent of damaging winds by as much as 100%+<br />
Det 1 Techniques Development incorporated<br />
techniques from various sources, leading to<br />
development of the Martin-Holland wind radii<br />
technique. Wei and Gray, in an unpublished<br />
study, showed that cloud shield size related to<br />
the extent of damaging winds - tropical<br />
cyclones with large cloud shields generally had<br />
damaging winds much further from the center<br />
than tropical cyclones with small cloud shields.<br />
Holland (1980) described an analytic model of<br />
tropical cyclone wind profiles which could<br />
estimate extent of damaging wind. Holland’s<br />
equation uses a logarithmic wind profile outside<br />
the radius of maximum winds. It is based on<br />
size and shape parameters. The size parameter<br />
uses the cloud shield size (based on the size of<br />
the minus 65°C isotherm outside the central<br />
convection) to determine the areal extent of<br />
damaging winds. The model uses the Dvorak<br />
current intensity estimate to determine the shape<br />
parameter. Asymmetry is added based on<br />
projected changes in the system’s motion and<br />
latitude.
1.6.5 EXTRATROPICAL TRANSITION —<br />
When a tropical cyclone is forecast to become<br />
an extratropical system, <strong>JTWC</strong> coordinates the<br />
transfer of warning responsibility with the<br />
appropriate Naval Oceanography Command<br />
Regional Center, which assumes warning<br />
responsibilities for the extratropical system.<br />
1.6.6 TRANSFER OF WARNING<br />
RESPONSIBILITIES — <strong>JTWC</strong> coordinates<br />
the transfer of tropical warning responsibility<br />
for tropical cyclones entering or exiting its<br />
AOR. For tropical cyclones crossing 180° east<br />
longitude in the North Pacific Ocean, <strong>JTWC</strong><br />
coordinates with the Central Pacific Hurricane<br />
Center (CPHC), Honolulu via the Naval<br />
Western Oceanography Center (NWOC), Pearl<br />
Harbor, Hawaii. For the South Pacific Ocean,<br />
<strong>JTWC</strong> coordinates with the NWOC.<br />
In the event <strong>JTWC</strong> should become<br />
incapacitated, the Alternate Joint Typhoon<br />
Warning Center (A<strong>JTWC</strong>), collocated with<br />
NWOC assumes <strong>JTWC</strong>’S functions. Assistance<br />
in determining satellite reconnaissance<br />
requirements, and in obtaining the resultant<br />
data, is provided by the weather unit supporting<br />
the 15th Air Base Wing, Hickam AFB, Hawaii.<br />
1.7 WARNINGS<br />
<strong>JTWC</strong> issues two types of warnings:<br />
Tropical Cyclone Warnings and Tropical<br />
Depression Warnings.<br />
1.7.1 TROPICAL CYCLONE WARNINGS<br />
— These are issued when a closed circulation<br />
is evident and maximum sustained winds are<br />
forecast to reach 34 kt (18 m/see) within 48<br />
hours, or when the tropical cyclone is in such a<br />
position that life or property maybe endangered<br />
within 72 hours.<br />
Each Tropical Cyclone Warning is<br />
numbered sequentially and includes the<br />
following information: the current position of<br />
the surface cente~ an estimate of the position<br />
8<br />
accuracy and the supporting reconnaissance<br />
(fix) platform(s); the direction and speed of<br />
movement during the past six hours (past 12<br />
hours in the Southern Hemisphere); and the<br />
intensity and radial extent of over 30-, 50-, and<br />
100-kt (15-, 26-, and 51 m/see) surface winds,<br />
when applicable. At forecast intervals of 12,<br />
24, 48, and 72 hours (12, 24, and 48 hours in<br />
the Southern Hemisphere), information on the<br />
tropical cyclone’s anticipated position, intensity<br />
and wind radii is provided. Wctors indicating<br />
the mean direction and mean speed between<br />
forecast positions are included in all warnings.<br />
In addition, a 3-hour extrapolated position is<br />
provided in the remarks section.<br />
Warnings in the western North Pacific<br />
and North Indian Oceans are issued every six<br />
hours valid at standard times: 0000Z, 06002,<br />
1200Z and 1800Z (every 12 hours: 0000Z,<br />
1200Z or 0600Z, 1800Z in the Southern<br />
Hemisphere). All warnings are released to the<br />
communications network no earlier than<br />
synoptic time and no later than synoptic time<br />
plus two and one-half hours, so that recipients<br />
are assured of having all warnings in hand by<br />
synoptic time plus three hours (0300z 09002,<br />
1500Z and 2100Z). By area, the warning<br />
bulletin headers are: WTI03 1-35 PGTW for<br />
northern latitudes from 35° to 100° east<br />
longitude, WTPN3 1-36 PGTW for northern<br />
latitudes from 100° to 180° east longitude,<br />
WTXS3 1-36 PGTW for southern latitudes from<br />
35° to 135° east longitude, and WTPS31-35<br />
PGTW for southern latitudes fkom 135° to 180°<br />
east longitude.<br />
1.7.2 TROPICAL DEPRESSION<br />
WARNINGS — These are issued only for<br />
western North Pacific tropical depressions that<br />
are not expected to reach the criteria for<br />
Tropical Cyclone Warnings, as mentioned<br />
above. The depression warning contains the<br />
same information as a Tropical Cyclone<br />
Warning except that the Tropical Depression<br />
Warning is issued every 12 hours at standard
synoptic times and extends only to the 36-hour<br />
forecast period.<br />
Both Tropical Cyclone and Tropical<br />
Depression Warning forecast positions are later<br />
verified against the corresponding best track<br />
positions (obtained during detailed post-storm<br />
analyses) to determine the most probable path<br />
and intensity of the cyclone. A summary of the<br />
verification results for 1991 is presented in<br />
Chapter 5, Summary of Forecast Verification.<br />
1.8 PROGNOSTIC REASONING<br />
MESSAGES<br />
These plain language messages provide<br />
meteorologists with the rationale for the<br />
forecasts for tropical cyclones in the western<br />
North Pacific Ocean. They also discuss<br />
alternate forecast scenarios. Prognostic<br />
reasoning messages (WDPN3 1-36 PGTW) are<br />
prepared to complement tropical cyclone (but<br />
not tropical depression) warnings. In addition<br />
to these messages, prognostic reasoning<br />
information is provided in the remarks section<br />
of warnings when significant forecast changes<br />
are made or when deemed appropriate by the<br />
TDo.<br />
1.9 TROPICAL CYCLONE<br />
FORMATION ALERTS<br />
Tropical Cyclone Formation Alerts are<br />
issued whenever interpretation of satellite<br />
imagery and other meteorological data indicates<br />
that the formation of a significant tropical<br />
cyclone is likely. These alerts will specify a<br />
valid period not to exceed 24 hours and must<br />
either be canceled, reissued, or superseded by a<br />
warning prior to expiration. By area, the alert<br />
bulletin headers are: WTI021-25 PGTW for<br />
northern latitudes from 35° to 100° east<br />
longitude, WTPN21 -26 PGTW for northern<br />
latitudes from 100° to 180° east longitude,<br />
WTXS21-26 PGTW for southern latitudes from<br />
35° to 135° east longitude, and WTPS21-25<br />
PGTW for southern latitudes tim 135° to 180°<br />
east longitude.<br />
1.10 SIGNIFICANT TROPICAL<br />
WEATHER ADVISORIES<br />
This product contains a description of all<br />
tropical disturbances in <strong>JTWC</strong>’S AOR and their<br />
potential for further (tropical cyclone)<br />
development. In addition, all tropical cyclones<br />
in warning status are briefly discussed.<br />
Two separate messages are issued daily,<br />
and each is valid for a 24-hour period. The<br />
Significant Tropical <strong>Weather</strong> Advisory for the<br />
Western Pacific Ocean is issued by 0600Z. The<br />
Significant Tropical <strong>Weather</strong> Advisory for the<br />
Indian Ocean is issued by 1800Z. These are<br />
reissued whenever the situation warrants. For<br />
each suspect area, the words “poor”, “fair”, or<br />
“good” are used to describe the potential for<br />
development. “Poor” will be used to describe a<br />
tropical disturbance in which the meteorological<br />
conditions are currently unfavorable for<br />
development. “Fair” will be used to describe a<br />
tropical disturbance in which the meteorological<br />
conditions are favorable for development, but<br />
significant development has not commenced or<br />
is not expected to occur in the next 24 hours.<br />
“Good” will be used to describe the potential<br />
for development of a disturbance covered by an<br />
alert. By area, the advisory bulletin headers are:<br />
ABPW 10 PGTW for northern latitudes from<br />
100° to 180° east longitude and southern<br />
9
Intentionally left blank.
2. RECONNAISSANCE AND FIXES<br />
2.1 GENERAL<br />
The Joint Typhoon Warning Center<br />
depends on reconnaissance to provide<br />
necessary, accurate, and timely meteorological<br />
information in support of advisories, alerts and<br />
warnings. <strong>JTWC</strong> relies primarily on two<br />
reconnaissance platforms: satellite and radar. In<br />
data rich areas, synoptic data are also used to<br />
supplement the above. As in past years, the<br />
optimal use of all available reconnaissance<br />
resources to support <strong>JTWC</strong>’S products remains a<br />
primary concern. Weighing the specific<br />
capabilities and limitations of each<br />
reconnaissance platform, and the tropical<br />
cyclone’s threat to life and property both afloat<br />
and ashore, continue to be important factors in<br />
careful product preparation.<br />
2.2 RECONNAISSANCE<br />
AVAILABILITY<br />
2.2.1 SATELLITE — Fixes from Air<br />
Force/Navy ground sites and Navy ships<br />
provide day and night coverage in <strong>JTWC</strong>’S area<br />
of responsibility. Interpretation of this satellite<br />
imagery yields tropical cyclone positions and<br />
estimates of current and forecast intensities<br />
through the Dvorak technique. The Special<br />
Sensor Microwave/Imager (S SM/1) data are<br />
used to determine the extent of the 30-kt (15<br />
m/see) winds around the tropical cyclone and to<br />
aid in tropical cyclone positioning.<br />
2.2.2 RADAR — Land-based radar remotely<br />
senses and maps precipitation within tropical<br />
cyclones in the proximity (usually within 175<br />
nm (325 km) of radar sites) of the Philippine<br />
Islands, Taiwan, Hong Kong, China, Japan,<br />
South Korea, Kwajalein, Guam, Thailand,<br />
Australia, and India.<br />
2.2.3 SYNOPTIC — <strong>JTWC</strong> also determines<br />
tropical cyclone positions based on the analysis<br />
of surface/gradient-level synoptic data. These<br />
positions are an important supplement to fixes<br />
provided by remote sensing platforms and<br />
become invaluable in situations where neither<br />
satellite nor radar fixes are available.<br />
2,3 SATELLITE RECONNAISSANCE<br />
SUMMARY<br />
The Air Force provides satellite<br />
reconnaissance support to <strong>JTWC</strong> through the<br />
DMSP Tropical Cyclone <strong>Report</strong>ing Network<br />
(DMSP Network), which consists of tactical<br />
sites and a centralized facility. The personnel of<br />
Det 1,633 0SS (hereafter referred to as Det 1),<br />
collocated with <strong>JTWC</strong> at Nimitz Hill, Guam,<br />
coordinate required tropical cyclone reconnaissance<br />
support with the following units:<br />
15ABW/WE, Hickam AFB, Hawaii<br />
18 OSS/WE, Kadena AB, Okinawa+ Japan<br />
603 ACCS/WE, Osan AB, Republic of Korea<br />
Air Force Global <strong>Weather</strong> Central,<br />
Offutt AFB, Nebraska<br />
Detachment 5, 20 WS, Clark AB,<br />
Republic of the Philippines ceased operations in<br />
late September following the eruption of Mount<br />
Pinatubo and the subsequent closure of Clark<br />
AB. These sites provide a combined coverage<br />
that includes most of the western North Pacific,<br />
from near the international date line westward<br />
to the Malay Peninsula. The Naval<br />
Oceanography Command Detachment, Diego<br />
Garcia, furnishes interpretation of low<br />
resolution NOAA polar orbiting coverage in the<br />
central Indian Ocean, and Navy ships equipped<br />
for direct satellite readout contribute<br />
supplementary support. Also, civilian<br />
contractors with the U.S. Army at Kwajalein<br />
Atoll provide satellite fixes on tropical cyclones<br />
11
in the Marshall Islands to supplement Det I‘s<br />
satellite coverage. Additionally, DMSP low<br />
resolution satellite mosaics are available from<br />
the FNOC via the NEDN and NESN lines.<br />
These mosaics are used to metwatch the areas<br />
not included in the area covered by the DMSP<br />
tactical sites, and provide <strong>JTWC</strong> forecasters<br />
with the capability to “see” what AFGWC’S<br />
satellite image analysts are fixing, albeit,<br />
several hours later.<br />
In addition to polar orbiter imagery, Det<br />
1 uses high resolution geostationary imagery to<br />
support the reconnaissance mission. Animation<br />
of these geostationary images is invaluable for<br />
determining the location of cloud system<br />
centers and their motion, particularly in the<br />
formative stages. Animation is also valuable in<br />
assessing environmental, or ambient, changes<br />
affecting tropical cyclone behavior. Det 1 is<br />
able to receive and process high resolution<br />
digital geostationary data through its<br />
Meteorological Imagery, Data Display and<br />
Analysis System (MIDDAS), and via the<br />
NSDS-G or Navy’s Geostationary Satellite<br />
Receiving System (GSRS). Phase 1 of<br />
MIDDAS, installed in December 1990, consists<br />
of a minicomputer and large screen work station<br />
which provides advanced graphic and<br />
enhancement capabilities for geostationary<br />
data. Phase 2, installed in September 1991,<br />
increased the system to 3 minicomputers and<br />
ingests NOAA High Resolution Picture<br />
Transmission (HRPT) and TIROS Operational<br />
Vertical Sounder (TOVS) data. Software<br />
installed in March 1992 gave MIDDAS the<br />
capability to process DMSP imagery. Thus, Det<br />
1 can daily process imagery from at least four<br />
polar orbiting and one geostationary spacecraft.<br />
AFGWC is the centralized member of<br />
the DMSP network. In support of <strong>JTWC</strong>,<br />
AFGWC processes stored imagery from DMSP<br />
and NOAA spacecraft. Stored imagery is<br />
recorded on board the spacecraft as they orbit<br />
the earth, and is later relayed to AFGWC via a<br />
network of command readout sites and<br />
1’<br />
communication satellites. This enables<br />
AFGWC to obtain the coverage necessary to fix<br />
all tropical cyclones within <strong>JTWC</strong>’S AOR.<br />
AFGWC has the primary responsibility to<br />
provide tropical cyclone reconnaissance over<br />
the entire Indian Ocean, southwest Paciilc, and<br />
the area near 180° east longitude in the western<br />
North Pacific Ocean. As a backup, AFGWC<br />
can be tasked to provide tropical cyclone<br />
reconnaissance support in the western North<br />
Pacific, when DMSP tactical site coverage is<br />
impaired or lost.<br />
The hub of the DMSP network is Det 1.<br />
Based on available satellite coverage, Det 1 is<br />
responsible for coordinating satellite<br />
reconnaissance requirements with <strong>JTWC</strong> and<br />
tasking the individual network sites for the<br />
necessary tropical cyclone fixes, current<br />
intensity estimates, forecast intensities, and<br />
SSM/I surface wind information. When a<br />
particular satellite pass is selected to support the<br />
development of <strong>JTWC</strong>’S next tropical cyclone<br />
warning, two sites are tasked to fix the tropical<br />
cyclone from the same pass. This “dual-site”<br />
concept provides the necessary redundancy that<br />
virtually guarantees <strong>JTWC</strong> a satellite fix to<br />
support each warning. It also supplies<br />
independent assessments of the same data to<br />
provide <strong>JTWC</strong> forecasters a measure of<br />
confidence in the location and intensity<br />
information.<br />
The network provides <strong>JTWC</strong> with<br />
several products and services. The main service<br />
is to monitor the AOR for indications of tropical<br />
cyclone development. If development is<br />
suspected, <strong>JTWC</strong> is notified. Once <strong>JTWC</strong><br />
TAELE 2-1 POSITIC44CCOZ ~ (PCN)<br />
PCN<br />
METHOD POR CENTER DETERMINATION/GRIDDING<br />
1 EYEKFsXRAPHY<br />
2 EYE/EPHEMERIS<br />
3 WELL DEFINED CIRCULATIONCENTER/GECGSWHY<br />
4 WELL DEFINED CIRCULXTIONCENTER/EPHEt4SRIS<br />
5 POORLY DF.FINEDCIRCULATIONCENTER/GEOGRAPHY<br />
6 PCXXLY DEFINED CIRCULATIONCENTER/EPHENERIS
issues either a Tropical Cyclone Formation<br />
Alert or a warning, the network provides three<br />
products: tropical cyclone positions, current<br />
intensity estimates and forecast intensities.<br />
Each satellite-derived tropical cyclone position<br />
is assigned a Position Code Number (PCN),<br />
which is a measure of positioning confidence.<br />
The PCN is determined by a combination of the<br />
availability of visible landmarks in the image<br />
that can be used as references for precise<br />
gridding and the degree of organization of the<br />
tropical cyclone’s cloud system (Table 2-l).<br />
Once the tropical cyclone reaches 50 kt (25<br />
ndsec), information on the distribution of 30-kt<br />
(15-m/see) winds is provided using SSM/I data.<br />
Det 1 provides a minimum of one<br />
estimate of the tropical cyclone’s current<br />
intensity every 6 hours once <strong>JTWC</strong> is in alert or<br />
warning status. Current intensity estimates and<br />
24-hour intensity forecasts are made using the<br />
Dvorak (1975, 1984) technique for both visual<br />
and enhanced infrared imagery (Figure 2-1 ).<br />
The enhanced infrared technique is preferred<br />
due to its increased objectivity and accuracy,<br />
however, the visual technique is used to<br />
supplement this information during the daylight<br />
hours. The standard relationship between<br />
tropical cyclone “T-number”, maximum<br />
sustained surface wind speed and minimum<br />
sea-level pressure (Atkinson and Holliday,<br />
1977) for the Pacific is shown in Table 2-2. For<br />
subtropical cyclones, intensity estimates are<br />
made using the Hebert and Poteat (1975)<br />
technique.<br />
2.3.1 SATELLITE PLATFORM SUMMARY<br />
— Figure 2-2 shows the status of operational<br />
polar orbiting spacecraft. Four DMSP<br />
spacecraft, 19543 (F8), 20542 (F9), 21544<br />
(F1O), and 22546 (F1l) were operational during<br />
1991. The F8’s SSM/I lost its horizontally<br />
polarized 85 gigahertz channel early in the year,<br />
however, the channel started providing limited,<br />
but useful, data again in October. The<br />
spacecraft’s Operational Line Scan (OLS)<br />
sensor failed on 16 August. The F9 was<br />
operational throughout 1991, but lost its OLS<br />
on 21 February 1992. The F1O, although<br />
launched into an elliptical orbit, became<br />
operational 15 January 1991. The platform’s<br />
fluctuating altitudes caused persistent gridding<br />
problems, and it continues to precess about 50<br />
seconds a week, thus it is no longer in a sun<br />
synchronous orbit. Fll was launched 28<br />
November and became operational on 17<br />
Decem&, one of the shortest periods between<br />
launch and operational acceptance in the DMSP<br />
history. Two SSM/I sensors, mounted on the F8<br />
and F1 O DMSP spacecraft, were operational<br />
throughout 1991. A third sensor, recently<br />
J.ANm MAR Am MAYmIJuL Alm=mmv=<br />
NW<br />
9m91Sl)D<br />
D<br />
T J Vs . / HRS<br />
—“— —“— w<br />
———<br />
Exampk ‘r3.514.3+JwLsJzlnts<br />
NMA 10@JM6LWD<br />
NMA 11(14MUT)A<br />
N(MA 12(07311Sl)D<br />
- UWLWj A<br />
H F9@M81.Sr)A<br />
Figure 2-1. Dvorak code for communicating estimates of<br />
current and forecast intensity derived from satellite data. In the<br />
example, the cument “T-number” is 3.5, but the current intensity<br />
is 4.5. The cloud system has weakened by 1.5 *T-numbers”<br />
since the previous evaluation conducted 24-hours earlier. The<br />
plus (+) symbol indicates an expected reversal of the<br />
weakening trend or very little i%rtherweakening of the tropical<br />
cyclone during the next 24-hour period.<br />
13<br />
DkSFIO@lSSISI)D<br />
-Fll@tWLSTj<br />
D<br />
sm.aa ~W<br />
. . . ..hwculx<br />
=ATW4<br />
o -ImNAL<br />
m:wcALsmlnm<br />
A:~<br />
F@re 2-2. Polar orbhers for 1991.
launched on the F11, will expand SSM/I<br />
coverage during 1992. Although the<br />
horizontally polarized 85 gigahertz channel<br />
failed on the F8, the sensor continued to provide<br />
valuable surface wind data, and positioning data<br />
could be derived using the differential of the 37<br />
gigahertz vertically and horizontally polarized<br />
data. With regard to NOAA spacecraf~ NOAA<br />
9 remained in standby, and NOAA 10 and<br />
NOAA 11 were operational throughout 1991.<br />
NOAA 12 was launched 14 May and became<br />
operational on 16 September.<br />
2.3.2 STATISTICAL SUMMARY — During<br />
1991, information from the DMSP network<br />
was the primary input to <strong>JTWC</strong> for operational<br />
warnings and post analysis best tracks in the<br />
entire 53-million square mile area of<br />
responsibility for the warning center. Almost<br />
all the warnings were based on satellite<br />
reconnaissance. <strong>JTWC</strong> received a total of 4746<br />
satellite fixes during the year. Of these, 3139<br />
were for the western North Pacific, 139 for the<br />
North Indian Ocean and 1468 for the Southern<br />
Hemisphere. Of this, 38 percent were from<br />
polar orbiter, and 62 percent were from<br />
geostationary platforms. These totals include<br />
128 fixes in the western North Pacific, 14 in the<br />
North Indian Ocean, and 196 in the Southern<br />
Hemisphere from non-network sources. The<br />
increase in percentage of geostationary fixes<br />
(only 49 percent in 1990) is attributed to the<br />
deactivation of the DMSP site at Clark AB,<br />
significant operational down-time at network<br />
sites, and the expanded capability of the<br />
MIDDAS. During July through November,<br />
significant outage hours for the network sites<br />
rose to 51 percent, compared with 12.3 percent<br />
for the same period in 1990. A comparison of<br />
satellite fixes from all data sources with their<br />
corresponding best track positions is shown in<br />
Table 2-3.<br />
2.3.3 NEW TECHNIQUES — The MIDDAS<br />
system has and will continue to expand Det 1‘s<br />
capabilities to analyze tropical cyclones. In<br />
addition to providing analysts with the<br />
capability to rapidly make or modify satellite<br />
TABIJZ2-2 nNuMrR48umAINED wnlDsPEm(Rr)<br />
AS AE’CWXICWtX’ wcsAK~Am<br />
~~IIY~AND<br />
lmmm4 Slm-mvliz PmssmE 0==)<br />
TROPICAL CYCLONE WIND Mm<br />
0.0
image enhancements, post analysis techniques<br />
are more flexible than previous years.<br />
Animated loops and sectorized images archived<br />
on 4 mm, 1.2 gigabyte Digital Audio Tapes are<br />
rapidly replacing hard copy imagery. When the<br />
data files are reloaded on the system from tape,<br />
they can again be used for detailed analysis.<br />
The Techniques Development section is<br />
working on objective methods to complement<br />
current analyses. Constructing satellite derived<br />
time series of the area of tropical cyclone deep<br />
convection that is colder than a given threshold<br />
temperature allows graphical representation of<br />
convective trends. Interpretation of the trends<br />
are expected to improve genesis analysis,<br />
forecasts of rapid intensification, and forecasts<br />
of peaking day. (Refer to Chapter 7.)<br />
Tactical sites in the Pacific on the<br />
islands of Guam, Oahu, Luzon and Okinawa, as<br />
TAME 2-3<br />
well as AFGWC, received the Mission Sensor<br />
Tactical Imaging Computer (MISTIC) during<br />
the summer of 1990. Osan AB obtained the<br />
former Clark AB MISTIC system in early 1992.<br />
The AFGWC Tropical Section continues to<br />
provide the majority of the SSM/I support to<br />
<strong>JTWC</strong>. On 1 November 1991, AFGWC began<br />
testing 12-bit, high resolution SSM/I data on<br />
their Satellite Data Handling System. Initial<br />
results have been very encouraging and the final<br />
operational acceptance occurred on 1 March<br />
92. AFGWC, Det 1, and 18 OSS/WE provided<br />
bulletins to <strong>JTWC</strong> describing the extent of 30-kt<br />
(15 m/see) winds surrounding the tropical<br />
cyclone for all systems with maximum<br />
sustained winds of 50 kt (25 m/see) or greater.<br />
In the summer of 1992, expanded MISTIC<br />
software should be delivered to the tactical<br />
sites. This software will allow processing of<br />
full-resolution 12-bit SSM/I data, and will coregister<br />
OLS imagery and the SSM/1 data.<br />
=~amQcr ArL8ATELLI’m DEuvED<br />
TR@ICAL ~P081TI=3RCt4mBE8T<br />
~ ~ITIC41<br />
o’m4mmm cA8E8nPAmmmsEs )<br />
NORTHWEST PACIFIC<br />
OCEAN<br />
KN L981-UQMEEUE 1991 AVEBiXE<br />
l&2 13.6 (4442) 13.2 (858)<br />
3&4 20.6 (5112) 22.6 (574)<br />
5&6 35.5 (11040) 40.2 (1707)<br />
T9talS : 27.1 (20594) 29.6 (3139)<br />
NORTH INDIAN<br />
OCEAN<br />
Em 1981-1990 AYERKE 1991 AwRKE<br />
l&2 13.3 (120) 16.7 (25)<br />
3&4 29.6 (89) 26.6 (6)<br />
5&6 38.4 (905) 47.3 (108)<br />
Totals : 35.0 (1114) 40.9 (139)<br />
WESTERN SOUTH PACIFIC AND SOUTH INDIAN OCEAN<br />
f!a 1981-1990 A~ 1991 AYERAGE<br />
l&2 16.3 (1330) 16.1 (226)<br />
3&4 26.9 (1048) 27.1 (251)<br />
5&6 36.0 (6284) 35.0 (991)<br />
Tutaln : 31.9 (8662) 30.7 (1468)<br />
15<br />
2.3.4 FUTURE OF SATELLITE RECON-<br />
NAISSANCE — MIDDAS was formally<br />
accepted for operational use by Det 1 on 1 April<br />
1992, and it will provide <strong>JTWC</strong> with enhanced<br />
satellite support for 1992. At Det 1, the goal is<br />
to have a fully integrated satellite system,<br />
capable of ingesting data from both<br />
geostationary and polar satellites and then<br />
overlaying graphics from and interfacing with<br />
multiple data sources, e.g., Automated <strong>Weather</strong><br />
Distribution System (AWDS), NEXRAD<br />
Doppler radar, and the Mark IVB<br />
meteorological data station. The Mark IVB is<br />
scheduled to replace the Mark III and Mark IV<br />
satellite ingest and display systems during the<br />
1994 time-frame.<br />
Until the installation of AWDS in 1994,<br />
the plan is to rerneve the conventional data via<br />
the Automated <strong>Weather</strong> Network (AWN) and<br />
overlay it on the satellite imagery. Software<br />
developed for the MIDDAS is able to overlay<br />
wind, temperature, pressure and height fields on<br />
the satellite imagery. Det 1 and <strong>JTWC</strong> will
have the capability to integrate large volumes of<br />
data more efilciently and effectively than ever<br />
before.<br />
2.4 RADAR RECONNAISSANCE<br />
SUMMARY<br />
Twenty-two of the thirty-two significant<br />
tropical cyclones in the western North Pacit3c<br />
during 1991 passed within range of land-based<br />
radar with sutlicient cloud pattern organization<br />
to be fixed. A total of 994 land-based radar<br />
fixes were obtained and logged at <strong>JTWC</strong>.<br />
There were two airborne radar fixes.<br />
The WMO radar code defines three<br />
categories of accuracy: good (within 10 km (5<br />
rim)), fair (within 10-30 km (5-16 rim)), and<br />
poor (within 30-50 km (16-27 rim)). Of the<br />
1088 radar fixes encoded in this manne~ 313<br />
were good, 331 were fair, and 444 were poor.<br />
Excellent support from the radar network<br />
through timely and accurate radar fix<br />
positioning allowed <strong>JTWC</strong> to track and forecast<br />
tropical cyclone movement during even the<br />
most erratic track changes.<br />
Nineteen radar reports were received on<br />
southern hemisphere tropical cyclones. None<br />
we~ logged for the North Indian Ocean tropical<br />
cyclones.<br />
Looking ahead, the Next Generation<br />
<strong>Weather</strong> (Doppler) Radar (NEXRAD) is<br />
expected to be operational on Guam and at<br />
<strong>JTWC</strong> in April 1993.<br />
2s TROPICAL CYCLONE FIX DATA<br />
A total of 3139 fixes on thirty-two<br />
northwest Pacific tropical cyclones and 139<br />
fixes on four North Indian Ocean tropical<br />
cyclones were logged at <strong>JTWC</strong>. Table 2-4A<br />
delineates the number of fixes per platform for<br />
each individual tropical cyclone for the western<br />
North Pacific and North Indian Oceans. Season<br />
totals and percentages are also indicated. Table<br />
2-4B provides similar information for the 1487<br />
fixes in the South Pacific and South Indian<br />
Oceans.<br />
16
TABLE 2-4A<br />
TS<br />
Sharon<br />
TY<br />
Tti<br />
TS Vanes sa<br />
STY<br />
Walt<br />
TY<br />
Yunya<br />
TY<br />
Zeke<br />
TY*<br />
TY<br />
Brendan<br />
TY<br />
Caitlin<br />
TS<br />
Enrique<br />
TS<br />
Doug<br />
TY<br />
Ellie<br />
TY<br />
Fred<br />
TD<br />
13W<br />
TY<br />
Gladys<br />
TD<br />
15W<br />
TS<br />
Harry<br />
TY<br />
Ivy<br />
TS<br />
Joel<br />
TY<br />
Kinna<br />
TS<br />
Mke<br />
STY<br />
Mireille<br />
TY<br />
Nat<br />
TY<br />
Orchid<br />
TY<br />
Pat<br />
STY<br />
Ruth<br />
STY<br />
Seth<br />
TS<br />
Thelma<br />
TS<br />
Verne<br />
TS<br />
Wilda<br />
STY<br />
Yuri<br />
TY<br />
Zelda<br />
(Olw)<br />
(02W)<br />
(03W)<br />
(04W)<br />
(05W)<br />
(06W)<br />
(07W)<br />
(08W)<br />
(09W)<br />
(06E)<br />
(low)<br />
(llW)<br />
(12W)<br />
(13W)<br />
(14W)<br />
(15W)<br />
(16W)<br />
(17W)<br />
(18W)<br />
(19W)<br />
(20W)<br />
(21W)<br />
(22W)<br />
(23W)<br />
(24W)<br />
(25W)<br />
(26W)<br />
(2m)<br />
(28W)<br />
(29W)<br />
(30W)<br />
(31W)<br />
Totals<br />
NW:<br />
~ of ~:<br />
Tc OIA (olA)<br />
lW 02B<br />
(02B)<br />
‘K 03B (03B)<br />
TC 04B<br />
(04B)<br />
Totals<br />
MIO:<br />
p~ of ~-:<br />
122<br />
68<br />
97<br />
168<br />
70<br />
79<br />
90<br />
70<br />
125<br />
19<br />
29<br />
128<br />
100<br />
16<br />
134<br />
52<br />
35<br />
123<br />
53<br />
66<br />
77<br />
164<br />
196<br />
143<br />
92<br />
172<br />
196<br />
89<br />
79<br />
72<br />
132<br />
m<br />
3139<br />
74%<br />
26<br />
53<br />
39<br />
22.<br />
3.39<br />
100%<br />
o<br />
0<br />
0<br />
63<br />
2<br />
0<br />
20<br />
18<br />
164<br />
0<br />
0<br />
108<br />
6<br />
0<br />
98<br />
33<br />
30<br />
37<br />
46<br />
83<br />
9<br />
133<br />
144<br />
29<br />
0<br />
0<br />
19<br />
2<br />
0<br />
7<br />
27<br />
M!<br />
1088<br />
26%<br />
o<br />
0<br />
0<br />
1!<br />
o<br />
0%<br />
o<br />
0<br />
0<br />
1<br />
0<br />
2<br />
0<br />
0<br />
1<br />
0<br />
0<br />
0<br />
0<br />
0<br />
3<br />
0<br />
0<br />
0<br />
1<br />
2<br />
0<br />
0<br />
0<br />
0<br />
0<br />
0<br />
0<br />
0<br />
0<br />
0<br />
0<br />
D<br />
10<br />
o%<br />
o<br />
0<br />
0<br />
Q<br />
o<br />
o%<br />
122<br />
68<br />
97<br />
233*<br />
72<br />
81<br />
110<br />
88<br />
290<br />
19<br />
29<br />
236<br />
106<br />
16<br />
235<br />
85<br />
65<br />
160<br />
100<br />
151<br />
86<br />
298*<br />
340<br />
172<br />
92<br />
172<br />
215<br />
91<br />
79<br />
79<br />
159<br />
$!3<br />
4239*<br />
100%<br />
26<br />
53<br />
39<br />
zl<br />
139<br />
100%<br />
* Two aircraft fixes were received.<br />
17
3. SUMMARY OF WESTERN NORTH PACIFIC AND<br />
NORTH INDIAN OCEAN TROPICAL CYCLONES<br />
3.1 GENERAL compared to 165 in 1990 and 154 in 1989.<br />
For the western North Pacific, 1991 Again only considering the western North<br />
was another record-breaking year for the Pacific, there were 47 days when the Center<br />
number of warnings issued — 835 (41 more issued warnings on two or more tropical<br />
than last year) on 32 tropical cyclones (Table cyclones and 18 days when it warned on three<br />
3- 1). If Enrique (06E) which tracked (Table 3-3) at a time. There were no days in<br />
westward from the Eastern Pacific is the Northern Hemisphere when warnings were<br />
considered, this was one more than the issued on four or more tropical cyclones at<br />
climatological mean of 31 and a carbon copy once. When the North Indian Ocean is<br />
of 1990 (Table 3-2). The North Indian Ocean included in the total, there were 178 days with<br />
was moderately active with four tropical warnings on one cyclone and 55 days with<br />
cyclones, which is just below the two. Thirty-seven initial Tropical Cyclone<br />
climatological average of five. The North Formation Alerts were issued on western<br />
Indian Ocean Season included the devastating North Pacific tropical disturbances (Table 3-4)<br />
super cyclone 02B. During the year, a record and five on disturbances in the North Indian<br />
891 warnings were issued for 36 tropical Ocean. Alerts preceded warnings on all<br />
cyclones in the Northern Hemisphere. A significant tropical cyclones in the western<br />
chronology of activity is provided in Figure 3- North Pacific and North Indian Ocean with the<br />
1. exception of Tropical Depression 15W and<br />
In the western North Pacific, <strong>JTWC</strong> Enrique (06E) which regenerated rather<br />
was in warning status 169 days during 1991 rapidly.<br />
19
TAME 3-2 WESTEW NORTH PACIFIC TROPICAL CYCLONE DISTRIBUTION<br />
1959<br />
1960<br />
1961<br />
1962<br />
1963<br />
1964<br />
1965<br />
1966<br />
1967<br />
1968<br />
1969<br />
1970<br />
1971<br />
1972<br />
1973<br />
1974<br />
1975<br />
1976<br />
1977<br />
1978<br />
1979<br />
1980<br />
1981<br />
1982<br />
1983<br />
1984<br />
1985<br />
1986<br />
1987<br />
1988<br />
1989<br />
AUK<br />
o<br />
000<br />
1<br />
001<br />
1<br />
010<br />
0<br />
000<br />
0<br />
000<br />
0<br />
000<br />
2<br />
110<br />
0<br />
000<br />
1<br />
010<br />
0<br />
000<br />
1<br />
100<br />
0<br />
000<br />
1<br />
010<br />
1<br />
100<br />
0<br />
000<br />
1<br />
010<br />
1<br />
100<br />
1<br />
100<br />
0<br />
000<br />
1<br />
010<br />
1<br />
100<br />
0<br />
000<br />
0<br />
000<br />
0<br />
000<br />
0<br />
000<br />
0<br />
000<br />
2<br />
020<br />
0<br />
000<br />
1<br />
100<br />
1<br />
100<br />
1<br />
010<br />
Em<br />
1<br />
010<br />
0<br />
000<br />
1<br />
010<br />
1<br />
010<br />
0<br />
000<br />
0<br />
000<br />
2<br />
020<br />
0<br />
000<br />
0<br />
000<br />
1<br />
001<br />
0<br />
000<br />
1<br />
100<br />
0<br />
000<br />
0<br />
000<br />
0<br />
000<br />
0<br />
000<br />
0<br />
000<br />
1<br />
010<br />
0<br />
000<br />
0<br />
000<br />
0<br />
000<br />
0<br />
000<br />
0<br />
000<br />
0<br />
000<br />
0<br />
000<br />
0<br />
000<br />
0<br />
000<br />
1<br />
100<br />
0<br />
000<br />
0<br />
000<br />
0<br />
000<br />
M3E<br />
1<br />
010<br />
1<br />
001<br />
1<br />
100<br />
0<br />
000<br />
1<br />
001<br />
0<br />
000<br />
1<br />
010<br />
0<br />
000<br />
2<br />
110<br />
0<br />
000<br />
1<br />
010<br />
0<br />
000<br />
1<br />
010<br />
1<br />
001<br />
0<br />
000<br />
1<br />
010<br />
0<br />
000<br />
0<br />
000<br />
1<br />
010<br />
0<br />
000<br />
1<br />
100<br />
1<br />
001<br />
1<br />
100<br />
3<br />
210<br />
0<br />
000<br />
0<br />
000<br />
0<br />
000<br />
0<br />
000<br />
0<br />
000<br />
0<br />
000<br />
0<br />
000<br />
AeEMlum<br />
i!LLAYGsEEf2a<br />
1 0 1 3 8 9 3<br />
100 000 001 111 512 423 210<br />
1 1 33 9 5 4<br />
100 010 210 210 810 041 400<br />
1 4 6 57 6 7<br />
010 211 114 320 313 510 322<br />
1 3 0 8 8 7 5<br />
100 201 000 512 701 313 311<br />
1 0 4 5 4 4 6<br />
100 000 310 311 301 220 510<br />
0 3 2 8 8 87<br />
000 201 200 611 350 521 331<br />
1 2 4 6 7 9 3<br />
100 101 310 411 322 531 201<br />
121 4 9 10 4<br />
100 200 100 310 531 532 112<br />
11181084<br />
100 010 100 332 343 530 211<br />
1 0 4 3 8 4 6<br />
100 000 202 120 341 400 510<br />
1 0 0 3 365<br />
100 000 000 210 210 204 410<br />
0 0 2 3 7 4 6<br />
000 000 110 021 421 220 321<br />
2 5 2 8 57 4<br />
200 230 200 620 311 511 310<br />
0 0 4 5 5 6 5<br />
000 000 220 410 320 411 410<br />
0 0 0 7 6 3 4<br />
000 000 000 430 231 201 400<br />
1 1 4 5 7 54<br />
010 100 121 230 232 320 400<br />
1 0 0 1 6 5 6<br />
001 000 000 010 411 410 321<br />
2 2 2 4 4 5 0<br />
110 200 200 220 130 410 000<br />
0 1 1 4 25 4<br />
000 001 010 301 020 230 310<br />
1 0 3 4 8 4 7<br />
100 000 030 310 341 310 412<br />
12054 6 3<br />
100 011 000 221 202 330 210<br />
1 4 1 537 4<br />
010 220 010 311 201 511 220<br />
1 1 2 5 8 4 2<br />
010 010 200 230 251 400 110<br />
0 1 3 4 5 6 4<br />
000 100 120 220 500 321 301<br />
0 0 1 3 6 35<br />
000 000 010 300 231 111 320<br />
0 0 2 574 8<br />
000 000 020 410 232 130 521<br />
0 1 3 1 7 5 5<br />
000 100 201 100 520 320 410<br />
1 2 2 2 5 2 5<br />
100 110 110 200 410 200 320<br />
1 0 2 4 4 7 2<br />
010 000 110 400 310 511 200<br />
01325 8 4<br />
000 100 111 110 230 260 400<br />
1 2 2 6 8 4 6<br />
100 200 110 231 332 220 600<br />
TABLE CONTLNUEDON TOP OF NEXT PAGE<br />
ML!<br />
2<br />
200<br />
1<br />
100<br />
2<br />
101<br />
4<br />
301<br />
0<br />
Or@<br />
6<br />
420<br />
2<br />
110<br />
5<br />
122<br />
4<br />
400<br />
4<br />
400<br />
2<br />
110<br />
4<br />
130<br />
2<br />
110<br />
2<br />
200<br />
3<br />
030<br />
4<br />
220<br />
3<br />
210<br />
2<br />
110<br />
2<br />
200<br />
4<br />
121<br />
2<br />
110<br />
1<br />
100<br />
3<br />
210<br />
1<br />
100<br />
5<br />
320<br />
3<br />
300<br />
1<br />
010<br />
4<br />
220<br />
3<br />
120<br />
2<br />
200<br />
3<br />
300<br />
REc<br />
2<br />
200<br />
1<br />
100<br />
1<br />
100<br />
2<br />
020<br />
3<br />
210<br />
2<br />
101<br />
1<br />
010<br />
2<br />
101<br />
1<br />
010<br />
0<br />
000<br />
1<br />
010<br />
0<br />
000<br />
0<br />
000<br />
3<br />
210<br />
0<br />
000<br />
2<br />
020<br />
2<br />
002<br />
2<br />
020<br />
1<br />
100<br />
0<br />
000<br />
3<br />
111<br />
1<br />
010<br />
2<br />
200<br />
1<br />
100<br />
2<br />
020<br />
1<br />
100<br />
2<br />
110<br />
3<br />
210<br />
1<br />
100<br />
1<br />
010<br />
2<br />
101<br />
31<br />
1777<br />
30<br />
1983<br />
42<br />
20 11 11<br />
39<br />
2469<br />
28<br />
1963<br />
44<br />
26 13 5<br />
40<br />
21 13 6<br />
38<br />
20 10 8<br />
41<br />
20 15 6<br />
31<br />
2074<br />
23<br />
1364<br />
27<br />
12 12 3<br />
37<br />
24 11 2<br />
32<br />
2282<br />
23<br />
1292<br />
35<br />
15 17 3<br />
25<br />
1465<br />
25<br />
14 11 0<br />
21<br />
1182<br />
32<br />
15 13 4<br />
28<br />
1495<br />
28<br />
1594<br />
29<br />
16 12 1<br />
28<br />
1972<br />
25<br />
12 11 2<br />
30<br />
16 11 3<br />
27<br />
1791<br />
27<br />
1980<br />
25<br />
1861<br />
27<br />
14 12 1<br />
35<br />
21 10 4<br />
20
coN’HNUED FROM PREVIOUS PAGE<br />
xEmmim Mim AmM JYNmmmmw RlxmxALs<br />
1990 1 0 0 0 2 4 4 5 5 5 4 1 32<br />
100 000 000 000 110 211 220 500 410 230 310 100 21 10 1<br />
1991 0 0 2 1 1 1 4 8 6 3 6 0 32<br />
000 000 110 010 100 100 400 332 420 300 330 000 20 10 2<br />
(1959-1991)<br />
I“fEAN:0.6 0.3 0.6 0.7 1.3 2.I 4.5 6-2 5.7 4-5 2.9 1.4 30.8<br />
CASES: 19 9 20 24 42 70 148 206 187 150 96 46 1017<br />
P !<br />
Ilte criteria used in Table3-2am as follows:<br />
[. If a tropical cyclone was first warned on during the last two days of a TABLE 3-2 LEGEND<br />
mtiicular month and continued into the next month for longer than two days,<br />
hen thatsystem was attributedto the samnd month.<br />
Legend: Total for tite month -> — 6<br />
!. If a trcpical cyclone was warned on prior to the last two days of a month, it<br />
vas attributedto the first mcmh, regardless of how long the system lasted.<br />
Typhoons > 312<br />
Tropical Storms<br />
1. If a tropical cyclcate began cmthe last day of the memh and ended cir the first<br />
lay of the next month, that system was attributed to the fist month. However, if Tropical Depressions<br />
I-~ cyclone ~gm CMthe ~st day of the month and continued mm the next<br />
nontlr for only two days, rhm it was attributed to the second month.<br />
TABLE 3-1 ~ ~ PACIPIC SIQIXFI~<br />
TR@I(XL ~ ~ 1991<br />
NUMEER OF MAKIMUM<br />
WARNINGS SURJACE WINDS ESTIMATED<br />
(OIW) TS SHARON 05 MAR- 14 MAR 33 60 (31) 980<br />
(02W) TY TIM 21 MAR- 25 MAR 20 70 (36) 972<br />
(03W) TS VANESSA 23 APR - 28 APR 20 45 (23) 991<br />
(04W) STY WALT 06 MAY - 16 MAY 40 140 (72) 898<br />
(05W) TY YUNYA 13 JUN-17JUN 16 105 (54) 938<br />
(06W) TY ZEKE 09 JUL-14JUL 21 80 (41) 963<br />
(07W) TY AMY 15 JUL-20JUL 18 125 (64) 916<br />
(08w) TY ERENDAN 21 JUL-24JUL 16 70 (36) 972<br />
(O9W) TY CAITLIN 23 JUL-30JUL 27 95 (49) 949<br />
(O 6E) TS ENRIQUE 01 AUG - 01 AUG 3 35 (18) 997<br />
(1OW) TS DOUG 08 AUG - 11 AUG 9 35 (18) 997<br />
(llW) TY ELLIE 10 AUG - 19 AUG 34 85 (44) 958<br />
(12W) TY FRED 11 AUG - 18 AUG 27 95 (49) 949<br />
(13W) TD 13w 12 AUG - 13 AUG 5 25 (13) 1004<br />
(14W) TY GLADYS 16 AUG - 23 AUG 31 65 (33) 973<br />
(15W) TD 15W 26 AUG - 29 AUG 11 30 (15) 997<br />
(16W) TS HARRY 29 AUG - 31 AUG 10 40 (21) 994<br />
(17W) TY IVY 02 SEP - 10 .55P 32 115 (59) 927<br />
(18W) TS JOEL 03 SEP - 07 SS0 15 55 (28) 982<br />
(19W) TY KINt4A 10 SEP - 14 SEP 17 90 (46) 954<br />
(20W) TS LUKE 14 SEP - 19 SEP 20 50 (26) 987<br />
(21W) STY MIRJ31LLE 16 SEP - 27 SEP 48 130 (67) 910<br />
(22W) TY NAT 16 SEP - 02 OCT 61 110 (57) 933<br />
(23w) TY ORCHID 04 OCT - 13 OCT 37 115 (59) 927<br />
(24w) TY PAT 05 CXT - 13 CCT 31 125 (64) 916<br />
(25w) STY RUTH 20 OCT - 31 CCT 40 145 (75) 892<br />
(26w) STY SETH 01 NOV - 14 NOV 56 130 (67) 910<br />
(27w) TS THELMA 01 NOV - 08 NOV 23 45 (23) 991<br />
(28w) TS VERNE 05 NOV - 12 NOV 28 55 (28) 984<br />
(29w) TS WIIJ)A 14 NOV - 20 NOV 22 45 (23) 991<br />
(30W) STY YURI 23 NOV - 01 DEC 36 150 (77) 885<br />
(31W) TY ZELUA 27 NOV - 04 DEC 28 80 (41) 963<br />
.Tf2TAL: 835<br />
\<br />
-4
.<br />
.,. *.<br />
Ill ,~q<br />
●;<<br />
A<br />
,,.!Z<br />
*<br />
*.<br />
Figure 3-1. Chronology of western North<br />
Pacific and North Indian Ocean tropical<br />
cyclones for 1991.<br />
:<br />
.<br />
<<br />
*<br />
.:<br />
22
TABLE 3-3 VWS- WORTN PACIFIC ~ICAL ~<br />
TYPHOONS<br />
u945 - 1.95a<br />
JMEEBMAR AEXMAXA7UNJUL i3uGsEE QaNQYREc2smEi<br />
MEAN: 0.3 0.1 0.3 0.4 0.7 1.0 2.9 3.1 3.3 2.4 2.0 0.9 16.4<br />
CASES: 5 1 4 6 10 15 29 46 49 36 30 14 245<br />
lL960 - 199J.L<br />
Ji3NEEB MARi3m. MAxmaL AUGSE2GCI M2YREC3QTALS<br />
MEAN: 0.3 0.1 0.2 0.5 0.7 1.1 2.7 3.2 3.2 3.1 1.8 0.6 17.5<br />
CASES: 9 2 7 15 24 35 88 102 104 100 57 20 563<br />
TROPICAL<br />
STORMS AND TYPHOONS<br />
J1945 - H<br />
JAN EEEMaRAu Mu JuNJIEA AuJisEE mNw REG22mI.fi<br />
MEAN: 0.4 0.1 0.5 0.5 0.8 1.6 2.9 4.0 4.2 3.3 2.7 1.2 22.2<br />
CASES: 6 2 7 8 11 22 44 60 64 49 41 18 332<br />
JI.960 - 19$!U-<br />
J7WIEE MBWRMUJUNJKL AUGSEEGCL WREG2SZUJA<br />
MEAN: 0.6 0.3 0.5 0.7 1.1 1.8 4.2 5.3 5.0 4.2 2.7 1.2 27.3<br />
CASES: 18 8 15 22 36 59 133 171 159 133 88 38 880<br />
NUMBER OF CALENDAR WARNING DAYS: 169<br />
NUMEER OF CALENDAR WARNING DAYS WITH TWO TROPICAL CYCIQNES: 47<br />
NUM8ER OF CALENDAR WARNING DAYS WITH THREE TROPICAL CYCLONES:18<br />
n<br />
I<br />
TABLE 3-4 NXCAL CYCIONN FCSWATI~ ~<br />
WES- NCttTEPACIFIC ~<br />
TROPICAL TOTAL FALSE PROBABILITY<br />
INITIAL CYCLONES TROPICAL a<br />
1976 34 25 25 26%<br />
100%<br />
1977<br />
26 20 21 23% 95%<br />
1978 32 27 32 16% 84%<br />
1979 27 23 28 15% 82%<br />
1980 37 28 28 24% 100%<br />
1981 29 28 29 3% 96%<br />
1982 36 26 28 28% 93%<br />
1983 31 25 25 19% 100%<br />
1984 37 30 30 19% 100%<br />
1985 39 26 27 33% 96%<br />
1986 38 27 27 29% 100%<br />
1987 31 24 25 23% 96%<br />
1988 33 26 27 21% 96%<br />
1989 51 32 35 37% 91%<br />
1990 33 30 31 9% 97%<br />
1991 37 29 31* 22% 94%<br />
(1976-1991)<br />
MEAN: 34.4 26.6 28.1 23% 95%<br />
TOTALS: 551 426 449<br />
1991 FORWATION ALERTS: 30 OF 32 INITIAL FORMATION ALERTS DEVELOPED INTO SIGNIFICANTTROPICAL CYCLONES.<br />
* ENRIQUE(06E)NOT INCLUDED<br />
23
3.2 WESTERN NORTH PACIFIC<br />
TROPICAL CYCLONES<br />
The 12 months of 1991 included five<br />
super typhoons, 15 lesser typhoons, 10 tropical<br />
storms and two tropical depressions. Again,<br />
like the preceding 2 years, this was above<br />
average for the number of typhoons and super<br />
typhoons, but below average for tropical<br />
depressions. A possible record number of five<br />
midget tropical cyclones occurred during the<br />
year. All tropical cyclones originated in the<br />
monsoon trough, near-equatorial trough, or<br />
within a Northward-displaced Self-sustaining,<br />
Solitary (NSS) monsoon gyre* (Lander, 1992)<br />
which dominated the circulation of the western<br />
North Pacific during August. None were<br />
TWIT-induced, even though the TUTT was<br />
much in evidence during the summer.<br />
January and February were months<br />
with a very active Australian monsoon and<br />
higher than normal surface pressures in the<br />
western North Pacific. This pattern changed<br />
dramatically in March as pressures rose across<br />
northern Australia with the demise of the<br />
monsoon. Coincident with the Southern<br />
Oscillation Index for March going negative,<br />
brisk equatorial westerlies appeared east of<br />
New Guinea and cyclonic vortices (including<br />
Sharon (01W) and Tim (02W)) formed both<br />
north and south of the equator in the twin<br />
near-equatorial troughs. These anomalously<br />
strong westerly winds continued into April and<br />
May, and supported the formation of Vanessa<br />
(03W) and Walt (04W) as well. In early May,<br />
a strong west-wind burst along the equator led<br />
to the formation of Walt (04W) and a southern<br />
twin (Lisa (21P)). In June and July, a single<br />
monsoon trough became established in the<br />
western North Pacific and a near-equatorial<br />
buffer zone appeared, as the southern<br />
hemisphere near-equatorial trough was<br />
replaced by southeasterly flow. With the<br />
exception of Enrique (06E), which came<br />
westward across the international date line,<br />
tropical cyclones Yunya (05W) through Caitlin<br />
(09W) developed in this northern hemisphere<br />
trough.<br />
Afler 31 July, when Caitlin dissipated,<br />
almost 2 weeks followed without tropical<br />
cyclone activity as a major synoptic pattern<br />
change occurred in the western North Pacific<br />
- a NS S monsoon gyre replaced the normal<br />
monsoon trough. In August (Figure 3-2), with<br />
the exception of Fred (12W), which developed<br />
just east of the central Philippine Islands in an<br />
extension of the Asian monsoon trough, Doug<br />
(IOW) through Harry (16W) formed in the<br />
NSS monsoon gyre.<br />
In September (Figure 3-3), after the<br />
demise of Harry (16W) and the NSS monsoon<br />
gyre, there was another major synoptic pattern<br />
change - the monsoon trough reappeared in<br />
low latitudes. This trough spawned Ivy (17W)<br />
and the remaining tropical cyclones of the<br />
year. Starting in October (Figure 3-4), with a<br />
modemte El Nifio taking shape in the Central<br />
Pacific, persistent convection and strong<br />
equatorial westerlies became established east<br />
of New Guinea. By November, most of the<br />
deep convective clouds had moved back along<br />
the equator and the twin near-equatorial<br />
troughs were established again with named<br />
cyclones forming both north and south of the<br />
equator.<br />
*Monsoongynx are modes of the monsooncirculationwhich are characterizedby:<br />
1)a large (diameter on the order of 1000nm (2(X)0km)) nearlycircularlow-level cyclonic vortex;<br />
2) nearly circular isobars with the outermostclosed isobar possessinga diameterof roughly 1000m (20(KIkm]<br />
3) a northward displacement of the sea-level pressure minimum with respect to the latitude of the pressure<br />
minimumfound along any meridian passing throughthe long-termmonthly mean monsoontrouglYand<br />
4) lower than average sea-level pressure throughoutmost of the tropical western North Pacific.<br />
24
not<br />
40M<br />
J<br />
4<br />
$ *-<br />
10 8-<br />
m<br />
170r<br />
m *ls<br />
I<br />
kLLJ<br />
E<br />
●<br />
● G 16<br />
24<br />
m0<br />
8D<br />
(!7<br />
●E<br />
c) 10<br />
I I<br />
EG<br />
k2d<br />
G<br />
o●13<br />
20<br />
DI *<br />
21<br />
G<br />
m<br />
n<br />
22 m<br />
●“ ● G<br />
E<br />
KE wG<br />
7<br />
regimx
I!9<br />
N~<br />
.,gs<br />
I<br />
16<br />
s@<br />
24<br />
DN-L<br />
& @<br />
M<br />
18<br />
Izl<br />
L<br />
* *M<br />
N<br />
19<br />
I__<br />
NM<br />
●*<br />
EM<br />
● “<br />
N<br />
EM<br />
N<br />
23<br />
26<br />
27<br />
rN<br />
2a<br />
I 29<br />
k=<br />
~LM<br />
● *<br />
●<br />
n/+JM ‘*<br />
Figure 3-3. Western North PacYlc sea-level messure for Semember 1991. Outer contour is 1008 mb: black-<br />
.<br />
shaded regions:
N“<br />
9 ● 0<br />
Q<br />
16<br />
Cziiil 17<br />
u0<br />
9 ‘.<br />
O(-J<br />
+<br />
6<br />
L_x2<br />
‘T O;l<br />
Fimare 3-4. Western North Pacific sea-level uressure for October 1991. outer contour is 1010 mh black-shaded regions<br />
< ~004 mb. Maps are at 002 for the date rn&cated in the lower right of each panel. Geography key appears in upper left<br />
panel. Tropical cyclones are indicate& N-Nat (22W), O-Orchid (23W), P-Pat (24W), R-Ruth (2SW), S-Seth (26W) and<br />
T-Thelma (27W). (Adapted from Lander, 1992.)<br />
27
JANUARY THROUGH JUNE<br />
The first tropical cyclone of 1991 in the<br />
western North Pacific, Sharon (OIW),<br />
developed the first week of March in<br />
conjunction with a burst of equatorial westerly<br />
winds that extended eastward from New<br />
Guinea to the international date line. Sharon<br />
tracked over the central Philippine Islands and<br />
continued westward across the South China<br />
Sea to dissipate in southeastern Vietnam on 16<br />
March. Close behind Sharon, Tim (02W) was<br />
the second tropical cyclone to develop in the<br />
eastern Caroline Islands during the month of<br />
March. The recurvature track taken by llm<br />
proved difficult to predict for <strong>JTWC</strong><br />
forecasters, because the primary prognostic<br />
guidance was slow to depict the changing<br />
synoptic situation. Average forecast errors<br />
for Tim were the largest of any Northwest<br />
Pacific tropical cyclone forecasts in 1991.<br />
After T~hoon Tim in mid-March, the nearequatorkd<br />
trough remained relatively inactive<br />
until Vanessa’s (03W) convection flared up to<br />
the south of Guam over a month later. Vanessa<br />
moved across the central Philippine Islands as<br />
a weak tropical depression, peaked at 45 kt (23<br />
m/see) in the South China Sea, then the<br />
remnants of the tropical storm moved<br />
northward through the axis of the subtropical<br />
ridge and dissipated southwest of Hong Kong.<br />
A week later, Walt (04W) generated below 5“<br />
North Latitude in the eastern Caroline Islands.<br />
Walt was the first super typhoon of the year in<br />
the western North Pacific and the only<br />
significant tropical cyclone to form in May. It<br />
developed as part of an equatorial convective<br />
process known as a “westerly burst” (Lander,<br />
1990) at the same time a twin, Tropical<br />
Cyclone 21P (Lisa), developed in the Southern<br />
Hemisphere. Almost a month later, Typhoon<br />
Yunya (05W) followed as the first significant<br />
tropical cyclone of June, breaking a nearly<br />
month-long lull in activity in the western<br />
North Pacific. Yunya was noteworthy because<br />
28<br />
a ship transited through its center, providing a<br />
unique glimpse of the structure of a rapidlydeveloping,<br />
midget typhoon. Its passage<br />
through central Luzon coincided with the<br />
massive eruption of Mount Pinatubo and<br />
evacuation of personnel from Clark Air Base.<br />
JULY<br />
Two-and-one-half weeks after Yunya<br />
dissipated, Zeke (06W) evolved in the<br />
Philippine Sea. Zeke was the first tropical<br />
cyclone to develop during the month of July,<br />
and initiated a period of nearly continuous<br />
tropical cyclone warning status for <strong>JTWC</strong> in<br />
the Northwest Pac~lc through early December.<br />
Typhoon Zeke made landfall three times<br />
before it dissipated over the mountains of<br />
northern Vietnam. The second of five tropical<br />
cyclones to form in July, Amy (07W) followed<br />
a west-northwesterly track that paralleled the<br />
one taken a week earlier by Typhoon Zeke<br />
(06W). Near Taiwan, the typhoon caused the<br />
loss of the 16,000 ton freighter, Blue River,<br />
with its entire crew, and then became the<br />
deadliest typhoon of the year to strike China.<br />
Brendan (08W) was the thixl straight-rumer<br />
in a row. Torrential rains associated with the<br />
tropical cyclone’s passage across northern<br />
Luzon unleashed lahars or avalanches of<br />
volcanic debris, mud and boulders in the<br />
valleys near Mount Pinatubo.<br />
After a succession of three straightrunning<br />
July typhoons (Zeke (06W), Amy<br />
(07W), and Brendan(08W)) which moved<br />
west-northwestward, Caitlin (09W) became<br />
the first cyclone of the season to threaten<br />
Japan and Korea. Much-needed heavy rains<br />
fell on drought-stricken Okinawa as Caitlin<br />
passed west of the island. Then, Enrique<br />
(06E), a rare tropical cyclone which began in<br />
the Eastern Paci.tic and trekked 4900 nm (9100<br />
km) across the central North Pacific Ocean,<br />
regenerated, reached minimum tropical storm<br />
intensity, and then dissipated in the <strong>JTWC</strong> area
of responsibility. Over the past 20 years,<br />
T~hoon Georgette (1986) was the only other<br />
Eastern Pacific tropical cyclone to cross the<br />
international date line.<br />
AUGUST<br />
Doug (1OW)was the first of a series of<br />
six tropical cyclones to form in August as part<br />
of a large NSS monsoon gyre. Doug failed to<br />
intensify beyond minimal tropical storm<br />
intensity because it moved rapidly northward<br />
into an area of colder sea surface temperatures<br />
and increased vertical wind shear before<br />
transitioning into an extratropical cyclone.<br />
The second tropical cyclone of AugusL Ellie<br />
(llW), formed as part of the larger NSS<br />
monsoon gyre a day after Doug. Ellie, was<br />
also the second midget typhoon of 1991. It<br />
maintained a generally westward track,<br />
traveling 2400 nm (4440 km) across the<br />
western North Pacific from just west of W&e<br />
Island to Taiwan. Next came Fred (12W)<br />
which was spawned by the Asian monsoon<br />
trough and became part one of two, threestorm<br />
outbreaks that occurred in mid-August.<br />
Typhoon Fred skirted the northern coasts of<br />
Luzon and Hainan Island before dissipating<br />
over Southeast Asia. Tropical Depression<br />
13W formed as a low pressure area in the<br />
same NSS monsoon gyre as Typhoon Ellie,<br />
then tracked northwestward in Ellie’s wake.<br />
Tropical Depression 13W was markai by large<br />
diurnal fluctuations in convection which<br />
slowed the development of strong surface<br />
winds. The fourth and largest of six tropical<br />
cyclones generated by the NSS monsoon gyre<br />
active during the month of August was<br />
Typhoon Gladys (14W). Gladys’ wind field<br />
expanded dramatically with only a small<br />
change in minimum sea-level pressure as it<br />
tracked south of Korea and western Japan.<br />
Gladys was a good example of a cyclone that<br />
“strengthened” but did not “intensify”<br />
significantly. When animated satellite<br />
29<br />
imagery indicated cyclonic turning in an area<br />
of deep convection associated with the NSS<br />
monsoon gyre, a Signii3cant Tropical <strong>Weather</strong><br />
Advisory was reissued at 2122002 (August) to<br />
include the disturbance that was to become<br />
Tropical Depression lSW. Five days later<br />
Harry (16W) became the last of six tropical<br />
cyclones, beginning with Doug (1OW) three<br />
weeks earlier, to generate within this NSS<br />
monsoon gyre.<br />
SEPTEMBER THROUGH DECEMBER<br />
Ivy (17W) was the first tropical<br />
cyclone since Fred to form in the monsoon<br />
trough which re-established itself eastward<br />
from Asia through the Caroline Islands. Ivy<br />
was also the first significant threat of the<br />
typhoon season for the Mariana Islands. For 4<br />
days, the tropical cyclone tracked westnorthwestward,<br />
straight towards Guam, then<br />
on 4 September it took a sudden, unanticipated<br />
turn to the north-northwest and headed for the<br />
Northern Marianas and subsequently Japan.<br />
Joel (18W) developed in the South China Sea,<br />
tracked westward, and then came to an abmpt<br />
halt. After little, or no, movement for six<br />
hours, the tropical cyclone slowly inched<br />
northward and made landfall 70 nm (130 km)<br />
east of Hong Kong. A day later, Kinna (19W)<br />
formed in the western Caroline Islands. It was<br />
the most destructive tropical cyclone to strike<br />
Okinawa since 1987, and the fiit typhoon to<br />
pass directly across the island since Vera in<br />
1986. Later, the typhoon also passed directly<br />
across Sasebo, Japan, and caused extensive<br />
damage on Kyushu and later Honshu as it<br />
raced northeastward after recurvature. The<br />
exceptionally accurate forecasts of the path<br />
taken by Typhoon Kinna provided more than<br />
ample lead time for disaster preparation at key<br />
DOD installations. As Kinna became<br />
extratropical, Tropical Storm Luke (20W)<br />
formed just east of the Mariana Islands. It was<br />
a broad monsoonal cyclone, difficult to track
*<br />
by satellite, and had the largest initial position<br />
errors of the season. Luke’s unusual<br />
recurvature track resulted from the extension<br />
of the mid-latitude, mid-tropospheric<br />
westerlies deep into the tropics in mid-<br />
September, which temporarily broke down the<br />
subtropical ridge in the western Pacific,<br />
Mireille (21W) was part of a three<br />
storm outbreak in September consisting of<br />
Tropical Storm Luke (20W) and Typhoon Nat<br />
(22W). Later, after Luke had become<br />
extratropical, Mireille, Nat and Typhoon<br />
Orchid (23W) became part of another three<br />
storm outbreak. Mireille was the second<br />
super typhoon of the year in the Northwest<br />
Pacific, and became the worst storm to strike<br />
Japan in three decades. It outgrew it’s early<br />
midget size after passing Saipan, and reached<br />
super typhoon intensity several days before<br />
threatening Okinawa. Recurving just to the<br />
southwest of Okinawa, the typhoon<br />
accelerated, cutting a path across western<br />
Kyushu and Honshu. Over the Sea of Japan,<br />
Mireille transitioned into an intense<br />
extratropical cyclone which slammed into<br />
northern Honshu and southern Hokkaido<br />
producing gusts to 83 kt (43 m/see) at Misawa<br />
AB. For 17 days, Typhoon Nat (22W)<br />
exhibited highly erratic behavior which<br />
included four major track changes, two<br />
intensification episodes, and two landfalls. It<br />
persisted longer than any other western North<br />
Pacific tropical cyclone during 1991, requiring<br />
a total of 61 warnings which was only 18<br />
warnings shy of the all-time record set by<br />
Typhoon Rita (1972). Nat’s track and<br />
behavior were reminiscent of that of Typhoon<br />
Wayne (1986).<br />
T~hoon Orchid (23W) was the first<br />
tropical cyclone to develop during the month<br />
of October, and was followed within a day by<br />
Typhoon Pat (24W). As these two typhoons<br />
interacted, Orchid slowed about 200 nm (370<br />
km) off the coast of Japan, and caused<br />
widespread flooding in Tokyo and surrounding<br />
30<br />
cities. Developing at the same time in early<br />
October as Orchid, Typhoon Pat’s (24W)<br />
track paralleled that of Orchid’s, but several<br />
hundred miles to the east. Pat’s rapid<br />
intensification phase was correctly predicted<br />
by a recently developed pixel-counting<br />
forecast scheme. Two days after Orchid and<br />
Pat went extratropical east of Japan, Ruth<br />
(25W) developed in the eastern Caroline<br />
Islands. Super Typhoon Ruth was the second<br />
most intense tropical cyclone of 1991.<br />
Climatological analogs enabled forecasters to<br />
anticipate Ruth’s rapid deepening to super<br />
typhoon intensity in the Philippine Sea.<br />
However, track forecasts based on the<br />
NOGAPS spectral model were 2 days early in<br />
predicting recurvature. This resulted in the<br />
largest forecast track errors of the year as Ruth<br />
slammed into northern Luzon instead of<br />
recurving toward the Ryukyu Islands. As<br />
Ruth finally recurved, Super Typhoon Seth<br />
(26W) started cranking up in the southern<br />
Marshall Islands. It was the first of six<br />
tropical cyclones of at least typhoon intensity<br />
to occur in the month of November. This was<br />
the most active November in the western<br />
North Pacific since 1964 when six occurred.<br />
Forecasts for Seth’s generally westward track<br />
were complicated by the normally reliable<br />
objective guidance, that in Seth’s case,<br />
indicated recurvature which did not occur.<br />
When Seth formed, Thelma (27W) slowly<br />
intensified in the central Caroline Islands. The<br />
worst loss of life due to a natural disaster in<br />
the western North Pacific during 1991<br />
occurred when Tropical Storm Thelma made<br />
landfall in the central Philippine islands.<br />
News accounts estimated that 6000 people<br />
died and 20,000 people were made homeless<br />
by landslides, flash flooding, and the failure of<br />
a dam. The highest casualties occurred on<br />
Leyte and Negros Islands where widespread<br />
logging had stripped the hills bare of<br />
vegetation.<br />
On 3 November, westerly low-level
winds along the equator and a persistent cloud<br />
system near the international date line<br />
generated the tropical disturbance which<br />
eventually became Tropical Storm Verne<br />
(28W). Tropical Storm Verne passed between<br />
Pagan and Agrihan in the northern Mariana<br />
Islands with a maximum intensity of 55 kt (28<br />
m/see), and closed to within 800 nm (1480<br />
km) of Super Typhoon Seth (26W) on 10<br />
November, before recurving northeastward on<br />
11 November. As Verne transitioned into an<br />
extratropical low, Wilds (29W) got started in<br />
the western Caroline Islands. Tropical Storm<br />
Wilda was another midget tropical cyclone,<br />
and posed another serious threat to the central<br />
Philippine Islands which were devastated by<br />
Tropical Storm Thelma (27W) only 2 weeks<br />
before. Wilda maintained its peak intensity of<br />
45 kt (23 rn/see) as it tracked across southern<br />
Luzon and passed about 40 nm (75 km) south<br />
of Manila around noon on 17 November. Due<br />
to its compact wind field, damage was<br />
minimal near Manila. After turning<br />
northwestward later on 17 November, Wilds<br />
began to weaken, and on 19 November the<br />
residual low-level circulation drifted<br />
southwestward with the prevailing northeast<br />
monsoon. By the time Wilda had dissipated,<br />
Yuri (30W) had formed in the southern<br />
Marshall Islands and was slowly intensifying.<br />
Super Typhoon Yuri was the most intense<br />
tropical cyclone of the year, with maximum<br />
sustained winds estimated at 150 kt (77 m/see)<br />
and an estimated minimum sea-level pressure<br />
of 885 mb. It also was the most intense<br />
cyclone to pass within 60 nm (110 km) of<br />
Guam since Typhoon Karen (1962). Yuri’s<br />
steady rate of intensification to a super<br />
typhoon without an episode of explosive<br />
deepening was unusual. High water and<br />
waves caused extensive damage to low-lying<br />
areas in the southeastern part of Guam. Yuri<br />
was also the largest typhoon to affect the<br />
western North Pacific in many years, growing<br />
to a diameter of over 900 nm (1665 km) a day<br />
after passing Guam. As Yuri bore down on<br />
Guam, Zelda (31W) developed in low<br />
latitudes near the international date line.<br />
T~hoon Z&la was the last tropical cyclone of<br />
the year, and the fifth midget. Intensii3cation<br />
during the early stages of its development was<br />
overlooked because of its very small size.<br />
Zelda caused considerable damage to the<br />
lightly constructed buildings and homes on<br />
Kwajalein and the nearby islands and atolls,<br />
and caused several injuries.<br />
31
E 100 105 110 115 120 125 130 135 140 145 150 155 160 165 170 175 180 ~<br />
N 50<br />
45<br />
40<br />
35<br />
OIWT’SSHARON03 MAR-<br />
02W TY TIM<br />
04W STY WALT<br />
05W TY YUNYA<br />
06W TY ZEKE<br />
07W TY AMY 12 JUL<br />
16 MAR<br />
.,,: .:, .‘;<br />
..........<br />
..........<br />
.,:,,,, ,..:, ;<br />
30<br />
,.. : .:. ,<br />
..,.:,...,,,,,,, .. .,,;.,,,,. . ........... ... .. . ..:.,,..,.. .. . .:-,.,..<br />
g<br />
25<br />
Y Brendan<br />
20<br />
:. ‘;<br />
.<br />
15<br />
‘., ..<br />
,, :.:<br />
10<br />
:.:...<br />
5<br />
E()<br />
MAXIMUMSUSTAINEDSURFACEWL<br />
~ 64KT (33M/SEC) OR --- GREAT ---—-- ●.*-==< :<br />
IDgaa,DmmcmM TO tj3KT (18 ~<br />
Doooooo oo33KT(17M/$3Ec)(<br />
[<br />
Q* wqt : ;<br />
‘,’ .. : ,, “ :.: ..,.....’.. “’..:. .’. i ba~ wa<br />
..................................... .. .. . . .. ...
E 100 105 110 115 120 125 130 135 140 145 150 155 160 165 170 175 180<br />
N 50<br />
., , ....<br />
ZFE%Es7 ..’”.”( ‘“:’<br />
; ,s’ ;<br />
,;,:.<br />
.,... ..~<br />
45<br />
~we..i..,,.,,<br />
‘“;’’”””’”’”””i”s+k:l<br />
.:-+T.i:.<br />
-,...,......... .... :<br />
.. .<br />
-----<br />
TS Dc<br />
40<br />
35<br />
30<br />
w 25<br />
20<br />
15’<br />
06E TS ENRIQUE 31 JUL - 02<br />
10W TS DOUG 07 AUG - 11<br />
llW TY ELLIE 08 AUG - 19<br />
12W TY FRJ.D 08 AUG - 18<br />
13W TD 13W 11 AUG - 15<br />
14W TY GLADYS 13 AUG - 24<br />
15W TD 15W 21 AUG - 30<br />
16W TS HARRY 27 AUG - 01<br />
17W TY IVY 31 AUG - 10<br />
18W TS JOEL<br />
19W TY KINNA<br />
01 SEP - 07<br />
08 SEP - 15<br />
20W TS LUKE 13 SEP - 19<br />
21W STY MIREILLE 13 SEP - 28<br />
22W TY NAT 15 SEP - 02<br />
TS Joel<br />
AUG<br />
AUG<br />
AUG<br />
AUG<br />
AUG<br />
AUG<br />
AUG<br />
SEP<br />
SEP<br />
SEP<br />
SEP<br />
SEP<br />
SEP<br />
(XT<br />
.,...,<br />
,... ,.,<br />
.:,..<br />
.<br />
.... ,,T<br />
k<br />
:.<br />
..,,<br />
,:: ;:.,<br />
,::;.,.,,,<br />
.:.,,,, .,.. .,,,.,,,s’. ..<br />
)<br />
1e,m<br />
.!,, ,:’<br />
... .. ,.<br />
;“.,<br />
,.:<br />
... ..:<br />
, . . . . . . . . . ...Tyj.&at..<br />
,.. .<br />
,::’<br />
: /<br />
T<br />
~TYK&na ‘*<br />
● :~IvJ<br />
4:<br />
ti<br />
;’;<br />
:s: .......<br />
:9!<br />
:s:<br />
[<br />
,<br />
/ ~+<br />
. * ..+ .<br />
●.a :<br />
,;<br />
,;<br />
‘o ~<br />
6<br />
Q %.::*<br />
.,,,..,., ,,,.,,,!., ........ . .,, ,..,1,. ., ,,,<br />
●*T<br />
%4<br />
:% :<br />
Ellie<br />
TDI.$W......:.:0...4!<br />
, >T I 13W<br />
i<br />
-<br />
4<br />
,.TS.D<br />
,,.,:,.,j,TYGli<br />
g<br />
!Ys,...,,...<br />
Enriq<br />
A m8<br />
.... .......<br />
s<br />
●<br />
●<br />
,.,,, 4<br />
Ug<br />
TS E<br />
.m..e,i<br />
rique<br />
10<br />
\<br />
TYM<br />
:ille<br />
5<br />
EQ<br />
~:1<br />
MAXIMUMSUSTAINEDSURFACEWIND ..................j..................j.................<br />
¤-s~sa-,u~n~ To 63KT (18 TO 32~sEc)<br />
soooosaoc 33KT (l~sEc) OR LESS<br />
,,:. ..’ ,.,.. .... ., .<br />
.,,,.: .’., ..;:,,I<br />
TYI<br />
L....
..iA ~... ..!<br />
d<br />
,:; .-:.,,<br />
.. .... ..... .........’., x<br />
.,,..- 17 ~ . ... . ... ....
Intentionally left blank.<br />
35
W“H!I -W”<br />
......................<br />
:., .,:,<br />
......................<br />
~<br />
m“<br />
.................................................... . .... ...<br />
L<br />
$:<br />
““”””””-””””””””””””””<br />
I&)g<br />
:1 D/ Y/<br />
+ ~<br />
......................................................... e-<br />
............................. .................................<br />
..<br />
.:,<br />
,.3.,. :<br />
.........................-<br />
m’<br />
w<br />
~<<br />
,.,,,<br />
‘,. ,,’.’..: ::,,..<br />
-.-,.... .. ... .. . ..:-<br />
. . ,.<br />
......-v’)=<br />
.:’ m ‘..-<br />
. :<br />
. .:<br />
:.,.<br />
:$<br />
. .... .,..<br />
... .<br />
.. .<br />
. . . :,,.. .,.-J<br />
“..<br />
. ..................<br />
L.<br />
‘::..:..,....<br />
“.::<br />
z<br />
ii<br />
w<br />
,,, ..<br />
.::<br />
,,, x,, .::,..,..<br />
““” .. .. . ....’.”.,, ,.,, ,... ,.<br />
u)<br />
m<br />
36
TROPICAL<br />
STORM SHARON (OIW)<br />
Figure 3-01-1. Tropical<br />
Storm Sharon near peak<br />
intensity east of Yap<br />
(062234Z March DMSP<br />
visual imagery).<br />
Sharon, the f~st tropical<br />
cyclone of 1991 in the<br />
western North Pacific,<br />
developed the first weekof<br />
March in conjunction witha<br />
burst of low-level westerly<br />
winds that extended eastwani<br />
along the equator from New<br />
Guinea to the international<br />
date line. Its persistent<br />
convection was initially<br />
discussed on the 0306002<br />
Significant Tropical <strong>Weather</strong><br />
Advisory. Increased deep<br />
convection around the<br />
partially exposed low-level<br />
circulation center prompted<br />
the issuance of the 0504512<br />
Tropical Cyclone Formation<br />
Alert. The tropical cyclone<br />
developed slowly due to<br />
persistent upper level shear<br />
on the eastern side of the<br />
convective cloud mass. The<br />
first warning, valid at<br />
0518002, dld not forecast<br />
further intensification to a<br />
tropical storm because of the<br />
amount of shear evident from satellite imagery. However, as Sharon tracked steadily westward, it<br />
reached a peak intensity of 60 kt (30 m/see) south of Yap before the central dense overcast sheared apart<br />
east of Belau. Koror (WMO 91408) reported light winds as the broad circulation center passed over<br />
Belau on 11 March, then the sustained surface winds increased to 30 kt (15 m/see) as Sharon moved<br />
west of the station. Later, as the tropical cyclone continued to weaken over the central Philippine<br />
Islands, <strong>JTWC</strong> issued the final warning at 140000Z. The remnants of Sharon continued westward<br />
across the South China Sea and dissipated over southeastern Vietnam on 16 Ma.mh.<br />
37
............. .. .. ...<br />
. . . .. .. . . ....<br />
. .<br />
z-<br />
. .. .<br />
+“”w+w<br />
........................<br />
m<br />
b< m<br />
. ... ...... .<br />
+<br />
%<br />
.........................<br />
I<br />
$&<br />
-“””-””.=!<br />
1<br />
-+0 -<br />
........................<br />
........................<br />
........................<br />
+++<br />
+4<br />
4<br />
0/<br />
* .........................<br />
m<br />
+<br />
*.+.. s....~ P<br />
><br />
m<br />
/’<br />
/<br />
1<br />
. -u. ..... .....<br />
u<br />
g<br />
><br />
a<br />
o<br />
u)-<br />
vl<br />
/<br />
0<br />
u<br />
..................~.... /<br />
w,<br />
.<br />
I<br />
+8<br />
hm<br />
m<br />
>.4<br />
. .. a .&.<br />
so (-v<br />
.................... 2<br />
1<br />
k<br />
.. . . ...*<br />
)<br />
: /<br />
\ ●<br />
,: :<br />
(<br />
.. .. . . . . .<br />
\<br />
\<br />
*Ẏ .....<br />
o<br />
w<br />
~<br />
~o”<br />
●<br />
).... . . . . . . . . . . . . . . . . . . .<br />
..g. .............<br />
\<br />
s<br />
g<br />
\<br />
\m s<br />
WI<br />
L......................<br />
.<br />
. . .<br />
u<br />
...................
TYPHOON TIM (02W)<br />
I. HIGHLIGHTS<br />
Tim was the second tropical cyclone to develop in the eastern Caroline Islands during the<br />
month of March. It was the first March typhoon since 1982, and marked only the third time since the<br />
Joint Typhoon Warning Center was established in 1959 that multiple storms occurred in March. The<br />
recurvature track taken by Tim proved to be a difficult challenge for <strong>JTWC</strong> forecasters to predict,<br />
because the primary prognostic guidance was slow to predict the changing synoptic situation. Average<br />
forecast errors for Tim were the largest of any Northwest Pacific tropical cyclone forecast in 1991.<br />
II. TRACK AND INTENSITY<br />
As the Southern Hemisphere Ti-opical Cyclone, 16P (Cynthia), intensified in the Coral Sea on<br />
18 March, analysis of the surface and gradient-level wind flow in the tropics indicated that a westerly<br />
surge was again established along the equator east of New Guinea. Just two weeks after Sharon (OIW)<br />
formed in the eastern Caroline Islands, the near-equatorial trough reestablished itself in the same area<br />
with associated pressure falls and increased cloudiness. The frost mention of a developing tropical<br />
disturbance (Tim) appeared on the 18 March Significant Tropical <strong>Weather</strong> Advisory. Later, based on a<br />
38 kt (20 mkc) gradient-level wind at Pohnpei (WMO 91348) and a 2-day pressure fall of 2 to 3 mb, a<br />
Tropical Cyclone Formation Alert was issued at 200500Z. The fmt warning on Tropical Depression<br />
02W followed at 21OOOOZwhen satellite imagery located a poorly defined cloud vortex that was<br />
aligned with the synoptic data.<br />
As it tracked northwestward, Tim was upgraded to a tropical storm at 21 1800Z due to an<br />
increase in the amount of deep convection. The track became more northerly as a series of fast-moving<br />
short waves in the polar westerlies eroded the narrow subtropical ridge, allowing Tlm to move towards<br />
the break in the ridge. At 230600Z, typhoon intensity was attained when Tlm developed a large, mgged<br />
eye (Figure 3-02- 1). Tim arrived at its point of recurvature 420 nm (780 km) east of Saipan. Twelve<br />
hours after recurvature, the typhoon reached a peak intensity of 70 kt (35 m/see) and then began to<br />
weaken gradually due to increased vertical shear. Tlm transitioned to an extratropical low on 25 March.<br />
III. FORECAST PERFORMANCE<br />
<strong>JTWC</strong>’S larger than average overall forecast errors on this typhoon were a consequence of<br />
over-reliance on guidance from its primary aids (Figure 3-02-2) which weren’t representative of the<br />
changing synoptic situation. Initially, the majority of <strong>JTWC</strong>’S forecast aids indicated Tim would move<br />
along a climatologically favored west-northwestward track, steered by the flow south of the narrow<br />
subtropical ridge. Post-analysis of the synoptic situation showed that T~hoon Tim tracked northnorthwestward<br />
into a neutral point in the subtropical ridge located east of Saipan. This neutral point<br />
was identified in the 200000Z NOGAPS prognostic series used to develop the fmt warning, but based<br />
on the depiction of the forecast aids, recurvature was not considered a likely scenario. Recurvature was<br />
discussed as a moderate probability alternate scenario on <strong>JTWC</strong>’S fmt warning, but when the dynamic<br />
aids OTCM and FBAM continued to indicate Tim would turn to the west and mnain south of the ridge<br />
axis, the recurvature philosophy was discarded in favor of a “stairstep” track which agreed more closely<br />
with the prognostic aids. Supporting NOGAPS prognostic fields indicated the portion of the subtropical<br />
ridge east of the neutral point would build westward (and to the north of the cyclone) and cause Tlm to<br />
continue moving northwestward. <strong>JTWC</strong> warnings reflected this forecast reasoning, and as a result,<br />
39
failed to identify in the early stages of development that Tii’s more northward motion was a precursor<br />
to recurvature. In particular, <strong>JTWC</strong>’S overall best performing forecast aid, OTCM, missed the<br />
recurvature point entirely.<br />
Typhoon Tim intensified at a normal rate of development, and its intensification and<br />
extratropical transition were well forecast by <strong>JTWC</strong>.<br />
IV. IMPACT<br />
No reports of significant damage or loss of life were received as Tim remained over ouen<br />
.<br />
ocean well away from land during its life.<br />
Figure 3-02-1. Satellite imagery of the<br />
large, cloud-fiiled eye of Typhoon Tm<br />
qmkmately 12 hours @or to reaching<br />
maximum intensity (23043 12 March<br />
NOM ViSUd imqyry).<br />
40
u<br />
10<br />
N9<br />
a<br />
:*<br />
,*’<br />
:.<br />
,<br />
:.<br />
: .“<br />
/<br />
.. ............. ..,..;...,..,. .<br />
\<br />
. ..... .......!.....,.<br />
y<br />
.: :,<br />
f<br />
<<br />
-%<br />
~ !~:0<br />
‘1<br />
●<br />
t<br />
..................c! ......................+........................<br />
E 105<br />
N 35<br />
30<br />
25<br />
20<br />
15<br />
110 115 120 125 130 135 140 145 150<br />
..,: ,.. ::. ,,,: :.... ......,.<br />
,:.: ;.,., ..... .. : .:.;: :.., : ,.. “’., :. {<br />
,,., ,., LEGEND<br />
TROPICAL STORM VANESSA “ / .~:;:’”’:.::;;::: ”:....:;“ ..”’ ~<br />
BESTTRACK TC-03W .:...:....’..:: ;.,..,,:.. U 6-HRBEST TRACK PO<br />
~; .:. ,:<br />
SPBED OF MOVEMBN’<br />
20 APR-28 APR91<br />
..,.,.:.<br />
: .,.. : INTENSITY (KT)<br />
MAXSFCWIND45KT<br />
POSITION AT XX/WICO<br />
MINIMUMSLP991MB<br />
:................~..............................................!....#......~.................................... OO&OTROPICAL DIsmWA<br />
~ TROPICAL DEPRESSIC<br />
,.,.:,..,<br />
,:<br />
.. ! ---- ‘IROPICALSTORM<br />
— TYPHOON<br />
....<br />
!<br />
.,, ,:: : SUPER TYPHOON STA<br />
..; .... ;<br />
..:<br />
$ SUPER TYPHOON EPW<br />
,.. ,....’ : ,,<br />
EX’IRATROPICAL<br />
.................<br />
:,.........,0...-..;....................---t<br />
.,<br />
................................................ =..--...} . ...... %$$ SUBTROPICAL<br />
{ ..’ .,.<br />
,: : ,.,<br />
*IW DISSIPATING STAGE<br />
..,, :: :<br />
,.. ., FJRST WARNING ISSU<br />
.... :: ..<br />
:.., .“ : LAST WARNING ISSU1<br />
‘..”’.. ,, “.“;”<br />
. ,...: : .:;<br />
.... ... . ...”.. 4...:.’.’<br />
..” ..................,...:,,, ,), .<br />
,,. :***..............i........................~<br />
............................................. ..,+.,,,...,,, ~ ..... .................... ...............,,.,,...,,,., ,,,.,...,,., ........... . ...........,,,<br />
;~~ L-2+16Z ~ ,... . ~ ; [ { ;“;, ~<br />
::<br />
;:.. :.., ;<br />
,,<br />
.<br />
~0”. ;: Q8 ~ .:! .: :.’<br />
4=.--: ......4... ‘i . :“””... ..! ......... ..../. . ..............j............. . ...[ . .....i.........................i.........<br />
— 155E<br />
10<br />
5<br />
EQ<br />
““”.,::.45Jy~,.J~<br />
3(J 3(j,..,,,’/. ,, ,,,,,,,;...,... x ,12~~~...EF.+JL.”+o<br />
.. ................+..... . ............ .<br />
, . ; ,,.<br />
..:. : .,..<br />
....<br />
.<br />
...”” ,..,<br />
...... ; .::’<br />
i.. ,. ;.. .,:. ,, ,.:,,. ~25b ~<br />
.,,,. .: . , ~BPW [<br />
,,.,<br />
,.:.:,. ;...’. ,......’....<br />
-., ,,,.. : .,.,::.. ,,.. .:‘“ :<br />
;!’ ‘“.;eofoooo[.o;j;o<br />
. .<br />
..........<br />
-
TROPICAL<br />
STORM VANESSA (03W)<br />
Figure 3-03-1 The exposed low-level center of Tropical Storm Vanessa approaches the coast of Vietnam<br />
(2719052 NOAA April enhanced infrared imagery).<br />
After Typhoon ’13m(02W) in mid-March, the near-equatorial trough remained relatively inactive<br />
until Vanessa’s convection flared up to the south of Guam over a month later. This disturbance with its<br />
persistent convection was first mentioned in the Significant Tropical <strong>Weather</strong> Advisory on 21 April. A<br />
Tropical Cyclone Formation Alert was issued at 230500Z when animated satellite imagery revealed that<br />
individual thunderstorms had started rotating cyclonically about a singular point. At 2312002, the alert<br />
was followed by the fmt warning on Tropical Depression 03W, based on a 30 kt (15 rnkc) ship report.<br />
Vanessa did not intensify as it tracked south of the subtropical ridge and across the central Philippines.<br />
Twenty-four hours after leaving the Philippine Islands, it reached tropical storm intensity at 260000Z,<br />
based on a satellite intensity estimate of 35 kt (18 m/see). Vanessa peaked at 45 kt (23 rrdsec) in the<br />
South China Sea at 2618002. Less than a day later, vertical wind shear caused Tropical Storm Vanessa<br />
to weaken rapidly. Satellite imagery showed that Vanessa had completely lost its deep central<br />
convection. This prompted the <strong>JTWC</strong> to issue its final warning at 2806002. Embedded in the<br />
prevailing low-level flow, the remnants of Tropical Storm Vanessa moved northward through the axis of<br />
the subtropical ridge, and dissipated southwest of Hong Kong.<br />
43
E 110 115 120 125 130 135 140 145 150 155 160 165 170 175 180<br />
N 45<br />
40<br />
35<br />
30<br />
~<br />
25<br />
20<br />
15<br />
10<br />
5<br />
EQ
SUPER TYPHOON WALT (04W)<br />
I. HIGHLIGHTS<br />
Walt was the fmt super typhoon in the western North Pacific this year and the only significant<br />
tropical cyclone to form in May. It developed as part of an equatorial convective process known as a<br />
“westerly burst” (Lander, 1990) at the same time a twin, Tkopical Cyclone 21P (Lisa), developed in the<br />
Southern Hemisphere.<br />
II. TRACK AND INTENSITY<br />
The cloud system that was to become Walt developed in low latitudes in the eastern Caroline<br />
Islands in tandem with Tropical Cyclone 21P (Lisa) in the Southern Hemisphere in the Coral Sea. The<br />
evolution of these twins is graphically portrayed as cloud silhouettes in Figure 3-04-1. The tropical<br />
disturbance initially tracked northwestward towards a weakness in the subtropical ridge north of Guam.<br />
However, the subtropical ridge strengthened, built westward, and forced Wdt to take a more westnorthwesterly<br />
track. The tropical cyclone kept on this course for ten days until recurvature occurred<br />
early on 15 May. Then, Walt interacted with the polar westerlies aloft and accelerated eastnortheastward.<br />
Extratropical transition occurred on 16 May as Walt merged with a passing frontal<br />
system.<br />
In review, the persistence of Walt’s convection prompted first mention on the Significant<br />
Tropical <strong>Weather</strong> Advisory at 040600Z. At 060200z a Tropical Cyclone Formation Alert followed the<br />
report of a 23 kt (12 mkc) gradient-level wind at Chuuk (WMO 91334) and a 30 kt (15 rn/see) ship<br />
report. Cyclonic rotation of the convective cloud elements on the animated satellite imagery and 20-30<br />
kt (10-15 m,kc) synoptic reports resulted in the issuance of the first warning at 061800Z. The upgrade<br />
to tropical storm intensity at 070000Z resulted fkom a Dvorak intensity estimate increase and another<br />
30 kt (15 m/see) ship report. A typhoon intensity estimate resulting from the appearance of a ragged<br />
eye prompted a warning upgrade to typhoon at 090000Z. Intensii3cation continued, reaching a peak of<br />
140 kt (70 m/see) at 120600Z. As Walt approached the axis of the subtropical ridge, the vertical shear<br />
increased and the typhoon’s cloud shield elongated southwest to northeast (Figure 3-04-2). Slow<br />
weakening set in and continued through extmtropical transition which occuned at 161800Z.<br />
III. FORECAST PERFORMANCE<br />
The overall track errors were 70 nm (130 km), 150 nm (275 km) and 225 nm (420 km) for the<br />
24-, 48-, and 72-hour forecast, respectively. OTCM, CSUM and NOGAPS also did well and<br />
demonstrated skill in comparison with CLIPER.<br />
The intensity forecasts were not as skillful. Although rapid intensification and peaking at super<br />
typhoon intensity were discussed early in the prognostic reasoning messages, it remained an alternate<br />
scenario. However, once rapid intens~lcation began, <strong>JTWC</strong> did do a much better job of forecasting<br />
peak intensity and the weakening trend. Accurate forecasts near Guam prevented DOD and the<br />
Government of Guam from taking expensive unnecessary precautions saving upwards of US$3 million.<br />
IT IMPACT<br />
Even though Walt passed near Guam, northern Luzon and Okinaw& no nqwrts of significant<br />
damage were received.<br />
45
w<br />
140E<br />
160E<br />
20s—<br />
2oh<br />
4@pllpEQ<br />
●:Y4“qI&\ . .<br />
20s<br />
ME 140E 160E<br />
EQ<br />
k<br />
B<br />
SMAY<br />
\<br />
140E MOE<br />
—<br />
i s ZONt<br />
4<br />
m’ ,<br />
Z<br />
●v<br />
MOE MOE<br />
I<br />
GUA<br />
w’ %<br />
“ ,4<br />
-0<br />
s<br />
6 MAY<br />
a<br />
B<br />
20s<br />
10MAY<br />
Figure3-04-1.Silhouettes of deep cloudiness are asswiated with the ‘Swesterlv burst” for the neriod 03<br />
to 10 May. A 40 kt (20 rn/see) &p repofi which also cited blowing spray, & the equator o; 05-M-~<br />
is unusually strong. As the equatorial convection and westerlies dtxxease on 7 May, the cloudiness<br />
consolidates in the twin cyclones in opposite hemispheres.<br />
46
Figure 3-04-2. Walt shows first indications of vertical shear on system forcing the<br />
overall elongation of the cloud shield along an axis from southwest to northeast<br />
(141120Z May NOAA enhanced infrared imagery).<br />
47
.......................................<br />
.......................................<br />
. ..<br />
k<br />
.........................................................g.... ............<br />
......................................<br />
s<br />
M<br />
s<br />
5 “’k .,<br />
v)<br />
. ...<br />
::,. .... .. .. ..<br />
4<br />
.. .. ... .<br />
. ... . .. . .<br />
.*<br />
-“<br />
a ::’ .. . :,<br />
\<br />
04<br />
~~ >~ : ‘ ‘. .,.<br />
k .. .. ,.. -<br />
.<br />
.,,<br />
.....................<br />
-.<br />
,: ..’.<br />
: ........ :<br />
.,. ,<br />
,.,.::<br />
.::......<br />
.,’.<br />
.. .<br />
48
TYPHOON YUNYA (05W)<br />
1. HIGHLIGHTS<br />
Typhoon Yunya, the first significant tropical cyclone of June, broke a nearly month-long lull in<br />
activity in the western North Pacific. Yunya was noteworthy because a ship transited through its center,<br />
providing a unique glimpse of the structure of a rapidly-developing midget typhoon. Its passage<br />
through central Luzon coincided with the massive eruption of Mount Pinatubo and subsequent<br />
evacuation of personnel horn Clark AB.<br />
II. TRACK AND INTENSITY<br />
Yunya formed just east of Samar Island, Republic of the Philippines, in an area of low vertical<br />
wind shear associated with a CO1produced by a Tropical Upper Tropospheric Trough (TU’IT). Unlike<br />
normal TUTT-induced tropical cyclone genesis which occurs in the region of strong upper-level<br />
divergence between the TUTT and the sub-equatorial ridge circulation to the southeast, Yunya’s<br />
formation occurred southwest of them axis.<br />
The broad disturbance which spawned Yunya was fmt discussed on the 1106OOZSignificant<br />
Tropical <strong>Weather</strong> Advisory. Between 1112002 and 1212002, all surface reports within 100 nm (185<br />
km) of the low-level circulation were less than 10 kt (5 m/see). After a Tropical Cyclone Formation<br />
Alert was issued at 1215002, the system began to rapidly develop. At 1217302, a satellite analysis<br />
based on spiral band curvature estimated a maximum intensity of 30 kt (15 m/see). Post analysis<br />
revealed a tiny central dense overcast (CDO) supporting 45 kt (23 rnkc). Then, at 1218362 the USNS<br />
Spies passed through the center of the system, and reported a central pressure of 989.5 mb with winds<br />
of 60 kt (30 m/see). At 130000~ <strong>JTWC</strong> issued its frostwarning on Yunya with an intensity of 45 kt (23<br />
mkc) was based on a conversion horn observed minimum sea-level pressure to maximum sustained<br />
surface wind using the Atkinson-Holliday (1977) relationship. Post analysis determined the actual<br />
intensity was closer to 55 kt (28 m/see).<br />
Yunya reached minimal tropical storm intensity after existing for only 21 hours and minimal<br />
typhoon intensity in only 39 hours. In so doing, it did not exhibit the classic tropical cyclone<br />
development traits, but those of rapid initial development, small surface wind field, and peripheral<br />
surface pressure rises presumably associated with subsidence generated by a tiny annular outflow<br />
pattern aloft. These traits are found to be common with “midget typhoon” development. The fortuitous<br />
(for meteorologists) passage of the USNS Spica near the center of Yunya confined its midget size via<br />
the pressure &ace shown in Figure 3-05-1. The wind observations reported by Spica indicate that the<br />
Figure 3-05-1. Time pressure cross-section !<br />
reconstructed from data provided by the USNS<br />
Spica, which pSSSd diIeCtly through the center B<br />
of Yunya on the 12 of June. :<br />
i<br />
locm~<br />
1004 (L<br />
USNS SPICA PASSAGE THROUGH<br />
YUNYA<br />
1C02<br />
b, \. . b:zl<br />
s-<br />
1000
area of winds greater than 30 kt (15 m/see) was transited in a mere 5 hours. Since Spies’s course and<br />
speed were reported as 286 degrees true at 16 kt (30 km/hr) for the duration of the transit, the associated<br />
30 kt (15 m/see) wind diameter for Yunya at this time was about 80 nm (150 km).<br />
After moving northwestward for a day during its formation phase, Yunya then tracked westnorthwestward<br />
toward central Luzon under the influence of the mid-level subtropical ridge. Yunya<br />
steadily intensifkxi at a rate of 10 kt (5 m/see) per 6 hours until 140600Z when it attained its peak<br />
intensity of 105 kt (55 m/see) (Figure 3-05-2). Subsequently, strong north-northeasterly upper-level<br />
winds associated with an eastward building of the subtropical ridge circulation over Asia produced<br />
unfavorable vertical wind shear. As this shear (Figure 3-05-3) persisted, Yunya began to weaken even<br />
faster than it had intensified, having only minimal typhoon intensity as it made landfall just north of<br />
Dingalan Bay at 150000Z. Apparently, the midget size of the typhoon could not effectively buffer its<br />
core of convection horn the shear. Yunya exited Luzon though the Lingayen Gulf as a weak tropical<br />
storm, and subsequently turned north toward a break in the subtropical ridge. The system continued to<br />
weaken due to strong vertical wind shear, grazing the southern tip of Taiwan as a tropical depression,<br />
and dissipating before it could complete full recurvature into the mid-latitude westerlies.<br />
Figure 3-05-2. Yunya at peak intensity. Note<br />
the distortion of Yunya’s cloud signature due<br />
to increasing upper-level north-northeasterly<br />
winds produced by a building subtropical<br />
ridge (1405342 June NOAA visual imagery).<br />
50
III. FORECAST PERFORMANCE<br />
The fmt two track faecasts issutxi by <strong>JTWC</strong> had Yunya moving in a northwestward direction<br />
toward a thin extension of the mid-level subtropical ridge, eventually grazing the northeast tip of Luzon<br />
(Figure 3-05-4). By the third warning however, <strong>JTWC</strong> comctly anticipated that Yunya’s midget size<br />
Figure 3-05-3, NOGAPS 200-mb analysis at<br />
150000Z June showing an increased ujper-level<br />
shear over Yunya. The <strong>JTWC</strong> handplotled/malyzed<br />
chart for this same this showed<br />
up to 40 kt (20 m/see) 200-mb winds in the<br />
vicinity of Yunya. (Winds witbin the shaded<br />
area of the snalysis are 30 kt (15 m/see) or<br />
greater.)<br />
EllS<br />
N2S<br />
~Kl !<br />
2* .. .... .... “*...............}....<br />
124 22s M 13SE<br />
. . ....... .......................<br />
PIRST2 IUACX @UCASTS<br />
Pigure 3-054. Graphic of sll ITWC<br />
official forecssts issued for Yunya,<br />
1s<br />
....................................... ‘} -<br />
......................................................................................<br />
&<br />
N10<br />
51
would prevent significant penetration into the thin ridge, and that Yunya would instead be steered<br />
around the periphery of the ridge, resulting in a track across central Luzon. After Yunya crossed Luzon,<br />
it turned toward the ridge axis sooner than anticipated, highlighting the sensitive and subtle interplay<br />
between tropical cyclone and weak ridge near the point of recurvature.<br />
Figure 3-05-5 shows the objective forecast guidance that <strong>JTWC</strong> used to develop the 140000Z<br />
forecast, and Figure 3-05-6 shows the 48-hour NOGAPS 700-mb prognostic field associated with the<br />
mid-point of the 72-hour forecast period beginning at 140000Z. From these figures, it is evident that<br />
<strong>JTWC</strong> had to discount the track forecasts by the dynamical models NGPS and OTCM which tended to<br />
turn Yunya prematurely through the thin subtropical ridge. Forecasters placed more weight on<br />
climatology (CUM), CSUM (statistical-dynamical) and FBAM (a steering-type dynamictd aid) which<br />
provided better guidance, but which historically tend to be slow to forecast recurvature. It is interesting<br />
to note also that the Japanese Meteorological Agency Typhoon Model (JTYM) and the United Kingdom<br />
Meteorological OilIce Model (EGRR) also forecast Yunya through the thin ridge extension, suggesting<br />
that this problem is endemic to the current generation of vortex-tracking numerical models. With the<br />
midget typhoon, the model’s inability to accurately describe the cyclone-ridge interaction may be a<br />
resolution problem.<br />
Despite a slow speed bias, <strong>JTWC</strong>’S forecasts of Yunya across Luzon provided key warning<br />
support which helped prompt DOD officials to evacuate the Clark and Subic areas in anticipation of the<br />
devastation to be caused by the Mount Pinatubo ash moistened and redirected by Yunya.<br />
IV. IMPACT<br />
Yunya made landfall in central Luzon near midday on 15 June, and the associated heavy<br />
rainfall caused flooding that washed away bridges and left one person dead. However, this direct<br />
impact of Yunya was relatively minimal compared to its subsequent influence on the massive cloud of<br />
ash produced by the eruption of Mount Pinatubo on the same day. As Yunya crossed central Luzon, its<br />
deep cyclonic circulation redistributed the ash, that normally would have been camied out over the<br />
South Chiia S% over land. This greatly aggravated the impact of the water-laden ash fall-out on Clark<br />
AB and at the Subic Bay/Cubi Pt naval complex, resulting in the downing of power lines and the<br />
collapse of most flat-roofed buildings due to overloading.<br />
Uo X25 no 13SE<br />
m<br />
...................<br />
................................<br />
Figure 3-05-5. Graphic of <strong>JTWC</strong> official<br />
forecaat and the aaaociated objective fmecaat<br />
aids valii at 140000Z June.<br />
. .. .. .. . . . ,...: ........... . . . . . . .........<br />
............ . . .....<br />
52
E 110 115 120 125 $30 135 140 145 150 155 160E<br />
N40<br />
35<br />
30<br />
25<br />
20<br />
15<br />
N 10<br />
Figure 3-05-6. NOGAPS 700-rob 4S-houc pgnostic field valid at 1512~ which is the midpoint of the forecast period<br />
begimling at 140000z.
E 100 .. —- 105 110 115 120 125 130 135 140 145 E<br />
N3U<br />
25<br />
25<br />
.<br />
<<br />
11<br />
:<br />
,,.:’.....<br />
,,,:, :<br />
.,,<br />
,,.,,.,.,,,,, .............,.,<br />
TYPHOON ZEKE<br />
BESTTRACK TC-06W<br />
06 JUL- 14JUL91<br />
MAXSFCWIND80KT<br />
MINIMUMSLP963MB<br />
**** \ .<br />
,.,,., ..<br />
..<br />
.,:..<br />
20<br />
L - 14/12Z<br />
@ss<br />
.... .....50.$5.4<br />
. ........ \ . . ....... .....<br />
..,,,,,..,,,. ,,,..,,,....<br />
/<br />
1010 1(-J12<br />
E 15<br />
:.....J................1A . .<br />
●... & . ““-”‘“:2<br />
. .... ... ...............<br />
,. .<br />
,,,. ., .:.::. > :<br />
,,’ :<br />
Ii<br />
BI12Z<br />
10<br />
5<br />
LEGEND<br />
<br />
.: $<br />
.’,<br />
6-HI BEST ‘llUCK POSllTON<br />
SPEED OF MOVEMENT w)<br />
INTENSITY (m)<br />
POSITION AT XXKUIUZ<br />
TROPICALDISTURBANCE<br />
TROPICALDEPRESSION<br />
‘IROPICALSTORM<br />
TYPHOON<br />
SUPBR TYPHOON START<br />
SUPER TYPHOON END<br />
BKTRATROPICAL<br />
SUBTROPICAL<br />
DISSIPATING STAGE<br />
PIRST WARNING JSSUED<br />
IAST WARNING ISSUED<br />
....,+.., +<br />
,,’<br />
..:<br />
,...,<br />
..<br />
.:,.:<br />
:,<br />
...<br />
.%+-,,,,,,, k,,., ~A”~, \,,.::”:,_<br />
,.’ :<br />
.:. ..’<br />
...<br />
.,, .<br />
.....<br />
: :.:<br />
., ..<br />
,,:,<br />
..<br />
., ...’ ...”<br />
:,. ‘, . ...<br />
, . . . .. . . . . .<br />
“. .:,<br />
,:.,<br />
‘~. ,,<br />
:,,<br />
.:.’<br />
“.., ,.<br />
..,,. -+,..”,.,.-,-..,.,-..,., .,<br />
P%ooeoe<br />
.<br />
,<br />
... . ...........<br />
,~--,--. --’------: : ~ . . . . . . . . —.., . . ....’’...<br />
@o<br />
ABr$v<br />
%0 ;<br />
0:<br />
/’<br />
.... ...... .... ..........!.. . . . . . . . . . . . .,, ,,, ,,, ,.. . ,.,<br />
oc~<br />
EQ<br />
,..: .. .....
TYPHOON ZEKE (06W)<br />
I. HIGHLIGHTS<br />
Starting in the Philippine Sea, Typhoon Zeke (06W) made landfall three times before it<br />
dissipated over the mountains of northern Vietnam. Zeke was the first tropical cyclone to develop<br />
during the month of July, and initiated a period of nearly continuous warning status on at least one<br />
tropical cyclone in the Northwest Pacific through early December.<br />
II.TRACK AND 1NTENSIT%<br />
For the most part, the subtropical ridge provided the primary steering for Zeke’s persistent<br />
track to the west-northwest. The slight northward jog across the Philippine Islands from the basic track<br />
appears related to a surge in the southwesterly monsoonal flow over the South China Sea.<br />
Zeke developed from a tropical disturbance in the monsoon trough southwest of Guam.<br />
Increased convection associated with the disturbance was fmt mentioned on the 060600Z Significant<br />
Tropical <strong>Weather</strong> Advisory. When the cyclonic circulation became evident on animated satellite<br />
imagery, a Tropical Cyclone Formation Alert was issued at 090400Z. The first warning on Tropical<br />
Depression 06W followed at 091200Z as the deep convection steadily increased around the cyclone’s<br />
center. Zeke crossed the Republic of the Philippines as a depression and was upgraded to a tropical<br />
storm once it moved over open water in the South China Sea on 10 July. Synoptic reports from ships in<br />
the South China Sea revealed a highly asymmetric wind distribution around the cyclone center. The<br />
radius of 30 kt (15 mkc) winds extended over 250 nm (465 km) southeast of the center, but less than<br />
100 nm (185 km) to the northwest. This asymmetry appeared related to an adjustment of the monsoon<br />
southwesterlies due to the presence of the tropical cyclone, producing a cyclone structure similar to a<br />
large monsoon depression. Zeke reached its maximum intensity of 80 kt (40 m/see) sfiordy before<br />
making landfall on Hainan Dao, but weakened very little crossing the island (Figure 3-06-1). It struck<br />
the coast of northern Vietnam, passing close to Hanoi. The final warning was issued at 1412002 as<br />
Zeke dissipated inland.<br />
III. FORECAST PERFORMANCE<br />
Although Zeke’s final best track was nearly a straight line, the actual forecasts called for<br />
recurvature just east of Hainan Dao (Figure 3-06-2). Zeke was expected to turn northward near Hainan<br />
based on the NOGAPS prognostic series, which indicated that the subtropical ridge would break down<br />
near 110°E longitude. Rather than breaking down, the ridge north of the system strengthened and built<br />
westwti as the long wave trough near 110% retrograded allowing the high located near Okinawa to<br />
move westward towards Taiwan. Once forecasters recognized the adjustment of the ridge to the north,<br />
which prevented Zeke from moving directly northward, the forecasts reverted back to the straightrunner<br />
scenario.<br />
IV.IMPACT<br />
Despite passage close by the major population centers of Manila and Hanoi, Zeke’s impact<br />
appeared to be negligible. No reports of significant damage were received, but damage to agriculture<br />
was probably high in Hainan Dao and northern Vietnam.<br />
55
Figure 3-06-1. After crossing Hainan Dao, Typhoon - retains 70 pement of its eyewall as it entem the Gulf of Tonkin<br />
(l~z July NOAA ViSUd ima&ery).<br />
56
E 100<br />
N 25<br />
105 110 115 120 E<br />
24<br />
15<br />
7<br />
‘)<br />
\—----’=--- ........ .. ...... .....<br />
-.<br />
-*<br />
N 10<br />
Figure 3-06-2. A comparison of ITWC forecasts issued after 1018OOZ July to the find besttrack.Recurvature was<br />
anticipated near 11(PE longitude, but did not occur.<br />
57
E 105 110 115 120 125 130 135 140 145 150 E<br />
N30<br />
25<br />
,,,,::.,<br />
.<br />
;<br />
. TYPHOON AMY<br />
BESTTRACK TC-07W<br />
12JUL-20JUL91<br />
MAXSFCWIND 12SKT<br />
MINIMUMSLP916MB<br />
20<br />
m 15<br />
10<br />
5<br />
.::;<br />
,.,.<br />
.,. I ; ““ ~ :.‘:. ‘!:.::. :’40 /<br />
LEGEND . \<br />
,,. . . .. . :.i.<br />
I<br />
,..,:..<br />
,,.. , ,,,,:,<br />
"..:$..................................[.......! . ...30b I. ....~....................~.~E.~~FA . ...........AB ~,,,,,..!, .............<br />
AU 15-HRBEST lRACK POSITION ‘“”’””:’:’:+””’””” ,,.... j’’’”””’””:””::”:’”:... : :“:<br />
~<br />
a SPEBD OF MOVEMENT (KT) . ;<br />
.,+> ~.<br />
,:‘,’ ,,.. : ..... .,’<br />
...:<br />
anwo<br />
----<br />
! $$ ***<br />
F<br />
L<br />
EXIRATROPICAL<br />
SUBTROPICAL<br />
DISSIPATING STAGE<br />
FIRST WARNING ISSUED<br />
LAST WARNING ISSUED<br />
m<br />
;.,,, \ ,,,.<br />
..,!:. 2@TcFA ““”4”0””” “1”“<br />
/ ..;’””’””~j J I<br />
;<br />
,,.,,.: .;,<br />
., <<br />
.........<br />
~ “’“ “’””’. ..(:; ; “<br />
; ,.,<br />
...<br />
EQ
TYPHOON AMY (07W)<br />
I. HIGHLIGHTS<br />
The second of five tropical cyclones to form in July, Amy followed a west-northwesterly track<br />
that paralleled the one taken a week earlier by Typhoon Zeke (06W). Near Taiwan, the typhoon caused<br />
the loss of the freighter, Blue River, with its entire crew, and then became the deadliest typhoon to<br />
strike China this year.<br />
II. TRACK AND INTENSITY<br />
Amy, like typhoon Zeke (06W), took a straight-line west-northwestward track and remained<br />
south of the subtropical ridge axis. There was a small stair-step, or jog northwestward, on 16 July for<br />
about 18 hours as a mid-tropospheric shortwave trough passed by to the north. This shortwave<br />
temporarily weakened the ridge, and allowed Amy to gain latitude. Strong subsidence immediately<br />
behind the passing shortwave strengthened the subtropical ridge, once again producing a more easterly<br />
steering flow.<br />
The tropical disturbance that became Amy was frost mentioned in the Significant Tropical<br />
<strong>Weather</strong> Advisory at 130600Z after 18 hours of persistent convection. Increased convection, 2-rob<br />
pressure falls in a 24-hour period at Yap (WMO 91413), and the indication of little vertical wind shear<br />
led to the initial Tropical Cyclone Formation Alert at 141OOOZ.Although the overall cloud organization<br />
remained poor, deep convection persisted and a second alert followed at 151000Z. After the initial<br />
warning at 151800Z, Amy intensified at a rate of 5-10 kt (3 to 5 mkc) every 6 hours. On the evening<br />
of 17 July, Amy began intensifying more rapidly, reaching a peak intensity of 125 kt (65 m/see) in the<br />
Luzon Strait (Figure 3-07-1). The weakening trend began late on 18 July as the outflow became more<br />
restricted to the northwest and the typhoon approached the coast of mainland China (Figure 3-07-2).<br />
Upon making landfall, the system dissipated rapidly over the mountains in southeastern China. The<br />
final warning was issued at 200000Z.<br />
III. FORECAST PERFORMANCE<br />
Although the overall track forecast errors were below average there were some flaws: 1) the<br />
track acceleration in the Taiwan Straits was not anticipated or handled well by the dynamic models; 2)<br />
the forecast for the observed strong intensification was handled as a low probability alternate scenario<br />
until it actually was observd, and, 3) the unusual extension of gale and storm force winds far to the<br />
northeast of the typhoon was not anticipated. For example, Amy was at peak intensity in the Luzon<br />
Strait when the USNS Hassayampa reported 77 kt (40 mhec) winds at a position 315 nm (585 km) to<br />
the northeast.<br />
IV IMPACT<br />
Hengchun (WMO 46752) located on the southern tip of Taiwan reported sustained winds of 66<br />
kt (33 m/see) with gusts of 130 kt (65 m/see) and an unusually high peak wind gust of 150 kt (75 rn/see)<br />
at 182000L some 30 nm (55 km) from Amy’s center. The 16,000 ton fkeighter, Blue River, with 31<br />
persons onboard, capsized and sank near the Pescadores Islands west of Taiwan. There were no<br />
survivors. On 19 July, Amy plowed into southeastern China, 99 people were killed, at least 5000<br />
injured and over 15,000 homes destroyed.<br />
59
Figmre 3-07-1. Amy, with an intensity near 115 kt (60 m/see), passes through the Luzon Strait with a small 10 nm (20 km)<br />
diameter eye (1805462 July NOAA visual imagery).<br />
60
Figure 3-07-2. The radar m Kdwiung (WMO 46744) at WO1OOZJuly reveals tightiy curved<br />
concenhic rsinbands surrounding Amy’s eye (Photograph courtesy of the Central <strong>Weather</strong><br />
Bureau, Taipei Taiwsn).<br />
61
M<br />
m<br />
U2<br />
o<br />
U2<br />
z<br />
I<br />
,, ..,.,.<br />
:.,.,.:. .. :’”<br />
. . . ....<br />
..... ...<br />
ld<br />
m<br />
d ..:. . 1<br />
o<br />
d<br />
VJ<br />
g
TYPHOON BRENDAN (08VV)<br />
I. HIGHLIGHTS<br />
The third tropical cyclone of July, Brendan was the third straight-runner in a row. Torrential<br />
rains associated with the tropical cyclone’s passage across northern Luzon unleashed lahars or<br />
avalanches of volcanic debris, mud and boulders in the valleys near Mount Pinatubo. The forecast<br />
models performed very well throughout the duration of this tropical cyclone, and <strong>JTWC</strong>’S forecast<br />
errors were below average.<br />
II.TRACK AND INTENSITY<br />
A weak surface circulation developed 70 nm (130 km) south-southeast of Chuuk in the central<br />
Caroline Islands on 15 July. The cloud system tracked generally west-northwestward for several days<br />
until it moved into an area of increased upper level divergence in the central Philippine Sea on the<br />
nineteenth. At 1918002, <strong>JTWC</strong> issued the fwst Tropical ~clone Formation Aleti At that time the<br />
system was located approximately 230 nm (425 km) east of the Philippine island of Samar. Due to the<br />
extreme diurnal fluctuations in the system’s convection which delayed intensification, <strong>JTWC</strong> re-issued<br />
the alert at 2018002. The first visual satellite imagery available later that morning showed significant<br />
low-level cloud lines north of an organized surface circulation. This level of organization coupled with<br />
a low shear environment and warm sea surface temperatures, prompted <strong>JTWC</strong> to issue the first 72-hour<br />
tropical cyclone warning on Tropical Depression 08W at 21OOOOZ.<br />
Tropical Depression 08W was upgraded to Tropical Storm Brendan on the 2106OOZwarning,<br />
based on a Dvorak intensity estimate of 35 kt (18 rn/see). Intensification continued over the next 36<br />
hours, and the system reached marginal typhoon intensity before making landfall over northern hmon.<br />
initially it appeared that the system would track more northwa.d along the coast to the east of the Sierra<br />
Madre mountain range rather than over the mountains. However, after making landfall, Brendan<br />
continued to track northwestward across the mountains and emerged at tropical storm intensity on the<br />
northwestern coast of Luzon at 2212002 (Figure 3-08-1). As Tropical Storm Brendan accelerated to<br />
the west-northwest away from northern Luzon, it began to reintensify, attaining typhoon intensity for a<br />
second time at 2300002 (Figure 3-08-2) in the South China Sea: The peak intensity of 75 kt (39 m/see)<br />
occumd at231200Z, approximately 12 hours before the typhoon made landfall over southeastern China<br />
approximately 30 nm (55 km) southwest of Macau. After making landfall, Brendan continued to move<br />
northwestward and weaken. <strong>JTWC</strong> issued the final warning on this tropical cyclone at 241800~ as it<br />
was dissipating over land.<br />
III. FORECAST PERFORMANCE<br />
<strong>JTWC</strong> performed well with mean forecast emors of 94, 127 and 158 nm at 24,48 and 72<br />
hours respectively. In comparison, as a measure of skill the climatology-persistence model CLIPER had<br />
errors of 113, 238 and 370 nm for the same time periods. Initially, <strong>JTWC</strong> forecasts were to the south of<br />
the actual track.<br />
IV. IMPACT<br />
Brendan had a significant impact on both the Philippines and China. In the Philippines,<br />
torrential rainfall combined with volcanic debris from Mt. Pinatubo’s June eruption to produce<br />
mudflows (lahars) up to 15 feet high in the river valleys near the volcano. Three fatalities were<br />
63
eported. In addition, 1400 homes were destroyed and 10,000 people evacuated. Peripheral winds and<br />
rain from the typhoon brushed across Hong Kong causing 16 minor injuries due to flying debris.<br />
Waglan Island (WMO 45009) to the south reported winds of 55 kt (29 m/see) gusting to 80 kt (41<br />
M/see) while Hong Kong’s Kai Tak airport (WMO 45007), which was more sheltered, recorded winds<br />
of 35 kt (18 m/see) gusting to 55 kt (28 I@ec). However, China was ~atly impacted by Brendan,<br />
which exacerbated the flooding situation already present from abnormally high spring and early summer<br />
rainfall. At least 100 fatalities were attributed to the typhoon as it moved inland.<br />
Figure 3-OS-1. Brendan at tropical storm intensity shody after moving off hum into<br />
the South China Sea (2212S32 July DMSP infrared imagery).<br />
64
Figure 3-08-2. Brendan just aft= being upgrsded to typhoon stares in the South China<br />
Sea (230133Z July DMSP ViSUd imsgery).<br />
65
E 105 110 115 120 125 130 135 140 145 150 155 160 165 170 175 E<br />
N 50<br />
,...,,,:<br />
,: : ,, .<br />
tTYPHOON CAITLIN i .- ,.~. >,, ..; I LEGEND<br />
li~zz%,..l..
TYPHOON CAITLIN<br />
(09W)<br />
F@re 3-09-1. Csitlin has a cloud ftied eye. To the north, the fmt line of enhanced<br />
cumulus cloud bands associated with the typhoon move across Okinawa (260028Z<br />
July DMSP ViSUdimagery).<br />
I. HIGHLIGHTS<br />
After a succession of three<br />
straight-running July typhoons<br />
[Zeke (06 W), Amy (07 W), and<br />
Brendan(08W)], Caitlin became the<br />
first cyclone of the season to<br />
threaten Japan and Korea. Its northoriented<br />
track was predicted by the<br />
NOGAPS model, and appeared to<br />
demonstrate the value of a newly<br />
implemented tropical cyclone bogus<br />
routine implemented at Fleet<br />
Numerical Oceanographic Center<br />
(FNoC). Much-needed rain fell on<br />
drought-stricken Okinawa as Caitlin<br />
passed west of the island.<br />
II. TRACK AND INTENSITY<br />
In mid-July, Caitlin developed<br />
from a disturbance in the eastern<br />
portion of the monsoon trough<br />
which extended south of Pohnpei in<br />
the eastern Caroline Islands. The<br />
disturbance moved westnorthwestward,<br />
and was initially<br />
described on the 200600Z July<br />
Significant Tropical <strong>Weather</strong><br />
Advisory as a low-level circulation<br />
with much of the deep convection<br />
displaced west of the center. On 22<br />
July, upper-level wind shear<br />
diminished near the circulation<br />
center. Based on pressure falls of 1<br />
to 2 mb per day at Yap (WMO 91413), and increased convective activity, a Tropical Cyclone Formation<br />
Alert was issued at 230500Z. The f~st warning on Tropical Depression 09W followed at 2312002<br />
when a significant increase in convection indicated that continued intensification was likely to occur.<br />
Caitlin became a tropical storm at 2400002.<br />
Caitlin tracked west-northwestward until 24 July, when the subtropical ridge weakened near<br />
130°E and allowed the tropical storm to make a sharp northward turn. For the next four days, it moved<br />
in a genemlly north-northwestward direction and slowly intensified. The development of an irregular,<br />
cloud-filled eye prompted an upgrade to typhoon intensity at251200Z (Figure 3-09-1). At 2715352,<br />
the center of the eye passed 60 nm (111 km) west of Kadena AB and Caitlin attained a peak intensity of<br />
67
95 kt (49 mkc) less than three hours later at 271800Z. After passing Okinawa, the typhoon tracked<br />
north-northeastward around the periphery of a broad mid-tropospheric subtropical ridge. On 29 July,<br />
Ca.itlintook a more northeastward track, accelerated through the Korea Strait, and gradually transitioned<br />
into a typhoon force extratropical low as it moved into the Sea of Japan. The final warning was issued<br />
at 300000Z when satellite imagery indicated the system had lost most of its tropical characteristics.<br />
III. FORECAST PERFORMANCE<br />
Initially, <strong>JTWC</strong> predicted Caitlin would follow a west-northwest track similar to the paths<br />
taken earlier by the three preceding typhoons. Of the suite of available computer forecast guidance,<br />
only the NOGAPS model indicated the cyclone would cease moving west-northwestward and assume<br />
instead a north-oriented track. This NOGAPS forecast was the subject of much speculation at the<br />
<strong>JTWC</strong> because it was uncertain if a recently implemented tropical cyclone bogus program was<br />
producing spurious output from the model. A post analysis evaluation of the bogus program, whe~<br />
bogus rawinsonde data derived from tropical cyclone characteristics are inserted into the NOGAPS<br />
model at the location of the tropical cyclone, showed that the program significantly impmved model<br />
output in the tropics during 1991. After Caitlin made its abrupt northward turn on 24 July, <strong>JTWC</strong><br />
forecasters responded by shifting the forecast fkom west-northwest to a northward track, which was<br />
consistent with the NOGAPS prognosis. As shown in Figure 3-09-2, official forecasts starting at<br />
241800Z flip-flopped, or “windshield wiped” from northwes~ to nort& then north-northwest, before<br />
settling on a consistent northward track west of Okinawa. Forecast errors during this period were small,<br />
E 110 115 120 12s 130 KM 140 145 150E<br />
N35<br />
: /, -w<br />
30<br />
●’<br />
/11 j :<br />
8<br />
..... .. ...f .........8 ....................................................... .......... .............~...................<br />
10:*<br />
J ,,;<br />
/j ~ ~ ● ~<br />
25<br />
20<br />
1s<br />
N 10<br />
.....+-. ............... ..... .. ....... ...............................................................u ...................................<br />
6!<br />
p<br />
~{~ i i<br />
)<br />
.................... ~ : ......................... .............................. ......... .. .. .........................!........................... ...........................................<br />
<br />
~o’% ; j ~;<br />
8<br />
:*<br />
Q<br />
:.<br />
: ●.<br />
;<br />
......................... ~k~:: .......................... ........................................6:i ......................i .........................i ..........................# .... ..........<br />
s; *-<br />
~-<br />
--* :<br />
~D<br />
~<br />
/ Qjl<br />
~:~~~~<br />
Figure 3-09-2. Comparison of <strong>JTWC</strong> forecasts issued from 241800Z to 260000Z July to the best track illustmtes<br />
a significant change m JIWC tmck forecasts beginning at 25000W (waning #7), d that a laxge &pee of<br />
directkmal variability occutmd in the subsequent trwk forecasts.<br />
68
ut the lack of continuity between successive warnings undermined confidence in the forecasts at a time<br />
when military units on Okinawa made the decision to evacuate. After shifting to its northwani track<br />
forecast at 2500032, <strong>JTWC</strong> forecast emors were exceptionally low, when compared with CLIPER and<br />
long term errors (Table 3-09-1). <strong>JTWC</strong> also outperformed OTCM at 24 and 48 hours.<br />
IV IMPACT<br />
Caitlin provided welcome relief to the drought-stricken island of Okinawa. Kadena AB<br />
recorded a total of 12.51 inches (320 mm) of rain during a four day period, which was its heaviest<br />
precipitation since 1987. As a consequence, the reservoir level increased fkom only 35 percent to over<br />
80 percent of its capacity. On Okina~ one death was attributed to Caitlin, crop losses were estimated<br />
at $7.4 million, and U.S. military bases reported damage of more than $1.2 million. The typhoon<br />
enhanced the southwest monsoon across the northern Philippine Islands, and caused unwanted rainfall<br />
there. Manila received 8.38 inches (210 mm) of rain on 26 July, triggering avalanches of volcanic mud<br />
and debris, lahars, in the valleys near Mount Pinatubo and widespread flooding which resulted in 16<br />
deaths and the evacuation of more than 20,000 people. Later, there were press xqmrts of 2 deaths and<br />
over $4 million damage in Korea<br />
Table30-1. Average24-,48-,and72-hourforecastenws oftheofficialforecast(<strong>JTWC</strong>)comparedtoCLIPER<br />
andOTCMforthetimeperiod250(N02to300000ZJuly,andthelongtermaverageITWCerrors.<br />
Z133KCLE QKM lb!fzuE<br />
24 HR (17 cases) 70 81 91 120<br />
48 HR (13 cases) 94 138 112<br />
72 HR (W C*S) 146 266 126 360<br />
69
E 160 165 170 175 180 175 170 165 160 155 150 145 140 135 130 125 120 115 110 105 W<br />
N 50<br />
~<br />
—<br />
45<br />
40<br />
35<br />
30<br />
3 25<br />
#<br />
..,-...;,.,<br />
.............&. . . . . . . . . . . . . . . . . . . . . . . . . . . . .<br />
A’+“”””””””””” ”’””’/----<br />
““”<br />
* *;:<br />
*~!<br />
““”* ’”’’’””~”””.~’’...’... ~-..-....<br />
A. .+..;, i .:<br />
A<br />
il.<br />
/(<br />
al!”<br />
Y*O.<br />
J<br />
.........q...oil@.z<br />
,,,.,.<br />
....<br />
.....!<br />
● *<br />
. .<br />
. .<br />
..<br />
.<br />
i<br />
,’<br />
ITROPICAL STORM ENRIQUE<br />
1BESTTRACK TC-06E<br />
,,.,... 15JUL-02 AUG91<br />
MAXSFCWIND65KT<br />
MINIMUMSLP976MB<br />
—<br />
.......<br />
...........<br />
.<br />
. . .<br />
......<br />
,...,.,<br />
....<br />
\<br />
t ,.<br />
.:<br />
............ ... .<br />
~:<br />
: ‘..,.<br />
:. ,,<br />
~ :,:.<br />
i,<br />
~ ,,<br />
: ...<br />
.,<br />
‘.., .,<br />
,.,<br />
... ‘“;<br />
...<br />
..<br />
.:, ::. :..,,<br />
...<br />
,,,.,,,,, ,..,,<br />
.. .,<br />
. .<br />
20<br />
................<br />
-<br />
t !<br />
...............+---<br />
.. .<br />
. . . . .<br />
.<br />
L---<br />
;1 ‘2<br />
...........<br />
..........<br />
15<br />
. . . . . .<br />
,.,<br />
10 ......... / .<br />
.{<br />
..,,,,,,,.,<br />
10<br />
aaoo<br />
----<br />
.-..<br />
. ....... .j=..,_.,,._<br />
..-,....<br />
..,.<br />
16c<br />
/<br />
‘“~’00<br />
....... .<br />
5<br />
..:,...,,. ...,,.,,<br />
...,,.<br />
... ...<br />
EQ<br />
.<br />
—
TROPICAL<br />
STORM ENRIQUE (06E)<br />
Figure 3-06E-1 Tropical Storm Enrique asadissipating circulation east of the Hawaiian Islands<br />
(220000Z July GOES visual imagery).<br />
Enrique was a rare tropical cyclone that was warned on by three separate U.S. tropical cyclone<br />
warning centers. Enrique began in the Eastern Pacific, the National EIurncane Center’s area of<br />
responsibility, trekked 4900 nm (9100 km) across the North Pacific Ocean through the Central Pacific<br />
Hurricane Center’s area, then after weakening, regenerated and dissipated in <strong>JTWC</strong>’S area of<br />
responsibility. Over the past 20 years, Typhoon Georgette (1986) was the only other Eastern Pacific<br />
tropical cyclone to cross the international date line. After the fmt warning was issued by the National<br />
Hurricane Center at 151800Z, Enrique tracked west-northwestward and intensified to minimal hurricane<br />
intensity at 170600Z before weakening as it approached 140°W. Enrique maintained a weak circulation<br />
dtuing the next five days as it passed north of the Hawaiian Islands. Then, on 27 July, it executed a<br />
clockwise loop and headed southwestward while re-intensifying to 45 kt (23 m/see). Increased vertical<br />
wind shear caused the circulation to weaken once again as it headed toward Midway Island. lhud<br />
satellite imagery of the small system at 29 1938Z revealed that it had a spiral low-cloud pattern<br />
indicative of a closed surface circulation. This prompted the <strong>JTWC</strong> to mention the small circulation on<br />
the 300600Z Significant Tropical <strong>Weather</strong> Advisory. Increased convection and a pressure fall of 7 mb<br />
observed at Midway Island (WMO 91066) as the system passed to the north led <strong>JTWC</strong> to issue a<br />
warning at O1OOOOZAugust. Enrique’s tiny pressure signature was deeply embedded in the large<br />
maritime high to the northeast (as shown in the insert). As the tropical storm tracked to the northnorthwest,<br />
it encountered strong upper-level wind shear and, once again, lost all of its deep convection.<br />
The last warning was issued at 011200Z.<br />
71
—<br />
k +++<br />
+++<br />
%’+<br />
+++<br />
4<br />
.+. ...-....-.-,., ...--..<br />
g<br />
.. ..........................<br />
ḃ<br />
/ ‘* ●%.<br />
‘o<br />
3 ●O*<br />
,.....%......................<br />
-al<br />
,2<br />
//<br />
$<br />
.-. ........................ ......<br />
g<br />
““””*””””--””-””””””””””””””<br />
m<br />
..,,.<br />
‘...<br />
,.- ‘..<br />
Win-w”<br />
z<br />
$<br />
72<br />
z
E 110 115 120 125 130 135 140 145 150 155 160 165 E<br />
N40<br />
I TYPHOON ELLIE<br />
BESTTRACK TC-llW<br />
08 AUG-19AUG91<br />
MAXSFCWIND85KT<br />
35 MINIMUMSLP958MB”<br />
‘.<br />
‘::.., ..,, ,: ..<br />
. .. . ..<br />
30<br />
25<br />
20<br />
14 14 ~<br />
\\h -.<br />
Ob<br />
,.,...<br />
15<br />
10<br />
N5<br />
I<br />
LEGEND<br />
ti 6-HR BEST ‘IRACK POSITION i<br />
SPEED OF MOVEMENT (KT) !<br />
.........................<br />
: nwmm:y~p<br />
Xxmouz :<br />
~ TROPICAL DISTURBANCE j<br />
~ TROPICAL DEPRESSION :.,,<br />
---- TROPICAL STORM<br />
,,<br />
— TYPHOON<br />
SUPBR TYPHOON START ““;‘“”<br />
8 sylwRALJlwR:\y~END .... ‘“” ............... .....<br />
:,, ...<br />
!..:, .,<br />
...<br />
$$% SUBTROPICAL<br />
*** D~SmA~G STAGE<br />
FIRST WARNING ISSUED :<br />
: LAST WARNING ISSUED<br />
I<br />
(“j<br />
I
concentration and organization of the tropical cyclone’s small CDO began to fluctuate. Increasing<br />
vertical shear and interaction with the mountainous island of Taiwan led to Ellie’s demise and<br />
subsequent dissipation over water in the Taiwan Strait on 19 August.<br />
III. FORECAST PEIWORMANCE<br />
The forecast aids, CLIM, CLIPER, AND HPAC, consistently called for recurvature (Figure 3-<br />
11-3). Initially, the dynamic and statistical-dynamical aids also favored a northwestward track through<br />
the subtropical ridge. As a result <strong>JTWC</strong>’S forecasts initially reflected a recurvature scenario.<br />
Nevertheless Ellie moved south of the forecast break in the ridge and tracked to the west. Once the<br />
typhoon passed this weak bifurcation point, the dynamic models adopted an under-the-ridge scenario.<br />
Still, they sensed a weak ridge and, unable to account for the small size of the typhoon, continued to<br />
indicate that Ellie’s track would gain latitude. In keeping with this dynamic guidance, <strong>JTWC</strong>’S<br />
forecasts also provided predictions to the right of the verifying final best track.<br />
cyclone movti- southwest of OkinawZ and approximately 72 hours<br />
aids began to sense the ridging over Asia and their track guidance<br />
(Figure 3-11-4).<br />
After the tropical<br />
prior to dissipation, the dyn-%c<br />
moved closer to the actual track<br />
W. IMFACT<br />
Although Ellie persisted for over a week, threatened Okinawz the southern Ryukyu Islands,<br />
northern Taiwan and maritime interests along the way, no reports of significant damage or fatalities<br />
were received.<br />
Figure 3-11-2. A psxtially cloud ffled eye is visible as Ellie nesrs its msximum intensity in the northern Philippine Ses<br />
(1405372 August NOM ViSUd ims&@.<br />
76
EUS22)ns MWl# 14s2s02ssl@1a<br />
N40<br />
3s<br />
30<br />
25<br />
20<br />
E EllS120125no N<br />
N40<br />
3s<br />
30<br />
2s<br />
xl<br />
140 14S 130 2SS 160 MSE<br />
N 1S<br />
NIS<br />
F@re 3-11-3. Climatological and statistical track guidance for<br />
Ellie (clockwise horn top left} Climatology (CLIM), Half<br />
Persistence And Climatology (HPAC), Climatology and<br />
Persistence (CLIPER). These aids were consistently to the<br />
rightof the verifying best track<br />
EllS22a12s130ns 140 14S 1S0 2SS 160 WE<br />
3s .................................. .,<br />
NM<br />
E 10S lls la 125 ISOE<br />
‘Ml<br />
OT~M<br />
E lW 110 11s la r2s WE<br />
‘= FBAM &<br />
E lbS<br />
N3b,<br />
CSUM<br />
11* 12s la 12S 130E<br />
Figure 3-11-4. Objective guidance from the One-way<br />
Tropical Cyclone Model (OTCM) , FNOC Beta and<br />
Advection Model (FBAM) , and the Colorado State<br />
Univ~ity Model (CSUhf) correctly indicates westward to<br />
southwestward tracks after 160600Z as Ellie passed to the<br />
southwest of Okinawa
E 95<br />
N30<br />
25<br />
100 105 110 115 120 125 130 135 E<br />
,...<br />
TYPHOON FRED<br />
.,:<br />
.,..:.<br />
,,.:,. ..:<br />
BENTTRACK TC-12W<br />
.,:, \<br />
08 AUG- 18AUG91 ,,,’<br />
.,.:<br />
MAXSFCWIND95KT<br />
,,.. .:,<br />
,,.,<br />
,./ ,,;:. . !<br />
MINIMUMSLP949MB<br />
...:. :<br />
.;’:’<br />
.:<br />
..::<br />
..* .. .<br />
\<br />
20<br />
............ ..........................<br />
15<br />
10<br />
N5<br />
L - 18K)OZ<br />
~mm~~ \<br />
.,..,<br />
,’: \<br />
**<br />
.:,, 17 ,<br />
~F-<br />
“{..<br />
.,,“; Ax x** 18 “.,.;,,, ; ,.,~ ~:<br />
lll12z<br />
1A ,:’ - :<br />
,. .‘,’ ~FA ~<br />
.<br />
. . ...-.-...><br />
: ~., :“ /<br />
1<br />
.................................................................................!.}. :...::...:,,,<br />
,.,., ,..., ,,..,.,., .................................................................<br />
:,<br />
:.<br />
;<br />
:<br />
\ . ‘, ><br />
~ :, ,,:.:,:;:.11,.,!%O<br />
1<br />
LEGEND<br />
I<br />
.“’”::. ,, . ., ‘:. :,:..: .,.:\ ~<br />
$ ,..... ...:. ,,,.:,-. {<br />
W 6-HRBEST TRACKPOSITION<br />
., ! ,.<br />
“:. “; ,..:::. ~,. $ “o<br />
,.;: SPEEDOF MOVEMENT(KT)<br />
i<br />
o<br />
.:,, “:,.; .. :,:.,..,.. 0<br />
... :,,, 1. .... ,,<br />
:<br />
‘.. : ~,. :. ;...““.. ‘..,, 0.<br />
,.’.,.,,..,,,’<br />
ABP$V<br />
.,.,, ,,:<br />
,.,: ; ... :<br />
1~<br />
~ ‘IROPICAL DISTURBANCE<br />
.:..,:<br />
;’.:; ; “’””’””:<br />
...”... j, ;“”’,’..i~ ‘o \<br />
~ ‘IROPICAL DEPRESSION . ... .... ‘“” i<br />
..:: ;,....,:. ,,.:’:’ : :..,<br />
doa-<br />
---- lROPICAL STORM<br />
l,,+. ~~<br />
..-,.. ~ .. . .,<br />
;. :“.:’:,. ,,.,,:,:,’ ~ -0<br />
/ oo~n<br />
— TYPHOGN<br />
!<br />
SUPER<br />
‘-------”<br />
TYPHOON START<br />
S=~o~~~END<br />
tt SUB’IROPICAL<br />
*** DIssmA~G STAGE<br />
FIRST WARNING ISSUED<br />
: LAST WARNING ISSUED<br />
.. .. . :,:.
passed to the south of Hong Kong, heading for Hainan Dao. After passing along the northwest coast of<br />
Hahn Dao on 16 August with estimated maximum sustained winds of 95 kt (49 m/see), the typhoon<br />
weakened and took an unanticipated southwestward track across the Gulf of Tonkin. Fred continued to<br />
track west-southwestward, and the final warning was issued at 180000Z as the low was dissipating over<br />
the mountainous terrain of Southeast Asia.<br />
II. FORECAST PERFORMANCE<br />
<strong>JTWC</strong> forecast performance on T~hoon Fred was noteworthy. Overall, mean forecast track<br />
errors were 65, 109, and 131 nm (120, 200 and 240 km) at 24, 48 and 72 hours, respectively. In<br />
comparison, the Persistence-Climatology model, CLIPER, had errors of 93, 195 and 339 nm (170, 360<br />
and 630 km) for the same period. The early intensity forecasts correctly indicated that Fred would<br />
attain typhoon intensity in the South China Sea.<br />
IV. IMPACT<br />
Heavy rains fell on Lum.n as Fred crossed the northern part of the island and triggered lahars<br />
or mudslides of volcanic ash and debris in the river valleys near Mount Pinatubo. Over 100 homes wem<br />
destroyed and thousands of people were forced to evacuate areas near the volcano. A 20,000 ton oil<br />
explomtion barge capsized and simk 65 nm (120 km) east of Hong Kong on 15 August. Of the 195<br />
crew members on board the 420 foot long Derrick Barge 29, 22 perished, including 4 divers who were<br />
trapped in a saturation diving chamber kmeath the barge. At-sea rescues of the 173 survivors were<br />
accomplished by helicopter and tugboat. In the Chinese island province of Hainan, at least 16 died<br />
during Fred’s passage.<br />
80
Intentionally left blank<br />
81
E 135 140 145 150 155 160 165 E<br />
N 35<br />
rROPICAL DEPRESSION 13V<br />
BESTTRACK TC-13W<br />
11AUG-15AUG91<br />
MAXSFCWIND25KT<br />
MINIMUMSLF 1CM)4MB<br />
25<br />
,25<br />
L -131 IZ<br />
30<br />
............. . .... ...... . .. .<br />
...-.. .. ................... 25 ... .......W.-Y..-..2<br />
. . ..<br />
4 * ******* **,<br />
/<br />
t / ●%oe* 26<br />
; 14<br />
/<br />
% ,<br />
%,<br />
4<br />
23<br />
‘o/-● %%0<br />
25<br />
20<br />
@ N 25 ....................... /<br />
..! 4.... ,., .,,,..<br />
..........13.......%. ................<br />
/ 25b<br />
....rga . .<br />
●.<br />
●. / %,<br />
F - 12/lZ<br />
20<br />
N 15<br />
----<br />
LEGEND<br />
6-HRBEST TRACKPOSTION<br />
SPEED OF MOVEMENT (KT)<br />
TROPICAL DISTURBANCE<br />
TROPICAL DEPRESSION<br />
TROPICAL STORM<br />
TYPHOON<br />
SUPIlt TYPHOON START<br />
SUPER TYPHOON END<br />
EXTRA’IROPICAL<br />
SUBTROPICAL<br />
DISSIPATING STAGE<br />
PIRST WARNING ISSUED<br />
LAST WARNING ISSUED<br />
..,.<br />
:,..,<br />
.,,<br />
,,,<br />
,,<br />
/<br />
●00<br />
●0 TCFA<br />
‘O. /./<br />
/’ 00<br />
..............I.Z ...........Y..! ‘Ooo”””’””mvv<br />
00I/
%30<br />
E 115 120 125 130 135 140 145 150 155 160 E<br />
N 45<br />
: ,.~ . ..,, .,<br />
. 1<br />
TYPHOON GLADYS I<br />
.,.. \ .,.,: ..%. :.:’.”,. !. :...<br />
. ..:<br />
..’ : .. ,.’.<br />
ggE!%EJ<br />
:,....--’””’””:””’””””’<br />
40<br />
:’<br />
,::’<br />
ii<br />
: .:..’,, ,. .’. $: .,..,, ;<br />
35<br />
25<br />
20<br />
N 15<br />
,..:.!<br />
.,. ”<br />
..<br />
.. $:<br />
.,., ; ....’<br />
‘,...,<br />
:, !...<br />
‘... :<br />
..:<br />
..!<br />
., .,..<br />
.. ... j ...... “.,,; ~,.. :.”<br />
%..$’:.,:<br />
;.<br />
.,<br />
.“ :<br />
,,},, ,,y ,:,.<br />
‘......... . . . . . . . . . . . . . . . . .*. . . .*% . . . . .+ .,, .::“....:+: “.”... i.&...&.:12~/l2~ ,, ,,, , : ~,, “... .~” :,;:......< ...’/.;,.+....... / . . . . . . . .. . .. . . . .. . . . . .<br />
.:; ‘. : ...“<br />
”””““””””<br />
,,. “’”’”” ‘“’ \ “<br />
. ...,,. : ,..’<br />
....<br />
j“~”” 55~55 5555 s ~<br />
.::’.<br />
.......* lo ~<br />
.,.,.
The effect of beta drift may have been demonstrated in the fact that Gladys tracked to the right of the<br />
dynamic forecast aid, OTCM (Figure 3-14-2). The large displacement of maximum winds far from the<br />
cyclone’s broad center and the absence of deep convection may have prevented a normal rate of<br />
intensiilcation (<strong>Weather</strong>ford, 1985). For most of its life, Gladys intensified at a slow rate of only 5 kt (3<br />
ndsec) per day, reaching minimal typhoon intensity near Amami-shims, 90 nm (165 km) northeast of<br />
Okinawa. The weather station on Amami-shims (WMO 47909) recorded 64 kt (33 m/see) gradient-<br />
Ievel winds and a minimum sea-level pressure of 973 mb as the cyclone center passed within 35 nm (65<br />
km) of the island. After clearing the northern Ryukyu Islands, a fast-moving mid-tropospheric trough<br />
induced Gladys to turn north-northwestward. As the trough passed, vertical shear increased on the<br />
poleward side of Gladys’ cloud mass, and the central pressure of the system began to rise.<br />
Ileestablishment of the mid-tropospheric subtropical ridge over the Sea of Japan on 22 August<br />
prevented reculvature, and Gladys tracked toward the southern coast of Korea. The final warning was<br />
issued at231200Z when the combined effects of increasing shear and land interaction indicated that the<br />
circulation was weakening rapidly.<br />
E 110 115 124 125 130 135 140 145 E<br />
N40<br />
35<br />
30<br />
f<br />
. .. . ......................... .. ........e< .<br />
25<br />
20<br />
<br />
.......... .......... .................................................................................................................. . . .. ..............<br />
N 15<br />
Figure 3-14-2. 160000Z to 231200Z August time series of (he-Way (Interactive) Tropical Cyclone Model (CYI’CM)<br />
forecasts versus the official best trwk. (XCM’S poor pfonnance during the enti lifetime of Typhoon Gladys can be<br />
partially explained by the beta effect of large tropical cyclones.<br />
86
III. FORECAST PERFORMANCE<br />
<strong>JTWC</strong> motion forecasts of Tj@oon Gladys were quite accurate; in fach only one warning had<br />
72-hour forecast errors larger than 300 nm (555 km). Of note is the fact that <strong>JTWC</strong> correctly predicted<br />
that the cyclone would not recurve, even as it turned north-northwestward near Kyushu. In contrast,<br />
other tropical cyclone warning centers in the region predicted that Gladys would recume through the<br />
Korea Strait, between Tsushima and western Kyushu. The divergent forecasts increased the potential<br />
for conflicting information to reach operational decision makers in Korea and Japan. During this<br />
period, <strong>JTWC</strong> provided extensive, detailed prognostic reasoning messages which, in conjunction with<br />
the warning bulletins and telephone discussions, evaluated the potential for the possible forecast<br />
scenarios and helped allay operational concerns.<br />
Intensity forecast performance was poor because Gladys was expected to math a maximum<br />
intensity much greater than 65 kt (33 m.kec). At 161200Z, when the system was only a tropical<br />
depression, <strong>JTWC</strong> predicted it would rapidly intensifi to a peak intensity of 120 kt (62 m/see) in 72<br />
hours, and for the next seven warnings peak winds in excess of 100 kt (51 rn/see) were forecast. As a<br />
result, wind errors for the duration of the forecast period were among the highest of the season. In postanalysis,<br />
most of the large wind errors could have been avoided if a simple equation relating latitude<br />
and peak intensity had been used (Mundell, 1990).<br />
IV IMPACT<br />
Typhoon Gladys’ huge circulation caused record amounts of rainfall in Korea and Japan.<br />
South Korea’sDisaster Relief Center qmrted at least 90 people were killed or missing, 62 injured, and<br />
40,000 left homeless. The center estimated property loss at nearly US $45 million. Pusan, Korea’s<br />
second largest city, ~eived 24 inches (610 mm) of rain in 20 hours and sections along the southeast<br />
coast were reported to have received 26 inches (660 mm) during the same period. In addition, Gladys<br />
dumped as much as 28 inches (710 mm) of rain on central Japan, triggering landslides which killed 10<br />
people west of Tokyo and flooded at least 1,000 homes.<br />
87
E 120<br />
N 40<br />
35<br />
-<br />
00 30<br />
25<br />
.. ,-..,.<br />
125 130<br />
ITROPICAL DEPRESSION15V<br />
I<br />
BESTTRACK TC-15W<br />
21 AUG-30 AUG91<br />
MAXSFCWIND30KT<br />
MINIMUMSLP997MB<br />
L .. ..<br />
,:,..<br />
i<br />
.,..<br />
/ ./’”<br />
..’<br />
. . ...... . .. ...........,.,,,,,,...... i ~,:,,.g9i&2j<br />
...<br />
., .<br />
J5 #<br />
. ‘:. \~<br />
. 3P ●<br />
,.,.. .. .,;,.,.:,,,<br />
..,.,.: .<br />
:.,,<br />
i 10 ;<br />
,...’<br />
~e<br />
.,,.+’<br />
‘:... ,,. ..,, .,,.<br />
11 ●’<br />
....................................................... ..............<br />
~~ 28<br />
,..,.<br />
.<br />
.................................................................................................................................<br />
i<br />
.......<br />
~><br />
“:. 30<br />
/<br />
11 ‘e<br />
,.,.<br />
.,’.:,. i<br />
‘em<br />
.,.: / ‘.: ‘1<br />
\ 30 /“<br />
●* :7 ,<br />
{<br />
.’<br />
10 ●O + ●* 26<br />
/<br />
~<br />
/1 ,>
TROPICAL DEPRESSION 15W<br />
Figure 3-15-1 The well-defined center of Tropical Depression 15W, as seen 6 hours prior to the first<br />
warning on the system (252327Z August DMSP visual imagery).<br />
When animated satellite imagery indicated cyclonic turning in an area of deep convection<br />
associated with a NSS monsoon gyre (Lander, 1992), a Sign~lcant Tropical Wather Advisory was<br />
reissued at 212200Z (August) to include the disturbance that was to become Tropical Depression 15W.<br />
For the next four days, a single, well-defined circulation center failed to develop. Then, following<br />
~ceipt of a ship report indicating 39 kt (20 m/see) sustained winds and a surface pressure of 998 ab,<br />
the fkst warning on Tropical Depression 15W was issued at 260600Z. A Tropical Cyclone Formation<br />
Alert did not precede the first warning, and the minimal tropical storm intensity indicated by the earlier<br />
ship report was discounted due to the continued presence of a shemtype cloud pattern. The depnxsion<br />
moved west-northwestward, south of Japan, recurved through a break in the subtropical ridge, and<br />
dissipated in the Sea of Japan. It is thought that Tropical Depression 15W did not intensify further<br />
because persistent vertical wind shear prevented the development of a persistent central dense overcast.<br />
89
- i . ..<br />
%+<br />
i5f= ~<br />
g; ~g !ijO ~gg<br />
II<br />
Fq%#%.Za$u<br />
%Ed c#~<br />
&j 5~~<br />
!& s~~<br />
!i!ii<br />
%+ :<br />
gmw$m~><br />
EEEX a I+*<br />
‘iiMii<br />
4<br />
+++ ; d%<br />
. ........."...... .<br />
. ...%e<br />
+:<br />
P“H!I-W”<br />
~%g%gz%<br />
1<br />
x%+.<br />
s - ~: +; \\<br />
, “::.i<br />
..<br />
:* I !>.<br />
.-..-..<br />
; :.<br />
.............s.<br />
:*<br />
. .... . . ...... .... ... ..\<br />
:/ :* ~<br />
) ‘,.,<br />
....<br />
*<br />
:’”m: ●<br />
,:~ m<br />
. . ., :.’..,.: :<br />
.,, : ,,.,<br />
..!.,./..,<br />
i<br />
“’”““:.,.:.*4.,, ,,,-$<br />
..,,.:.<br />
,.:.: ,,.<br />
/<br />
. {:<br />
-‘: ““ ‘..’<br />
.............................sf.........<br />
I<br />
................. ............................. /:,’”:. ,>. ., . i<br />
. ...::.,., .:.<br />
}
TROPICAL STORM HARRY (16W)<br />
Figure 3-16-1 Tropical Storm Harry crosses the southern coast of Honshu (3023202 August DMSP<br />
visual imagery).<br />
Harry was initially detected in the northern Philippine Sea as a poorly organized cyclonic<br />
cumulation in a NSS monsoon gyre, and was mentioned on the 2706002 August Significant Tropical<br />
<strong>Weather</strong> Advisory. Harry became the last of six tropical cyclones, beginning with Doug (1OW) three<br />
weeks earlier, to generate within this NSS monsoon gyre. At 2818002, ship Rports of 25 to 30 kt (13 to<br />
15 m/see) and increased convection on the south side of the circulation prompted the issuance of a<br />
Tropical Cyclone Fcmnation Ale* <strong>JTWC</strong> issued the frost warning on Harry at 2906002. Haq moved<br />
northward through a bnxdc in the subtropical ridge, recurved and accelerated across the southeastern<br />
coast of Honshu near the coastal city of Hamamatsu, which is located 115 nm (215 km) southwest of<br />
Tokyo. W4 surface wind reports suggested that the tropical cyclone had no significant impact on the<br />
Tokyo metropolitan area. The final warning was issued at 3112002, when Harry became an<br />
extratropical cyclone.<br />
91
E 120 125 130 135 140 145 150 155 160 165 170E<br />
--.-<br />
N40<br />
BESTTRACK TC-17W<br />
35<br />
30<br />
MAXSFCWIND 115KT<br />
:..<br />
,,. “...<br />
.... ,... .<br />
.,<br />
,.,. ::<br />
,.., ‘:<br />
!<br />
.,,.<br />
25<br />
+ ‘.., ,*. ........ .............-+-..-.+.<br />
w M<br />
20<br />
,,.,<br />
.:’<br />
.....................................................................................................<br />
.,. . ..<br />
I<br />
LEGEND<br />
t<br />
t<br />
15<br />
10<br />
N5<br />
I<br />
*Hc DISSIPATINGSTAGE<br />
FIRSTWARNINGISSUED<br />
: MST WARNINGISSUED<br />
,..c,,~,, ,,.., ,,,.,.,..................<br />
~<br />
<<br />
i<br />
1<br />
.................................. . ................. ,<br />
\ : 5F”f”fraf”’f”!”’”””’””’2”+d A 7 5“
TYPHOON IVY (17W)<br />
I. HIGHLIGHTS<br />
Ivy was the f~st tropical cyclone to form in the monsoon trough which established itself<br />
eastward through the Caroline Islands. Ivy was also the first significant threat of the typhoon season to<br />
the Mariana Islands. For 4 days, the tropical cyclone tracked west-northwestward, straight towards<br />
Guam, then on 4 September took a sudden, unanticipated turn to the north-northwest and headed for the<br />
Northern Marianas and Japan.<br />
II. TRACK AND XNTENSITY<br />
Ivy developed in a broad monsoon trough near Kosrae in the eastern Caroline Islands. It was<br />
first mentioned on the O1O6OOZSeptember Significant Tropical Wmther Advisory when a consolidated<br />
area of convection started to flare up along the trough. As the convection became more organiz~ a<br />
Tropical Cyclone Formation Alert was issued at 020200Z, followed by a warning at 021200Z. Initially,<br />
Ivy was difficult to locate precisely as it developed a broad, glaciated central dense overcast. On 4<br />
September, a southwesterly monsoon surge linked up with the cyclone, adding even more diffuse<br />
cloudiness (Figure 3-17-1). The surge then sharply pushed the tropical cyclone to the north-northwes~<br />
against the western periphery of the subtropical ridge. As Ivy movtxl northward, it began to rapidly<br />
Figure 3-17-1. Satellite imagery dqicts the southwest monsoon cloudiness approachingIvy while the tropical storm tracks<br />
west-northwestward(041214Z SeptemberDMSP infraredimagery).<br />
93
Figure 3-17-2. Sstellite imagery 10 bum after Figure 3-17-1 shows Ivy ss it reaches<br />
typhoon intensity (0422UZ ScptembsrDMSPvisual imasery).<br />
intensify, and by050000Z<br />
had formed an eye (Figure<br />
3-17-2). At that time, it<br />
was upgraded to typhoon<br />
intensity as it passed 130 nm<br />
(240 km) east of the islands<br />
of Thdan and Saipan in the<br />
Commonwealth of the<br />
Northern Marianas. The<br />
typhoon continued to track<br />
north-northwestward<br />
towards the axis of the<br />
subtropical ridge, and<br />
steadily intensified. During<br />
7 September, Typhoon Ivy<br />
reached its maximum<br />
intensity of 115 kt (59<br />
dsec), then began to slow<br />
down as it made the turn<br />
around the ridge axis.<br />
Although the vertical shear<br />
increased, Ivy entrained<br />
most of its inflow fkom the<br />
warm, moist tropical air<br />
along its southeastern side.<br />
This factor, and its path right<br />
on top of the Kuroshio<br />
Current, resulted in a more<br />
gradual than normal<br />
decrease in intensity as the<br />
tropical cyclone accelerated<br />
south of Japan and<br />
transitioned to an<br />
extratropical low 600 urn<br />
(11 10 km) east of Tokyo.<br />
The final warning was<br />
issued at 1006OO7L<br />
III. FORECAST PERFORMANCE<br />
Initially, Ivy was on a westward course, then turned abruptly towaxds the north-northwest as it<br />
intensifkd. Befm this turn, all <strong>JTWC</strong> forecasts reflected a west-northwest track under the subtropical<br />
ridge (Figure 3-17-3). On 3 September forecaster confidence was high that the ridge to the north of Ivy<br />
would hold and the track would be near Guam. Guam and Rota went into Condition of Readiness 2, as<br />
Ivy moved closer to the islands, and <strong>JTWC</strong> expected the system to reach typhoon intensity as it hit.<br />
The dynamic guidance was in agreement with the west-northwest track until the NOGAPS prognostic<br />
94
,.,.<br />
-. .,<br />
. ... .;.<br />
.,.,<br />
...<br />
0<br />
*::-..,.,,,, .,, “’”””’” ‘““.,<br />
,.,<br />
0 .: ‘..<br />
0,.. ... ..<br />
,,,......” .::<br />
..... .-’ ‘,;<br />
,.:.<br />
...<br />
....-............-..-.......i....+...................................................... .....................................
TYPHOON KINNA (19W)<br />
L HIGHLIGHTS<br />
Kinna was the most destructive tropical cyclone to strike Okinawa since 1987, and the fmt<br />
typhoon to pass directly across the island since Vera in 1986. The typhoon also passed directly across<br />
Sasebo, Japan, and caused extensive damage on Kyushu and Honshu as it raced northeastward after<br />
recurvature. The exceptionally accurate forecasts of the path taken by Typhoon Kinna provided more<br />
than ample lead time for disaster preparation at key DOD installations.<br />
II. TRACK AND INTENSITY<br />
Kinna formed in the western Caroline Islands in the monsoon trough which extended across<br />
the Philippine Sea in early September. On 8 September, analysis of synoptic data revealed that a<br />
circulation was developing southwest of Guam. When satellite imagery showed an increase in<br />
convection near the circulation center, the Significant Tropical <strong>Weather</strong> Advisory was reissued at<br />
08 1800Z to include the disturbance as an area with fair potential for tropical cyclone development. As<br />
the area of deep convection moved west of Guam and showed signs of increased organization, a<br />
Tropical Cyclone Formation Alert was issued at 1004OOZ. The fmt warning on Tropical Depression<br />
19W was at 1012OOZ. Kinna’s northwestward motion on 10 and 11 September was a reflection of a<br />
weak subtropical ridge north of the system which extended along 25°N latitude. The weak ridge<br />
allowed Kima (Figure 3-19-1) to gain latitude as it intensified. At 120600~ the presence of a poorly<br />
Figure 3-19-1. Typhoon Kinna intensifies as it heads for okjnawa Japan(120004Z September DMSP visual imageg).<br />
99
defined eye in the central dense overcast prompted an upgmde of Kinna to typhoon intensity.<br />
On 12 September, a mid-tropospheric trough deepened in the East China Sea and split the<br />
weak ridge near 125’% longitude. In response, ~hoon Kinna turned northward toward the break in<br />
the ridge and tracked across Okinawa+ The eye crossed densely populated southern Okinaw& with a<br />
minimum surface pressure of 958 mb recorded at Kadena AB (WMO 47931) (Figure 3-19-2). The<br />
wind recorder chart tim Futenma MCAS (WMO 47933) graphically describes the three hour passage<br />
of the eye across the station (Figure 3-19-3). On Okinaw4 the peak wind gust observed at Futenma<br />
MCAS (WMO 47933) was% kt (49 m/see) with 82 kt (42 I@X) at Kadena AB, and 95 kt (49 rqkc)<br />
at Naha. Afler recurvature, Kinna accelerated north-northeastwad toward Kyushu and maintained its<br />
intensity. It’s eye wall passed over the cities of Nagasaki and Sasebo on Kyushu on the 13th, with peak<br />
wind gusts of 100 kt (51 mkc) recorded at Metabaru (WMO 47860), located 45 nm (85 km) northeast<br />
of Nagasaki. Kinna continued to accelerate due to deep mid-tropospheric westerly flow, and rapidly<br />
transitioned into an extratropical low as it tracked along the northern coast of Honshu. The final<br />
warning was issued at 141200Z.<br />
III. FORECAST PERFORMANCE<br />
After opting for a recurvatme track on the third warning at 1118(X)Z forecasters correctly<br />
identified the major changes that would occur in the subtropical ridge as the short wave trough moved<br />
off of Asia. <strong>JTWC</strong> forecasters accurately predicted that Kinna would strike Okinawa, Sasebo (on<br />
Kyushu), and later skirt the northern coast of Honshu. Starting with the fourth warning issued at<br />
120000Z, <strong>JTWC</strong> stayed with this forecast track (Figure 3-19-4). As a consequence, <strong>JTWC</strong>’S<br />
performance was substantially better than its objective aids, primrily because the forecast guidance was<br />
much slower than Kinna’s actual forward motion. Forecasters relied heavily on persistence for speed<br />
guidance as Kinna approached the point of nxx.mature and then began to accelerate. Although <strong>JTWC</strong><br />
had a good handle on the path the typhoon would take, the greatest f~t problem was the amount of<br />
acceleration to expect as Kinna underwent extratropical transition.<br />
Figure3-19-2. Microbuograph<br />
trace of surface pressure in<br />
inches of mercury rearded at<br />
Kadena AB, Japan during<br />
Kinns’s passage. The<br />
minimum 28.30 at 1221OOZ<br />
x~ _ to 958 mb.<br />
100
— — —— ..—<br />
IV. IMPACT<br />
As a result of the accurate warnings, preparations to limit the amount of damage on Okinawa<br />
and to sortie ships in the path of the typhoon were made well in advance of Kima’s approach. Despite<br />
the strong winds, damage to military installations on Okinawa and at Sasebo was minimal. Nine deaths<br />
and 65 injuries were attributed to Typhoon Kinna in Japan and on Okinawa. Most of the damage<br />
occurred on Kyushu near Nagasaki and on western Honshu. Press reports indicated 158 houses<br />
collapsed, more than 2,733 were flooded, and nearly 5W,000 households were without power. The<br />
eight inches of rain which fell on Okinawa in a 24-hour period during Kinna’s passage eased the<br />
island’s drought conditions, and temporarily eliminatai water rationing.<br />
F&tre 3-19-3. Futenma MCAS (Wh40 47933), Okinawa JapaILwind recorder chart reflects the three hour<br />
pasasge of Khma’s eye across the statiom<br />
..-..;.>#.:.-.--..- ..~-. -..-- . --:---<br />
D<br />
4:-;:”””””-”1”””’”””---””-!-”<br />
&<br />
e .<br />
““!”””””””””””-”;”””-”””””””””’<br />
~. ..__, !-<br />
Figure 3-19-4. Comparison of <strong>JTWC</strong><br />
3s ................ .:-.<br />
. .. . ................................................................... . .. forecasts issued fmm 120000Z to 140000Z<br />
;*” ._:<br />
September to the best track of Typhoon<br />
~~ /<br />
KiIma. Jlwc fonuats Correcttypredicted<br />
30 .......... ............. .;,... ............,,.;,...,,.,,,,,.................... .........~.,,.,,.,.,..........<br />
the eventual path of - but were slow<br />
*.<br />
to predict Kinna’s acceleration across<br />
:-:<br />
JupmL<br />
2s . -................ .;................................."..................................... ..............................................<br />
;,<br />
+~w~~<br />
r;t;;;;;i::<br />
as ....................................s*i .............................~............................~...........................................<br />
:* .9 : :.:<br />
,:;<br />
;.:<br />
j.- ;<br />
N15 ‘<br />
101
......................<br />
...............................<br />
Wl!l-w’<br />
......................<br />
...............................<br />
..............................<br />
..+,... -.-.-.-—. -.”--.:<br />
.:.:.. ,. ..., i<br />
~,!<br />
.+” . . . ..—— . . . . . . . .<br />
......................... ‘~s<br />
u ~%<br />
. . . .....<br />
:●<br />
●<br />
.-<br />
L ,. ..w .... ...i* .. ...... .. .<br />
“h<br />
● \<br />
8F e<br />
\<br />
● ti<br />
k . . -<br />
P<br />
\ m<br />
.<br />
‘i * c<br />
VJ<br />
\<br />
m<br />
9 *<br />
•1 . .. . .. .. . .. . .. . . . . . .. . .. . .. .<br />
\w 2<br />
*<br />
1<br />
... ...g ......<br />
pm<br />
\.<br />
c-l<br />
an
TROPICAL STORM LUKE (20W)<br />
I. HIGHLIGHTS .<br />
Tropical Storm Luke (20W), a broad monsoonal cyclone, had the largest initial position errors<br />
of the season. Its unusual recurvature track was the result of an extension of the mid-latitude westerlies<br />
deep into the tropics in mid-September, which temporarily broke down the subtropical ridge in the<br />
western Pacific.<br />
Figure 3-20-1. The exposed low-level center of Tropical Storm Luke as it makes its<br />
closest point of approach 160 ntn (295 km) esst of Okinawa (1723362 September<br />
DMSP ViSUd<br />
II. TRACK AND INTENSITY<br />
Luke formed from a disturbance that passed near Saipan late on 14 September. It was initially<br />
mentioned on the 130600Z<br />
Significant Tropical <strong>Weather</strong><br />
Advisory. As the disturbance<br />
tracked west-northwestward,<br />
improved upper-level anticyclonic<br />
outflow and sea-level pressure falls<br />
of 3 mb led to the issuance of a<br />
Tropical Cyclone Formation Alert<br />
at 141130Z. At 141800Z, the first<br />
warning on Tropical Depression<br />
20W was issued when the synoptic<br />
data indicated that a closed<br />
circulation had developed. At this<br />
time, Luke was a monsoon<br />
depression, with a ring of 30 kt (15<br />
mhec) winds around a large centnd<br />
area of light and variable winds.<br />
The cyclone continued to slowly<br />
intensi& over the next 48 hours as<br />
it tracked west-northwestward. On<br />
17 September, satellite imagery<br />
indicated that the circulation had<br />
lost organization, and that it<br />
appeared to be moving westward,<br />
but on 18 September an exposed<br />
low-level circulation revealed that<br />
the tropical storm had, in fact,<br />
turned north-northwestward (Figure<br />
3-20-1). Shortly afterward, Luke<br />
made another sharp change in<br />
direction to the east as a midtropospheric<br />
trough brought<br />
imagery).<br />
103<br />
westerly winds deep into the tropics<br />
and caused the subtropical ridge,
which had been holding the system to a westward track, to recede eastward (Figure 3-20-2).<br />
Meanwhile, the vertical wind shear between Luke and the westerlies scrambled the cloud pattern during<br />
the evening hours. This left <strong>JTWC</strong> attempting to extrapolate a track to the north-northwest, while the<br />
obscured low-level circulation of Luke (Figure 3-20-3) was actually accelerating northeastward and<br />
transitioning into an extratropical cyclone. This misinterpretation caused <strong>JTWC</strong> forecasters to issue an<br />
unnecessary Tropical Cyclone Formation Alert at 181500Z on a peripheral convective area. The alefi<br />
was canceled at 190400Z. The final warning on Tropical Storm Luke was issued at 191200Z.<br />
III. FORECAST PERFORMANCE<br />
E 124<br />
N3S<br />
us<br />
130 LM 140 14s Ha E<br />
Sa<br />
(a)<br />
2s<br />
2a<br />
N 15<br />
E lM<br />
NW<br />
3B<br />
Ill<br />
12s<br />
13s 140 14s 15tE<br />
w ;:<br />
-<br />
m<br />
u+<br />
. ........... ........ . ................. ... . . ‘~ . ......J.. . . j... d........ ...........s!<br />
w<br />
+; d
105
On 17 and 18 September, uncertainty over the initial warning positions of Tropical Storm<br />
Luke underscored the limitations that can occur in locating a poorly defined cloud system center from<br />
only infrared satellite images, and the effect these limitations can have on <strong>JTWC</strong> warnings. A<br />
comparison of <strong>JTWC</strong> forecasts with the verifying best track graphically illustrates where erroneous<br />
initial positions misled <strong>JTWC</strong> forecasts (Figure 3-20-4). Until 161800Z, <strong>JTWC</strong> warnings were in<br />
agreement that Luke would recume east of Okinawa and head toward Honshu ahead of an approaching<br />
mid-tropospheric trough. These warnings accurately represented the future path of the cyclone and had<br />
low forecast errom. Starting at 170000Z, f-asters adopted the scenario that the system was moving<br />
westward, causing the recurvature forecast tracks to be adjusted further westward, threatening Okinawa.<br />
A relocation of the warning position at 180000Z was too late to prevent the evacuation of some aircraft<br />
from Kadena AB on Okinawa. Another major relocation of the cyclone occurred at 190000Z because<br />
of the significant track change which occurred during the nighttime. Using infrared imagery, satellite<br />
analysts had a challenging task locating the poorly defined circulation center residing beneath a dense<br />
cloud shield. In turn, <strong>JTWC</strong>’S extrapolation of the perceived short-term motion resulted in large<br />
forecast errors.<br />
IV. IMPACT<br />
Although Luke did not attain typhoon intensity, its broad area of gale-force winds and<br />
torrential rains affected large portions of the western Pacific. On 17 September, <strong>JTWC</strong> forecasts<br />
resulted in the unnecessary evacuation of aircraft stationed at Kadena AB, costing an estimated<br />
$300,000. Later, on 19 September, record rainfall from Luke caused extensive flooding in central<br />
Japan, resulting in the deaths of at least 8, with 10 other people reported missing and damage to 28,000<br />
E12S 130 lm 140 14s EWE<br />
N3S<br />
Z<br />
!4<br />
;’<br />
4*:<br />
,8’ :<br />
/’ :<br />
30<br />
................................................... ...........<br />
#<br />
#:<br />
48’<br />
~----<br />
--<br />
_--,<br />
2s<br />
m<br />
#:<br />
~~<br />
>: -’ /<br />
‘ ~~~~~~~~ -: \ ~~~~~~~~~~<br />
@<br />
:0”<br />
~~;’ -’ ~~.!-.<br />
-<br />
(a)<br />
............. ~* :*<br />
N 1S<br />
106
125E<br />
N3S<br />
- j;<br />
130 13s 140 14S E<br />
c=<br />
30<br />
.......................................<br />
2s<br />
N241<br />
*. .<br />
(b)<br />
E12S 130 13s 140 145 lSOE<br />
3s<br />
. .<br />
c=<br />
(c) 30<br />
~:<br />
. .........<br />
2s<br />
:* ,..b ,....,.. ........... .........<br />
b<br />
. ...........................................................<br />
i b\<br />
‘Q \\<br />
●.<br />
*. : a<br />
NM<br />
Figure 3-204. Comparison of the oficial forecast to the final best hack for (a) 141800Z to 161800~ (b) 161800Z to 18- and<br />
(C) 180600Z to 190000Z September.
E 110 115 120 125 130 135 140 145 150 155 160 165 170 175E<br />
N 45<br />
40<br />
35<br />
30<br />
----<br />
LEGEND<br />
6-HRBESTTRACKPOWTION<br />
SPEEDOFMOVEMENT(K’J’)<br />
INTENSITY(KT)<br />
POSITIONATXXANO02<br />
TROPICALDISTURBANCE<br />
TROPICALDEPRESSION<br />
TROPICALSTORM<br />
TYPHOON<br />
SUPERTYPHOONSTART<br />
SUPERTYPHOONEND<br />
EXTRATROPICAL<br />
SUBTROPICAL<br />
DISSIPATINGSTAGE<br />
FIRSTWARNINGISSUED<br />
LASTWARNINGISSUED<br />
~ 25<br />
..........................................<br />
20<br />
. . ........<br />
15<br />
1<br />
.................<br />
ABPW<br />
C/ 00<br />
10<br />
... . ... ......... ...... . .<br />
.. . .,,.......... ... ..<br />
N5
SUPER TYPHOON MIREILLE (21W)<br />
I. HIGHLIGHTS<br />
The second super typhoon in the Northwest Pacific of the year, Mireille became the worst<br />
storm to strike Japan in three decades. Mireille outgrew its early midget size and reached super<br />
typhoon intensity several days before threatening Okinawa. Recurving just to the southwest of<br />
Okinawa the typhoon accelerated, cutting a path across western Kyushu and Honshu. Then over the<br />
Sea of Japan, Mireiile transitioned into an intense extratropical cyclone which slammed into northern<br />
Honshu. Mireille was part of a three storm outbreak in September - first with Tropical Storm Luke<br />
(20W) and Typhoon Nat (22W), and later with Typhoons Nat and Orchid (23W).<br />
II. TRACK AND lNTENSITY<br />
Mireille was f~st detected as a poorly organized area of cloudiness in the monsoon trough<br />
over the southern Marshall Islands. The disturbance was fnt mentioned on the 130600Z Significant<br />
Tropical <strong>Weather</strong> Advisory. An increase in the amount of the tropical disturbance’s deep convection<br />
prompted a Tropical Cyclone Formation Alert at 1512002. Assuming normal development,<br />
forecasters issued the first warning for a 30 kt (15 m/see) system at 160000Z. However, this was not<br />
to be a normal system. This was reflected in the 160600Z warning which upgraded the intensity to 45<br />
kt (23111/scx)and identifiedthe system as very compact and rapidly intensifying. For several days the<br />
tropical system drifted to the west-northwest under the influence of the subtropical ridge. On the<br />
evening of 17 September, Mireille began to track to the west-southwest, creating some concern that it<br />
would target Guam, but 24 hours later the typhoon acquired a westward track and passed 12 nm (20<br />
km) north of Saipan on 19 September as a midget typhoon. Then, on 21 September, the typhoon<br />
(Figure 3-21-1) began tracking to the northwest along the southwestern periphery of the ridge, and<br />
began interacting with T~hoon Nat (22W). This binary interaction (Figure 3-21-2) resulted in the<br />
temporary capture of the smaller typhoon, Nat, and its subsequent movement southward in the South<br />
China Sea. After releasing Nat, Mireille recurved under increasing southwesterly mid-tropospheric<br />
winds, and accelerated northeastward past Okinawa. Extratropical transition occutmd in the Sea of<br />
Japan and the intense baroclinic storm continued northeastward, first passing over the extreme<br />
northern section of Honshu and then moving over southern Hokkaido.<br />
The tropical cyclone initially peaked at 75 kt (39 rn/see) on 16 September and remained at<br />
moderate typhoon intensity until 21 September when it commenced a second deepening episode<br />
enroute to super typhoon intensity. This second episode was associated with decreasing upper-level<br />
wind shear from Tropical Storm Luke (20W) as that system weakened and accelerated northward.<br />
After peaking at 130 kt (65 m/see) for a day (2212002 to 230600Z), Mireille began to slowly weaken.<br />
Mireille’s size, which was determined by the diameter of its outer-most closed isobar, began<br />
to gradually increase after an intensity of 80 kt (40 m/see) was reached, and continued through<br />
extratropical transition.<br />
III. FORECAST PERFORMANCE<br />
As Mireille passed the Mariana Islands, it was difilcult to determine how much the thin<br />
extension of the subtropical ridge would affect the cyclone’s track. The fust indications of a possible<br />
west-southwestward track excursion toward Guam came from the Beta Advection Models. OTCM<br />
also locked onto a west-southwest track after the turn had started. However, both FBAM and OTCM<br />
109
overemphasized the southward excursion which lasted only a day.<br />
After the system had passed the Marianas, recurvature forecasts were premature. The<br />
NOGAPS model underestimated the strength and duration of the subtropical ridge, and as a nxult all<br />
of the dynamic objective aids indicated early recurvature. The underestimation may have been the<br />
model’s response to receiving three simultaneous tropical cyclone boguses in the basin corresponding<br />
to three storms. Also, the bogus, initializing the NOGAPS model, overplayed the size of Mireille,<br />
which in turn overemphasized the storm’s weakening influence on the ridge.<br />
IV. IMPACT<br />
As Mireille approached the Mariana Islands, the wobble of its track and subsequent<br />
adjustment of the forecast to the north and back to the west, resulted in a flurry of disaster<br />
preparedness preparations on Guam northward through Saipan. When the midget typhoon passed<br />
north of Saipan, no reports of deaths or injuries were received. However, the island did suffer 70-80%<br />
crop damage, in addition to trees being uprooted, and coral roads seriously eroded. Most damage was<br />
confined to the north end of the island. Okinawa experienced 27 hours with winds greater than 50 kt<br />
(25 mkc) and Kadena AB recorded a peak gust of 82 kt (41 m/see). The island also recorded a total<br />
rainfall of 10.14 inches, and as a result, was able to cancel water rationing for the remainder of the<br />
110
year. Press reports from Japan indicated that 52 deaths were associated with the typhoon, including all<br />
ten crew members of a South Korean freighter that capsized while in port at Hakata on the island of<br />
Kyushu. Press reports also indicated 777 injuries, the flooding of approximately 10,000 homes, and<br />
power outages affecting nearly 6 million homes, Japanese crop damage was estimated at US$3<br />
billion, with the apple crop being particularly hard hit. Nagasaki (W&IO 47855) reported winds of 72<br />
kt (37 m/see) gusting to 118 kt (61 m/see). On northern Honshu, Misawa AB recorded the most<br />
destructive winds since the U.S. started record-keeping for the base in 1946. For more than 5 hours<br />
the winds were 50 kt (25 m/see) or greater and included a peak gust to 82 kt (41 rnkc). The previous<br />
all-time record for the base was 70 kt (35 mkc) in March of 1987. The resulting wind damage was<br />
estimated to be between $0.5 to $1.5 million dollars. Several warehouse roofs were tom off, storage<br />
sheds were reportedly knocked off their foundations, and trees were blown down. The Pacific Stars<br />
and Stripes reported: “Base ofllcials credit the Joint T~hoon Warning Center in Guam with early<br />
storm forecasts that allowed them to warn the base population and get million-dollar aircraft into<br />
hardened shelters.”<br />
..... ... .................................................................................................................................... ...........+...................................................<br />
MIDPOINT<br />
.. . . . ............. .. . . . .........................................................................................<br />
ES~APE .; ~ {<br />
-20 -15 -lo -5 0 5 10 15 24<br />
DISTANCE (LONGITUDE) FROM MIDPOINT<br />
Figure 3-21-2. A plot of 6-hourly positions relative to the common midpoint shows the binary interaction between<br />
Typhoons Mireiile and Nst (22W).<br />
111
I<br />
E 100 105 110 115 120 125 130 135 140 145 150 155E<br />
N 40 ..: ; :...,..<br />
35<br />
30<br />
25<br />
#<br />
G 20<br />
3TYPHOON NAT<br />
BEST TRACK TC-22W<br />
15 SEP- 02 OCT 91<br />
MAXSFC WIND 110KT<br />
MINIMUM SLP 933MB9<br />
E 115<br />
\<br />
* *<br />
***<br />
*<br />
2-s,<br />
B<br />
L - 02/(iOZ - ;,.
TYPHOON<br />
NAT (22W)<br />
I. HIGHLIGHTS<br />
Typhoon Nat’s motion was highly erratic and included four major track changes, two<br />
intensification episodes, and two landfalls in 17 days. It persisted longer than any other tropical cyclone<br />
that formed in the western North Pacific during 1991, requiring a total of 61 warnings which was only<br />
18 warnings shy of the record set by T~hoon Rita (1972). Its track and behavior was reminiscent of<br />
Twhoon Wayne (1986).<br />
F@re 3-22-1. Moonl@ imagery reveals the eyes of Typhoons Nat and Mireille<br />
(21 W). Lightning flashes can be seen east of Taiwan near point A (221059Z<br />
SeptemberDMSP visual imagery).<br />
113<br />
II. TRACK AND INTENSITY<br />
Nat’s convection developed<br />
in the monsoon trough just east of<br />
the Luzon Strait and was first<br />
mentioned on the 1506002<br />
Significant Tropical <strong>Weather</strong><br />
Advisory. At 1523002, improved<br />
cloud organization prompted a<br />
Tropical Cyclone Formation Alert,<br />
The alert was followed only an<br />
hour later by the first warning<br />
based on a 27 kt (14 m/see)<br />
synoptic report and an estimated<br />
minimum sea-level pressure of<br />
1003 mb. Nat initially intensifkzi<br />
very slowly due to its proximity to<br />
land and to strong upper-level<br />
winds outflowing from Tropical<br />
Storm Luke (20W) which was<br />
located to the east. The influence<br />
of these two factors lessened after<br />
a surge in the southwest monsoon<br />
carried Nat to the east through the<br />
Luzon Strait, and Luke recurved.<br />
From 21 through 22 September,<br />
Nat underwent rapid deepening to<br />
almost super typhoon intensity.<br />
After Luke’s departure, the ridge<br />
re-established itself and Nat<br />
(Figure 3-22-1 and 3-22-2)<br />
reversed direction to enter the<br />
Luzon Strait again. Nat made<br />
landfall (Figure 3-22-3) on the<br />
southern tip of Taiwan and rapidly<br />
weakened. Conrnbuting factors to
the weakening were the proximity of the high mountains of Taiwan and the approach of ~hoon<br />
Mireille (21 W) from the southeast with its outflow causing increased upper-level wind shear. During<br />
the binary interaction with Mireille (See Figure 3-21-2 in Mireille’s write-up), Nat was downgraded to a<br />
tropical depression before the larger system, Mireille, escaped northeastward. Nat reintensifkd to<br />
typhoon intensity before making landfall, then dissipated over the rugged terrain of southeastern China.<br />
The final warning was issued at 0206002.<br />
III. FORECAST PERFORMANCE<br />
Because the passage of two tropical cyclones to the east eroded the subtropical ridge, the<br />
steerhw flow in which Nat was embedded was weak. Track forecasting moved to tw a real challen~e, --<br />
bu~ ‘ forecast errors were<br />
respectable considering the erratic<br />
nature of the tropical cyclone.<br />
From the suite of objective aids,<br />
FBAM and CSUM seemed to<br />
provide the best overall<br />
performance. They both simulated<br />
the loop to the south caused by the<br />
surge into Tropical Storm Luke<br />
(20W); however, they were less<br />
successful in forecasting the<br />
binary interaction with Super<br />
Typhoon Mireille (21W). OTCM<br />
and NOGAPS had a ve~ difilcult<br />
time with this system. As an<br />
example, Figure 3-22-4 shows the<br />
forecast guidance for the 230000Z<br />
warning while Nat was over<br />
southern Taiwan.<br />
IS IMPACT<br />
Even though Nat was small in<br />
size and ,no reports were received,<br />
the typhoon’s crossing of extreme<br />
southern Taiwan and, later, the<br />
southern coast of China must have<br />
disrupted communications and<br />
transportation and caused some<br />
localized damage.<br />
Figure 3-22-2. The radar at Haulkn (WMO 46699), Taiwan paints Nat’s concentric<br />
minbands (2213002 September photo courtesy of the Central <strong>Weather</strong>Bureaw Taipeii<br />
Taiwan).<br />
114
Figure 3-22-3. Nat crosses southern Taiwan<br />
(2301 1(LZSeptemberDMSP visual imagery).<br />
Nii<br />
Us 134<br />
+<br />
30<br />
Figure 3-22-4. Forecast guidance suppmting the ~<br />
2300002 September warning for Typhoon Nat,<br />
20<br />
.<br />
N1s<br />
115
E 120 125 130 135 140 145 150 155 160 165E<br />
N 50<br />
,.<br />
.:<br />
: . .. :. ;<br />
;.’ ‘,..,,, :<br />
,, . .<br />
TYPHOON ORCHID<br />
: ..’<br />
.,./’<br />
BEST TRACK TC-23W<br />
,,:, +.<br />
01 OcT- 14 Ocr 91<br />
,.<br />
.,..’<br />
45 MAX SFC WIND 115KT<br />
.........<br />
$<br />
,..’<br />
... . .... .. .<br />
MINIMUM SLP 927MB<br />
++~<br />
40<br />
35<br />
-<br />
& 30<br />
...’...<br />
,..<br />
..... . .,,,,<br />
.,. ....<br />
,,;.,, ..,:<br />
..-%.....,.<br />
,..,.<br />
..’”<br />
. ...,,...<br />
:.,,<br />
,,.,, :.,:..<br />
.<br />
...::,. ..............<br />
,;,:,<br />
,,.,:,!<br />
,.<br />
..,.: ..’<br />
.....,,., ... ;<br />
. .,.,.’<br />
,.:!<br />
,,,.. :<br />
,...............................................i .............................<br />
:..,,,,,:.:<br />
{.j .::,.,.,<br />
:.CC<br />
............!.. .... .......... .......... ......<br />
55,,,y<br />
+4<br />
....,: L - l&OOZ++++<br />
~ 17 ++<br />
.,,<br />
:. .......... .....++&+. ................<br />
●* ++ \<br />
k<br />
++y<br />
i3 j<br />
......................................... ..,,,.,,,..,,,, .... ....<br />
*++<br />
.,,,,,,14,,,,,<br />
++<br />
.,..,,,,,............<br />
,,..,,...............<br />
.... ... .. ,,,..,,<br />
.......................<br />
. . ,..<br />
. ... .... .....<br />
25<br />
.. .. ....“.<br />
20<br />
15<br />
,...’<br />
..:,.<br />
1(<br />
..,..-........,...,IC<br />
. ,. . .,.:. 1<br />
‘:.<br />
,...’.’”<br />
......................<br />
TCFA .. .. 3.,.~::,,. . ;.<br />
J/,<br />
● 0 ‘. ..... 2<br />
00 6<br />
9a ~‘“”” *00 A<br />
\<br />
\ . . . ...0.<br />
~ 35b~. f<br />
,*o<br />
F - ~/OOZ *<br />
.............<br />
Pw<br />
.<br />
“lC<br />
N 10
TYPHOON ORCHID (23W)<br />
I. HIGHLIG13TS<br />
Typhoon Orchid (23W) was the fmt tropical cyclone to develop during the month of October.<br />
Orchid’s formation coincided with TWhoon Pat’s (24W) and, as they matured, they interacted, causing<br />
Orchid to slow to 6 kt (11 krn/hr) about 200 nm (370 km) off the coast of Japan. This brought<br />
prolonged rains and widespread flooding to Tokyo and surrounding cities.<br />
II. TRACK ANDINTENSITY<br />
Orchid formed northwest of Guam in a broad monsoon trough that extended from the South<br />
China Sea eastward through the Caroline Islands and was included as a suspect area on the O1O6OOZ<br />
October Signii-leant Tropical <strong>Weather</strong> Advisory. A mid-latitude trough weakened the mid-tropospheric<br />
subtropical ridge to allow the tropical disturbance to slowly gain latitude. When low-level convergence<br />
created by a surge in the monsoon westerlies enhanced convection, forecasters issued a Tropical<br />
Cyclone Formation Alert at 030800Z. The first warning followed on Tropical Depression 23W at<br />
040000Z. (Post analysis of satellite derived current intensity estimates indicated tropical storm intensity<br />
most probably had been reached 12 hours before the first warning through normal, rather than rapid<br />
deepening.) Orchid tracked due westward south of there-established subtropical ridge and developed<br />
into a typhoon. Orchid’s intensity peaked at 120 kt (62 m/see) just before recurvanue, as increased low-<br />
Ievel convergence in the southern quadrant enhanced convection, and dual outflow channels aloft were<br />
present. Rccurvature occurred near 130”E as the mid-tropospheric subtropical ridge receded eastward,<br />
allowing Orchid to move north and recurve. Typhoon Orchid slowly accelerated after recuxvature, but<br />
on 10 October it slowed down south of Japan as interaction started with Typhoon Pat (24W) (Figure 3-<br />
23-1). Over a WI-hour period tim approximately 1006OOZ- 120000z Orchid “stair-stepped” to the<br />
north then back to the northeast apparently due to some binary interaction with Typhoon Pat. As Pat<br />
recurved to the east of Orchid and accelerated, Orchid started speeding up, following Pat into the<br />
westerlies, and slowly weakening. The fired warning was issued at 130000Z as Orchid transitioned into<br />
an extratropical low presswe system.<br />
III. FORECAST PERFORMANCE<br />
During recurvature, Orchid was expected to make a more gradual, broader turn around the<br />
ridge because the steering flow was weak, as evidenced by the slow speed of motion horn 4 to 6 kt (7 to<br />
11 km/hr) on 6 to 7 October. Initially, the typhoon was forecast to pass near Okinawa, west of the<br />
guidance provided by most of the dynamic aids (Figure 3-23-2). After recurvature, cross-track forecasts<br />
were excellent, although the along-track speed errors were large because the expected forecast<br />
acceleration did not take place until Pat moved north of Oxhid.<br />
VI. IMPACT<br />
Typhoon Orchid spent much of its life over the open ocean, away from land. However, its<br />
slow movement south of Japan caused prolonged rains there, and created huge ocean swells, which<br />
combined with those from Pat to produce high waves and hazardous surf as far away as Guam on<br />
October 12, where the surf claimed 2 lives. On 14 October, landslides, floods, heavy winds, and<br />
torrential rains were reported in Tokyo and the surrounding cities. One person died after being swept<br />
away by a swollen river, 14 people were injured and wind gusts to 50 kt (26 m/see) were recorded in<br />
117
—.<br />
and around Tokyo. Orchid interrupted transportation across the island, produced 96 landslides, flooded<br />
over 675 homes, and caused extensive road damage in Japan.<br />
Figure 3-23-1. Typhoon Orchid slowly we.skms as it psmllels the south coast of Honsluq Japsn (1123222 October DMSP<br />
Visusl imsgery).<br />
118
E 120<br />
N 45<br />
125 130 135 140 145 150 155 160 E<br />
40<br />
35<br />
30<br />
25<br />
... ../— # ........................................................./ \ ....-..-..-....+.....-..-.....-..d..*<br />
W-V b“<br />
.......U ..&~. A<br />
J .<br />
f<br />
7 ....<br />
20<br />
N 15<br />
Figure 3-23-2.<br />
expected.<br />
ITWC forecssts when compared to the fiial best track show that Orchid turned north sooner than
..—- E 115 120 125 130 135 140 145 150 155 160 165 170 175E<br />
N 50<br />
., . . . ,<br />
TYPHOON PAT ...’<br />
,..,:<br />
: :. ,.:’ :;<br />
I<br />
45<br />
40<br />
35<br />
BEST TRACK TC-24W<br />
01 OcT- 14 OCT 91<br />
MAX SFC WIND 125KT<br />
MINIMUM SLP 916MB ,,,,,<br />
. ; . : ....’ :<br />
..’<br />
..... .... ..(’’’” ~.::. .,:,,,:,,,,,,,,,:,., ,,.:<br />
j,.<br />
.i<br />
‘+...<br />
, .<br />
...,,<br />
.<br />
,.~<br />
,,.:::.-..., ,,.......’+..... .,.,.,.., ..........4.-..,...—....~...... ~ .<br />
... .. -“””y..: ~. .:”””- “’” “’”’”<br />
“’r-““”“’ “’”“’“‘----- j’‘-’--’-<br />
.-.‘. : ,,., .:. .. : ‘:,., ~ ,.<br />
. i y,, ,. ,.<br />
...,, >. i<br />
.,.. ,.<br />
,:,,,,j. ..”-.,,,,:<br />
:.....,,. . ,,. .,<br />
,..”<br />
.,: ,,;,’ ‘:., ~ : ,.’, ,’,,... :<br />
: ,’... .t . .... .<br />
G<br />
o<br />
30<br />
25<br />
20<br />
..............<br />
15<br />
..............<br />
10<br />
N5<br />
EXTRA’IROPICAL<br />
SUB’lROPICAL<br />
DISSIPATINGSTAGE<br />
FIRSTWARIWNGISSUED<br />
LASTWARNINGISSUED<br />
..............
TYPHOON PAT (24W)<br />
I. HIGHLIGHTS<br />
Typhoon Pat developed at the same time in early October as Typhoon Orchid (23W). Its rapid<br />
intensification phase was correctly predicted by a recently developed pixel-counting forecast scheme.<br />
Although Pat initially trailed Orchid as the two tropical cyclones matured, it accelerated and was the<br />
first to become extratropical.<br />
II. TRACK AND INTENSITY<br />
After Typhoon Nat (22W) dissipated over southeastern China and the monsoon trough reestablished<br />
itself eastward into the Caroline and Marshall Islands, two tropical disturbances formed in<br />
this trough. These disturbances were discussed on the O1O6OOZOctober Significant Tropical <strong>Weather</strong><br />
Advisory. Pat developed from the disturbance in the western Marshall Islands, and the other<br />
disturbance to the west became T~hoon Orchid (23W). Initially, tropical cyclone development was<br />
hampered by vertical wind shear. On 4 October, vertical shear decreased and the depression began to<br />
slowly intensify. Based on a steady increase in convective organization, a Tropical Cyclone Formation<br />
Alert was issued at 0506302, followed by the fmt warningat0512002. Pat intensifkd at a normal rate<br />
of 20 kt (10 m/see) per day until 0618002, when it began to rapidly intensify (Figure 3-24-l). At about<br />
the same time, the ridge weakened to the north, allowing the typhoon’s track to change from westnorthwestward<br />
to north-northwestward for the next 72 hours. Typhoon Pat attained a maximum<br />
Figure 3-24-1. Typhoon Patnears it maximum intensity (0722372 OctoberDMSPvisual satellite imagery).<br />
121
intensity of 125 kt (64 m/see) on 8 October, approximately 320 nm (590 km) east of Pagan Island in the<br />
northern Mariana Islands. As the system began to weaken, the subtropical high located to the east<br />
maintained its strength and position. As a result, Pat began to approach @hid, which was recurving<br />
south of Japan. By 1000OOZ,the two systems had closed to within 1000 nm (1850 km) of each other.<br />
Instead of undergoing binary interaction and orbiting around a common midpoint, Pat and Orchid<br />
maintained their separation and moved in tandem to the north-northeast (Figure 3-24-2). Although<br />
initially the trailing cyclone, Pat accelerated poleward fw and the slow-moving Orchid followed in its<br />
wake. Both became extratropical at 130000Z.<br />
III. FORECAST PERFORMANCE<br />
Interaction with Orchid was the most difficult portion of Pat’s track to forecast. Initially the<br />
prognostic messages indicated that Orchi& which had xecurved first and was located further north than<br />
Pat, was more likely to be the first to accelerate northeastward. However, Pat became the f~st to<br />
accelerate. Surprisingly, climatology was the best-performing forecast aid at 72 hours, with a forecast<br />
error of only 201 nm (370 km).<br />
The start of Pat’s rapid intensification on 7 October was successfully predicted by a new<br />
pixel-counting technique (Mundell, 1990) which compares the ratio of inner-radius convection to outermdius<br />
convection to forecast rapid intensity change (Figure 3-24-3). Overall intensity forecasting errors<br />
were slightly higher than the average.<br />
Figure 3-24-2. Typhoons Pat and Orchid (23W) are boti movrng north-northeastwardin tandem (101011Z October DMSP<br />
infraredimagery).<br />
122
IV. IMPACT<br />
<strong>JTWC</strong> did not receive any information of direet impacts of Pat. However, indirectly, the slow<br />
movement of Pat and Orchid set up significant long period ocean swells that gave Guam some of its<br />
largest surf of the year. At least two people lost their lives on Guam due to the high surf.<br />
50000+<br />
Typhoon Pat (24W)<br />
45000.<br />
40000.<br />
35000.<br />
■ 24hr Running Meanfjor radius 0-2°<br />
. 24hr Running Mean for radius 2-6°<br />
30000.<br />
25000 .<br />
20000 .<br />
15000<br />
lmr)o~ -----<br />
I I I<br />
m)uu.<br />
0.<br />
05 06 07 08 09 10 11<br />
October<br />
Figure 3-24-3. Tme series of the relative amounts of inner convection (measured within 2° of the cloud<br />
system center) colder than -75°Celsius andouter ccmvection(measuredwithin2°-60of the center) colder than -<br />
65°Celsk. According to Mundell (1990), when the lines representing24-hour runningmean averages of both<br />
inner and outer convection cross, rapidintensificationis likely to occur over the next 12 hours.<br />
123
E 110 115 120 125 130 135 140 145 150 155 160E<br />
N 35<br />
........... .<br />
: ,,,<br />
.,<br />
SUPERTYPHOON RUTH<br />
LEGEND<br />
BEST TRACK TC-25W<br />
ti 6-HRBESTTRACKPOSITION<br />
160C’r- 01 NOV91<br />
SPEEDOFMOVEMENT(KT)<br />
: INTENSITY(KT)<br />
MAX SFC WIND 145KT<br />
30<br />
,,:.......,<br />
.......... ,,,<br />
c POSITIONAT XX/WOOZ<br />
MINIMUM SLP 892MB<br />
~ TROPICALDISTURBANCE<br />
25<br />
20<br />
‘“’’””””’ 25 !<br />
““”~ i<br />
!<br />
:;30 $-31/Qoz\<br />
30,%!: ..,””’’”, ..1.4...1. . , i t<br />
..................................l ...............!..... ..................... . \<br />
30 ,,;:” ;.:” M : i<br />
,., .. ~,~....;~ lo ~g,..’ *****4*** 4 **~<br />
.,...,, ..... ‘$ ‘o<br />
“‘:”’ ““’”’”””40 ; ~ 7 ; ““<br />
●O:<br />
31 \<br />
+\\<br />
‘“::’”””’””’””””2K ...i.......s............. .: .....m0.3%.c.~ ............................ 1~ .$........ 115 ......... .Ifs.. ~lfa~....<br />
135.J...,<br />
........................<br />
~ TROPICALDEPRESSION<br />
&OjI&/ STORM<br />
SUPERTYPHOONSTART<br />
s*Jmo:*l&.ND<br />
$$ ! SUWIROPICAL<br />
*T D~s~A~G sTAGE<br />
FIRSTWARNINGISSUED<br />
L LASTWARNING ISSUED<br />
K<br />
A<br />
15<br />
10<br />
5<br />
EQ<br />
............-.......-......7..<br />
,..<br />
..’<br />
,,:<br />
.,:,<br />
‘ 21 ~; b<br />
,..,..-... ——...-=+....+.-.-.....<br />
-*;~-----.--.j..-.<br />
iTcFAYaO F - 20/18Z i<br />
20[”<br />
, P../o~ororq.q ““<br />
..<br />
.-..*-<br />
.<br />
.-.-_...+. .,.........__-.. .-... -+.<br />
,. Y--""--"--~--``-"--"`"`""`-"""`--:""-'--"---`""`"`-`"4g-"-"----18------ -----i ---------<br />
..;.’”” ““ : ; .,:.<br />
. j 17<br />
.:., \<br />
~6c<br />
:, ;., ,;,. .,, $<br />
y: ...’<br />
,,.,.... ; ..... ,, ...”. ... \<br />
.,...... . ,.,’..’ :.,...:<br />
:..,’<br />
........... ,%... ,.., ,” .,., , ‘,..I
SUPER TYPHOON RUTH (25W)<br />
I. HIGHLIGHTS<br />
Super Typhoon Ruth was the second most intense tropical cyclone of 1991. With regard to<br />
intensity, forecasters successfully used climatological analogs to anticipate Ruth’s rapid deepening to<br />
super typhoon intensity in the Philippine Sea. However, in contrast, the track forecasts based on<br />
NOGAPS prediction of early recumature had the largest f~cast track errors of the year.<br />
II. TRACK AND INTENSITY<br />
Ruth appeared as a tropical disturbance with a closed circulation at the surface between Chuuk<br />
and Pohnpei. Observed pressure<br />
falls of 1 to 2 mb over the previous<br />
24 hours persuaded forecasters to<br />
mention the disturbance on the<br />
160600Z October Significant<br />
Tropical <strong>Weather</strong> Advisory as an<br />
area with fair potential for<br />
development. On 18 and 19<br />
October, there was a steady<br />
increase in convection as the<br />
disturbance moved westnorth<br />
westward through the<br />
Caroline Islands. The increased<br />
convection prompted the issuance<br />
of a Tropical Cyclone Formation<br />
Alert at 2OO1OOZ. Based on a<br />
Dvorak intensity estimate of 25 kt<br />
(13 m/see) and increased<br />
convective organization, the first<br />
warning on Tropical Depression<br />
25W was issued at 201800Z.<br />
Ruth intensified<br />
steadily as it moved northwestward<br />
between Guam and Ulithi. On 22<br />
October, an eye formed as the<br />
tropical cyclone “stair stepped”<br />
westward. After assuming a westnorthwestward<br />
track across the<br />
Philippine Sea, Ruth rapidly<br />
intensified, reaching super typhoon<br />
intensity only 30 hours after its eye<br />
fwst appeared on satellite imagery<br />
(Figure 3-25-l). Ruth’s track and<br />
explosive intensity increase were
consistent with climatological guidance. Nine analog tropical cyclones from a 20-year data set (Table<br />
3-25-1) were found. Six of the nine had rapidly intensified to super typhoon intensity, and the majority<br />
had maintained a west-northwest track across the Philippine Sea. Ruth’s intensity peaked at 145 kt (75<br />
II@C) at 2406002 and then slowly weakened as the typhoon approached northern Luzon. During this<br />
weakening phase, the eye expanded from a diameter of 10 nm (19 km) to 60 nm (1 10 km).<br />
On 25 October, a mid-tropospheric trough moving eastward from china temporarily weakened<br />
the ridge and Ruth turned northwestward. Then the subtropical ridge re-established itself, and on 27<br />
October Ruth tracked west-southwestward into northern Luzon. The typhoon lashed the northern coast<br />
of Luzon with winds in excess of 100 kt (51 rnhwc) before weakening to tropical storm intensity over<br />
land. On 28 October another migrating mid-tropospheric trough, deeper than the previous one, picked<br />
up Tropical Storm Ruth and caused it to recurve south of Taiwan, The tropical cyclone continued to<br />
weaken as it moved northeastward, and <strong>JTWC</strong> issued the final warning on the systemat31000OZ.<br />
Ill. FORECAST PERFORMANCE<br />
The track forecasts were excellent until 2500002, when the forecast scenario changed from<br />
straight-running, west-northwestward to recurvature (Figure 3-25-2). Low track and intensity errors for<br />
the fmt 17 warnings had been a reflection of the climatological analogs.<br />
Starting with the 2312002 dynamic model run, the NOGAPS prognoses began to deviate from<br />
the climatological track guidance by predicting early recurvature and then acceleration (Figure 3-25-3).<br />
Based on NOGAPS’ previous successes, the forecast scenario switched km straight runner to recurver<br />
for the 2500002 through 2612002 warnings. When Ruth continued to move west-northwestward and<br />
the upper air analyses indicated 500 mb heights were rising over Taiwan, it became apparent that the<br />
NOGAPS guidance was erroneous. The result was six 72-hour forecast with errors in excess of 500 nm<br />
(925 km), including two over 900 nm (1665 km) - the largest busts of the year.<br />
IV IMPACT<br />
Super Typhoon Ruth was the most intense tropical cyclone of 1991 to strike Luzon. On<br />
northern Luzon 12 people were killed as Ruth triggered numerous landslides and flooding leaving at<br />
least 76,000 residents homeless. Fortunately, very little rain fell near Mount Pinatubo where it would<br />
have caused mudflows, lahars, and additional devastation. At sea 18 lost their lives when the freighter<br />
lhng Lung sank west of Taiwan. Another 18 crewman were rescued from heavy seas after the freighter<br />
Table 3-25-1. Listing of nine analog tropical cyclones from 1970 to 1990 whichhadthe greatestsimilarityto Ruth’s<br />
trackandintensity,alongwith their24-,48-,and72-hourtrackandintensitychange.<br />
24HOUR 48HOUR 72HOUR<br />
Km PSN~ MQYMWYDMQYMMND Mom w<br />
Ruth 91102118 12.ON 142.OE(50) NW at 7 kt (80) W at 9 kt (135) WNW at 10 kt (140)<br />
Irma 71111106 11.2N 139.4E (60) NW at 15 kt (95) NW at 15 kt (150) NW at 9 kt (120)<br />
Patsy 73100706 13.4N 140.8E (45) WNW at 7 kt (65) WNW at 9 kt (95) WNW at 10 kt (140)<br />
Louise 76103112 11.ON 142.lE (50) W at 12 kt (75) WNW at 14 kt (135) WNW at 13 kt (140)<br />
Kim 77110800 13.2N 147.4E (50) W at 15 kt (95) W at 14 kt (120) W at 10 kt (120)<br />
Tip 791OO9O6 12.7N 145.8E (55) W at 10 kt (85) WNW at 6 kt (140) NW at 7 kt (165)<br />
Betty 80103006 11.7N 149.lE (55) WNW at 20 kt (80) W at 16 kt (95) Watllkt(100)<br />
Marge 83110118 13.6N 141.lE (45) WNW at 8 kt (75) WNWat 8 kt (130) WNWat 7 kt (140)<br />
Dot 85101400 11.6N 142.4E (50) w at 12 kt (75) WNW at 10 kt (140) W at 13 kt (150)
Southern Cross sank northeast of Taiwan.<br />
The large track forecast errors resulted in a short notice for DOD assets on northern Luzon to<br />
prepare for the typhoon and unnecessary typhoon preparations horn Okinawa to Japan,<br />
NOL<br />
m m In us In Mr.<br />
s 1<br />
EMS no M<br />
us -<br />
In lM MB<br />
23<br />
*<br />
29<br />
s<br />
Is<br />
It<br />
a ......................<br />
NS<br />
Figure 3-25-2. (a) Comparison of the first 17 warnings (201800Z to U18(MIZ)to the official ~C best trackax& (b) comparison of the<br />
next nine warnings (250000Z to 270000Z) to the official JIWC kst track.<br />
Figure3-25-3.(a) Comparison of the NOGAPS 25WOOZ700-mb 72-hour forecasL vdld at 280000~<br />
analysis at 280000Z.<br />
to the (b) verifying NOGAPS<br />
127
U)<br />
r-<br />
m<br />
l-i<br />
$ g
SUPER TYPHOON SETH (26W)<br />
I. HIGHLIGHTS<br />
Super Typhoon Seth was the fmt of six tropical cyclones to reach at least typhoon intensity in<br />
the month of November. This was the most active November in the western North Pacific since 1964.<br />
Forecasts for Seth’s generally westward track were complicated by the normally reliable objective<br />
guidance suggesting recurvature which did not occur.<br />
II. TIUICK AND INTENSITY<br />
Seth originated as a weak disturbance in the southern Marshall Islands, and was mentioned on<br />
the 2806002 October Significant Tropical <strong>Weather</strong> Advisory. Synoptic and satellite data for the next<br />
several days indicated slow development. A Tropical Cyclone Formation Alert was issued at 311730Z<br />
October based on a signii3cant increase in the amount and organization of convection over the preceding<br />
12 hours. More convection and the detection of a circulation defined by low-level cloud lines on visual<br />
satellite imagery prompted the f~st warning at O1OOOOZNovember.<br />
The tropical cyclone continued tracking west-northwestward and intensified rapidly. With a<br />
faster than normal rate of intensification supported by dual outflow channels aloft, the system quickly<br />
peaked, reaching a maximum intensity of 130 kt (67 m/see) at 0318002 (Figure 3-26-l). On 4<br />
November Seth started to slow as it approached the axis of the subtropical ridge and the anticipated<br />
point of recurvature. However, the ridge strengthened as the super typhoon weakened, and Seth became<br />
almost stationary for 24 hours &fore resuming a slow, west-southwestward track on 6 November.<br />
For the next 5 days, Seth continued west-southwestward and briefly reintensified. During this<br />
period Seth and Tropical Storm Verne (28W), located to the east, closed to within 800 nm (1480 km) of<br />
each other. While the influence was nominal due to the large separation distance, Verne weakened the<br />
ridge to the north and contributed to the slowing of Seth. On 12 November Seth gradually turned<br />
northwestward as it approached northern Luzon. This turn appeared to be in response to a weakness in<br />
the ridge west of Taiwan. However, once again the ridge strengthened, and the tropical cyclone turned<br />
southwestward along the edge of a low-level surge from the northeast. Due to shear and land affects,<br />
Seth continued to weaken as it moved into the South China Sea and dissipated. The final warning was<br />
issued at 141800Z.<br />
III. FORECAST PERFORMANCE<br />
Seth’s track was &lcult to forecast because of the narrow subtropical ridge and the objective<br />
guidance which kept suggesting recurvature. As the track neared 140”E longitude, the Colorado State<br />
University Model (CSUM) proved to be the best performer, aided by its tendency to be slow in<br />
recurvature situations. Once Seth moved westward from the bifurcation point near 140°E, <strong>JTWC</strong>’S<br />
forecast performance improved significantly (Figure 3-26-2).<br />
IV IMPACT<br />
As Seth brushed by Saipan in the Northern Mariana Islands on 3 November no fatalities were<br />
reported, but signiilcant property and crop darnage occurred. Estimates of damage to public facilities<br />
alone were as high as US$2 million. Families were evacuated from low lying areas, and 9.5 inches (240<br />
mm) of rain caused widespread flooding. Later, when Seth tracked through the Luzon Strait, no reports<br />
of property damage or injury were received.<br />
129
130
E 125 130 135 140 145 150E<br />
N30<br />
25<br />
20<br />
..........................................T ....<br />
E 100 105 110 115 120 125 130 135 140 145 150 155 160E<br />
N 40<br />
35<br />
30<br />
25<br />
TROPICAL STORM THELMA<br />
BEST TRACK TC-27W<br />
27 OCT- 08 NOV 91<br />
MAX SFCWIND 45KT<br />
MINIMUM SLP 991MB<br />
..,.<br />
----<br />
LEGEND<br />
6-HOURBESTTRACK POSIT<br />
SPEEDOF MOVEMENT<br />
INTENSITY<br />
POSITIONAT XKJOOMM<br />
TROPICALDISTURBANCE<br />
TROPICALDEPRESSION<br />
mOPICALSTORM<br />
TYPHOON<br />
SUPERTYPHOONSTART<br />
SUPERTYPHooNEND<br />
EXTRATROPICAL<br />
SUBTROPICAL<br />
DISSIPATINGSTAGE<br />
FIRSTWARNINGISSUED<br />
LASTWARNINGISSUED<br />
,,..,, . ,,,,..,,,.,<br />
w<br />
N 20<br />
15<br />
10<br />
5<br />
EQ<br />
.<br />
:... .,. . .: .,,,:’<br />
135 35<br />
~+j 30 3N0 y 35 3<br />
14 l’j j ,13 y q 1<br />
12 “ “~”” ““”“““’”””” ““*””” ““””I ......<br />
.:<br />
..,, ...<br />
,.,<br />
,: .<br />
..: ‘::<br />
.\p\’\l ::. .. ..”. k . ●<br />
‘@* ‘-<br />
.................... ‘“” ............ ......................... .......<br />
m<br />
.!.<br />
~~’ u<br />
,.,.<br />
.’.’<br />
;...<br />
~,<br />
.,.<br />
““3<br />
.<br />
“...,<br />
,.:..,,<br />
;;: ........V...[353 ,<br />
. ... ... ..- .....<br />
““3&$o’”3mywjo-30 f’.’.”’..”.”””’””. ”””..”<br />
..::4035: s 54 4 7 * ~ o sib<br />
,45 716<br />
:8a<br />
~i...:........... .... .. ....... ... .. ,,...,,,:..,,,.........................<br />
: .,..<br />
‘;, ;:.. ‘::.. : .:. .. : ~ F - Ol@2Z<br />
‘~l@&: ““#,:”,:..,,,<br />
,,..<br />
;’ .,., . ,.:..:.,‘...<br />
43[ ~ “:);
TYPHOON THELMA (27W)<br />
I. HIGHLIGHTS<br />
The worst loss of life due to a natural disaster in the western North Pacific during 1991<br />
occurred when Tropical Storm Thelma made landfall in the Vkayan Islands of the Philippines. News<br />
accounts estimated that 6000 people died and 20,000 people were left homeless by catastrophic events<br />
resulting from the passage of the tropical storm including the failure of a dam, landslides and<br />
extensive flash flooding. The highest casualties occurred at Ormoc on Leyte Island whe~ widespread<br />
logging in recent years had stripped the hills above the port city bare of vegetation.<br />
II. TRACK AND INTENSITY<br />
Thelma began as a tropical disturbance in the eastern Caroline Islands, and was first<br />
mentioned on the 2706002 October Signiilcant Tropical <strong>Weather</strong> Advisory. After persisting for 4<br />
days, its convection rapidly increased, the system center reorganized, and <strong>JTWC</strong> forecasters issued a<br />
Tropical Cyclone Formation Alert at311900Z. A satellite-derivtxi intensity estimate of 25 kt (13<br />
rnkc) prompted issuance of the fiit warning at 011200Z November. A week after being first<br />
detected, Thelma developed into a tropical stormat0312002, and headed west-southwestward for the<br />
Philippine island of Samar. Torrential rains dumped an estimated 6 inches (150 mm) of water in 24<br />
hours on the central Philippines before Thelma moved into the South China Sea. The cloud system<br />
was unable to reintensify over water due to vertical wind shear (ligure 3-27-1). The final warning<br />
was issued at 0812002 as Thelma made landfall over Vietnam’s Mekong River Delta.<br />
III. FORECAST PERFORMANCE<br />
Initial track forecasts erroneously predicted recurvature into the westerlies north of the axis<br />
of the subtropical ridge (Figure 3-27-2). Objective forecast guidance available at the time when it was<br />
most needed to support the warning was split between recurvature and non-rearvature forecasts. In<br />
retrospect, the beta advection models showed limited skill in an early prognosis of the westsouthwestward<br />
motion that occurred from 2 through 6 November.<br />
VI. IMPACT<br />
Thelma was the major catastrophe for the Philippine Islands for 1991 in terms of lost lives,<br />
surpassing the Mount Pinatubo eruption. Approximately 6000 people died and 20,000 were left<br />
homeless.<br />
133
134
N&<br />
110 115 120 125 no 135 140 E<br />
25<br />
./<br />
.....<br />
Q . ...+..... .<br />
v’<br />
24<br />
........... . .. \....<br />
.............................<br />
15<br />
%.<br />
v<br />
0:<br />
..... ...... .. ....... .. .<br />
T<br />
,.... .,-..+,-....,,.<br />
\<br />
0<br />
10<br />
w<br />
d ;“” ““””””””””” ““””<br />
N5<br />
F@re 3-27-2. Comparisonof the <strong>JTWC</strong>official forecasts to the f~<br />
$0<br />
best track.<br />
D
E 130<br />
N 35<br />
30<br />
25<br />
135 140 145 150 155 160 165 170 175 180<br />
...,::,’ ,.:,,, :: ,,, .<br />
....,,.:’. “.. ..”.,: ,,..: .,. ,. i<br />
,.,,., ,,.<br />
: “.,.<br />
,.,. ..’“’.:” \<br />
.,:. ,,..<br />
:<br />
TROPICAL STORM VERNE<br />
.“: . 35 ~<br />
.,<br />
BEST TRACK TC-28W<br />
.,.,:<br />
,:.: ,,.<br />
~L - 12/12Z~ ++< [<br />
4:<br />
03 NOV- 13 NOV 91<br />
$+~ \ MAX SFC WIND 55KT<br />
..{..! ..t \ 40 . ..............!..... ..2& . +t: ..13..j ., MINIMUM SLP 984MB<br />
-“’”-;#!! ,<br />
4i l(\~,,<br />
~!<br />
~~~<br />
1* LEGEND<br />
45 !<br />
,22 / ●!<br />
.++ : : U 6-HRBESTTRACK~“SITION<br />
~> SPEEDOFMOVEMENT (KT)<br />
18<br />
1 : INTENSITY(K’r)<br />
\\ 1<br />
}<br />
~ 50<br />
~<br />
POSITIONAT XX/(XKOZ<br />
““””’’’’’’’’’’’”’”””’””””’.””..’ .......1.2.... -:.-.-+ .+........1.2...............................................................................................,..,,,:.,,)!,,!.<br />
~<br />
& mOPICALDISTURBANCE<br />
aww TROPICALDEPRESSION<br />
;+,<br />
---- TROPICALSTORM<br />
i<br />
20<br />
15<br />
10<br />
N5<br />
l’o+ll~ ~ ~ ~ ~ & p&y&g:=T<br />
SUBTROPICAL<br />
*** Dissipating STAGE<br />
.................................. ~ 5.0..............1~...- .....lk......lu ...............~!...! .......!..............).~ .....d..........4.4 .........\............................~........ FIRSTWARNINGISSUED<br />
~ IASTWARNINGISSUBD<br />
~ ,.++ ,~ ; ~ ~<br />
;s<br />
)<br />
10 ~ “+<br />
55~ 11 [:” ●*I 8 . 30\ 1<br />
$5 ..
TROPICAL STORM VERNE (28W)<br />
Figure 3-28-1 The partially exposed low-level center of Tropical Storm Verne, located 600nm(1110<br />
km) east of Guam (0622252 November DMSP visual imagery).<br />
Westerly gradient-level winds along the equator and a persistent cloud system near the<br />
international date line on 3 November indicated the potential for further development of a tropical<br />
disturbance. Two days after the initial comment about this disturbance on the 0306002 Significant<br />
Tropical <strong>Weather</strong> Advisory, a steady drop of surface pressures in the Marshall Islands convinced<br />
forecasters to issue a Tropical Cyclone Formation Alert at 0503302. Improved convective organization<br />
prompted the fmt warning on Tropical Depression28Wat0518002. As the depression tracked westnorthwestward,<br />
persistent upper-level shear on the east side of the convective cloud mass prevented<br />
significant intens~lcation. The shear resulted from a massive upper-level anticyclone located 300 nm<br />
(555 km) to the north-northeast of the tropical cyclone. Verne was upgraded to a tropical storm at<br />
0712002, based on a satellite intensity estimate of 35 kt (18 m/see). Tropical Storm Verne passed<br />
between Pagan and Agrihan Islands in the Northern Marianas with a maximum intensity of 55 kt (28<br />
m/sec), and closed to within 800 nm (1480 km) of Super Typhoon Seth (26W) on 10 November before<br />
recurving northeastward on 11 November. The final warning was issued at 1212002 when satellite<br />
imagery indicated Verne had transitioned into an extratropical low.<br />
137
,........................-.... s!...... ~+ .....................<br />
~, ;Lk<br />
< a<br />
~;u<br />
-....-.-..---.w ..[...,.,:<br />
~“<br />
. ... ..-...< . . ..>..>..>..><br />
,:~.<br />
.F;.r< . . . . . . . . .<br />
,:./.....<br />
..,.,:.:...,<br />
// $<br />
AL<br />
. ..s*<br />
D<br />
l-l<br />
:,..:, :,‘-‘.<br />
.. ,,. ,,....<br />
... ... .......<br />
...... .:..,<br />
.:.:..:<br />
“.:<br />
.<br />
. :<br />
,. .:<br />
.<br />
.:<br />
............................... .,.,<br />
,..,.:<br />
. ,,<br />
,-‘.<br />
........... ., ,,,<br />
.. ,.:.’...<br />
.~<br />
- ..........y .............x J. . . . . . . . . . . . . . ..+ . . . . . . . . . . . . . . . . . . . . . . . . . . . . . . . . . .<br />
‘-2””. := +, $<br />
. .<br />
-’ ‘FJ<br />
● :<br />
...<br />
““m ,..,: ,<br />
*:<br />
:1<br />
*:<br />
““:. o j z<br />
:,,cm /<br />
*: ~<br />
‘..:....,,<br />
TROPICAL STORM WILDA (29W)<br />
Figure 3-29-1 Tropical Storm Wilda interacts with the northeast monsoon in the South China Sea<br />
(1812002 November DMSP moonlight visual imagery).<br />
Tropical Storm Wllda was a midget tropical cyclone, and posed a serious threat to the same<br />
central Philippine Islands which were devastated by torrential rains from Tropical Storm Thelma (27W)<br />
two weeks earlier. Wilda was initially mentioned on the 1306002 November Significant Tropical<br />
<strong>Weather</strong> Advisory as a small area of persistent deep convection. At 1404002, <strong>JTWC</strong> issued a Tropical<br />
Cyclone Formation Alert when the system showed a steady increase in convective organization. The<br />
frost warning followed at 1418002, based on a Dvorak intensity estimate of 30 kt (15m/s). Wllda<br />
continued to intensify as it approached the central Philippines, reaching a peak intensity of 45 kt (23<br />
m./sec) north of Sarnar. Wilds maintained its peak intensity as it tracked across southern Luzon, passing<br />
about 40 nm (75 km) south of Manila at 1704002. Due to its compact wind field, damage was minimal<br />
near Manila. After turning northwestward on 17 November, Wilds began to weaken. The cloud system<br />
lost most of its deep convection on 19 November, and the residual low-level circulation drifted<br />
southwestward with the prevailing northeast monsoon. The final warning was issued at 200000Z when<br />
satellite imagery indicated the system had dissipated.<br />
139
E 125 130 135 140 145 150 155 160 165 170 175 180<br />
N40<br />
35<br />
30<br />
25<br />
20<br />
15<br />
10<br />
5<br />
EQ<br />
,...:<br />
; .:.,:,:,<br />
::,,<br />
.<br />
.<br />
m<br />
Y2’\~<br />
\<br />
; ‘-<br />
i<br />
..........+.<br />
~ I<br />
!1Y<br />
c<br />
: ~<br />
: ~<br />
.............................j ----<br />
; —<br />
6-HR BESTTRACKPOSITION<br />
SPEEDOFMOVEMENT (KTi<br />
WTY ——— (KTI ,.—., ‘ ‘<br />
ruMfION AT XXMOWZ<br />
TROPICALDISTURBANCE<br />
TROPICALDEPRESSION<br />
‘IROPICALS’ITXM<br />
TYPHOON<br />
,:,,,.: 95 !\<br />
SUPERTYPHOON START<br />
lM<br />
/<br />
i t SUPmTVPHC)f)NRNll<br />
305 \: 92\ \ .. .-.—.-y........-.”,-- .&.-. —..<br />
I<br />
:;;-;&;;f-&&---AGE<br />
-—... —-...~.—.—.— ...+-.. _ ...._. ._ ....- ...j<br />
‘.’–”+–’-\–--x%’””-++:<br />
--~;<br />
FIlU3TWAIUTINGISSUED<br />
: LASTWARNINGISSUED<br />
, ,,<br />
.. . ... . ----- ....+..- ..-. .—.-.. ~\ : —-<br />
‘ 130 :<br />
\..<br />
~ 135--$---- :<br />
..................................................+.. ............. .. ......... y ,,,.....<br />
““’’’*’’’’”kig6;;5_<br />
..s%7”” *o .....5a............<br />
-. A ...- .-.<br />
,.,.,<br />
; “.<br />
.~..!<br />
......................<br />
:.“‘<br />
::<br />
. ,.:<br />
‘:..<br />
,,.,,.<br />
,:,:<br />
.:<br />
,........~c.. ,,.,<br />
:,,<br />
..@j.......f.....~<br />
~5. ,,,,,,.<br />
IAC //, 16 A<br />
,,/,.. ... :; i ‘&J ~’o ~is &<br />
: :.,.. !<br />
,.,,..:,,. :..:::<br />
....... :<br />
I ! i-<br />
,8 17 ~A<br />
,<br />
F - ~3/OOZ \<br />
................<br />
........................
SUPER TYPHOON<br />
YUR1 (30W)<br />
I. HIGHLIGHTS<br />
Super Typhoon Yuri was the most intense tropical cyclone of the year, with maximum sustained<br />
winds estimated at 150 kt (77 m/see) and an estimated minimum sea-level pressure of 885 mb. It also<br />
was the closest approach to Guam of a cyclone of this intensity since Super T~hoon Karen (1962).<br />
Yuri’s normal (verses rapid) rate of intensification to a super typhoon was unusual. High water and<br />
massive waves caused extensive damage to coastal areas in the southeastern part of Guam.<br />
II. TRACK AND INTENSITY<br />
Low-level westerly winds along the equator extended eastward to the international date line in<br />
mid-November. On 16 November, a marked increase in deep convection occurred near 5*N between<br />
160”E and 175*E, and the area was fmt mentioned on the Significant Tropical <strong>Weather</strong> Advisory at<br />
1706002. This tropical disturbance moved slowly westward at about 6*N until it executed a slow<br />
counterclockwise loop east of Kosrae in the eastern Caroline Islands between 19 and 23 November.<br />
During these five days, convective organization fluctuated about a slow trend toward improved<br />
organization. <strong>JTWC</strong> issued a Tropical Cyclone Formation Alert at 220900Z. The fwst warning on<br />
Tropical Depression 30W was issued at 2300002, based on a further improvement in convective<br />
organization. Twelve hours later, the tropical cyclone was upgraded to a tropical storm when the<br />
satellite signature from the Dvorak Technique indicated maximum winds were 35 kt (18 m/see). Yuri<br />
continued to intensify as it accelerated west-northwestward, and reached typhoon intensity 180 nm (335<br />
km) east of Pohnpei at 241800Z. At this time Yuri was about 300 nm (555 km) in diameter, the size of<br />
an “average” typhoon. Pohnpei, (WMO 91348) reported a minimum sea-level presstm of 989 mb and a<br />
peak wind gust of 64 kt (33 rn/see) when the eye of the typhoon passed 45 nm (85 km) to the north at<br />
2505402.<br />
On 26 November, as Yini approached the western periphery of the subtropical ridge axis, it<br />
turned slightly toward the northwest and became a super typhoon at 261500Z. The rate of<br />
intensification during the 72-hour period horn 2406002 to 2706002 was unusual. Unlike most super<br />
typhoons which experience an 18- to 30-hour period of rapid or explosive deepening, Yuri’s intensity<br />
developed steadily at a rate of about 35 kt (18 m/see) per day. Based on the satellite analyst’s current<br />
intensity estimate, it reached a peak intensity of 150 kt (77 rn/see) at 2706002. Yuri grew rapidly in<br />
size, reaching 600 nm (1110 km) in diameter, as it approached Guam.<br />
Super Typhoon Yuri posed an extremely serious threat to Guam. Because of its close<br />
proximity to the island and a forward motion in excess of 15 kt (28 km/hr), a small change in direction<br />
could have rapidly changed the projected closest point of approach to the island resulting in a direct hit<br />
with short notice. Fortunately for the people of Guam, the center of the cyclone passed 55 nm (100 km)<br />
south of the southern tip of the island. Maximum sustained winds reported on Guam were 80 kt (42<br />
trdsec)with gusts to 100 kt (51 m/see) in Apra Harbor. The maximum sustained (over water) winds<br />
near southern Guam were estimated to be 100 kt (51 rn/see), gusting to 125 kt (64 rn/see).<br />
After passing the Mariana Islands, the super typhoon (Figure 3-30-1) turned northward, and<br />
began to slowly weaken as it rounded the western portion of the subtropical ridge. By this time Yuri’s<br />
size had grown to a massive diameter of 900 nm (1665 km). After its point of recurvature at 290600Z,<br />
Yti was downgraded to a typhoon. North of 20”N latitude, the typhoon accelerated northeastward and<br />
gradually transitioned into an intense, late fall extratropica.1low pressure system. <strong>JTWC</strong>’S final warning<br />
141
was issued on 1 December at 1800Z when satellite imagery revealed a significant decrease in<br />
convection near the cyclone’s center.<br />
HI. FORECAST PERFORMANCE<br />
The sequence of <strong>JTWC</strong> track forecasts correctly predicted Super T~hoon Yti would pass<br />
south of Guam and follow a typical late season recuxvature track by turning northward between 135°E<br />
and 140°E (Figure 3-30-2). Early warnings on the tropical cyclone had difficulty predicting<br />
Figure 3-30-1. A spectacular telephoto image from the NASA Space Shuttle Atlantis’ mission STS44 of Super Typhoon Yuri at 145 kt<br />
(75 m/see). Note the cyclonically curved WTWXWIIUIUS clouds in the high horizontal speed shear xone near the edge of the eye wall<br />
(280NMZ November photographcourtesy of NASA Lyndon B. Johnson Space Center,HoustcnLTexas).<br />
142
translational motion, since the typhoon accelerated from 5 kt (9 km/hr) on the 23 November to 18 kt (33<br />
kdhr) on 25 November. Although the system continued to accelerate west-northwestward near<br />
Pohnpei, <strong>JTWC</strong> forecast guidance and the warnings based on i~ indicated the typhoon would slow as it<br />
neared the Marianas. Consequently, early in the week, residents on Guam expected Yti would make its<br />
closest approach on Thanksgiving Day (28 November). Once the forward motion was established,<br />
<strong>JTWC</strong> track forecasts proved to be very accurate as the super typhoon approached Guam. Although<br />
<strong>JTWC</strong> predicted that Yuri would be near super typhoon intensity as it neared Guam, intensity forecasts<br />
were a problem. Super typhoon intensity was not expected to occur since the rapid or explosive<br />
deepening episode normally associated with super typhoons had not been observed. <strong>JTWC</strong> also had<br />
considerable problems predicting the growth in size of Yuri, as it expanded in size from 300 nm (555<br />
km) to over 900 nm (1665 km) in a little over three days.<br />
Ten hours before Yuri reached its closest point of approach to Guam, NOCC/<strong>JTWC</strong><br />
recommended that Guam Civil Defense evacuate the southeast coast since inundation exceeding 20 feet<br />
(8 m) was expected.<br />
While the forecast performance was only slightly better than average, the warning service<br />
provided by NOCC/<strong>JTWC</strong> was excellent. Yhri’s potential to inch closer to Guam, its depiction as an<br />
“extremely dangerous sto~” and its ability to produce very high waves were passed to residents in<br />
hourly updates to the medi~ convincing people in vulnerable areas to evacuate. This action and the<br />
populations appropriate response prevented the loss of lives.<br />
E 120 125 130 135 140 145 150 155 160 165 170 175 180<br />
N 45<br />
>;:.:<br />
‘/-<br />
40 .<br />
$ ...,..... .<br />
..,.:,..,. ~“””””””” ;<br />
35<br />
.......................~.. ..x. ..............t.................~.............-<br />
.! ..’ ...1< 30<br />
.4;’:!<br />
25<br />
20<br />
‘~ \ :- . ...<br />
‘/Y ‘ i<br />
71<br />
......... ..........<br />
.<br />
. ........ .. . ...................<br />
15<br />
10<br />
5<br />
EQ<br />
...>..... 1%---:-~:-<br />
! i ~ -<br />
W: ’!i’<br />
s<br />
dti; ~ i i : : :<br />
. ................<br />
. . ....!<br />
L . .<br />
Figure 3-30-2. Summsry of JI’WCforecssts (solid line)s U@IIIPOSedon Y~’s fm~ ~st Ewk (*M l~e).<br />
143
IV. IMPACT<br />
An estimated total of $33 million in damage was attributed to Super Typhoon Yuri on Guam,<br />
primarily the result of flooding along the southeastern coast. By making its closest point of approach at<br />
high tide, the combined effects of a large translational speed, massive size, super typhoon intensity and<br />
the cyclone’s center location south of Guam exposed the island to a prolonged period of northeasterly<br />
winds. This created ideal conditions for extreme surf on the eastern side of the island. Waves in excess<br />
of 30 ft (12 m) battered the southeastern coastline. Estimates of high water levels and wave run up at<br />
high energy areas with little or no protecting reef flats are shown in Figure 3-30-3. Some of these areas<br />
experienced inundation two to three times greater than with T~hoon Russ (1990), 11 months earlier.<br />
N<br />
t<br />
_ESTfMAIED HEIGHT (IN FEET)<br />
OF WATER ABOVE MEAN HIGH TIDE<br />
.- ESIINAIED WAVE RUN UP<br />
(IN FEEl) IN HIGH ENERGY AREAS<br />
40<br />
H<br />
Figure 3-30-3. Estimated water heights above mean high tide and wave ~ Up in the high energy areasofsoutheasternGuam. Estimated<br />
values (infeet)arebased on observationstaken immediately aftertropicalcyclone passage.<br />
144
Yuri’s disastrous combination of high water effects caused much greater inundation, reef damage and<br />
beach erosion to the island’s low-lying beaches and bays along the southeast coastline. Sixty-two<br />
homes were totally destroyed; another 207 had major damage; and 348 sustained minor damage.<br />
Damage estimates included $19.1 million to public facilities and infrastructure, $10.8 million to<br />
commercial buildings and equipment, $2.5 million to residential structures, and $500,000 to agriculture<br />
(Figure 3-30-4). Guam residents were without power and water during the Thanksgiving holiday<br />
weekend.<br />
Yuri caused an estimated $3 million in darnage on Pohnpei, including the loss of the island’s<br />
only AM radio station tower. Officials on Rota placed damage estimates at $2 million. There was no<br />
loss of life in the Marianas or Pohnpei as a result of the cyclone.<br />
Figure 3-30-4. Yuri’s high winds uprooted this large tree ad parkedit on a car. The more tlexible, smaller coconut palms m<br />
the backgroundsurvived (Photographcouxtesyof Mrs. PatxiciaL. Hudson).<br />
145
E 145<br />
N 35<br />
E<br />
30<br />
25<br />
20<br />
15<br />
10<br />
,:<br />
150 155 160 165 170 175 180 175 170w’<br />
..... .. ..<br />
L =04/18Z 3<br />
‘~<br />
.. \ . . ...6..... ~ .0 . ..............<br />
,..: 6!<br />
5+<br />
61<br />
~7Q 13 ‘ ~<<br />
\l<br />
c;<br />
30<br />
‘KIN\ I\:. ........ +“i\= .......... ............ .,..fi ........j.35.........!.! ...........<br />
8<br />
ill 40\<br />
\\\~ 13 A< i<br />
4--- 80 ;16/<br />
----<br />
L<br />
~llgz . ...<br />
LEGEND<br />
6-HOURBESTTRACKPOSIT<br />
SPEBDOFMOVEMENT<br />
INIT’NsITY<br />
POSITIONAT XX/OOOOZ<br />
TROPICALDISTURBANCE<br />
FIRSTWARNINGISSUED<br />
LASTWARNINGISSUED<br />
............................<br />
5<br />
2 7<br />
.bqo~ .....<br />
TCFA<br />
.......25C............<br />
6’<br />
{0<br />
,BPW<br />
EQ
TYPHOON<br />
ZELDA (31W)<br />
I. HIGHLIGHTS<br />
Typhoon Zelda was the last tropical cyclone of the year, and may have set a record by being the<br />
fifth midget of the year to occur in the western North Pacit3c. Intensification during the early stages of<br />
its development proved difilcult to handle because of its very small size. The operations of the missile<br />
test range located at Kwajalein and nearby islands and atolls were seriously affected.<br />
II. TRACK AND INTENSITY<br />
Westerly winds along the equator associated with the onset phase of the El Niiio phenomenon<br />
helped to generate a weak cyclonic circulation near the international date line in late November. At<br />
250600Z, persistent conve@ion near the weak circulation center that was to become Zelda led to its<br />
inclusion on the Significant Tropical <strong>Weather</strong> Advisory. Strong vertical wind shear initially hampered<br />
intensification, but improved upper-level outflow at 262100Z indicated the disturbance had good<br />
potential for development, prompting a Tropical Cyclone Formation Alert. At 271800Z, the first<br />
warning was issued. Over the next 36 hours, Tropical Depression 31W moved west-northwestward and<br />
rapidly intensifkd to minimal typhoon intensity as it moved through the Marshall Islands. Kwajalein<br />
(WMO 91366) reported winds gusting to 71 kt (37 m/see) as the eye of the midget passed 25 nm (45<br />
km) south of the atoll at 290300Z. Zelda was upgraded to a typhoon at 29 1200Z based on reports from<br />
the Automatic Meteorological Observing Station (AMOS) at Ujae (WMO 91365) which measured<br />
sustained surface winds of 65 kt (33 m/see) (Figure 3-31-1). Zelda continued to track westnorthwestward,<br />
reaching a peak intensity of 80 kt (41 mkc) at 301200Z approximately 160 nm (295<br />
km) west of Enewetak. Shortly thereafter, a deep trough induced by Super T~hoon Yuri (30W), which<br />
CDITI@ MTA IUCLW9 WDBCT1- SERIES PLOT Wol —<br />
91365 WDIRI ~<br />
V$POI ~<br />
1o15-<br />
101*<br />
Figure 3-31-1 Time series of wind<br />
and pressure observations taken by<br />
the Automated Meteorological<br />
Observing Station (AMOS ) on<br />
Ujae Atoll from 2500002 to<br />
3023002 November. Maximum<br />
surface winds recorded at 2912002<br />
were 65 kt (33 m/see), and the<br />
minimum pressure dropped to 989<br />
mb (Data counesy of the National<br />
Data Buoy Center).<br />
f+ws;<br />
1 I 8 I<br />
0-<br />
1 I I 1 I I I 1 I I 1 I I I I 1 1 I 1<br />
o*12t806t21a06t210 OS IZ1EO6I21OO6121O<br />
lt/J6 it/23 n/26 11/2s tw27 1V27 yf81/ze 1V29 llm twm 1V30 *<br />
147
was about 1000 nm (1850 km) to the northwest, weakened the subtropical ridge, and Zelda turned<br />
northward near 157°E (Figure 3-31-2). After recurving, it trailed along a frontal boundary generated by<br />
the extratropical remnants of Yuri. As Zelda raced eastward, upper-level winds increased and it’s<br />
central convection sheared away. The remaining low-level circulation detached from the frontal cloud<br />
line and drifted slowly north-northwestward. The final warning on Z&la and the final warning of 1991<br />
was issued on 4 December at 1800Z.<br />
III. FORECAST PERFORMANCE<br />
<strong>JTWC</strong>’S experience with Typhoon Zelda emphasized the difficulties associated with<br />
performing infrared satellite analyses of midget tropical cyclones. It underscored the need to use visual<br />
and infi-ared image pairs when available. Due to its smaU size and seemingly poorly organized outflow<br />
pattern, Zelda did not have an impressive infrared satellite signature. Based on a Dvorak intensity<br />
estimate of 25 kt (13 m/see) at 282330Z, the 290000Z warning indicated Zelda was still a tropical<br />
depmsion. But, when radar and synoptic reports from Kwajalein indicated otherwise, the warning was<br />
amended to upgrade Zelda to tropical storm intensity. In post-analysis, it is estimated that Zelda<br />
actually became a tropical storm at 280000Z, 24 hours earlier and was approaching severe tropical<br />
storm intensity as it passed Kwajalein’s missile test range, which was caught unprepared by the stronger<br />
than forecast winds. Later, Zelda’s sharp recurvature track was not anticipated by the <strong>JTWC</strong> (Figure 3-<br />
31-3), and average track forecast errors at 72 hours after 290000Z were 500 nm (925 km).<br />
Figure 3-31-2. Typhoon Z&la near its point of recurvature(O1O9O3ZDecember NOAA infraredimagery).<br />
148
IV IMPACT<br />
As the Mariana Islands were recovering from giant-sized Super TWhoon Yuri (30W), it was<br />
tiny Z&la that left more people homeless and injured. An estimated 5,000 people lost their plyboard<br />
and sheet-iron-roofed homes on Ebeye atoll, and 27 people were injured. On 9 December, President<br />
Bush signed a major disaster deckuaion, making Ebeye Island and the atolls of Kwajalein, Lae, and<br />
Ujae eIigible for federal disaster assistance.<br />
E 140 145 150 155<br />
N 35<br />
160 165 170 175 180<br />
30<br />
.<br />
25<br />
...... .........................................<br />
20<br />
15<br />
.........................; i . ........... .....<br />
.<br />
!O<br />
:. .<br />
;.-<br />
. .. .......*.. .<br />
+<br />
L<br />
10<br />
..... ... ... ... ....... ... .... ... ... ....... ... .............................. ... ... ... .. ... ... ... ... ......<br />
N5<br />
Figure 3-31-3. Comparisonof the <strong>JTWC</strong>ofllcial forecasts to the final best track.<br />
149
NORTH INDIANOCEAN<br />
33<br />
withtwo or more tropical cyclones.<br />
TROPICAL CYCLONES Tropical Cyclone OIA was a rare<br />
January cyclone, the f~st ever recorded in the<br />
Spring and fall in the North Indian Arabian Sea basin. Tropical Cyclone 02B was<br />
Ocean are periods of transition between major the deadliest and most destructive natural<br />
climatic controls and the most favorable seasons disaster of 1991. A month later, Tropical<br />
for tropical cyclone activity (Tables 3-5 and 3- Cyclone 03B caused further damage to the<br />
6). As in 1991, a total of 4 tropical cyclones coastline of Bangladesh. In the fall transition<br />
occurred in the North Indian Ocean, which was season, Tropical Cyclone 04B crossed the<br />
close to the long-term average of 4 to 5 per year. southern tip of India.<br />
The <strong>JTWC</strong> was in warning status a total of 17<br />
days, and there were no calendar warning days<br />
TABLE 3-5. 1991 SIQJIFICMT mmIcaL CruLm8s<br />
Nc$uKIwDIMaxMl<br />
NUt@ER OF MAXIMJM<br />
TROPICAL WARNINGS SURFACE ESTIMATED<br />
cx162m~z%iuEL MLP {MB)<br />
TC OIA 17 JAN - 20 JAN 13 35 (18) 997<br />
TC 02B 24 APR - 30 APR 25 140 (72) 898<br />
TC 03B 31 MAY - 02 JUN 10 50 (26) 987<br />
TC 04B 14 NOV - 16 NOV 8 40 (21) 994<br />
TOTAL: 56<br />
P !<br />
TABLE 3-6.<br />
wmmmmw~<br />
ZR@ICAL ~ DIS~@l<br />
JMmaklaauamxdmdm Au.GsEE Kllu2YRacmmL<br />
1971* ----- 0000110 2<br />
1972* OOO1O 0002010 4<br />
1973*00000 0000121 4<br />
1974 * o 0 D o 0 0 0 0 0 0 1 0 1<br />
1975 1000200 00120 6<br />
1976 0001010 01101 5<br />
1977 0000110 00120 5<br />
1978 00001000 0120 4<br />
1979 0000110 02120 7<br />
1980 0000000 00011 2<br />
1981 0000000 00111 3<br />
1982 0000110 00210 5<br />
1983 0000000 10110 3<br />
1984 0000100 00120 4<br />
1985 0000200 00211 6<br />
1986100000 000020 3<br />
1987 0100020 00122 8<br />
1988 0000010 00121 5<br />
1989000011 000010 3<br />
1990000110 000011 4<br />
1991**1 OO1O 1000010 4<br />
(1975-1991)<br />
AVERAGE: 0.2 0.1 0.0 0.2 0.6 0.5 0.0 0.1 0.2 0.8 1.4 0.5 4.5<br />
TOTAL: 31 O311 901314248 77<br />
● JIYK WARNING RESPONSIBILITYBEGAN ON 4 JUNE 1971 FOR THE BAY OF BENGAL, EAST OF 90° EAST<br />
IK)NGITUDE. AS DIRECTED BY CINCFAC, <strong>JTWC</strong> ISSUED WARNINGS ONLY FOR THOSE TROPICAL CYCIDNES THAT<br />
DEVELOPED OR TRACKED THROUGH THAT PART OF THE BAY OF BENGAL. IN 1975, <strong>JTWC</strong>‘S AREA<br />
oF RESPONSIBILITYm Exfrmwio wssmvifw To INCLUDE Tm WEsm PART w THE BAY oF BENGAL<br />
AND THE ENTIRE ARABIAN SEA.<br />
*Cfl<br />
1.JU
E 50 55 60 65 70 75 80 85 90 95 100E<br />
N 35<br />
NORTH INDIANOCEAN<br />
MAXIMUM SUSTAINED SURFACE WIND<br />
‘64KT<br />
(33MNEC)ORGREATER<br />
TROPICAL CYCLONES<br />
•~~9~~~~~@@34 TO 63KT (18T0 32M/SEC)<br />
●<br />
01JAN -31DEC 91<br />
0000000* 33KT (1~/sEc) oR LEW<br />
30<br />
............ . ........... ;<br />
: TC03B<br />
F<br />
u<br />
25<br />
20<br />
.....’’...<br />
::.,,,<br />
. . ,.:.<br />
“...<br />
....,,<br />
...<br />
,:,,<br />
,::,:.,<br />
:..:..,<br />
..,,,,..,’‘~.,<br />
,..’<br />
.....<br />
,,.. ..<br />
..<br />
,.:::.<br />
,,.<br />
..,.,,<br />
:,.,<br />
15<br />
10<br />
TC OIA 14 JAN - 20 JAN<br />
TC 02B 22 APR - 30 APR<br />
TC 03B 29 MAY - 03 JUN<br />
TC 04B 09 NOV - 16 NOV<br />
.....<br />
.<br />
TC 04B<br />
;.. ....’<br />
; ... ,...’”<br />
■ ✍<br />
5<br />
+.=...=.=..=..<br />
................................................~~.o~.~..+..m.<br />
“..<br />
“.. <br />
i .’”<br />
;.., ,. .’<br />
.................w.&=.. ...................<br />
● O ~<br />
. . .<br />
,**<br />
●*<br />
EQ
E60<br />
65 70 75 80 85<br />
N 20<br />
90E<br />
‘:, . : ..-.,..,.<br />
TROPICAL CYCLONE OIA \ ‘, :..<br />
., LEGEND<br />
15<br />
G<br />
u 10<br />
EQ<br />
5<br />
BEST TRACK TC-OIA ; ti 6-HR BESTTlACKPOSITION<br />
.,.<br />
14 JAN-20 JAN 91<br />
SPEEDOFMOVEMENT(KT)<br />
i : INTENslTY(K’r)<br />
MAX SFC WIND 35KT :<br />
POSITIONAT XX/OIXK)Z<br />
MINIMUM SLP 997MB : & TROPICALDISTURBANCE<br />
~ TROPICALDEPRESSION<br />
. ‘--- TROPICALSTORM<br />
‘.. ;<br />
:,,,... .<br />
.’<br />
— TYPHOON<br />
;..’<br />
... . .... .................................. .... ...... .........................................................:....... ...},,,.,!,., ..........................<br />
.:,............<br />
SUPERTYPHOONSTART<br />
..: ~<br />
SUPERTYPHOONEND<br />
::.<br />
\<br />
EXTRATROPICAL<br />
i<br />
:...:<br />
;.:<br />
;..’ $$ ! SUBTROPICAL<br />
“:. ,/ { . *Y DIssWA~G STAGE<br />
:: ;./.<br />
:! :..<br />
..<br />
FIRSTWARNING ISSUED<br />
,:\ :,. L<br />
“:\<br />
LASTWARNING ISSUED<br />
:. :,,<br />
j.. ;.<br />
~,.,,<br />
\ ,, ,.;<br />
i 1 .,, ;;<br />
/ ,. ::<br />
~.;<br />
f;<br />
~. .,<br />
t \ “:.<br />
:;<br />
... . . ., .. . . . ..,-. .. . :. ... .,. ,.. ..-..+. :, .,: ~ .,.,..., ,..,<br />
. >.<br />
,,,, ::<br />
:: ...,.............<br />
,.,-,<br />
........ .,.7 ..,.,., ,.,.. ... ..... .,-<br />
~ .,; ;“,.,<br />
i < ‘.;: ,,:,: ,... ;,,, .,<br />
t .,,<br />
\<br />
:. .<br />
.,.:,,, ; ,.:<br />
,..,.,<br />
30 35 ~35<br />
.,..’<br />
35 35 35 3535 gob ‘: j ,<br />
14 ‘ 12 12<br />
L -20/062\20<br />
F - 17/0~2,, .. .<br />
85556a<br />
.......................*.*.** /*o ● e* ● m ● 0.0 ;* ....... ..... ....... ............ ..... ,.,,,..............OOO.ooti~rudb~.........................
TROPICAL CYCLONE<br />
OIA<br />
E 55 60 65 70 75 80E<br />
N 15<br />
10<br />
5<br />
.......................................................................<br />
EQ<br />
Figure 3-OIA-1. On the same day that hostilities erupted in the Persian Gulf, an area of organized<br />
convection persisted near Sri Lanka. Because this area posed a potential threat to Allied forces<br />
operating in the Arabian Sea, Persian Gulf and the Red Se% and the 141800Z January Significant<br />
Tropical <strong>Weather</strong> Advisory was reissued at 142300Z. A steady increase in convection which indicated<br />
that the disturbance was intensifying, prompted a Tropical Cyclone Formation Alert at 170300Z. The<br />
first warning followed at 170600Z. Tropical Cyclone OIA tracked westward under a narrow subtropical<br />
ridge, and failed to intensify past minimal tropical storm intensity due to strong vetical wind shear.<br />
Strong upper-level winds stripped most of the deep convection away from the center on 18 January,md<br />
the remaining low-level circulation slowly dissipated in the Arabian Sea. The final warning was issued<br />
at 200600Z.<br />
Although Tropical Cyclone OIA was the fmt tropical cyclone to develop during January in the<br />
Arabian Sea through the past 20 years of record, it was not a significant factor in the Persian Gulf buildup.<br />
Because of its low-latitude track and weak intensity, it had little effect on ships steaming to the<br />
Middle East. A summary of <strong>JTWC</strong> forecasts versus the official best track shows the difficulty in<br />
positioning the poorly defined cloud system center, producing the large scatter of initial warning<br />
positions.<br />
153
.,.<br />
. . ..<br />
..,....,<br />
,, ..<br />
,..’<br />
,. ...’<br />
.<br />
z-<br />
“*<br />
*<br />
. .................... .. . ....<br />
0<br />
*2<br />
/<br />
8<br />
8<br />
8<br />
1<br />
N<br />
,..g s .... .<br />
B<br />
.,. .:..<br />
.,,..<br />
,.,...,<br />
. .<br />
....“’“<br />
‘.. ....<br />
.. . .<br />
.,. .... . .. .<br />
,..... ..............................<br />
,...<br />
,,.’<br />
..<br />
. . . .<br />
... .... ... :.<br />
................... ...............<br />
/<br />
83<br />
..................................<br />
,,.,.: .’<br />
,.,.<br />
,,,,<br />
..,.:.<br />
..<br />
.,..:.:<br />
/ a<br />
%2”<br />
.....................................<br />
24<br />
+<br />
....... .......................<br />
......................................<br />
1<br />
I<br />
VI<br />
I<br />
Ki cl<<br />
%<br />
.<br />
*<br />
4 -1<br />
-0<br />
$..., “al<br />
. ........... ......... ....... .... r<br />
•1 “.,CJ<br />
q A: 8<br />
..4-<br />
‘2<br />
.,<br />
.,,<br />
,,, . .................................. ....<br />
..... ...’...<br />
,.. ...<br />
,. ..”<br />
-’”.’”’.. ,.:<br />
‘..<br />
.... ,.,<br />
......... . .. . “’--’-’’’”<br />
.,,...<br />
.%<br />
..,,<br />
..<br />
,, ..-<br />
.<br />
,,.,..,<br />
z<br />
v)<br />
m<br />
v)
TROPICAL CYCLONE 02B<br />
I. HIGHLIGHTS<br />
Tropical Cyclone 02B was the deadliest and most destructive natural disaster of 1991. It<br />
occumed nineteen years after an estimated 300,000 lives were lost in a similar cyclone which struck the<br />
low-lying Ganges River delta region of Bangladesh. On April 29 and 30, 1991; Tropical Cyclone 02B<br />
(TC 02B) devastated the coastal city of Chittagong (located 115 nm (210 km) southeast of the capital<br />
city of Dacca) and the surrounding area with winds in excess of 130 kt (65 m/see) and a 20-foot (6 m)<br />
storm surge. The official death toll was estimated at 138,000, and the damage at US$ 1.5 billion. The<br />
death toll might have been higher than that in 1970, but according to newspaper nqmts an estimated 2<br />
to 3 million people were evacuated from the coastal region prior to the onset of destructive winds and<br />
massive storm surge. A survey of survivors by researchers from the Centers for Disease Control based<br />
in Atlanta, Georgia<br />
indicated the major reason that many people did not heed the warnings was that they<br />
did not believe the cyclone would be as severe as forecast.<br />
II. TRACK AND INTENSITY<br />
On 22 April, westerly winds and persistent cloudiness in the equatorial regions of the North<br />
lndian Ocean spawned a large cyclonic circulation which became evident in the synoptic data and<br />
satellite imagery over the southern Bay of Bengal. By 24 April, the cloud mass associated with the<br />
circulation encompassed nearly the entire Bay of Bengal. Ships reported that surface winds had<br />
increased to over 30 kt (15 m/see). These data prompted the issuance of a Tropical Cyclone Formation<br />
Alert at 241400Z. The first warning followed shortly afterward at 241800Z when the tropical cyclone<br />
showed signs of rapid development. Steady intensification continued as TC 02B passtxi through the<br />
axis of the subtropical ridge on 27 April and recurved. On 28 April, acceleration started due to the<br />
influence of stronger mid-level southwesterlies. The southwesterlies aloft also enhanced upper-level<br />
outflow, and TC02B rapidly intensified into a rare Bay of Bengal cyclone of super typhoon intensity<br />
(Figure 3-02B-1). At landfall, the center of the eye of TC 02B passed 30 nm (55 km) south of<br />
Chittagong at 291900Z. OHicial reports stated that the destructive fury lasted eight hours in Chittagong.<br />
As the tropical cyclone weakened rapidly over the mountainous terrain inland, its torrential rains caused<br />
extensive flooding in the region.<br />
III. FORECAST PERFORWCE<br />
Initial <strong>JTWC</strong> track forecasts moved TC 02B slowly northwestward toward the east coast of<br />
India as the subtropical high over India retreated westward. However, the mid-tropospheric subtropical<br />
high located to the east of the system over central Thailand remained fixed and acted as the primary<br />
steering mechanism. The cyclone tracked slowly northward between that subtropical high and the high<br />
over India After 27 1800Z, <strong>JTWC</strong> anticipated that recurvature would in fact occur, and subsequent<br />
warnings indicated that TC 02B would strike the coast of Bangladesh (Figure 3-02B-2). The actual<br />
point of landfall near Cittagong on the coast of Bangladesh was correctly forecast after the 281200Z<br />
warning, 31 hours prior to landfall.<br />
The fmt few <strong>JTWC</strong> forecasts indicated that TC 02B would track slowly northwestward and<br />
intensify before making landfall in eastern India. <strong>JTWC</strong> forecasters anticipated significant development<br />
because of the combination of weak vertical wind shear and strong speed divergence aloft, both north<br />
and south of the cyclone. On the 280600Z warning, <strong>JTWC</strong>S predictions indicated the tropical cyclone<br />
155
would cross the coast of Bangladesh at an intensity of about 100 kt (50 rn/see). Commencing with the<br />
warning at 290000Z, <strong>JTWC</strong> intensity rationale changed as the Center forecast that the maximum<br />
sustained surface winds at landfall would exceed 120 kt (60 rdsec) clue to anticipated continued rapid<br />
intensification.<br />
IV. IMPACT<br />
In terms of stoxm surge, the Bay of Bengal is the most dangerous tropical cyclone basin in the<br />
World. Not only are the physical characteristics of the basin conducive to producing very large storm<br />
surges, but the low lying coastal areas are heavily populated. ln addition to the tremendous loss of life<br />
due to TC02B, ten million people, one-tenth of the population of Bangladesh, were displaced as an<br />
estimated one million homes were destroyed. The human suffering associated with this event was<br />
staggering.<br />
Communicating by telephone, <strong>JTWC</strong> kept the U.S. Embassy in Dacca informed of the<br />
cyclone’s expected track and characteristics for the 48-hour period prior to it hitting land. This<br />
communication squelched rumors that the cyclone would strike the Dacca-Ganges delta region of<br />
Bangladesh, and probably prevented an unnecessary evacuation of Embassy personnel.<br />
F@re 3-02B-1.<br />
visual imagery).<br />
TC02B with winds in excess of 130 kt (65 m/see) bears dovm on the coast of Bangladesh (28 April DMSP<br />
156
E 80 85<br />
N 30<br />
25<br />
20<br />
15<br />
10<br />
N5<br />
\\/ /t6 y<br />
P;<br />
. . .<br />
.................................. ....................<br />
\<br />
)<br />
90 95 100 105 110E<br />
/<br />
--<br />
5 . c<br />
P’ :<br />
~<br />
. ab . .. . ........ .....<br />
.<br />
. .<br />
‘[<br />
L<br />
M ‘k<br />
.......... .<br />
Figure 3-02B-2.<br />
Suntrnsryof <strong>JTWC</strong>forecssts (solid lines) for TC02B superimposedon the best track(dsshed line).<br />
157
E80 85 90 95 100 105E<br />
N30<br />
lTROPICALcycLONE 0313I<br />
25<br />
w<br />
00 20<br />
15<br />
N 10<br />
BEST TRACK TC-03B<br />
J<br />
30<br />
29 MAY-03 JUN 91<br />
MAX SF(2WIND 50KT<br />
~ 35<br />
MINIMUM SLP 987MB<br />
17<br />
..<br />
,,<br />
,,.<br />
.<br />
..’.<br />
,........<br />
.<br />
, .i ,...<br />
.,..’<br />
,.,. .,’<br />
45: :\\<br />
*<br />
16 .o@<br />
................................................!,.,..,.:........................ ...+...............<br />
4 L-(<br />
50 ~~6 ●<br />
●<br />
\<br />
.. . 13,if: “:!’”’’”i’+””’”’..:,<br />
,. .,., “.:’:<br />
\ .,, ,..~,:.“<br />
........ .. :,,.:: :.., ...’~<br />
2 “’;,<br />
\ “i2 ~ ‘g ‘,, ..,,<br />
:0 .‘,: .<br />
~~~-’y3s---”””””~2”~”’’”’””-”<br />
,,,,, “:$<br />
~--””-”-”””’”’’’’-””’”’”::i’-y””””’<br />
,.+ “’:,.,,,,<br />
30--” ; 1<br />
,.’<br />
~5b~“<br />
: F; 31/12Z :: .,...’ ‘“<br />
.TcFA$-@<br />
%o~ooo<br />
●<br />
:–”-%&--”’”–’-’’””’-’””’”’’”””’””--”””’-<br />
! o<br />
<br />
,’ ..<br />
. .<br />
~ ABIO ,,[::<br />
‘:,..<br />
.:...<br />
**7<br />
**<br />
**<br />
[<br />
3<br />
-.....—. .—... . .......... ..... ..<br />
.:.. ..<br />
., .. ...’<br />
:., ,<br />
., :.’,...:<br />
.,:,<br />
., :.<br />
.!.. ... ,.,<br />
noon<br />
----<br />
LEGEND<br />
....... . .. .. ... . .... .. .,,-,<br />
6-HR BESTTRACK POSITION<br />
SPEEDOF MOVEMENT (K’T)<br />
msnw (KT)<br />
POSITIONAT XX.KDOOZ<br />
TROPICALDISTURBANCE<br />
‘lltOPICAL DEPRESSION<br />
‘IROPICALSTORM<br />
TYPHOON<br />
SUPERTYPHOON START<br />
SUPERTYPHOON END<br />
EXTRATROPICAL<br />
SUBTROPICAL<br />
DISSIPATINGSTAGE<br />
FiRSTWARNING ISSUED<br />
LASTWARNING ISSUED
TROPICAL CYCLONE 03B<br />
E 75 80 85 90 95 100 E<br />
N30<br />
25<br />
20<br />
15<br />
. . ............. . . .......................... . ......,..,..>.., ............. ..........<br />
N 10<br />
Figure 3-03B-1. In the aftermath of the devastation due to Tropical Cyclone 02B, another destructive<br />
weather system, Tkopical Cyclone 03B, struck the same coastline of B-angladesh one month later, and<br />
caused further damage. Cyclone 03B was initially mentioned on the 291800Z May Significant Tropical<br />
<strong>Weather</strong> Advisory as a weak, poorly organized low-level circulation. Over the next 30 hours, it<br />
gradually intensified and tracked westward. As the system began to move northward and gain<br />
convective organization, a Tropical Cyclone Formation Alert was issued at 31003OZ followed by the<br />
first warning at311200Z. Tropical Cyclone 03B reached its peak intensity of 50 kt (25 m/see) shortly<br />
before landfall, midway between Dacca and Chittagong on the coast of Bangladesh at 020400Z, titer<br />
which it rapidly dissipated over mountainous terrain inland. The final warning was issued at 021 800Z.<br />
The cyclone caused minor flooding in Bangladesh and disrupted the relief efforts of Operation<br />
SEA ANGEL by forcing the amphibious cargo ship, USS St. Louis, to seek room to maneuver offshore.<br />
Tropical Cyclone 03B’s impact on SEA ANGEL was minimized by accurate track and intensity<br />
forecasts, and by up-to-the-minute information provided to decision makers by <strong>JTWC</strong> forecasters. A<br />
comparison of <strong>JTWC</strong> forecasts to the final best track is provided.<br />
159
L4<br />
.,. :.: ..’ , ..’<br />
..... ,...’ ,,’<br />
.,. ..... ..... .....<br />
.2. .!..<br />
..<br />
; . ... ........ ..<br />
I“””W+IH”<br />
.,,..<br />
. . . .............. . . .................. .... ..............................................<br />
0:<br />
,...., swy~ + ~~ ,.,,<br />
..... 0:< ‘:”<br />
H<br />
‘.0<br />
::<br />
::<br />
+- :<br />
:: 0 . .,.,,<br />
::<br />
......................................g. ............................................................<br />
0:<br />
. ...<br />
::<br />
‘..;.<br />
,:...;:.,.-,,,. ... ... ........... .....................<br />
...>.<br />
.<br />
................................................<br />
● ✚ N<br />
:<br />
g<br />
. ...........+........<br />
.....................=4.. . : & .....................<br />
● ~j<br />
● ~~:<br />
*! D<br />
‘:/ %<br />
● :<br />
●<br />
w.<br />
:$ ,,..@-i “ ‘“<br />
,.., ..<br />
/<br />
~ ,,*””<br />
s<br />
....4..”’’{.””.-”+””’.. .......<br />
“p%<br />
. .<br />
i<br />
::..;:.:::::.:.:::..:::::::.........<br />
..,..:’..... .....<br />
;.........~o . ....................................<br />
,.. ,<br />
,,...,:<br />
,..,,,. .. .....<br />
.......”<br />
,.,<br />
.,..,......-’”””<br />
) m<br />
‘,.<br />
..,”<br />
..,”<br />
o<br />
m<br />
m<br />
UJ<br />
z
TROPICAL CYCLONE 04B<br />
Figure 3-04B- 1 Tropical Cyclone 04B makes landfall on the southern coast of India at maximum<br />
intensity (1403052 November DMSP visual imagery).<br />
Tropical Cyclone 04B was the only cyclone to develop in the North Indian Ocean during the fall<br />
transition season. After being initially detected on 9 November, the disturbance was mentioned on the<br />
18002 Significant Tropical <strong>Weather</strong> Adviso~. It tracked westward in the Bay of Bengal for the next<br />
three days without a significant increase in organization. At 1318002, a Tropical Cyclone Formation<br />
Alert was issued when 1312002 synoptic data revealed a well-developed upper-level anticyclone had<br />
developed over the broad low-level circulation center. Twelve hours later, the first warning on Tropical<br />
Cyclone 04B indicated that while the system was rapidly approaching the southern coast of lndia, it was<br />
expected to maintain sufficient organization after crossing the Indian peninsula to allow it to reintensify<br />
in the Arabian Sea. For this reason, <strong>JTWC</strong> continued to issue warnings while the cyclone was over<br />
land. After reaching its maximum intensity of 40 kt (21 m/see) just prior to landfall, the system crossed<br />
the lndian coast near Nagappattinam approximately 140 nm (260 km) south of Madras at 142300Z. lt<br />
did not reintensify in the Arabian Sea, and the final warning was issued at 1600002.<br />
161
Intentionally left blank.<br />
162
4. SUMMARY OF SOUTH PACIFIC AND<br />
SOUTH INDIAN OCEAN TROPICAL CYCLONES<br />
4.1 GENERAL<br />
4.2. SOUTH PACIFICAND<br />
SOUTH INDIANOCEAN<br />
On 1 October 1980, <strong>JTWC</strong>’S area of<br />
TROPIALCYCLONES<br />
responsibility (AOR) was expanded to include<br />
the Southern Hemisphere from 180° east<br />
Tropical cyclone activity in 1991 (Table<br />
longitude westward to the coast of Africa. 4-2) was below the climatological mean of 27<br />
Details on Southern Hemisphere tropical storms, and the second lowest seasonal total<br />
cyclones and <strong>JTWC</strong> warnings from July 1980 since 1981 (Table 4-3). The below-average<br />
through June 1982 are contained in Diercks et number of cyclones was a reflection of light<br />
al. (1982) and from July 1982 through June activity in the South Pacific. Although the<br />
1984, in Wirfel and Sandgathe (1986). number of storms in the rest of the Southern<br />
Information on Southern Hemisphere tropical Hemisphere was near normal, only one tropical<br />
cyclones after June 1984 can be found in the<br />
applicable Annual Tropical Cyclone <strong>Report</strong>.<br />
TABLE 4-1 ~ ~ 81ZWM3G<br />
The Naval Western Oceanography<br />
~=~ IumIKat --~<br />
Center (NWOC) Pearl Harbor, HI issues<br />
~ (~ = ~, 1977)<br />
warnings on tropical cyclones in the South<br />
Pacific east of 180° east longitude.<br />
MAXIMUM SUSTAINED MINIMUM SEA-LEVEL<br />
In accordance with CINCPACINST<br />
3140.lU (series), Southern Hemisphere tropical<br />
cyclones are numbered sequentially from 1 July<br />
through 30 June. This convention is established<br />
to encompass the Southern Hemisphere tropical<br />
cyclone season, which primarily occurs from<br />
January through April. There are two ocean<br />
basins for warning purposes - the South Indian<br />
(west of 135° east longitude) and the South<br />
Pacific (east of 135° east longitude) - which axe<br />
identified by appending the sufllies “S” and “P”<br />
respectively to the tropical cyclone number.<br />
Intensity estimates for Southern<br />
Hemisphere tropical cyclones are derived from<br />
the interpretation of satellite imagery using the<br />
Dvorak technique (Dvorak, 1984) and in rare<br />
instances from surface observations. The<br />
Dvorak technique relates specific cloud<br />
signatures to maximum sustained one-minute<br />
average wind speeds. The conversion from<br />
maximum sustained winds to minimum sealevel<br />
pressure is obtained fmm the Atkinson and<br />
Holliday (1977) relationship (Table 4-l).<br />
163<br />
30 1000<br />
35 997<br />
40 994<br />
45 991<br />
50 987<br />
55 984<br />
60 980<br />
65 976<br />
70 972<br />
75 967<br />
80 963<br />
85 958<br />
90 954<br />
95 948<br />
100 943<br />
105 938<br />
110 933<br />
115 927<br />
120 922<br />
125 916<br />
130 910<br />
135 906<br />
140 898<br />
145 892<br />
150 885<br />
155 879<br />
160 872<br />
165 865<br />
170 858<br />
175 851<br />
180 844
cyclone, Sina (03P) occurred east of 165°E for Tropical Cyclone 10S, each preceded the<br />
(Table 4-4). Tropical cyclone activity was first warning. The <strong>JTWC</strong> was in warning status<br />
spread evenly throughout the season, which a total of 105 days, which includes 20 days<br />
began in late September and ended in early when the <strong>JTWC</strong>. issued warnings on two or<br />
June. Peak activity occurred on 27 February, more Southern Hemisphere cyclones. Tropical<br />
when four cyclones were in warning status at Cyclone 08S (Bells), which lasted for 15 days,<br />
the same time.<br />
was the only system to reach super typhoon<br />
Twenty-six initial tropical cyclone intensity.<br />
formation alerts were issued in 1991, and except<br />
TABLE 4-2 SOUTH PACIFIC AND SOUTH INDIAN OCEAN<br />
1990 SIGNIFICANT TROPICAL CYCLONES<br />
(1 July 1990 - 30 June 1991)<br />
NUMBER<br />
MAXIMUM<br />
WARNINGS SURFACE ESTIMATED<br />
~~ xs.sUEQ KT [M/~<br />
01s ---- 21 Sep - 25 Sep 10 30(15) 1000<br />
02s ---- 18 Ott - 20 Ott 5 30 (15) 1000<br />
(I3P Sins** 24 NOV - 29 NOV 8 125{ 64) 916<br />
04s ---- 03 Dec - 04 Dec 3 55(28) 984<br />
05S Laurence 15 Dec - 16 Dec 4 35(18) 997<br />
0 6P JOy 18 Dec - 26 Dec 16 90(46) 954<br />
07S Alison 12 Jan - 18 Jan 18 65 (33) 976<br />
08s Bells 20 Jan - 04 Feb 31 130 (67) 910<br />
09s Chris 16 Feb - 21 Feb 11 50 (26) 987<br />
09S Chris* 22 Feb - 23 Feb 3 30 (15) 1000<br />
10S Cynthia 16 Feb - 17 Feb 3 50(26) 987<br />
11S Daphne 22 Feb - 27 Feb 12 60 (31) 980<br />
12S Debra 24 Feb - 04 Mar 17 90(46) 954<br />
13P Kelvin 25 Feb - 06 Mar 19 55 (28) 984<br />
14S Elm 27 Feb - 03 Mar 10 60 (31) 980<br />
15P ---- 06 Mar - 07 Mar 2 30 (15) 1000<br />
16P ---- 18 Mar - 20 Mar 5 30(15) 1000<br />
17S Fatima 22 Mar - 01 Apr 21 90(46) 954<br />
18s Errol 25 Mar - 29 Mar 15 110 (57) 933<br />
18S Errol* 30 Mar - 31 Mar 4 35 (18) 997<br />
19S Marian 10 Apr - 19 Apr 18 95(49) 948<br />
20S Fi.fi 16 Apr - 20 Apr 9 55(28) 984<br />
21P Lisa 07 May - 12 May 11 70 (36) 972<br />
22s Gritelle 08 Jun - 12 Jun 9 40(21) 994<br />
Total: 264<br />
* Regenerated<br />
** - Additional 3 Warnings Issued by NWOC<br />
NO1’E: Names of Southern Hemisphere Tropical Cyclones are given by the Regional Warning<br />
Centers (Nadi, Brisbane, Darwin, Perth, Reunion and Mauritius) and are appended to<br />
<strong>JTWC</strong>Warnings, when available.<br />
164
TABIE 4-3 ~D~CU~~ PACXETC AND<br />
~~IAU~~ICAL~<br />
JULAESEE QCLBSUDE!2JAN EEli MliRAE13MA-x JSUilmAL<br />
(1959-1978)<br />
AVERAGE* - - _ 0.4 1.5 3.6 6.1 5.8 4.7 2.1 0.5 - 24.7<br />
1981 000132 65331o 24<br />
1982 100113 942310 25<br />
1983 1001135 63500 25<br />
1984 100125 5104200 30<br />
1985 000017 996300 35<br />
1986 001011 996420 33<br />
1987 010013 683411 28<br />
1988 000023 553120 21<br />
1989 000021 586420 28<br />
1990 201122 4410210 29<br />
1991 001113 255211 22<br />
TOThL CASES: 5 1 3 6 17 33 65 73 51 33 11 2 300<br />
(1981-1991)<br />
AVERAGE: 0.5 0.1 0.3 0.5 1.5 3.0 5.9 6.6 4.6 3.0 1.0 0.1 27.3<br />
* (Gray, 1979)<br />
TAME 4-4 ANNuALmRIATImoT ~ Imuss<br />
-I= ~ BY~BAsIM<br />
SOUTHINDIAN AUSTRALIAN SOUTH PACIFIC<br />
0<br />
@ 105 E)<br />
J.lQ5 o~ _ ~650~) 0<br />
OF 165 F!}<br />
(1959-1978)<br />
AVERAGE* 8.4 10.3 5.9 24.7<br />
1981 13 8 3 24<br />
1982 12 11 2 25<br />
1983 7 6 12 25<br />
1984 14 14 2 30<br />
1985 14 15 6 35<br />
1986 14 16 3 33<br />
1987 9 8 11 28<br />
1988 14 2 5 21<br />
1989 12 9 7 28<br />
1990 18 8 3 29<br />
1991 11 10 1 22<br />
TOTAL CASES: 138 107 55 300<br />
(1981-1991)<br />
AVERAGE: 12.5 9.7 5.0 27.3<br />
* (Gray, 1979)<br />
165
I I I I I I f<br />
Figure 4-1. Chronology of South Pacific and<br />
South Indm Ocean tropicalcyclones for 1990.<br />
JlllllllllIIIIIIII
E 130 140 150 160 170 180 170 160 150 140 130w<br />
EQ ,. .. ,, .,.<br />
...,.<br />
,..<br />
.: ,,.<br />
,:,,<br />
..... . . :<br />
:.:,::,;,,, ,. ..:,, ..:<br />
.. . .,<br />
,+..<br />
.:,;::,“,.. ‘“ .,.., : .,,<br />
.,. .. ‘.., ,..;,,<br />
. .,, : ,, :.”,::”. :<br />
...<br />
,:: ...<br />
., :. ..... ... ....... ,.. ,, ., .,,, ,.,<br />
. 03P ~<br />
,,: . .<br />
I IIR!Zm<br />
,. ,... , ~:,: ..,, :<br />
~<br />
10<br />
.<br />
20<br />
30<br />
-:<br />
‘~!<br />
pf::, ‘<br />
\ - ●, ● ““”,: :<br />
,,..,.<br />
● ;<br />
.:<br />
B ;: .,,, 1<br />
,.. ,,;,.,<br />
06P “:.:’.::, 15P ● “~ :<br />
k<br />
.,<br />
,:. 16P<br />
.<br />
Isi “1<br />
.......... .,,..,,,,,., ,,.:.,....,.. .,,.,,.,..<br />
.,...’.,:<br />
...:...:<br />
‘,:” ,,.,:<br />
..w,* ●.. .:<br />
..... . ... . ....,,i.,,... .. ... . ..,...,[,,.,,<br />
~~p ~ ~<br />
::,> ~ ~<br />
........03P................................<br />
.........<br />
,,..!.,..,... ,.,,...,,<br />
40<br />
.... .,,,,..<br />
03P SINA 23 NOV - 30 No<br />
06P JOY 15 DEC - 27 DE<br />
11S DAPHNE 15 FEB - 27 IE<br />
13P KELVIN 24 FEB - 06 MA<br />
15P ---- 03 MAR- 07MA<br />
“’”””’~’’””’””<br />
16P ---- 14 MAR- 21MA<br />
21P LISA 04MAY-13MA<br />
‘...<br />
MAXIMUM<br />
~64KT<br />
SUSTAINED SURFACE WIl<br />
[33M/SECl OR GREAT<br />
s50
w<br />
m<br />
mm ~,.. “:.. i<br />
E<br />
v& ..,,..,,<br />
v-) ““:....:.:<br />
n .,.,<br />
““‘“”l..<br />
! . ..s...<br />
b<br />
_*sm<br />
“:’<br />
‘,.<br />
I-ewsll-loidw<br />
Nooor)k+ ea.<br />
.:.. :...,.., 11111111<br />
.<br />
ERM!%%<br />
Ulmwoeowlu<br />
-I NC’4LNOJO*C<br />
rI%WWM<br />
m -i-i ~~~~~<br />
;’L;=’:>-+”*’~”’””””””’”””””””””””<br />
~;<br />
.. .. .<br />
!/<br />
Irnrnch(nmcnrnr.<br />
~~~~~~~~~~~~<br />
m WE5E!<br />
—.....<br />
11111111<br />
I @&>ozzlnu ‘--“-<br />
r ....~ ..1 . .<br />
...................... *.,<br />
L ●*W<br />
●<br />
ca@<br />
CN:<br />
-<<br />
●<br />
s<br />
om<br />
m<br />
●<br />
✌✎✎ ✚✎✎✎✎ ✌✌✌✎✌<br />
v<br />
1Zwl<br />
+Wd g/<br />
lag%<br />
~ ~ g .<br />
:..:<br />
::<br />
.’. +:.,,. ....,.<br />
. . “.,..,,<br />
.:.<br />
.......<br />
.<br />
~<br />
..<br />
:.,<br />
:.. .<br />
,.....i& * ->~<br />
. .. . .. . . .. . .. . . .<br />
. ...... .~l.,= .. ..................Ẇ’J...,..................<br />
~<br />
.......... .-<br />
.. : “9<br />
..;,,, ,:. . ,,,. %,,..,,<br />
.’..<br />
.,. ,.,, .. ...,: ,<br />
..,.: I<br />
,,.,<br />
168<br />
W
5. SUMMARY OF FORECAST VERIFICATION<br />
5.1 ANNUAL FORECAST<br />
VERIFICATION<br />
Verification of warning positions and<br />
intensities at initial, 24-, 48- and 72-hour<br />
forecast periods was made against the final best<br />
track. The (scalar) track forecast, along-track<br />
and cross-track errors (illustrated in Figure 5-1)<br />
were calculated for each verifying <strong>JTWC</strong><br />
forecast. These data, in addition to a detailed<br />
summary for each tropical cyclone, is included<br />
as Chapter 6 (formerly Annex A). This section<br />
summarizes verification data for 1991 and<br />
contrasts it with annual verification statistics<br />
from previous years.<br />
5.1.1 NORTH WEST PACIFIC OCEAN —<br />
The frequency distributions of errors for<br />
warning positions and 24-, 48- and 72-hour<br />
forecasts are presented in Figures 5-2A through<br />
5-2D, respectively. Table 5-1 includes mean<br />
track, along-track and cross-track errors for<br />
1978-1991. Figure 5-3 shows mean track errors<br />
and a 5-year moving average of track emors at<br />
24-, 48- and 72-hours for the past 22 years.<br />
Table 5-2 lists annual mean track errors from<br />
1959, when the <strong>JTWC</strong> was founded, until the<br />
present. Figure 5-4 illustrates <strong>JTWC</strong> intensity<br />
forecast errors at 24-, 48- and 72-hours for the<br />
past 22 years.<br />
5.1.2 NORTH INDIAN OCEAN — The<br />
frequency distributions of emors for warning<br />
positions and 24-,48- and 72-hour forecasts are<br />
presented in Figures 5-5A through 5-5D,<br />
respectively. Table 5-3 includes mean track,<br />
along-track and cross-track errors for 1971-<br />
1991. Figure 5-6 shows mean track errors and a<br />
5-year moving average of track errors at 24-,<br />
48- and 72-hours for the 21 years that the <strong>JTWC</strong><br />
has issued warnings in the region.<br />
5.1.3 SOUTH PACIFIC AND SOUTH<br />
INDIAN OCEANS — The frequency<br />
distributions of emors for warning positions and<br />
24- and 48-hour forecasts are presented in<br />
Figures 5-7A through 5-7C, respectively. Table<br />
5-4 includes mean track, along-track and crosstrack<br />
emors for 1981-1991. Figures 5-8 shows<br />
mean track errors and a 5-year moving average<br />
of track errors at 24- and 48-hours for the 11<br />
years that the <strong>JTWC</strong> has issued warnings in the<br />
region.<br />
BestTrack<br />
Figure 5-1. Defiition of cross-track error(XTEL along-track<br />
error (ATE) and fcma.st track error (lTE). In this example,<br />
the XI’E is positive (to the right of the beat track)and the ATE vmifj’ing +m~<br />
is negative (behind or slower than the best track).<br />
Position<br />
Fomc.ast<br />
Position<br />
FI’E-Fomcast TrackEmor<br />
ATE- Along-TmckError<br />
XfE - Cress-TrackEmr<br />
169
400<br />
350<br />
300<br />
250<br />
~“”””’ “<br />
23<br />
A35<br />
200<br />
150<br />
100<br />
50<br />
0<br />
0-14 15- 30- 45- 60- 75- 90- > 105<br />
29 44 59 74 89 104<br />
ERROR (NM)<br />
Figure 5-2A. Frequencydistributionof initialposition errors(15 nm increments) for the Northwest Pacific m 1991.<br />
fi largest errorduring-1991wss231nrn(’I%picsl StormL&e (20~). -<br />
fikiEAN %<br />
MEDIAN:<br />
ST ““~<br />
85<br />
61<br />
CASES: 733<br />
60<br />
40<br />
20<br />
0<br />
0-29 30- 60- 90- 120- 150- 180- 21 O- 240- 27(1 - 3t)0- ~ 330<br />
59 89 119 149 179 209 239 .269 299 329<br />
ERROR (NM)<br />
Figure 5-2B. Frequencydistrilmtionof 24-hour forecast errors(30 nm increments)for the Northwest Pacific m 1991.<br />
The largest emorduring 1991 was 403 run(TropicalStorm Luke (20W)).<br />
170
IMEAN:<br />
18s<br />
CASES: 599<br />
&<br />
IJ.1 40<br />
3 20<br />
20<br />
&<br />
O-59 60- 120- 180- 240- 300- 360- 420- 480- 54r)-~ 600<br />
119 179 239 299 359 419 479 539 599<br />
ERROR (IWVI)<br />
Figure 5-2C. Frequencydistributionof48-hourforecastemm (;Om-'rnmmB) fmthe Ndwmt Pticklggl.<br />
‘l’helargestmm during 1991 was 860 m (Tropical StormLuke (20W)).<br />
+<br />
1<br />
MEDIAM<br />
2s4<br />
t ST DEW 167<br />
m<br />
— CASES: 4s4<br />
+ + +<br />
O-89 90- 180- 270- 360- 450- 54t)- 630- 720- z 81t)<br />
179 269 359 449 539 629 719 809<br />
ERROR (NM)<br />
Figure 5-2D. Prequencydistrilmtionof 72-hour forecast errors(90 nm increments) for the Noxthwe.stPtic in 1991.<br />
The largest errorduring 1991 was 912 nm (Super~oon Ruth (25W)).<br />
171
TABLE 5-1. = ANUUAL INITIALPOSITIONAND FORECAST POSITIONBRRORJ3(NM) 1978-1991FOR THS NORTHWSSTPACIFIC OCBAIU<br />
YBAR<br />
UMBER OF INITIAL<br />
NUMBER OF<br />
24-HOUR<br />
K ALONG CROSS<br />
NUMBER OF<br />
4a-nouR<br />
NUMBER OF 72-iOUR<br />
CASTS TRACK LONG CROS:<br />
1978<br />
1979<br />
1980<br />
1981<br />
1972<br />
1983<br />
1984<br />
1985<br />
19a6<br />
19a7<br />
19aa<br />
1989<br />
1990<br />
696<br />
695 $:<br />
590 28<br />
584 25<br />
786 19<br />
445<br />
611 ;:<br />
592 18<br />
743 21<br />
657<br />
465 H<br />
710 20<br />
794 21<br />
556 126 87 71<br />
589 125 81 76<br />
491 127 86 76<br />
466 124 80 77<br />
666 113 74 70<br />
342 117 76 73<br />
492 117 84<br />
477 11.7 ao %<br />
645 126 85 70<br />
563 107 71 64<br />
373 114 85 58<br />
625 120 83<br />
658 120 81 %<br />
420 274<br />
469 227<br />
369 244<br />
348 221<br />
532 238<br />
253 260<br />
37e 232<br />
336 231<br />
535 261<br />
465 204<br />
262 216<br />
481 231<br />
404 237<br />
194<br />
146<br />
165<br />
146<br />
162<br />
169<br />
163<br />
153<br />
183<br />
134<br />
170<br />
162<br />
162<br />
151<br />
138<br />
147<br />
131<br />
142<br />
164<br />
131<br />
138<br />
151<br />
127<br />
103<br />
127<br />
138<br />
295 411 296 218<br />
366 316 214 182<br />
267 391 266 230<br />
246 334 206 219<br />
425 342 223 211<br />
184 407 259 263<br />
286 363 238 216<br />
241 367 230 227<br />
412 394 276 227<br />
389 303 198 186<br />
183 315 244 159<br />
363 350 265 177<br />
305 355 242 211<br />
1991<br />
a35 22<br />
733 96 69 53<br />
599 185<br />
137<br />
97<br />
484 287 229 146<br />
,VBRAQZ7a-91:<br />
657 21<br />
548 116 79 68<br />
427 229<br />
159<br />
131<br />
327 347 240 200<br />
IKY2S: Cross-track and aloncl-track errors were adopted bv the <strong>JTWC</strong> in 1986. Riaht-angle . . errors (used prior to 1986)<br />
were re-computed as &oss-track and along-t;ack e;rors after the fact to extend the data base.<br />
See Figure 5-1 for the definitions of cross-track and along-track errors.
150.<br />
z<br />
140:..a) ...................................................................................................................<br />
● 2 4-HOUR ERRORS<br />
O 5-YEAR AVERAGE<br />
g 120. ...... ........<br />
lx<br />
%<br />
110.,.-,--,,,,,.,,,,,,,,<br />
. ............ ... ... ..........<br />
1970 1975 1980 1985 1990<br />
300.<br />
e<br />
● 48-HOUR ERRORS<br />
——”.-—-..,.”,. —...,,.. .<br />
0 5-YEAR AVERAGE<br />
~<br />
- ...—.-— ..<br />
~ 240. ..— ... . ..<br />
g<br />
200. .... .....<br />
180J<br />
500.<br />
‘ c)<br />
1970 1975 1980 1985 1990<br />
YEAR<br />
.—— ..-— .s-._._ ._~......-.+..<br />
b<br />
[<br />
r<br />
6<br />
.-.-—.,—-....<br />
450..- ...--. *...-.h-.A -------- . . .. ..... . .... ... .... . . ●.. 72-HOUR ...... ERRORS . . .. . .. .<br />
O 5-YEAR AVERAGE<br />
300.,.,,,,,,,,,,.,,,,,,,,-.-<br />
. ..<br />
250. . ... ... . . . .... ........ . .... . .. . ... .............................<br />
1970 1975 1980 1985 1990<br />
Figure 5-3. Annual mean track forecast errors(rim)and 5-year nnming mean for a) M-hours, b) 48-hours and c) 72-hours<br />
in the Northwest Pacitlc C&am<br />
173
TABLE 5-2<br />
1959<br />
1960<br />
1961<br />
1962<br />
1963<br />
1964<br />
1965<br />
1966<br />
1967<br />
1968<br />
1969<br />
1970<br />
1971<br />
1972<br />
1973<br />
1974<br />
1975<br />
1976<br />
1977<br />
1978<br />
1979<br />
1980<br />
1981<br />
1982<br />
1983<br />
1984<br />
1985<br />
1986<br />
1987<br />
1988<br />
1989<br />
1990<br />
1991<br />
24–HOUR<br />
ALL/ 2mnsKm& *<br />
117**<br />
177**<br />
136<br />
144<br />
127<br />
133<br />
151<br />
136<br />
125<br />
105<br />
111<br />
104 98<br />
111 99<br />
117 116<br />
108 102<br />
120 114<br />
138 129<br />
117 117<br />
148 140<br />
127 120<br />
124 113<br />
126 116<br />
123 117<br />
113 n4<br />
117 110<br />
117 110<br />
117 112<br />
121 117<br />
107 101<br />
114 107<br />
120 107<br />
103 98<br />
96 93<br />
48-HOUR<br />
AxJJ/2miQQk& *<br />
267**<br />
354**<br />
274<br />
287<br />
246<br />
284<br />
303<br />
280<br />
276<br />
229<br />
237<br />
190 181<br />
212 203<br />
245 245<br />
197 193<br />
226 218<br />
288 279<br />
230 232<br />
283 266<br />
271 241<br />
226 219<br />
243 221<br />
220 215<br />
237 229<br />
259 247<br />
233 228<br />
231 228<br />
261 261<br />
204 211<br />
216 222<br />
231 214<br />
203 191<br />
185 187<br />
72-HOUR<br />
lU&/mHQQl& *<br />
279<br />
317<br />
381<br />
253<br />
348<br />
450<br />
338<br />
407<br />
410<br />
316<br />
389<br />
334<br />
341<br />
405<br />
363<br />
367<br />
394<br />
303<br />
315<br />
350<br />
310<br />
286<br />
476<br />
374<br />
429<br />
418<br />
432<br />
414<br />
337<br />
349<br />
272<br />
308<br />
382<br />
245<br />
357<br />
442<br />
336<br />
390<br />
459<br />
319<br />
362<br />
342<br />
337<br />
384<br />
361<br />
355<br />
403<br />
318<br />
327<br />
325<br />
299<br />
298<br />
* Forecasts were verified when the tropical cyclone intensities<br />
were at least 35 kt (18 m/see) .<br />
** Fore~st psitions north of 35° north latitude were not<br />
verified.<br />
174
16<br />
15<br />
14<br />
~<br />
-13<br />
tx<br />
~lz<br />
11<br />
10<br />
a) 9 24-HOUR ERRORS<br />
~ 5-YEAR AVERAGFf<br />
—,—.—.. .<br />
.————...-”-.....’----- —.,—..<br />
...... ....... .. . . . ....... . ....... ... . ... ... ...<br />
9<br />
1970 1975 1980 1985 1990<br />
u<br />
24<br />
23<br />
22<br />
-21<br />
H<br />
520<br />
g 19<br />
2*18<br />
17<br />
16<br />
15<br />
14<br />
.,..,,.,,...<br />
-.P>>>..,<br />
●<br />
>>>,,<br />
48-HOUR<br />
>,,.., ...->. "-..<br />
ERRORS<br />
+,x,,,,,> ..,.,>,", -,".,,. m..,,,,,..<br />
b)<br />
O 5-YEAR AVERAGE<br />
.... ..... .. ... . ...... . .<br />
,,,,.,,.., ...." ...>.......,....,..,,..,,,,,,,,..,,.,,.,,,,..<br />
.— .—.<br />
1970 1975 1980 1985 1990<br />
32.<br />
30.<br />
28, ....——— —,...-...— —.——...<br />
~<br />
’26<br />
&<br />
~24<br />
22’<br />
20<br />
c) ● 72-HOUR ERRORS<br />
O 5-YEAR AVERAGE<br />
18<br />
1970 1975 1980 1985 1990<br />
Figure54. Annual mean intensity forecast errors (kt) and 5-year running mean for a) 24-hours, b)48-hours and c) 72-<br />
lmrs in the Northwest P*ific Ocean.<br />
175
IMEAN 38<br />
16<br />
14<br />
12<br />
10<br />
8<br />
6<br />
4<br />
2<br />
‘ST DEV:<br />
CASES:<br />
34<br />
S6<br />
0<br />
t i- t<br />
0-14 15-29 30-44 45-59 60-74 75-89 90- 1o5- 2 120<br />
104 119<br />
ERROR (NM)<br />
Figure 5-5A. Frequency distritmtionof initisl positiont errors(15 nm increments)for the North IndianOcean in 1S91.<br />
The largest exrorduring 1991 wss 183 nm (Tropicsl Cyclone OIA).<br />
60 =I ‘ ST DEV 70<br />
50 “‘<br />
30 “‘<br />
20” “<br />
10 “<br />
o<br />
0-29 30- 60- 90- 120- 150- 180- 210- 240- 270- z 300<br />
59 89 119 149 179 209 239 269 299<br />
ERROR (NM)<br />
Figure 5-5B. Frequencydistributionof 24-hour forecsst errors(30 mn increments) fix the North Indisn Ocesn in 1991.<br />
The Isrgesterrorduring 1991 wss 307 nm (TropicalCyclone OIA).<br />
176
10<br />
9<br />
8<br />
7<br />
6 i<br />
5<br />
4<br />
3<br />
2<br />
1<br />
0<br />
~ 23s<br />
MEDIAN 246<br />
, ST DEW 97<br />
- CASES: 27<br />
O-59 60- 120- 180- 240- 3oo - 360- 420- 2 480<br />
119 179 239 299 359 419 479<br />
ERROR (NM)<br />
Figure 5-SC. Frequencydistributionof 48-hour forecast errors(60 runincrements)for the North Indisn Ocean in 1991.<br />
The lsrgest errorduring 1991 was 409 nm (TropicalCyclone 02B).<br />
10<br />
9<br />
8<br />
7<br />
i~<br />
6<br />
t<br />
5<br />
4<br />
3<br />
2<br />
1<br />
IMEAN: 450<br />
MEDIAN: 466<br />
ST DEW 179<br />
CASES: 14<br />
0<br />
O-89 90- 180- 270- 360- 450- 540- 630- z 720<br />
179 269 359 449 539 629 719<br />
ERROR (NM)<br />
Figure 5-5D. 1%.quencydistributionof 72-hour forecast errors(90 mn increments)for the North IrIdkmOcean in 1991.<br />
The hugest errorduring 1991 WSS 722 run (’i%piCd cyCk)IW 02B).<br />
177
TABLE 5-3. JTNC ANNUAL INITIALPOSITION AND FORX.AST POSITIONXRRORS (NM) 1971-1991FOR TNB NORTH INDIAN OCEAN<br />
Z<br />
00<br />
YEAR<br />
1971<br />
1972<br />
1973<br />
1974<br />
1975<br />
1976<br />
1977<br />
1978<br />
1979<br />
1980<br />
1981<br />
1982<br />
1983<br />
1984<br />
1985<br />
1986<br />
1987<br />
1988<br />
1989<br />
1990<br />
WMBER OF INITIAL NUM8ER OF 24-HOUR<br />
N/A<br />
;: 75<br />
28 55<br />
7 38<br />
ii<br />
42<br />
35<br />
38<br />
33<br />
31<br />
52<br />
42<br />
34<br />
44 19<br />
46 31<br />
1991 56 38<br />
232<br />
2: 217<br />
24 182<br />
6<br />
37<br />
16<br />
31<br />
28 133<br />
63<br />
7<br />
29<br />
37<br />
4:<br />
30<br />
16<br />
54<br />
30<br />
33<br />
36<br />
1;:<br />
102<br />
118<br />
ROS&<br />
NUMBER OF 48-HOUR NUNBER OF 72-HOUR<br />
FORE~K A@NG CROSSj<br />
183 127 2 29%<br />
281 N/A<br />
188 10 299 2Z 130 N/A<br />
1!1 97 17 238 165 159 N/A<br />
137 95 88 4 228 156 138 N/A<br />
145 101 87 25 104 119 164 N/A<br />
138 74 105<br />
292 157 215 N/A<br />
122 69 84 1: 202 147 109 N/A<br />
90 82 17 278 193 161 N/A<br />
151<br />
95 38 17<br />
115 :! 71 2 1: 1:: 1:!<br />
1<br />
109 76 63 17 368 292 209<br />
5<br />
138 110 68 18 153 137<br />
7<br />
117<br />
154<br />
122<br />
134<br />
VBRAm 71-91: 40 41<br />
28 139<br />
144 100 25 205 125 140 21<br />
120 :; 63 18 219 112 176 12<br />
88 62 50 17’ 146 94 86 12<br />
101 85 43 24 146 117 67 17<br />
43 129 101 54 27 235 200 89 14<br />
98<br />
50<br />
67<br />
53<br />
53<br />
80<br />
2:<br />
87<br />
15<br />
274<br />
274<br />
242<br />
168<br />
232<br />
217<br />
217<br />
119<br />
131<br />
155<br />
1;<br />
139<br />
194<br />
80<br />
143<br />
1:<br />
0<br />
5<br />
10<br />
437 251 320<br />
167 137<br />
197 1:: 111<br />
762 653 332<br />
338 339 121<br />
269 189 180<br />
305 219 188<br />
409 227 303<br />
216 164 111<br />
185 130 104<br />
450 356 178<br />
334 252 189<br />
NOTE: Cross-track and along-track errors were adopted by the <strong>JTWC</strong>.in 1986. Right-angle errors (used prior to 1986)<br />
were re-computed as cross-track and along-track errors after the fact to extend the data base.<br />
See Figure 5-1 for the definitions of cross-track and along-track errors.
240<br />
220<br />
200’<br />
160<br />
‘i&<br />
..,.,,,,,,,,,,,,,...,.,,,,,,.<br />
.s.-.-. h.... ............ ● 2 4-HOUR<br />
.........<br />
ERRORS<br />
............<br />
0 5-Ym—AvERAGE<br />
.. .,,,.,.,,,,.,,,,,,,,<br />
,,..,,.,. .,.,,,. .,,,,,,,,,.,,.,,.,,.,,,,,<br />
.,.............................,,, ...,,,.,,,,,,.,,.,<br />
.........................,<br />
--—-.....=... -.—-. ..--.-wA-...+w-. ---.- ...--.--- .--.s.-.--<br />
.,.,,,,,,<br />
..v.., w...<br />
.........7-. ...%.— -... .... . . . ...+....-.<br />
..............................<br />
..h ..-..................<br />
..* ...,.% — —.-.-.s.q.+. ....<br />
140<br />
.--V.Y>.— . . ..-...W--.W ..... . .. . . ... ..<br />
120<br />
100<br />
80<br />
1970 1975 1980 1985 1990<br />
YEAR<br />
. . . . . ..-....,,,,-,..,,,,..,,...<br />
450<br />
400<br />
350<br />
300<br />
b) ....%...... ...... ..w... . .... .... .... ... . .... ................. .................................................<br />
● 48-HOUR ERRORS<br />
O 5-YEAR AVERAGE<br />
250<br />
200<br />
150<br />
. .. . ..—.. . —,——-,.<br />
100<br />
50<br />
1970 1975 1980 1985 1990<br />
YEAR<br />
800<br />
700<br />
600<br />
500<br />
..,,,,,.....”........,..,s..,..,..,,...,.—,/,— . . . . . . . . . ..A..A......A.--..V.....<br />
–--f<br />
.——.— ● 72-HOUR -...-.--—— ERRORS .............<br />
0 5-YEAR AVERAGE<br />
400<br />
300,<br />
200.<br />
100, .L<br />
1970 1975 1980 1985 1990<br />
Figure 5-6. Annual mean track errors (run) and 5-year rurmingmean for a) 24-hours, b) 48-houn and c) 72-hours in the North<br />
I&m Ocean. Note thatno 72-hour forecasts vtii= priorto 1979, m 1983 and 1985.<br />
179
m ‘20~”D’AN:<br />
‘8<br />
100<br />
23<br />
IMEAN: 24<br />
80<br />
CASES: 264<br />
60<br />
40<br />
20<br />
0<br />
0-14 15-29 30-44 45-59 60-74 75-89 90- 1o5- 2 120<br />
104 119<br />
ERROR (NM)<br />
Figure 5-7A. I%quency distribution of initisl position errors (15 nm increments) for the South Pacific and South<br />
Indisn Ocesn in 1991. The lsrgest errorduring 1991 wss 154 nm (TropicalCyclone 08S).<br />
MEAN: 115<br />
70 92<br />
60- 77<br />
50 “ 231<br />
40<br />
30 “<br />
20”<br />
10 “<br />
o<br />
0-29 30- 60- 90- 120- 150- 180- 210- 240- ’70- 2 300<br />
59 89 119 149 179 209 239 269 299<br />
ERROR (NM)<br />
Figure 5-7B. Frequency d~tribution of 24-hour forecsst errors (30 nm increments) for the Soudt Pacific and South<br />
IndianCkesn in 1991. The largest errorduring 1991 was 386 nm (Tropicsl Cyclone 12S).<br />
180
IMEAN<br />
220<br />
I<br />
I<br />
40<br />
30<br />
I<br />
20<br />
10<br />
0<br />
+ +<br />
0-59 60- 120- 180- 240- 300- 360- 420- 480- 540- 2 6oo<br />
119 179 239 299 359 419 479 539 600<br />
ERROR (NM)<br />
Figure 5-7C. Frequencydikbution of 48-houI forecast errors(60 ntn increments) for the South PacKlc and South<br />
Indian Ocean m 1991. The largest errorduring 1991 was 716 nm (TropicalCyclone 17S).<br />
181
AELE 5-4. <strong>JTWC</strong> ANNUAL INITIAL POSITION ANO 3’ORECASTPOSITION =ORS (Nt4)1981-1991 POR THE SOUTHERN WISPEEW<br />
NUMBER OF INITIAL NUMBER OF 24-HOUR NUNBER OF 48-HOUR<br />
WARNINGS POSITION FORECASTS TRACK ALONG CROSS FORECASTS TRACK ALONG CROSS<br />
1981<br />
1982<br />
1983*<br />
1984<br />
1985*<br />
1966*<br />
1987*<br />
1988*<br />
1989*<br />
1990*<br />
1991<br />
WERAGE 78-91:<br />
226 190 165 103 106<br />
140 315 204 201<br />
275 %<br />
238 144 98 86 176 274 188 164<br />
191<br />
163 130 88 77<br />
126 241 158 145<br />
301 ::<br />
252 133 90 79 191 231 159 134<br />
306 36<br />
257 134 92 79<br />
193 236 169 132<br />
279 40 227 129 86 77<br />
171 262 169 164<br />
189 46 138 145 94 90<br />
101 280 153 138<br />
204 34<br />
99 146 98 83<br />
290 246 144<br />
287 31<br />
242 124 73<br />
1:: 240 166 136<br />
272 27<br />
228 143 1:: 74 177 263 178 152<br />
264 24 231 115 75 69 185 220 152 129<br />
254 36 206 136 92 80 255 255 175 150<br />
L<br />
NOTE: Cross-track and along-track errors were adopted by the <strong>JTWC</strong> in 1986. Right-angle errors<br />
(used prior to 1986) were re-computed as cross-track and along-track errors after the fact<br />
to extend the data base.<br />
See Figure 5-1 for the definitions of cross-track and along-track errors.<br />
* These statistics are for <strong>JTWC</strong> forecasts only. NWOC errors are not included.
18C<br />
17C<br />
16C<br />
12C<br />
110<br />
100<br />
320<br />
300<br />
280<br />
b)<br />
1980 1982 1984 1986 1988 1990 19“92<br />
YEAR<br />
\<br />
.... ... . ...>....-..>>..<br />
..> .,..,<br />
. ..,.,.,,.<br />
.,,,,..., .......>...... .,,,,,,,,,,,,,,,,.,,,,,.,,.,,,,<br />
● 48-HOUR .,..,,..<br />
.,,...,.,,,,,,,,,,,,<br />
ERRORS e,_,,,, ...,., .,.<br />
0 5-YEAR AVERAGE<br />
. ...——---a .. ...-..w.-.—w. . . . .. .. . . . . ... ..w..~. . . . . . . . . . . . . . . . . . . . . . . . .W+- .W . . . . . . . .W .s . .<br />
240<br />
--..A..—.——<br />
220<br />
200<br />
1980 1982 1984 1986 1988 1990 1992<br />
YEAR<br />
Figure5-8. Annualmean trackforecast emors and the 5-year numing mean for a) 24-hours and b) 48-hours in the South<br />
Pacific and South Indian Oceans.
5.2 COMPARISON OF OBJECTIVE<br />
TECHNIQUES<br />
<strong>JTWC</strong> uses a variety of objective<br />
techniques for guidance in the warning<br />
development process. Multiple techniques are<br />
required, because each technique has particular<br />
strengths and weaknesses which vary by basin,<br />
numerical model initialization, time of year,<br />
synoptic situation and forecast period. The<br />
accuracy of objective aid forecasts depends on<br />
both the specified position and the past motion<br />
of the tropical cyclone as determined by the<br />
working best track. <strong>JTWC</strong> initializes its<br />
objective techniques using the extrapolated<br />
warning position.<br />
An initiative is presently underway to<br />
convert most of the objective techniques that<br />
currently run on mainfkame computers at FNOC<br />
to desktop computer versions that run on ATCF<br />
workstations. These will eventually replace the<br />
FNOC-generated techniques. Three of these<br />
new aids have been received and are under<br />
evaluation.<br />
Unless stated otherwise, all the objective<br />
techniques discussed below run in all basins<br />
covered by J’TWC’SAOR and provide forecast<br />
positions at 24-, 48-, and 72-hours unless the<br />
technique aborts prematurely during<br />
computations. The techniques can be divided<br />
into six general categories: extrapolation,<br />
climatology and analogs, statistical, dynamic,<br />
hybrids, and empirical or analytical.<br />
5.2.1 EXTRAPOLATION (XTRP) — Past<br />
speed and direction are computed using the<br />
rhumb line distance between the current and 12-<br />
hour old positions of the tropical cyclone.<br />
Extrapolation fkom the current warning position<br />
is used to compute forecast positions.<br />
5.2.2 CLIMATOLOGY and ANALOGS<br />
5.2.2.1 CLIMATOLOGY (CLIM) — Employs<br />
time and location windows relative to the<br />
current position of the storm to determine which<br />
historical storms will be used to compute the<br />
forecast. The historical data base is 1945-1981<br />
for the Northwest Pacific, and 1900 to 1990 for<br />
the rest of <strong>JTWC</strong>’S AOR. A second<br />
climatology-based technique exists on <strong>JTWC</strong>’S<br />
Macintosh@m II computers. It employs data<br />
bases from 1945 to 1991 and from 1970 to<br />
1991. The latter is referred to as the satellite-era<br />
data base. Objective intensity forecasts are<br />
available from these data bases. Scatter<br />
diagrams of expected tropical cyclone motion at<br />
bifurcation points are also available from these<br />
data bases.<br />
5.2.2.2 ANALOGS — <strong>JTWC</strong>’S analog and<br />
climatology techniques use the same historical<br />
data base, except that the analog approach<br />
imposes more restrictions on which storms will<br />
be used to compute the forecast positions.<br />
Analogs in all basins must satisfy time, location,<br />
speed, and direction windows, although the<br />
window definitions are distinctly different in the<br />
Northwest Pacific. In this basin, acceptable<br />
analogs are also ranked in terms of a similarity<br />
index that includes the above parameters and.<br />
storm size and size change, intensity and<br />
intensity change, and heights and locations of<br />
the 700-mb subtropical ridge and upstream<br />
midlatitude trough. In other basins, all<br />
acceptable analogs receive equal weighting and<br />
a persistence bias is explicitly added to the<br />
forecast. Inside the Northwest Pacific, analog<br />
weighting is varied using the similarity index,<br />
and a persistence bias is implicitly incorporated<br />
by rotating the analog tracks so that they<br />
initially match the 12-hr old motion of the<br />
current storm. In the Northwest Pacific, a<br />
forecast based on all acceptable analogs called<br />
TOTL, as well as a forecast based only on<br />
historical recurvers called RECR are available.<br />
Outside this basin, only the TOTL technique is<br />
available.<br />
184
5.2.3 STATISTICAL<br />
5.2.3.1 CLIMATOLOGY AND PERSISTENCE<br />
(CLIP) — A statistical regression technique that<br />
is based on climatology, current position and<br />
12-hour and 24-hour past movement. This<br />
technique is used as a crude baseline against<br />
which to measure the forecast skill of other<br />
more sophisticated techniques. CLIP in the<br />
Northwest Pacific uses third-order regression<br />
equations and is based on the work of Xu and<br />
Neumann (1985). CLIP has been available<br />
outside this basin since mid- 1990, with<br />
regression coefficients recently recomputed by<br />
FNOC based on the updated 1900-1989 data<br />
base.<br />
5.2.3.2 COLORADO STATE UNIVERSITY<br />
MODEL (CSUM) — A statistical-dynamical<br />
technique based on the work of Matsumoto<br />
(1984). Predictor parameters include the current<br />
and 24-hr old position of the storm, heights<br />
from the current and 24-hr old NOGAPS 500-<br />
mb analyses, and heights horn the 24-hr and 48-<br />
hr NOGAPS 500 mb prognoses. Height values<br />
from 200-mb fields are substituted for storms<br />
that have an intensity exceeding 90 knots and<br />
are located north of the subtropical ridge. Three<br />
distinct sets of regression equations are used<br />
depending on whether the storm’s dwection of<br />
motion falls into “below,” “on,” or “above” the<br />
subtropical ridge categories. During the<br />
development of the regression equation<br />
coefficients for CSUM, the so-called “perfect<br />
prog” approach was used, in which verifying<br />
analyses were substituted for the numerical<br />
prognoses that are used when CSUM is run<br />
operationally. Thus, CSUM was not “tuned” to<br />
any particular version of NOGAPS, and in fact,<br />
the performance of CSUM should presumably<br />
improve as new versions of NOGAPS improve.<br />
CSUM runs only in the Northwest Pacific,<br />
South China Sea, and North Indian Ocean<br />
basins.<br />
5.2.4 DYNAMIC<br />
5.2.4.1 NOGAPS VORTEX TRACKING<br />
ROUTINE (NGPS) — This objective technique<br />
follows the movement of the point of minimum<br />
height on the 1000 mb pressure surface<br />
ildyzed and predicted by NOGAPS. A seamh<br />
in the expected vicinity of the storm is<br />
conducted every six hours through 72 hours,<br />
even if the tracking routine temporarily fails to<br />
discern a minimum height point. Explicit<br />
insertion of a tropical cyclone bogus via data<br />
provided over TYMNET by <strong>JTWC</strong> began in<br />
mid- 1990, and should improve the ability of the<br />
NOGAPS technique to track the vortex.<br />
5.2.4.2 ONE-WAY INFLUENCE TROPICAL<br />
CYCLONE MODEL (OTCM) — This<br />
technique is a coarse resolution (205 km grid),<br />
three layer, primitive equation model with a<br />
horizontal domain of 6400x 4700 km. OTCM<br />
is initialized using 6-hour or 12-hour prognostic<br />
fields from the latest NOGAPS run, and the<br />
initial fields are smoothed and adjusted in the<br />
vicinity of the storm to induce a persistence bias<br />
into OTCM’s forecast. A symmetric bogus<br />
vortex is then inserted, and the boundaries<br />
updated every 12 hours by NOGAPS fields as<br />
the integration proceeds. The bogus vortex is<br />
maintained against frictional dissipation by an<br />
analytical heating function. The forecast<br />
positions are based on the movement of the<br />
vortex in the lowest layer of the model<br />
(effectively 850-mb).<br />
5.2.4.3 FNOC BETA AND ADVECTION<br />
MODEL (FBAM) — This model is an<br />
adaptation of the Beta and Advection model<br />
used by NMC. The forecast motion results from<br />
a calculation of environmental steering and an<br />
empirical correction for the observed vector<br />
difference between that steering and the 12-hour<br />
old storm motion. The steering is computed<br />
from the NOGAPS Deep Layer Mean (DLM)<br />
185
wind fields which are a weighted average of the<br />
wind fields computed for the 1000-mb to 100-<br />
mb levels. The difference between past storm<br />
motion and the DLM steering is treated as if the<br />
storm were a Rossby wave with an “effective<br />
radius” propagating in response to the<br />
horizontal gradient of the coriolis parameter,<br />
Beta. The forecast proceeds in one-hour steps,<br />
recomputing the effective radius as Beta<br />
changes with storm latitude, and blending in a<br />
persistence bias for the first 12 hours.<br />
5.2.5 HYBRIDS<br />
5.2.5.1 HALF PERSISTENCE AND CLIM-<br />
ATOLOGY (HPAC) — Forecast positions are<br />
generated by equally weighting the forecasts<br />
given by XTRP and CLIM.<br />
5.2.5.2 COMBINED CONFIDENCE<br />
WEIGHTED FORECASTS (CCWF) — An<br />
optimal blend of objective techniques produced<br />
by the ATCF. The ATCF blends the selected<br />
techniques (currently OTCM, CSUM and<br />
HPAC) by using the inverse of the covariance<br />
matrices computed from historical and realtime<br />
cross-track and along-track errors as the<br />
weighting function.<br />
5.2.6 EMPIRICAL OR ANALYTICAL<br />
5.2.6.1 DVORAK — An estimation of a<br />
tropical cyclone’s current and 24-hour forecast<br />
intensity is made frdm the interpretation of<br />
satellite imagery (Dvorak, 1984) . These<br />
intensity estimates are used with other intensity<br />
related data and trends to forecast short-term<br />
tropical cyclone intensity.<br />
5.2.6.2 MARTIN/HOLLAND — The technique<br />
adapts an earlier work (Holland,’ 1980) and<br />
specii3cally addresses the need for realistic 30-,<br />
50- and 100-kt(15-,26- and 51-rn/see) wind radii<br />
around tropical cyclones. It solves equations<br />
for basic gradient wind relations within the<br />
tropical cyclone area, using input parameters<br />
obtained from enhanced infrared satellite<br />
imagery. The diagnosis also includes an<br />
asymmetric area of winds caused by tropical<br />
cyclone movement. Satellite-derived size and<br />
intensity parameters are also used to diagnose<br />
internal steering components of lropical cyclone<br />
motion known collectively as “beta-drift”.<br />
5.2.6.3 TYPHOON ACCELERATION PRE-<br />
DICTION TECHNIQUE (TAPT) — This<br />
technique (Weir, 1982) utilizes uppertroposphenc<br />
and surface wind fields to estimate<br />
acceleration associated with the tropical<br />
cyclone’s interaction with the mid-latitude<br />
westerlies. It includes guidelines for the<br />
duration of acceleration, upper limits and<br />
probable path of the cyclone.<br />
53 TESTING AND RESULTS<br />
A comparison of selected techniques is<br />
included in Table 5-5 for all Northwest Pacific<br />
tropical cyclone$ Table 5-6 for all North Indian<br />
Ocean tropical cyclones and Table 5-7 for the<br />
Southern Hemisphere. In these tables, “x-axis”<br />
refers to techniques listed vertically. For<br />
example (Table 5-8) in the 743 cases available<br />
for a (homogeneous) comparison, the average<br />
forecast error at 24 hours was 111 nm (205 km)<br />
for CSUM and 117 nm (216 km) for FBAM.<br />
The difference of6nm(11 km) is shown in the<br />
lower right. (Differences are not always exact,<br />
due to computational round-off which occurs<br />
for each of the cases available for comparison).<br />
186
‘liBLE 5-5 1991 3mKR s2!AzIsTIam ~ ~ mKmiIgmz8<br />
IN T= IKx4mmm mrx3’Ic (1 mu 1991 - 31 m 1991)<br />
24-moR Ma31 ~<br />
am<br />
Jlw 733 %<br />
96 0<br />
NGPS 270 96 272 3.38<br />
137 41 138 0<br />
OTCM 686 95 259 137 761 116<br />
118 23 113 -24 116 0 “:Iiiia . .<br />
CSUM<br />
PBAM<br />
CLIP<br />
HPAC<br />
706 96<br />
113<br />
692<br />
17<br />
95<br />
118<br />
722<br />
23<br />
96<br />
118<br />
717<br />
22<br />
96<br />
129 33<br />
:Hs%Ek%x<br />
261 136<br />
270 138 760 116 778 112 759 117<br />
116 -22 117 1 118 6 116 -1<br />
268 137 753 116 771 112 752 117<br />
128 -9 127 11 128 16 127 10<br />
798 U.8<br />
118 0<br />
791 118 792 3.28<br />
128 10 128 0<br />
JTFc<br />
NGPS<br />
O!KM<br />
CSUM<br />
E’BAM<br />
CLIP<br />
HPAC<br />
599 185<br />
185 0<br />
202 187<br />
221 34<br />
532 182<br />
198 16<br />
579 185<br />
217 32<br />
5’70183<br />
216 33<br />
593 185<br />
236 51<br />
589 184<br />
248 64<br />
207 22.1<br />
221 0<br />
189 225<br />
196 -29<br />
198 215<br />
222 7<br />
194 221<br />
233 12<br />
205 222<br />
241 19<br />
203 221<br />
245 24<br />
618<br />
194<br />
603<br />
210<br />
588<br />
208<br />
617<br />
231<br />
613<br />
239<br />
194<br />
0<br />
194 663 212<br />
16 212 0<br />
194 634 213 649 211<br />
14 211 -2 211 0<br />
194 663 212 649 211<br />
37 232 20 232 21<br />
195 658 212 643 211<br />
44 242 30 243 32<br />
72-EWR IutmNXRECAST EmcR(l’alq<br />
680 232<br />
232 0<br />
674 232 675 242<br />
242 10 242 0<br />
JThr<br />
NGPS<br />
OTCM<br />
CSUM<br />
FB!M<br />
CLIP<br />
HPAC<br />
484 287<br />
287 0<br />
123 292<br />
321 29<br />
394 276<br />
283 7<br />
471 289<br />
316 27<br />
461 285<br />
325 40<br />
480 287<br />
354 67<br />
480 287<br />
373 86<br />
127<br />
323<br />
108<br />
292<br />
122<br />
333<br />
118<br />
335<br />
125<br />
373<br />
125<br />
387<br />
323<br />
0<br />
323<br />
-31<br />
317<br />
16<br />
326<br />
9<br />
323<br />
50<br />
323<br />
64<br />
476<br />
277<br />
465<br />
292<br />
453<br />
296<br />
475<br />
346<br />
473<br />
335<br />
277<br />
0<br />
277 553 300<br />
15 308 0<br />
277 529 311 539 316<br />
19 318 7 316 0<br />
276 553 308 539 316<br />
70 351 43 352 36<br />
277 551 308 537 316<br />
58 363 55 363 47<br />
565 350<br />
350 0<br />
563 351 564 363<br />
361 10 361 0<br />
-s ~ti- ~- ~c mdiction 3y8t-<br />
- Cfm+kyT20pbDl Cydoan X0&l Cmx - cold 8t8t0 Unk9r8itymdol<br />
-nwm-udM wmatioxInD&l -- Clintolagylmrsktaun<br />
1=-mimr~ EPw - Half udst~ & CMntOlcgy<br />
187
TABLE 5-6 1991 Emm m&Tr3TIc3 m ~ ~ TEC2WIQXS<br />
lumrtrKwmx nmIANouiaH(l JAu 1991 -31 E1991)<br />
Jlw 43 329<br />
129 0<br />
OTCM 40 125<br />
131 6<br />
FBAM 40 125<br />
146 21<br />
CLIP 40 125<br />
HPAC<br />
151 26<br />
35 110<br />
TOTL<br />
130 20<br />
31 120<br />
146 26<br />
CLIM 35 110<br />
122 12<br />
45 S.33<br />
133 0<br />
45 133<br />
154 21<br />
45 133<br />
150 17<br />
40 125<br />
130 5<br />
34 130<br />
148 18<br />
40 125<br />
123 -2<br />
45 254<br />
154 0<br />
45 154<br />
150 -4<br />
40 152<br />
130 -22<br />
34 155<br />
148 -7<br />
40 152<br />
123 -29<br />
45 250<br />
150 0<br />
of<br />
Error<br />
148 20 138 17 148 0<br />
40 134 40 130 31 138 40 223<br />
123 -11 123 -7 116 -22 123 0<br />
ToohniquB<br />
Error<br />
DSf~<br />
(Y-x)<br />
4S-BXR m<br />
FmEcAsT ERRcR(lw)<br />
JThc 27 235<br />
235 0<br />
O-TCM 23 230<br />
259 29<br />
FBAM 25 233<br />
257 24<br />
CLIP 25 233<br />
274 41<br />
HPAC 23 228<br />
233 5<br />
TOTL 16 245<br />
271 26<br />
CL134 23 228<br />
210 -18<br />
28 258<br />
258 0<br />
28 258<br />
270 12<br />
28 258<br />
282 24<br />
26 252<br />
228 -24<br />
16 261<br />
280 19<br />
26 252<br />
21-I-35<br />
30 272<br />
272 0<br />
30 272<br />
277 5<br />
28 259<br />
224 -35<br />
18 232<br />
285 53<br />
28 259<br />
207 -52<br />
30 277<br />
277 0<br />
28 271 28 224<br />
224 -47 224 0<br />
18 261 18 237 18 283<br />
285 24 285 48 285 0<br />
28 271 28 224 18 285 28 207<br />
207 -64 207 -17 199 -86 207 0<br />
J’1’w 14 450<br />
450 0<br />
mm 12 470<br />
513 43<br />
mm 14 450<br />
284-166<br />
CLIP 14 450<br />
402 -48<br />
WAC 13 464<br />
410 -54<br />
TOTL 9 46S<br />
472 4<br />
CLIM 13 464<br />
296-168<br />
15 4n<br />
471 0<br />
15 471<br />
324-147<br />
15 471<br />
429 -42<br />
13 483<br />
401 -82<br />
7 553<br />
468 -85<br />
13 483<br />
373-110<br />
17 321<br />
321 0<br />
17 321<br />
412 91<br />
15 283<br />
386 103<br />
9 311<br />
472 161<br />
15 283<br />
327 44<br />
17<br />
412<br />
15<br />
386<br />
9<br />
472<br />
15<br />
327<br />
422<br />
0<br />
383 15 386<br />
3 386 0<br />
419 9 419 9 472<br />
53 472 53 472 0<br />
383 15 386 9 472 15 327<br />
-56 32’-59 313-159 327 0<br />
J’lw - mlu!Tcu—cast =- 0rn18qTrqAcd @clan No&l<br />
rmll Pmc-d AlhctiOi MOdd<br />
U$IP - ctiologylmrsi~<br />
mu - Bmlf usi~ mbdc!lia8t010gy roTL-Tatal&dog<br />
cLnl- Cliaatology<br />
188
TABLE 5-7<br />
1991 ~ STATISTICSm ~ mmcrIvs TxstxQcE8<br />
n- ~E33usmmERs (1JuL 1990 - 30 Jml 1991)<br />
JTw<br />
OTC!M<br />
CLIP<br />
HPAC<br />
‘mTL<br />
CLR4<br />
XTRP<br />
232 118<br />
118 0<br />
204 116<br />
122 6<br />
215 118<br />
156 38<br />
213 116<br />
132 16<br />
140 112<br />
135 23<br />
214 116<br />
155 39<br />
211 120<br />
146 26<br />
266 124<br />
124 0<br />
260 124 278 163<br />
153 29 163 0<br />
256 121 271 158<br />
134 13 135 -23<br />
172 129 185 158<br />
135 6 138 -20<br />
260 122 271 158<br />
160 38 164 6<br />
256 125 272 164<br />
144 19 147 -17<br />
273 135 Tactmiqw Mff~<br />
135 0<br />
164 29 166 28 164 0<br />
267 137 184 138 26-1166 214 147<br />
143 6 134 -4 143 -23 147 0<br />
of<br />
X-Axis<br />
lkckmiqum<br />
JTw<br />
OTcM<br />
CLIP<br />
Hex!<br />
TfJTL<br />
CUM<br />
XTRP<br />
186 223<br />
223 0<br />
152 227<br />
230 3<br />
172 224<br />
263 39<br />
171 219<br />
238 19<br />
114 218<br />
266 48<br />
171 219<br />
260 41<br />
169 227<br />
287 60<br />
208 229<br />
229 0<br />
204 230<br />
256 26<br />
203 228<br />
233 5<br />
131 252<br />
268 16<br />
205 228<br />
262 34<br />
200 232<br />
283 51<br />
233 269<br />
269 0<br />
229 264<br />
240 -24<br />
153 268<br />
267 -1<br />
229 264<br />
275 11<br />
227 271<br />
284 13<br />
231 240<br />
240 0<br />
152 245 153 267<br />
267 22 267 0<br />
231 240 152 267 233 273<br />
275 35 288 21 275 0<br />
225 243 152 268 225 278 229 284<br />
279 36 262 -6 279 1 284 0<br />
OTCM<br />
CLIP<br />
HPAC<br />
ToTL<br />
CLIM<br />
XmP<br />
160 342<br />
342 0<br />
157 342<br />
337 -5<br />
158 341<br />
331 -lo<br />
93 374<br />
418 44<br />
159 343<br />
377 34<br />
154 344<br />
419 75<br />
190 3s0<br />
350 0<br />
188 352<br />
337 -15<br />
118 348<br />
406 58<br />
188 352<br />
370 18<br />
185 353<br />
424 71<br />
190<br />
338<br />
118<br />
406<br />
190<br />
370<br />
185<br />
427<br />
338<br />
0<br />
359 118 406<br />
47 406 0<br />
338 118 406 191 372<br />
32 401 -5 372 0<br />
343 117 407 185 373 187 42S<br />
84 405 -2 427 54 425 0<br />
Jllc - JZWC romaut au- OIn-lky rzrlpiml cyalanOmO&l<br />
cL2r- clintOlOgg/ru8iBtuia =X - mlf -ist~ UxlClimmto.logy<br />
=- - Amlog aal - Chtology<br />
Xlm - ~latica<br />
4<br />
189
Intentionally left blank.<br />
190
6. TROPICAL CYCLONE W~G VERIFICATION STATISTICS<br />
6.1 GENERAL<br />
Due to the rapid growth of microcomputers<br />
in the meteorological community and<br />
to save publishing costs, tropical cyclone track<br />
data (with best track, initial warning, 24-, 48-<br />
and 72-hour <strong>JTWC</strong> forecasts) and fix data<br />
(satellite, aircraft, radar and synoptic) are now<br />
available separately upon request. The data will<br />
be in ASCII format on 5.25 inch “floppy” or 3.5<br />
inch diskettes and will fill two diskettes (or one<br />
high density diskette). These data include the<br />
western North Pacific Ocean (1 January - 31<br />
December 199 1) on one and North Indian<br />
Ocean (1 January -31 December 1991), and<br />
South Western Pacii3c and South Indian Oceans<br />
(1 July 1990-30 June 1991) on the other.<br />
Agencies or individuals desiring these data sets<br />
should send the appmpnate number of diskettes<br />
to NAVOCEANCOMCEN/ <strong>JTWC</strong> Guam with<br />
their request. When the request and your<br />
diskettes are received, the data will be copied<br />
onto your diskettes and returned with an<br />
explanation of the data formats.<br />
6.2 WARNING VERIFICATION<br />
STATISTICS<br />
a. WESTERN NORTH PACIFIC<br />
This section includes verification<br />
statistics for each warning in the western North<br />
Pacific during 1991.<br />
<strong>JTWC</strong> FORBCMT TRACK AND INTBNSITY ERRORS BY WARNING<br />
TROPICAL STORM SBARON (OIW)<br />
WRN BEST TRACx POSITIONERRORS X-TRKX A-TRACX<br />
m n X&r IIQtKiIIXNRfu a 422A & 2 al a x<br />
91030518 1 5.9N 149.3E 25 8 16 -lo -14<br />
91030606 2 6.2N 147.9E 30 18 25 51 100 -17 30 30 19 42 95<br />
91030612 3 6.4N 147.3E 30 13 34 80 89 25 54 54 24 60 71<br />
91030618 4 6.5N 146.6E 30 8 66 91 80 67 78 44 7 48 68<br />
91030700 5 6.6N 146.OE 30 30 104 134 106 104 114 74 13 71 77<br />
91030706 6 6.6N 145.3E 35 12 46 68 38 36 42 12 30 54 36<br />
91030712 7 6.5N 144.6E 35 53 109 139 143 54 72 0 95 119 -143<br />
91030718 8 6.3N 144.lE 40 55 119 154 168 96 110 117 71 108 122<br />
91030800 9 6.lN 143.5E 45 35 113 167 185 -6 30 81 -113 -164 -167<br />
91030806 10 6.lN 142.9E 45 41 107 144 203 6 66 119 -107 -128 -165<br />
91030812 11 6.lN 142.2E 50 8 33 16 53 24 15 13 -24 -8 -52<br />
91030818 12 6.lN 141.5E 50 16 32 0 69 32 0 -13 -7 0 -68<br />
91030900 13 6.lN 140.8E 55 8 26 25 85 15 -12 -23 -22 -23 -82<br />
91030906 14 6.lN 140.OE 55 5 17 29 97 6 -11 2 -17 -28 -98<br />
91030912 15 6.lN 139.OE 55 5 55 89 131 -51 -89 -96 22 9 -90<br />
91030918 16 6.2N 138.3E 60 13 72 102 174 -67 -101 -105 28 -17 -140<br />
91031000 17 6.3N 137.6E 60 43 97 109 196 -81 -109 -147 55 0 -131<br />
91031006 18 6.6N 136.8E 55 72 110 108 212 -91 -104 -141 62 -28 -159<br />
91031012 19 6.8N 136.lE 55 50 49 138 219 -44 -16 -66 -23 -137 -209<br />
91031018 20 7.lN 135.3E 50 42 81 159 248 -37 12 -79 -72 -159 -236<br />
91031100 21 7.3N 134.5E 45 29 197 371 512 9 84 3 -197 -362 -512<br />
91031106 22 7.6N 133.4E 40 60 204 337 468 25 33 -186 -203 -336 -430<br />
91031112 23 7.9N 132.3E 40 90 229 312 474 35 37 -142 -227 -310 -453<br />
91031118 24 8.lN 131.lE 40 86 207 278 468 64 23 -148 -197 -277 -445<br />
91031200 25 8.3N 130.OE 35 21 13 40 205 -8 -27 43 -11 -30 -201<br />
91031206 26 8.6N 128.7E 35 36 51 30 171 -45 -30 59 23 -6 -161<br />
91031212 27 9.ON 127.4E 35 30 71 46 182 -66 -32 89 28 -33 -159<br />
191<br />
WIND ERRORS<br />
QQZ!14Q22<br />
00<br />
-5 -5 -5 -5<br />
0 0 -5 -5<br />
0 -5 -5 -lo<br />
0 -lo -lo -lo<br />
0 -5 -lo -5<br />
0 -lo -lo -5<br />
0 -10 -10 10<br />
-5 0 5 30<br />
0 0 10 35<br />
0 5 15 35<br />
0 -5 15 35<br />
0 0 25 40<br />
0 5 30 40<br />
0 10 30 40<br />
0 25 45 60<br />
5 30 50 55<br />
10 35 55 50<br />
5 20 20 20<br />
10 20 20 25<br />
55 0 10<br />
0005<br />
0005<br />
0055<br />
0 10 20 25<br />
0 15 20 25<br />
0 15 20 25
TROPICAL STORM SHARON (OIU) (CONTINUED)<br />
WRN BEST TRACK POSITIONERRORS<br />
IzrG m<br />
91031218 28<br />
Lu XQNGI!UNQ<br />
9.5N 126.4E 35<br />
!X’!Z9. *ZZ<br />
91031300 29 10.1N 125.5E 35<br />
91031306 30<br />
91031312 31<br />
91031318 32<br />
91031400 33<br />
10.6N124.5E 30<br />
11.lN123.5E 30<br />
11.5N122.5E 25<br />
11.9N121.5E 25<br />
36 68 71 184<br />
17 21 229<br />
11 54 256<br />
25 78 235<br />
88 85 226<br />
24<br />
X-TRACK<br />
244.812<br />
-55 -3 79<br />
18 70<br />
43 138<br />
79 184<br />
79 145<br />
A-TRACK<br />
2A4QL!2<br />
41 -71 -167<br />
-12 -219<br />
–35 -217<br />
7 -146<br />
-35 -175<br />
WINO ERRORS<br />
QQatilz<br />
O 20 25 30<br />
0 10 15<br />
0 5 15<br />
0 5 15<br />
5 5 15<br />
Average<br />
# Cases<br />
33 81 136 195<br />
33 32 31 27<br />
43 60 72<br />
32 31 27<br />
5-1 109 175<br />
32 31 27<br />
2 9 17 24<br />
33 32 31 27<br />
TYPHOON TIM<br />
WRN<br />
rzEML<br />
91032100 1<br />
91032106 2<br />
91032112 3<br />
91032118 4<br />
91032200 5<br />
91032206 6<br />
91032212 7<br />
91032218 8<br />
91032300 9<br />
91032306 10<br />
91032312 11<br />
91032318 12<br />
91032400 13<br />
91032406 14<br />
9103241.215<br />
91032418<br />
91032500<br />
91032506<br />
91032512<br />
91032518<br />
16<br />
17<br />
18<br />
19<br />
20<br />
(02W)<br />
BEST TRACK<br />
JUCZQNGMIN12<br />
6.6N 156.6E 30<br />
7.lN 155.8E 30<br />
7.8N155.lE 35<br />
8.7N 154.5E 35<br />
9.m 154.OE 40<br />
lo.m 153.5E<br />
11.6N 153.OE<br />
12.6N 152.7E<br />
13.6N 152.5E<br />
14.7N 152.4E<br />
15.7N 152.6E<br />
16.6N 152.9E<br />
17.4N 153.4E<br />
18.lN 154.OE<br />
18.8N 154.8E<br />
19.5N 155.6E<br />
20.ON 156.4E<br />
20.4N 156.9E<br />
20.8N 157.4E<br />
21.2N 157.7E<br />
40<br />
45<br />
50<br />
60<br />
65<br />
65<br />
70<br />
65<br />
65<br />
65<br />
60<br />
55<br />
50<br />
45<br />
40<br />
POSITIONERRORS x-ma A-TRACK<br />
QQ<br />
21<br />
Z4uzia<br />
71 251 538<br />
m z 2 &a<br />
-69 -177 -172 -20 -179 -511<br />
5 117 318 626 -111 –230 -154 -39 -221 -607<br />
18 151 380 716 -141 -282 -179 -55 -256 -694<br />
38 185 448 787 -118 -221 -249 -144 -390 -748<br />
13 124 354 581 -105 -145 -178 -66 -324 -554<br />
18 69 253 389 -70 -133 -288 0 -215 -262<br />
24 160 338 418 -82 -87 -241 -138 -328 -343<br />
13 175 356 402 -81 -146 -402 -155 -325 21<br />
23 126 315 -99 -195 -79 -248<br />
26 143 303 -68 -205 -126 -224<br />
8 136 230 -120 -224 -67 -56<br />
6 127 211 -116 -109 -53 181<br />
8 82 -79 24<br />
8 99 -91 41<br />
38 228 71 217<br />
79 320 292 131<br />
36<br />
23<br />
5<br />
8<br />
WINO ERRORS<br />
!aQuM12<br />
o 0 -lo -5<br />
0 5 -lo 0<br />
-5 0 -lo 0<br />
0 0 -lo 10<br />
-5 -5 0 20<br />
-5 -15 -5 0<br />
-5 -15 -5 5<br />
0 -5 0 5<br />
0 5 10<br />
-5 5 10<br />
0 0 10<br />
005<br />
05<br />
05<br />
0 10<br />
0 10<br />
0<br />
0<br />
0<br />
-5<br />
Average<br />
+ Cases<br />
21 145 313 557 107 179 232 84 245 467<br />
20 16 12 8 16 12 8 16 12 8<br />
TROPICAL STORM VANESSA (03W)<br />
WRN REST TRACK POSITIONERRORS x-ma A-TRACK<br />
QXML XIUXQNGMINR QQz!ia lzixa 2224<br />
91042312 1 8.2N >30.2E 25 5 53 74 68 18 -11 -1 -50<br />
*.Z2<br />
-73 -69<br />
91042318 2 8.5N 128.9E 30 13 24 84 114 0 -37 -32 -24 -76 -110<br />
91042400 3 8.m 127.7E 30 11 84 150 164 75 98 71 -38 -114 -148<br />
91042406 4 8.9N 126.5E 30 8 119 156 138 99 93 54 -67 -126 -128<br />
91042412 5 9.2N 125.2E 30 13 84 105 121 -28 -14 29 -80 -105 -118<br />
91042418 6 9.5N 123.9E 30 21 63 95 127 -37 -19 58 -51 -93 -114<br />
91042500 7 10.ON 122.7E 25 6 13 42 138 -3 -11 -70 -13 -41 -120<br />
91042506 8 10.5N 121.4E 25 0 13 66 193 9 25 -4 -lo -62 -193<br />
91042512 9 11.ON 120.2E 30 16 58 71 179 59 72 -69 -4 0 -165<br />
91042518 10 11.3N 119.OE 30 29 90 73 136 89 69 -61 -19 24 -122<br />
91042600 11 11.6N 117.8E 35 29 42 141 -2 -104 43 -96<br />
91042606 12<br />
91042612 13<br />
11.9N 116.6E 40<br />
12.3N 115.4E 40<br />
13<br />
11<br />
48<br />
37<br />
245<br />
247<br />
-34<br />
1<br />
-46<br />
-85<br />
-34 -241<br />
-38 -233<br />
91042618 14 12.m 114.2E 45 5 72 363 -41 -189 -60 -311<br />
91042700 15 13.lN 113.OE 45 11 141<br />
-99<br />
-102<br />
91042706 16 13.m 112.OE 45 17 186<br />
-96<br />
-160<br />
192<br />
2576<br />
20 16 12 8<br />
WIND ERRORS<br />
QQafilz<br />
5 5105<br />
0 5105<br />
01055<br />
01005<br />
01050<br />
01055<br />
00 0 10<br />
0 -5 0 15<br />
0 0 10 15<br />
5 -5 0 5<br />
0 -5 5<br />
-5 -5 10<br />
0 15 30<br />
0 20 -5<br />
0 15<br />
0 15
TROPI(2AZiSTORM VANESSA<br />
WRN<br />
IEGM2A<br />
91042712 17<br />
91042718 18<br />
91042800 19<br />
91042806 20<br />
BEST TRACK<br />
LMILNGWIN12<br />
14.5N 111.2E 40<br />
15.5N 11O.8E 35<br />
16.6N 11O.8E 30<br />
17.8N 11O.9E 25<br />
(03W) (CONTINUED)<br />
POSITIONERRORS<br />
QQz9. *zza4zz<br />
18 257 -109<br />
5 101 -32<br />
22<br />
8<br />
X-TRACK<br />
A-TRACX<br />
Z4mi%i<br />
-233<br />
-96<br />
WIND ERRORS<br />
9Q2.4!M22<br />
o 10<br />
05<br />
0<br />
0<br />
Avexage<br />
# Cases<br />
13 83 136 138 46 62 44<br />
20 18 14 10 18 14 10<br />
62 113 128<br />
18 14 10<br />
1877<br />
20 18 14 10<br />
SUPER TYPH( )ON WALT (04W)<br />
WAN BEST TmCK<br />
rm3NSL<br />
91050618 1<br />
XMXQM2HINQ<br />
7.9N 150.4E 30<br />
91050700 2 8.2N 150.lE 35<br />
91050706 3 8.5N 149.7E 35<br />
91050712 4 8.8N 149.3E 35<br />
91050718 5 9.lN 148.8E 40<br />
91050800 6 9.3N 148.3E 45<br />
91050806 7 9.6N 147.7E 50<br />
91050812 8 9.9N 147.lE 55<br />
91050818 9 10.2N 146.4E 60<br />
91050900 10<br />
91050906 11<br />
91050912 12<br />
91050918 13<br />
91051000 14<br />
91051006 15<br />
91051012 16<br />
91051018 17<br />
91051100 18<br />
91051106 19<br />
91051112 20<br />
91051118 21<br />
91051200 22<br />
91051206 23<br />
91051212 24<br />
91051218 25<br />
91051300 26<br />
91051306 27<br />
91051312 28<br />
91051318 29<br />
91051400 30<br />
91051406 31<br />
91051412 32<br />
91051418 33<br />
91051500 34<br />
91051506 35<br />
91051512 36<br />
91051518 37<br />
91051600 38<br />
91051606 39<br />
91051612 40<br />
10.5N 145.7E 70<br />
10.8N 145.OE 90<br />
11.lN 144.lE100<br />
11.5N 143.lE105<br />
11.8N 142.OE110<br />
12.lN 140.9E115<br />
12.4N 139.7E115<br />
12.7N 138.5E115<br />
13.ON 137.lE115<br />
13.3N 135.6E120<br />
13.7N 134.lE125<br />
14.lN 132.8E130<br />
14.4N 131.6E135<br />
14.8N 130.6E140<br />
15.2N 129.6E140<br />
15.6N 128.6E135<br />
16.ON 127.8E130<br />
16.3N 127.lE125<br />
16.7N 126.5E125<br />
17.lN 125.9E120<br />
17.6N 125.4E115<br />
18.2N 125.lE110<br />
19.ON 124.8E105<br />
19.7N 124.7E100<br />
20.4N 124.7E 95<br />
21.2N 125.lE 95<br />
22.2N 125.9E 90<br />
23.3N 127.OE 80<br />
24.3N 128.6E 75<br />
25.3N 130.9E 70<br />
26.6N 133.7E 60<br />
POSITIONERRORS<br />
QQzlau<br />
36 64 114 189<br />
24 80 147 214<br />
18 21 97 199<br />
24 24 68 165<br />
6 58 143 27’8<br />
30 100 183 292<br />
21 30 85 181<br />
13 33 123 256<br />
11 47 158 309<br />
13 72 175 286<br />
13 99 221 286<br />
18 93 204 273<br />
11 89 240 316<br />
5 106 265 382<br />
13 130 250 344<br />
0 103 221 315<br />
5 88 203 298<br />
5 73 148 223<br />
13 45 120 163<br />
8 37 98 117<br />
8 75 139 186<br />
5 37 126 150<br />
13 81 126 116<br />
13 26 103 182<br />
8 48 90 165<br />
8 48 134 186<br />
6 78 227 264<br />
6 26 56 211<br />
0 28 62<br />
18 49 142<br />
12 45 150<br />
5 49 173<br />
5 42<br />
8 100<br />
8 109<br />
8 129<br />
16<br />
17<br />
17<br />
0<br />
X–TRACK<br />
244fii!2<br />
64 111 175<br />
78 133 173<br />
21 86 129<br />
19 52 65<br />
43 67 117<br />
46 73 79<br />
30 45 55<br />
30 42 67<br />
20 40 84<br />
36 36 74<br />
32 46 84<br />
29 74 135<br />
39 106 173<br />
77 184 320<br />
50 150 274<br />
56 139 267<br />
39 126 256<br />
46 131 222<br />
41 118 138<br />
38 97 67<br />
38 104 -11<br />
7 56 5<br />
56 52 -80<br />
26 71 -13<br />
36 34 -63<br />
20 61 -132<br />
40 -2 -234<br />
19 -21 -195<br />
-23 -59<br />
-39 -62<br />
-41 -107<br />
-39 -153<br />
-41<br />
-98<br />
-105<br />
-96<br />
A-TRACK<br />
2.4&i!2<br />
11 -29 -71<br />
-20 -64 -127<br />
-2 -46 -152<br />
16 -45 -153<br />
-39 -126 -253<br />
-89 -168 -282<br />
7 –73 -173<br />
-15 -116 -248<br />
-43 -153 -298<br />
-63 -172 –276<br />
-95 -217 -274<br />
-89 -191 -238<br />
-80 -216 -265<br />
-73 -192 -210<br />
-121 -200 -209<br />
-87 -173 -168<br />
-79 -159 -154<br />
-58 -70 29<br />
-21 -23 87<br />
3 19 97<br />
66 93 186<br />
37 114 150<br />
59 115 84<br />
4 76 182<br />
32 84 154<br />
44 120 132<br />
68 227 125<br />
18 53 82<br />
-18 -20<br />
-30 -128<br />
-19 -106<br />
31 83<br />
8<br />
-24<br />
-30<br />
88<br />
WIND ERR-<br />
QQiualz<br />
00 -5 -35<br />
0 0 -lo -35<br />
0 -5 -30 -40<br />
0 -lo -40 -40<br />
0 -10 -40 -40<br />
0 -lo -35 -20<br />
0 -25 -35 -2o<br />
0 -30 -30 -25<br />
0 -25 -15 -35<br />
0 -20 -15 -35<br />
-lo -5 -lo -40<br />
05 -5 -35<br />
-5 0 -25 -40<br />
0 -.5-35 -40<br />
0 -lo -45 -40<br />
10 15 -15 -lo<br />
5 -20 -40 -40<br />
0 -30 -40 -40<br />
-5 -35 -35 -35<br />
0 -15 -lo -5<br />
-5 -lo -lo -5<br />
-5 0 0 5<br />
-5 0 5 5<br />
-5 0 -5 -lo<br />
0 -5 -5 -5<br />
0 -5 -5 -5<br />
0 -5 -lo -5<br />
0 -5 -lo -lo<br />
0 -5 -5<br />
-5 -lo -5<br />
0 -lo -5<br />
0 -lo -5<br />
0 -5<br />
0 -lo<br />
0 -lo<br />
00<br />
0<br />
0<br />
0<br />
0<br />
Average<br />
# Cases<br />
12 66 150 234 42 81 128<br />
40 36 32 28 36 32 28<br />
45 114 168<br />
36 32 28<br />
2 10 18 25<br />
40 36 32 28<br />
193
TYPHWN YUNYA (O5W)<br />
WRN BEST TRACK POSITIONERRORS<br />
m KL. IIBz X&w H12iQ Q!2ZA3.QU<br />
91061300 1 13.3N 125.62 55 5 54 117 82<br />
91061306 2 13.5N 125.2E 65 23 78 142 46<br />
91061312 3 13.7N 124.9E 75 8 29 124 300<br />
91061318 4 13.9N 124.6E 85 11 57 160 345<br />
91061400 5 14.2N 124.2E 95 17 93 186 354<br />
91061406 6 14.5N 123.6E105 18 106 238<br />
91061412 7 14.8N 123.OE 95 8 59 247<br />
91061418 8 15.ON 122.3E 85 23 101 294<br />
91061500 9 15.4N 121.7E 65 18 174 386<br />
91061506 10 15.8N 120.8E 45 33 223<br />
91061512 11 16.7N 120.2E 40 62 216<br />
91061518 12 17.7N 120.OE 35 88 233<br />
91061600 13 18.8N 119.9E 30 23 29<br />
91061606 14 20.lN 120.2E 30 12<br />
91061612 15 21.lN 120.6E 30 6<br />
91061700 16 22.6N 121.5E 20 5<br />
X-TRACX A-TRACK<br />
Z4%22Z4U22<br />
44 117 79 32 7 24<br />
72 140 45 31 -26 -11<br />
-13 60 100 -27 -109 -283<br />
1 93 103 -57 -132 -330<br />
40 81 112 -84 -168 -336<br />
25 113 -104 -210<br />
17 17 -57 -247<br />
46 46 -90 -291<br />
-46 -8 -168 -387<br />
8 -223<br />
34 -213<br />
30 -232<br />
-1 29<br />
WIND ERRORS<br />
SQ2.4AQX<br />
-lo -30 15 35<br />
-15 -35 35 35<br />
-10 -25 35 10<br />
-15 -15 40 15<br />
0 50 70 55<br />
5 85 70<br />
5 40 35<br />
5 40 35<br />
0 15 25<br />
05<br />
0 -5<br />
05<br />
05<br />
0<br />
0<br />
10<br />
Average<br />
# Cases<br />
23 112 210 225<br />
16 13 9 5<br />
29 75 87 103 175 196<br />
13 9 5 13 9 5<br />
4 27 40 30<br />
16 13 9 5<br />
TYPHOON ZEKE (06w)<br />
WRN BEST ‘IRA(X<br />
rmz NsrL. Xlw U2NGMINR<br />
91070912 1 12.lN 124.6E 25<br />
91070918 2 12.9N 123.6E 25<br />
91071000 3 13.6N 122.3E 30<br />
91071006 4 14.lN 120.9E 30<br />
91071012 5 14.5N 119.4E 35<br />
91071018 6 14.8N 118.lE 35<br />
91071100 7 15.ON 116.9E 40<br />
91071106 8 15.3N 115.9E 45<br />
91071112 9 15.6N 114.9E 50<br />
91071118 10 16.ON 114.OE 55<br />
91071200 11 16.5N 113.2E 60<br />
91071206 12 17.2N 112.5E 65<br />
91071212 13 17.8N 111.7E 70<br />
91071218 14 18.4N 11O.8E 80<br />
91071300 15 19.ON 109.8E 70<br />
91071306 16 19.7N 108.9E 65<br />
91071312 17 20.3N 107.9E 65<br />
91071318 18 21.lN 106.7E 60<br />
91071400 19 21.5N lt15.8E45<br />
91071406 20 22.ON 104.9E 35<br />
91071412 21 22.4N 103.8E 25<br />
POSITIONERRORS<br />
QQam’n<br />
50 183 277 307<br />
37 143 190 184<br />
40 182 214 261<br />
29 122 120 141<br />
18 108 94 119<br />
29 91 80 137<br />
41 86 164 318<br />
16 49 148 351<br />
6 30 179 404<br />
0 49 246<br />
8 85 280<br />
0 108 317<br />
24 162 405<br />
24 165<br />
16 95<br />
30 75<br />
45 184<br />
72<br />
55<br />
39<br />
62<br />
X-TRACK A-TRACX<br />
24% Z22!L4QZ2<br />
-26 33 103 -182 -276 -290<br />
-5 91 78 -144 -167 -167<br />
113 198 191 -143 -82 -178<br />
85 119 118 -88 -14 -79<br />
107 89 103 21 31 -61<br />
87 80 101 27 -1 -94<br />
43 53 79 -71 -156 -308<br />
-3 39 100 -50 -143 -337<br />
-21 60 82 -23 -170 -396<br />
11 98 -48 -226<br />
42 113 -74 -257<br />
81 165 -72 -271<br />
121 246 -109 -322<br />
133 -98<br />
34 -90<br />
2 -76<br />
108 -151<br />
WINO ERRORS<br />
LQ2A *22<br />
o -5 -15 -30<br />
0 -5 -20 -40<br />
0 -10 -20 -25<br />
0 -lo -20 -20<br />
0 -5 -20 -20<br />
0 -lo -30 -20<br />
0 -10 -10 25<br />
0 -lo 0 35<br />
0 -lo 0 25<br />
0 -15 0<br />
0 -5 5<br />
0 -lo 5<br />
-5 -lo 0<br />
-5 -15<br />
50<br />
-5 5<br />
0 15<br />
5<br />
5<br />
5<br />
5<br />
Average<br />
# Cases<br />
30 113 209 247<br />
21 17 13 9<br />
60 106 106 86 162 212<br />
17 13 9 17 13 9<br />
2 9 11 27<br />
21 17 13 9<br />
TYPHOON AMY (07W)<br />
WRN BEST TRACK<br />
m m<br />
91071518 1<br />
Xu IQKMIND<br />
14.6N 134.5E 30<br />
910716Q0 2 15.4N 133.7E 35<br />
91071606 3 16.2N 132.9E 40<br />
91071612 4 16.9N 131.9E 45<br />
91071618 5 17.3N 130.7E 55<br />
POSITIONERRORS<br />
QQ2U4U12Z<br />
97 196 210 294<br />
55 126 156 283<br />
18 110 159 285<br />
11 96 135 264<br />
0 37 58 190<br />
X-TRACK A-TRKX<br />
2!LflQ 1224*22<br />
-196 -192 -201 -13 -86 -215<br />
-123 -134 -155 -29 -80 -237<br />
81 105 21 -75 -120 -285<br />
79 68 -13 -54 -117 -264<br />
38 0 10 2 -59 -190<br />
WIND ERRORS<br />
QQZ4MZ<br />
-5 -20 -35 -60<br />
-5 -20 -50 -60<br />
-5 -15 -50 -25<br />
0 -10 -35 25<br />
0 -15 -25 50
TYPHOON AMY (07W) (CONTIMJED)<br />
WRN BEST TRAcK POSITIONERRORS<br />
J21E ML X&L lmGJ!lulR Q!2i21*u<br />
91071700 6 17.6N 129.6E 60 8 12 127 230<br />
91071706 7 17.9N 128.5E 65 6 24 146 176<br />
91071712 8 18.3N 127.4E 75 0 53 188<br />
91071718 9 18.7N 126.3E 90 8 102 213<br />
91071800 10 19.3N 125.lE105 18 131 171<br />
91071806 11 19.8N 123.8E115 17 143 191<br />
91071812 12 20.5N 122.4E125 12 105<br />
91071818 13 21.4N 120.8E125 37 128<br />
91071900 14 22.3N 119.OE120 6 71<br />
91071906 15 23.ON 117.4E105 13 77<br />
91071912 16 23.6N 116.OE 75 5<br />
91071918 17 24.lN 114.8E 45 28<br />
91072000 18 24.6N 113.6E 35 0<br />
X-TRACK A–TRACK<br />
244L12224*2Z<br />
10 -18 -31 -8 -126 -228<br />
-10 -49 -24 -23 -138 -174<br />
-9 -31 -53 -186<br />
-18 -33 -101 -211<br />
6 27 -131 -169<br />
-28 36 -141 -188<br />
10 -105<br />
-13 -128<br />
55 -47<br />
21 -74<br />
WIND ERRORS<br />
QQaszz<br />
O -20 -25 50<br />
0 -25 -10 55<br />
-5 -30 25<br />
-lo -5 85<br />
-lo -5 85<br />
5 25 55<br />
0 55<br />
0 60<br />
-5 20<br />
-5 30<br />
15<br />
20<br />
10<br />
Average<br />
# Cases<br />
19 94 159 246<br />
18 15 11 7<br />
46 63 65 65 134 227<br />
15 11 7 15 11 7<br />
6 24 44 46<br />
18 15 11 7<br />
TYPHOON BRENDAN (08w)<br />
WRN BEST TRACX<br />
RT2 m<br />
91072100 1<br />
Ilu ZQMUM2<br />
14.6N 125.8E 35<br />
91072106 2 15.lN 125.lE 40<br />
91072112 3 15.6N 124.3E 50<br />
91072118 4 16.lN 123.6E 55<br />
91072200 5 16.7N 122.8E 65<br />
91072206 6 17.6N 122.OE 70<br />
91072212 7 18.6N 121.lE 55<br />
91072218 8 19.4N 119.9E 55<br />
91072300 9 20.lN 118.4E 60<br />
91072306 10 20.6N 116.7E 60<br />
91072312 11 21.lN 115.2E 65<br />
91072318 12 21.6N 114.2E 65<br />
91072400 13 22.ON 113.2E 65<br />
91072406 14 22.3N 112.2E 55<br />
91072412 15 22.6N 111.4E 40<br />
91072418 16 23.ON 11O.6E 30<br />
POSITIONERRORS<br />
S!!2Z.4 .%2<br />
42 86 145 201<br />
23 46 123 161<br />
0 102 213 225<br />
8 78 143 125<br />
13 98 104 77<br />
21 119 101 95<br />
11 115 104<br />
16 106 94<br />
41 115 116<br />
67 111 152<br />
20 156<br />
24 58<br />
6 33<br />
0 24<br />
16<br />
12<br />
X-TRACK A-TRACX<br />
244..Q<br />
55 -16<br />
22z49.LLlz<br />
116 -67 -145 -165<br />
0 -59 40 -46 -108 -157<br />
-71 -53 14 -73 -207 -225<br />
-73 -33 32 -30 -140 -121<br />
-71 -22 22 -69 -102 -74<br />
-46 -18 50 -110 -100 -81<br />
-26 12 -112 -104<br />
17 55 -106 -77<br />
8 58 -115 -102<br />
46 69 -101 -135<br />
-37<br />
-42<br />
-6<br />
24<br />
152<br />
40<br />
33<br />
6<br />
WIND ERRORS<br />
QQz14fi2z<br />
-5 -15 -5 15 .<br />
0 -lo 5 25<br />
0 -5 0 40<br />
0 -5 0 45<br />
0 -10 10 25<br />
-5 -5 15 20<br />
10 10 45<br />
5 10 45<br />
0 5 25<br />
5 5 25<br />
0 10<br />
0 15<br />
05<br />
0 10<br />
5<br />
5<br />
Average<br />
# Cases<br />
20 89 130 147<br />
16 14 10 6<br />
37 39<br />
14 10<br />
45 75 122 137<br />
6 14 10 6<br />
3 9 18 28<br />
16 14 10 6<br />
TYPHOON CAITLIN (09W)<br />
WRN BEST TRACK POSITIONERRORS X-TRACK A-TRACK<br />
m NQL XA’1 K MSHXNDQQM4.QZ2<br />
221 U229QZZ<br />
91072312 1 14.ON 132.9E 30 21 34 233 380 -35 -233 -356 0 1 -136<br />
91072318 2 14.2N 131.9E 35 13 128 268 404 -121 -268 -306 -41 -18 -265<br />
91072400 3 14.4N 131.OE 40 34 205 259 309 -196 -250 -246 -64 -70 -189<br />
91072406 4 14.8N 130.3E 45 46 227 283 341 -226 -263 -246 25 -105 -237<br />
91072412 5 15.5N 130.2E 45 21 122 214 293 -110 -153 -194 -54 -151 -220<br />
91072418 6 16.4N 130.2E 45 36 139 219 292 -63 -39 -193 -125 -216 -220<br />
91072500 7 17.5N 130.2E 55 12 123 144 111 108 141 111 -60 31 7<br />
91072506 8 18.5N 129.8E 60 18 116 133 115 111 118 115 -38 61 7<br />
91072512 9 19.4N 129.lE 65 18 37 58 61 37 21 -57 4 54 24<br />
91072518 10 20.3N 128.4E 65 18 57 127 271 -50 -118 -175 -30 -47 -207<br />
91072600 11 21.3N 127.8E 70 6 56 70 143 -16 -69 -70 54 18 -126<br />
91072606 12 22.2N 127.4E 75 16 63 73 173 -22 -73 -26 60 -6 -172<br />
91072612 13 23.lN 127.OE 80 12 32 66 107 -21 -62 -12 24 -24 -107<br />
WIND ERRORS<br />
QQiMB12<br />
-5 -5 0 0<br />
-lo 0 5 -5<br />
-5 -10 0 -5<br />
-5 -lo -5 -5<br />
0 -lo -lo -5<br />
0 -lo -15 -lo<br />
0 10 10 0<br />
-5 5 10 -5<br />
05 5 -lo<br />
0 -5 -lo -lo<br />
0 -5 -5 -lo<br />
-5 -5 -5 0<br />
-5 0 0 10
TYPHOON C!AITLIN (O9W) (CONTINUED)<br />
WRN BEST TRACK POSITIONERRORS x-ma A-TRACK<br />
Q7ENSL XAT. UNGJ2UNQ QQ iuflkizz %x z m x<br />
91072618 14 23.8N 126.7E 85 13 27 71 137 -27 -32 -17 6 -64 -136<br />
91072700 15 24.4N 126.6E 90 17 67 97 194 -64 -29 -30 -24 -93 -192<br />
91072706 16 25.2N 126.5E 90 26 91 139 -48 7 -78 -139<br />
91072712 17<br />
91072718 18<br />
91072800 19<br />
91072806 20<br />
91072812 21<br />
91072818 22<br />
91072900 23<br />
91072906 24<br />
91072912 25<br />
91072918 26<br />
91073000 27<br />
26.lN 126.6E 90<br />
27.lN 126.7E 95<br />
28.2N 126.9E 95<br />
29.4N 127.lE 95<br />
30.5N 127.2E 90<br />
31.7N 127.5E 90<br />
33.ON 128.lE 85<br />
34.3N 129.lE 75<br />
35.8N 130.5E 65<br />
37.4N 132.OE 65<br />
39.lN 133.4E 65<br />
0<br />
16<br />
13<br />
6<br />
13<br />
0<br />
42<br />
25<br />
7<br />
17<br />
12<br />
36<br />
31<br />
30<br />
30<br />
59<br />
114<br />
214<br />
82<br />
76<br />
88<br />
50<br />
31<br />
27<br />
-27<br />
-54<br />
-73<br />
-139<br />
-5<br />
-73<br />
-36<br />
2<br />
13<br />
-14<br />
-25<br />
-87<br />
-163<br />
-82<br />
-77<br />
-50<br />
WIND ERRORS<br />
QQZ43Q32<br />
o -5 -5 5<br />
0 -lo -lo -5<br />
0 -20 -15<br />
0 -20 -15<br />
-5 -25 -20<br />
-5 -20 -20<br />
0 -lo<br />
0 -lo<br />
-10 -20<br />
-15 -25<br />
-lo<br />
5<br />
0<br />
-lo<br />
Average<br />
# Cases<br />
18 89 142 222 70 102 143 44 68 149<br />
27 23 19 15 23 19 15 23 19 15<br />
TROPICAL STORM ENRIQUE (06E) (NOTE:ONLY ~WARNINGS AREVERIPIEO.)<br />
WRN BEST TRACK POSITIONERRORS X-TRACK A-TRACK<br />
m NQL Jizu Jtm$2J!um QQ a fizz a z a & z<br />
91080100 1 30.6N 175.4E 35 24 264 28 -263<br />
91080106 2 32.lN 173.4E 35 18<br />
91080112 3 34.2N 172.4E 30 5<br />
41196<br />
27 23 19 15<br />
WIND ERR(RS<br />
QQ24flQ22<br />
o 20<br />
0<br />
0<br />
Average<br />
# Cases<br />
16 264 28 263<br />
31 1 1<br />
0 20<br />
31<br />
TROPICAL STORM DOUG (1OW)<br />
m BEST TRACK<br />
Im NQA<br />
91080812 1<br />
Zliz I&Kkulm<br />
26.9N 161.5E 25<br />
91080900 2 28.lN 159.6E 30<br />
91080912 3 29.8N 158.3E 35<br />
91080918 4 30.9N 157.4E 35<br />
91081000 5 32.3N 156.5E 35<br />
91081006 6 33.9N 156.4E 35<br />
91081012 7 35.6N 156.8E 30<br />
91081018 8 37.4N 158.OE 30<br />
91081100 9 39.3N 159.6E 30<br />
POSITIONERRORS<br />
QQz!i&lz<br />
22 91<br />
37 198<br />
39 185<br />
58 207<br />
17 200<br />
23<br />
7<br />
25<br />
4<br />
x-mm<br />
A-TRACK<br />
2A4Qlz24Aa12<br />
10 -91<br />
-83 -180<br />
61 -176<br />
17 -207<br />
-81 -184<br />
WIND ERRCRS<br />
QQzulz<br />
o -5<br />
-5 -lo<br />
0 25<br />
0 15<br />
00<br />
0<br />
0<br />
0<br />
0<br />
Average<br />
# Cases<br />
26 176<br />
95<br />
50 167<br />
5 5<br />
0 11<br />
95<br />
TYPHOON ELLIE (llW)<br />
WRN BEST TRACK<br />
J21Xi n IIRz u2N!2mlQ<br />
91081018 1 23.9N 157.lE 40<br />
91081100 2 24.2N 156.3E 45<br />
91081106 3 24.5N 155.4E 45<br />
91081112 4 24.8N 154.2E 45<br />
91081118 5 25.2N 152.8E 50<br />
91081200 6 25.8N 151.3E 50<br />
91081206 7 26.3N 149.9E 50<br />
91081212 8 26.8N 148.4E 50<br />
91081218 9 27.lN 147.OE 50<br />
POSITIONERRORS<br />
QQU*2Z<br />
30 97 206 534<br />
29 55 261 606<br />
13 51 293 661<br />
27 97 118 97<br />
50 24 67 162<br />
27 88 141 205<br />
30 119 218 251<br />
20 99 202 314<br />
24 76 135 189<br />
196<br />
X-TRACX A-TRACX<br />
2441 Z24AQ22<br />
96 166 312 18 -123 -435<br />
55 206 373 -7 -161 -479<br />
35 203 420 -38 -212 -513<br />
-51 -74 -5 -83 -92 -97<br />
-21 38 132 12 –56 -95<br />
-40 -1 82 -80 -141 -189<br />
49 107 164 -108 -191 -191<br />
48 138 204 -87 -148 -239<br />
68 135 176 35 11 -71<br />
WIND ERRORS<br />
QQUMU<br />
-lo -15 -lo -30<br />
-5 0 -5 -25<br />
0 10 5 -20<br />
51050<br />
0 10 0 -5<br />
05-50<br />
-5 0 -lo 10<br />
-5 -5 -lo 15<br />
-5 -20 -25 0
TYPHOON ELLIE (llW) (CONTINU32))<br />
WRN BEST TRAcK POSITIONERRORS<br />
Q3GML xmxQNGkutiQ Q!2aflQ2z<br />
91081300 10 27.3N 145.5E 55 44 81 113 114<br />
91081306 11<br />
91081312 12<br />
91081318 13<br />
91081400 14<br />
91081406 15<br />
91081412 16<br />
91081418 17<br />
91081500 18<br />
91081506 19<br />
91081512 20<br />
91081518 21<br />
91081600 22<br />
91081606 23<br />
91081612 24<br />
91081618 25<br />
91081700 26<br />
91081706 27<br />
91081712 28<br />
91081718 29<br />
91081800 30<br />
91081806 31<br />
91081812 32<br />
91081818 33<br />
91081900 34<br />
27.3N 144.2E 60<br />
27.2N 142.9E 65<br />
27.ON 141.7E 70<br />
26.8N 140.6E 75<br />
26.6N 139.4E 80<br />
26.4N 138.2E 80<br />
26.2N 136.9E 85<br />
26.lN 135.4E 85<br />
25.9N 133.9E 80<br />
25.8N 132.2E 75<br />
25.7N 130.7E 70<br />
25.6N 129.lE 70<br />
25.4N 127.7E 65<br />
25.2N 126.5E 60<br />
25.ON 125.4E 60<br />
24.9N 124.3E 55<br />
24.9N 123.4E 55<br />
25.ON 122.6E 50<br />
25.lN 121.8E 50<br />
25.lN 121.OE 40<br />
25.ON 120.2E 35<br />
24.7N 119.5E 30<br />
24.2N 119.lE 30<br />
23.8N 118.8E 25<br />
0<br />
20<br />
24<br />
5<br />
10<br />
16<br />
20<br />
29<br />
32<br />
55<br />
29<br />
8<br />
16<br />
5<br />
27<br />
17<br />
16<br />
55<br />
12<br />
5<br />
5<br />
20<br />
54<br />
12<br />
24<br />
80<br />
81<br />
32<br />
76<br />
99<br />
72<br />
129<br />
143<br />
126<br />
108<br />
68<br />
104<br />
27<br />
109<br />
94<br />
52<br />
54<br />
76<br />
118<br />
81<br />
149<br />
176<br />
118<br />
155<br />
165<br />
154<br />
194<br />
181<br />
140<br />
153<br />
137<br />
222<br />
93<br />
193<br />
172<br />
220<br />
236<br />
157<br />
181<br />
188<br />
180<br />
181<br />
173<br />
150<br />
164<br />
204<br />
X-TRACK A-TRACX<br />
244Z22244E22<br />
74 96 112 34 61 -21<br />
23 61 84 -10 -55 -150<br />
73 108 111 -35 -103 -190<br />
66 99 114 -48 -146 -207<br />
3 26 109 -33 -116 -113<br />
23 55 151 -73 -146 -102<br />
18 37 140 -98 -161 -126<br />
13 58 144 -71 -143 -110<br />
-5 35 23 -130 -191 -180<br />
6 74 27 -144 -166 -171<br />
19 72 -29 -125 -121 -148<br />
67 29 164 86 151 7<br />
45 32 190 52 134 -74<br />
8 50 105 217<br />
-4 67 27 65<br />
-26 177 106 79<br />
-13 93<br />
-7 52<br />
-3 -4<br />
25 -48<br />
55 -54<br />
98 -67<br />
WIND ERRXtS<br />
QQaau<br />
-lo -lo 0 20<br />
-5 -5 10 30<br />
-5 0 25 50<br />
-5 -5 30 50<br />
0 10 35 55<br />
0 20 45 55<br />
0 15 40 50<br />
-lo 0 5 10<br />
-15 0 20 35<br />
-15 5 20 40<br />
-10 15 25 35<br />
-5 10 10 0<br />
-5 15 15 5<br />
5 15 10<br />
0 20 10<br />
-5 0 10<br />
-5 0<br />
0 10<br />
0 10<br />
0 10<br />
10 15<br />
10 5<br />
15<br />
5<br />
5<br />
Average<br />
# Cases<br />
22 80 163 243<br />
34 31 25 22<br />
36 85 148 63 127 177<br />
31 25 22 31 25 22<br />
5 9 11 25<br />
34 31 25 22<br />
TYPHOON FRElD (12W)<br />
WRN BEST ‘lRACK<br />
IzlEliQ&<br />
91081112 1<br />
uQJdQKJ!mu2<br />
16.5N 123.7E 25<br />
91081118 2 17.ON 123.2E 25<br />
91081200 3 17.3N 122.9E 25<br />
91081206 4 17.7N 122.7E 25<br />
91081212 5 18.lN 122.OE 25<br />
91081218 6 18.4N 121.2E 25<br />
91081300 7 18.6N 120.4E 30<br />
91081306 8 18.7N 119.6E 30<br />
91081312 9 18.8N 119.OE 35<br />
91081318 10<br />
91081400 11<br />
91081406 12<br />
91081412 13<br />
91081418 14<br />
91081500 15<br />
91081506 16<br />
91081512 17<br />
91081518 18<br />
91081600 19<br />
91081606 20<br />
91081612 21<br />
91081618 22<br />
91081700 23<br />
91081706 24<br />
18.9N 118.4E 45<br />
19.lN 117.7E 50<br />
19.5N 117.lE 5!5<br />
19.9N 116.4E 60<br />
20.ON 115.6E 65<br />
20.lN 114.7E 70<br />
20.3N 113.8E 75<br />
20.5N 112.7E 80<br />
20.4N 111.5E 90<br />
20.2N 11O.3E 95<br />
19.9N 109.2E 95<br />
19.4N 108.6E 90<br />
18.9N 107.9E 85<br />
18.5N 107.4E 80<br />
18.2N 106.7E 75<br />
POSITIONERRORS<br />
QQaBlz<br />
23 69 159 212<br />
5 18 47 49<br />
18 36 66 84<br />
37 61 82 127<br />
23 131 125 129<br />
40 79 62 64<br />
25 6 36 41<br />
16 21 68 74<br />
12 60 85 53<br />
8 72 113 69<br />
68 56 103<br />
11 16 94 153<br />
5 53 179 260<br />
5 76 181 288<br />
8 57 137 273<br />
5 75 121<br />
11 77 147<br />
25 102 152<br />
5 120 166<br />
18 135<br />
26 122<br />
12 45<br />
20 71<br />
6<br />
x-mm<br />
A-TRACK<br />
24s22 24s32<br />
3 17 51 -70 -159 -206<br />
15 45 34 11 -15 -36<br />
35 55 74 11 37 43<br />
61 49 73 -2 67 105<br />
41 66 75 -125 -107 -106<br />
20 0 8 -77 -62 -64<br />
5 -36 -35 3 2 -22<br />
-8 -60 -69 -20 -33 -28<br />
-57 -80 -53 -18 -32 -7<br />
-72 -112 -68 -7 -15 11<br />
-5 -17 15 -6 -54 -102<br />
4 -15 93 -16 -94 -123<br />
47 61 217 -26 -169 -143<br />
12 26 171 -76 -179 -233<br />
1 67 146 -58 -120 -232<br />
-18 79 -73 -93<br />
37 131 -68 -69<br />
76 143 -68 -52<br />
120 131 12 -103<br />
135<br />
122<br />
24<br />
-38<br />
12<br />
-9<br />
-39<br />
-60<br />
WINO ERRORS<br />
QQz!iulz<br />
o 30 30 20<br />
0 20 15 15<br />
0 15 10 10<br />
0 10 10 -5<br />
0 -5 0 -lo<br />
0 -15 -5 -20<br />
-5 -15 -lo -35<br />
0 -lo -10 -40<br />
0 10 10 -25<br />
05 0 -lo<br />
00 -5 -15<br />
-5 -5 -5 -lo<br />
0 5 -15 -lo<br />
0 -5 -lo 30<br />
-5 -lo -5 20<br />
055<br />
0 -lo -10<br />
0 -lo 5<br />
5155<br />
0 -15<br />
0 -25<br />
5 -5<br />
05<br />
5<br />
197
TYPHOON FRED (12W) (CONTImmD)<br />
WRN BEST TRACK POSITIONERRORS X-TRACK A-TRACX<br />
Im3 mIuxQNEmNDQQz4, AB Zaazzalz<br />
91081712 25 17.9N 105.7E 55 23<br />
91081718 26 17.7N 104.2E 35 8<br />
91081800 27 17.4N 103.OE 25 36<br />
Average 16 66 109 132 41 62 78 37 76 97<br />
# Cases 27 23 19 15 23 19 15 23 19 15<br />
TROPICAL DEPRESSION 13W<br />
WRN BEST TRACT( POSITIONERRORS X-TRACK A-TRACX<br />
M& m x UlK2k.u.mm 24& Z a 43 2 M % 22<br />
91081212 1 22.9N 155.8E 25 23 259 -141 -218<br />
91081218 2 24.lN 154.3E 25 26 234 -119 -202<br />
91081300 3 25.5N 152.7E 25 56<br />
91081306 4 27.2N 150.8E 25 44<br />
91081318 5 29.2N 145.6E 25 5<br />
Average 31 246 130 210<br />
# Cases 5 2 2 2<br />
TYPHOON GLADYS (14W)<br />
WRN BEST TRACX POSITIONERRORS X-TRACK A-TRACX<br />
R.z!3 n<br />
91081600 1<br />
m Xm31uNRu!<br />
22.3N 147.3E 25 0<br />
afuix<br />
58 86 94<br />
24<br />
-21<br />
m<br />
44<br />
E<br />
85<br />
a<br />
-54<br />
alz<br />
-75 -41<br />
91081606 2 22.9N 146.2E 30 30 51 103 144 42 94 126 -30 -44 -71<br />
91081612 3 23.5N 145.lE 30 89 86 140 300 86 113 294 7 83 59<br />
91081618 4 24.2N 144.IE 35 113 162 180 296 124 166 296 -105 -70 -24<br />
91081700 5 25.lN 143.2E 40 21 64 194 288 -24 36 140 60 191 252<br />
91081706 6 25.8N 142.3E 45 20 24 150 265 20 72 170 15 132 204<br />
91081712 7 26.2N 141.3E 45 43 109 174 252 8 35 48 109 171 248<br />
91081718 8 26.5N 140.2E 50 55 189 299 308 5 38 40 189 298 306<br />
91081800 9 26.8N 139.3E 50 24 107 197 271 4 26 100 108 196 252<br />
91081806 10 27.lN 138.5E 50 18 68 143 212 -33 -3 -191 60 144 93<br />
91081812 11 27.4N 137.8E 55 36 68 90 141 -45 -33 -141 52 85 8<br />
91081818 12 27.6N 137.lE 55 22 37 66 114 37 60 -77 -5 30 85<br />
91081900 13 27.7N 136.3E 55 41 60 78 101 58 73 -82 15 29 61<br />
91081906 14 27.8N 135.5E 55 46 113 137 159 38 -103 -153 107 91 44<br />
91081912 15 27.9N 134.8E 55 20 59 91 147 31 –78 -148 51 49 -4<br />
91081918 16 28.ON 134.lE 55 59 121 173 181 0 -159 -167 121 68 70<br />
91082000 17 28.lN 133.4E 55 15 21 84 97 6 -83 -98 -20 -17 0<br />
91082006 18 28.2N 132.7E 60 15 51 87 54 -37 -87 -48 36 7 -25<br />
91082012 19 28.3N 131.9E 60 15 26 101 134 -26 -57 -76 -6 -84 -110<br />
91082018 20 28.5N 131.2E 60 21 93 202 123 -84 -192 -123 -41 -62 -9<br />
91082100 21 28.7N 130.4E 60 13 102 177 143 -94 -165 -86 -41 -66 -115<br />
91082106 22 29.ON 130.OE 65 12 126 185 225 -83 -186 -63 -95 -5 -217<br />
91082112 23 29.4N 129.8E 65 18 132 162 -57 -120 -120 -66<br />
91082118 24 29.9N 129.6E 60 36 126 161 -99 -123 -79 -105<br />
91082200 25 30.5N 129.4E 55 36 84 115 -82 -44 -23 -106<br />
91082206 26 31.2N 129.3E 50 35 72 167 -63 6 -37 -168<br />
91082212 27 32.ON 129.2E 45 11 84 -3 -85<br />
91082218 28 32.9N 128.9E 45 31 65 9 -64<br />
91082300 29 33.8N 128.4E 40 11 153 105 -113<br />
91082306 30 34.4N 127.6E 40 46 219 168 -140<br />
91082312 31 34.7N 126.5E 35 12<br />
Average 31 91 144 184 49 85 125 66 93 104<br />
# Cases 31 30 26 22 30 26 22 30 26 22<br />
198<br />
WIND ERRORS<br />
QQ24*2Z<br />
20<br />
15<br />
5<br />
3 11 9 18<br />
27 23 19 15<br />
WIND ERRORS<br />
QQz$lfilz<br />
o 10<br />
0 10<br />
0<br />
0<br />
0<br />
0 10<br />
52<br />
WIND ERRORS<br />
Q.QZ4.4Q22<br />
o 5 10 20<br />
0 0 10 20<br />
0 10 35 65<br />
0 10 40 70<br />
0 15 45 55<br />
-5 15 45 50<br />
5 15 45 50<br />
0 20 45 50<br />
5 20 45 50<br />
10 20 40 45<br />
5 15 25 25<br />
5 15 25 30<br />
0 20 25 30<br />
0 10 20 35<br />
0 10 15 30<br />
0 10 15 20<br />
0 15 20 30<br />
0 10 25 30<br />
0 10 30 35<br />
0 10 25 35<br />
0 15 30 40<br />
0 25 35 45<br />
0 30 40<br />
5 30 45<br />
5 25 30<br />
5 15 25<br />
5 10<br />
05<br />
55<br />
05<br />
-5<br />
2 14 30 39<br />
31 30 26 22
TROPICAL DEPRESSION 15W<br />
wm BEST TRACK<br />
LUG ML<br />
91082606 1<br />
Lu U2NGkmuz<br />
27.4N 137.OE 30<br />
91082618 2 27.9N 135.3E 30<br />
91082700 3 28.ON 134.5E 30<br />
91082706 4 28.2N 133.5E 30<br />
91082712 5 28.7N 132.7E 30<br />
91082718 6 29.3N 131.8E 30<br />
91082800 7 30.ON 130.7E 30<br />
91082806 8 30.7N 129.6E 30<br />
91082812 9 31.6N 128.9E 30<br />
91082818 10 32.5N 128.6E 30<br />
91082900 11 33.5N 128.7E 25<br />
POSITIONERRORS<br />
fQ<br />
16<br />
24<br />
53<br />
fix<br />
81 159<br />
17 59 186<br />
12 92 310<br />
36 175 404<br />
5 79<br />
5 35<br />
6 72<br />
12 73<br />
5<br />
15<br />
X-TRACK<br />
214.B<br />
i4<br />
-88<br />
-9 -lo<br />
-57 8<br />
-54 77<br />
-15<br />
-35<br />
-31<br />
-44<br />
A–TRACK<br />
2224*22<br />
-51<br />
-132<br />
-59 -186<br />
-73 -310<br />
-167 –397<br />
-78<br />
0<br />
-66<br />
-59<br />
WIND ERRORS<br />
!uZu!.lz<br />
00<br />
-5 0<br />
0 0 10<br />
0 0 15<br />
0 5 20<br />
0 10<br />
0 20<br />
0 20<br />
0 15<br />
0<br />
0<br />
Average<br />
# Cases<br />
19 88 300<br />
11 9 3<br />
38 31<br />
93<br />
76 297<br />
93<br />
0 8 15<br />
11 9 3<br />
TROPICAL STORM HARRY (16w)<br />
WRN BEST TRACK<br />
m ML<br />
91082906 1<br />
JxJc xQtiGmu2<br />
26.ON 133.5E 25<br />
91082912 2 27.lN 133.8E 25<br />
91082918 3 28.3N 134.3E 30<br />
91083000 4 29.7N 134.9E 35<br />
91083006 5 31.2N 135.7E 40<br />
91083012 6 32.9N 136.7E 40<br />
91083018 7 34.7N 138.lE 40<br />
91083100 8 36.5N 140.OE 40<br />
91083106 9 38.4N 142.6E 40<br />
91083112 10 40.2N 146.2E 40<br />
POSITIONERRORS<br />
QQz!lalz<br />
34 104 359<br />
42 163 468<br />
12 104<br />
5 117<br />
31 228<br />
7 152<br />
25<br />
26<br />
42<br />
29<br />
X-TRACK A-TRACK<br />
Umzafilz<br />
-74 23 -73 -359<br />
-99 37 -130 -467<br />
-12 -104<br />
15 -117<br />
37 -226<br />
–7 -152<br />
WIND ERRORS<br />
JQMMZ<br />
o -5 5<br />
505<br />
00<br />
-5 0<br />
-5 0<br />
-5 0<br />
5<br />
5<br />
0<br />
0<br />
Average<br />
# Cases<br />
25 145 413 40 30 133 413<br />
10 6 2 62 62<br />
315<br />
10 6 2<br />
TYPHOON IVY (17W)<br />
WRN BEST TRACK<br />
ML Lu JLt&HIM2<br />
91090212 1 8.4N 154.5E 30<br />
91090218 2 9.ON 154.OE 30<br />
91090300 3 9.5N 153.4E 35<br />
91090306 4 9.9N 152.7E 35<br />
91090312 5 10.4N 151.9E 40<br />
91090318 6 10.9N 150.9E 40<br />
91090400 7 11.4N 149.9E 45<br />
91090406 8 12.lN 149.OE 45<br />
91090412 9 13.ON 148.6E 50<br />
91090418 10 13.9N 148.2E 55<br />
91090500 11 15.ON 147.9E 65<br />
91090506 12 16.lN 147.5E 65<br />
91090512 13 17.5N 147.OE 70<br />
91090518 14 19.lN 146.2E 75<br />
91090600 15 20.6N 145.2E 85<br />
91090606 16 22.ON 144.OE 90<br />
91090612 17 23.lN 142.4E 95<br />
91090618 18 24.3N 141.lE100<br />
91090700 19 25.3N 139.9E110<br />
91090706 20 26.3N 139.OE115<br />
91090712 21 27.3N 138.3E115<br />
POSITIONERRORS X-TRACK A-TRACK<br />
Qi!a ai!zaa 2 a 9.S 2<br />
41 156 216 400 -99 -216 -388 121 3 -loo<br />
51 116 217 436 -91 -213 -417 73 -44 -128<br />
25 17 157 390 -16 -110 -308 -8 -112 -241<br />
12 24 209 502 17 -170 -440 -17 -121 -242<br />
13 61 257 533 6 -168 -454 -61 -195 -280<br />
21 85 345 594 -47 -264 -453 -72 -224 -386<br />
5 175 425 602 -152 -380 -511 -88 -191 -320<br />
18 225 463 590 -204 -428 -427 -95 -179 -409<br />
36 258 490 654 -200 -418 -371 -164 -258 -541<br />
56 306 462 542 -231 -330 -245 -201 -324 -485<br />
36 153 273 294 -55 -43 104 -144 -270 -275<br />
42 209 343 338 -71 42 120 -197 -340 -317<br />
17 155 239 230 -19 34 180 -154 -237 -144<br />
32 150 171 126 18 12 58 -150 -171 -113<br />
28 136 113 60 51 105 -50 -127 -41 -33<br />
22 73 179 277 74 76 -183 -5 163 209<br />
17 113 174 288 -11 -105 -288 113 139 4<br />
8 87 155 318 -12 -136 -307 87 76 -83<br />
8 42 174 261 -42 -154 -259 6 82 35<br />
0 47 172 -47 -172 6 14<br />
8 70 221 -69 -206 18 -81<br />
199<br />
WIND ERRORS<br />
!2Q24mlz<br />
-5 -5 10 20<br />
0 5 15 25<br />
0 5 10 15<br />
0 10 10 15<br />
0 10 10 15<br />
0 10 10 20<br />
00 5 10<br />
0 -5 -5 0<br />
0 -lo -lo 0<br />
0 -5 -5 5<br />
0 0 -10 -5<br />
5 -5 -25 -15<br />
0 -10 -25 -10<br />
-5 -20 -30 -15<br />
-5 -20 -15 -5<br />
-10 -25 -15 -10<br />
0 -lo 0 -lo<br />
-5 -lo -15 -15<br />
-5 5 -5 -lo<br />
0100<br />
050
TYPHOON - (17W) (CONTINUED)<br />
WRN BEsT TRACK POSITIONERRORS X-TRIKX A-TRACK<br />
12TElKL LUKNG3UD QQi M&xaazz 24f&lu<br />
91090718 22 28.2N 137.6E115 7 112 275 -105 -224 -39 -161<br />
91090800 23 29.2N 137.5E110 12 128 261 -127 -250 -18 -74<br />
91090806 24<br />
91090812 25<br />
91090818 26<br />
91090900 27<br />
91090906 28<br />
91090912 29<br />
91090918 30<br />
91091000 31<br />
91091006 32<br />
30.2N 137.6E105<br />
31.lN 138.2E105<br />
32.ON 139.IE105<br />
32.9N 140.6E 95<br />
33.7N 142.5E 80<br />
34.6N 145.2E 70<br />
35.6N 148.4E 65<br />
36.9N 151.9E 60<br />
38.4N 155.4E 55<br />
13<br />
6<br />
0<br />
11<br />
5<br />
9<br />
12<br />
7<br />
6<br />
141<br />
115<br />
179<br />
112<br />
44<br />
274 -131 -251<br />
-91<br />
-120<br />
-1oo<br />
-42<br />
-53 -111<br />
-70<br />
-134<br />
-50<br />
-13<br />
Average<br />
# Cases<br />
18 125 261 391 80 187 292 81 150 228<br />
32 28 24 19 28 24 19 28 24 19<br />
WmD ERRORS<br />
QQ2A4Q2Z<br />
o -5 -5<br />
0 -5 -lo<br />
05-5<br />
0 15<br />
0 15<br />
5 -5<br />
00<br />
5<br />
10<br />
5<br />
5<br />
2 8 10 12<br />
32 28 24 19<br />
TROPIU STORM JOEL (18w)<br />
WRN BEST TRACK<br />
RxG t!u LAz IQNGnmQ<br />
91090318 1 19.4N 117.9E 30<br />
91090400 2 19.6N 117.lE 30<br />
91090406 3 19.8N 116.3E 30<br />
91090412 4 20.ON 115.7E 30<br />
91090418 5 20.lN 115.lE 30<br />
91090500 6 20.3N 114.8E 35<br />
91090506 7 20.3N 114.8E 35<br />
91090512 8 20.5N 114.8E 40<br />
91090518 9 20.9N 115.2E 40<br />
91090600 10 21.4N 115.4E 45<br />
91090606 11 22.ON 115.4E 50<br />
91090612 12 22.6N 115.3E 55<br />
91090618 13 23.lN 115.OE 40<br />
91090700 14 23.6N 114.7E 35<br />
91090706 15 24.5N 114.3E 30<br />
POSITIONERRORS X-TRACX A-TRACK<br />
M 24a12u s 22 2.4 Mlz<br />
16 64 55 212 -6 -26 -207 -64 -49 -45<br />
18 26 155 279 11 -146 -278 -24 -53 -30<br />
28 0 169 309 0 -152 -281 0 -77 -129<br />
8 101 298 439 -101 -280 -347 7 -104 -269<br />
17 196 341 -155 -336 -121 56<br />
57 173 289 -173 -277 20 82<br />
28 120 219 -101 -207 -65 -73<br />
21 143 313 -101 -151 -101 -275<br />
37 154 -120 -97<br />
8 10 -10 5<br />
18 76 35 -69<br />
11 131 55 -120<br />
5<br />
0<br />
17<br />
WIND ERRORS<br />
Ju2244Q12<br />
o 10 15 15<br />
0 5 10 30<br />
0 10 15 50<br />
55 0 35<br />
5 5 10<br />
5 0 -lo<br />
5 10 10<br />
0 -5 30<br />
0 10<br />
-5 5<br />
-5 10<br />
-5 5<br />
0<br />
5<br />
0<br />
Average<br />
# Cases<br />
19 100 230 310 72 196 278 57<br />
15 12 8 4 12 8 4 12<br />
96 118 3 7 13 33<br />
84 15 12 8 4<br />
TYPHOON KINNA (19W)<br />
WRN BEST TRACK<br />
m NQ&uil K!N!zmu2<br />
91091012 1 17.ON 139.lE 25<br />
91091018 2 18.2N r37.8E 30<br />
91091100 3 19.3N 136.OE 35<br />
91091106 4 20.3N 134.4E 40<br />
91091112 5 21.2N 132.8E 45<br />
91091118 6 22.lN 131.4E 50<br />
91091200 7 23.ON 130.2E 55<br />
91091206 8 23.9N 129.3E 65<br />
91091212 9 24.7N 128.4E 75<br />
91091218 10 25.6N 127.9E 85<br />
91091300 11 26.8N 127.8E 90<br />
91091306 12 28.3N 128.OE 90<br />
91091312 13 30.ON 128.5E 90<br />
91091318 14 31.9N 129.4E 85<br />
91091400 15 34.2N 131.3E 75<br />
91091406 16 36.lN 134.3E 65<br />
POSITIONERRORS<br />
QQaaz<br />
42 197 242 442<br />
13 173 142 419<br />
16 110 122 249<br />
12 96 181 508<br />
24 98 234 694<br />
23 26 188<br />
8 24 91<br />
8 24 194<br />
26 43 129<br />
0 138<br />
*5 120<br />
7 145<br />
10 135<br />
11<br />
23<br />
49<br />
200<br />
X-TRACK A-TRACK<br />
z!i4a122A4Rz2<br />
-44 -62 2 -192 -235 -442<br />
90 120 -48 -149 -77 -417<br />
9 76 72 -110 -96 -239<br />
-69 -41 77 -67 -177 -502<br />
-53 -56 129 -83 -228 -683<br />
11 -59 24 -179<br />
-5 29 24 -86<br />
-19 43 -15 -190<br />
21 -2 38 -130<br />
2 -138<br />
45 -112<br />
40 -140<br />
35 -131<br />
WINO ERRORS<br />
QQzlaz<br />
O -10 -30 -25<br />
-5 -15 -40--20<br />
-5 -10 -25 5<br />
-5 -15 -20 20<br />
0 -lo -5 40<br />
0 -10 0<br />
0 -lo -5<br />
0 -5 0<br />
0 -5 10<br />
05<br />
0 10<br />
0 10<br />
0 10<br />
5<br />
0<br />
0
TYPHOON KINNA (19F)(CONTINtJED)<br />
WRN BEST TRACK POSITIONERRORS<br />
a n Xlu XQIUJ.UQ QQ2!lflBu<br />
91091412 17 37.4N 138.4E 55 36<br />
Average<br />
# Cases<br />
18 102 169 462<br />
17 13 9 5<br />
X-TRACX A-TRACK<br />
2B Z 2.4 Bi!z<br />
34 54 65 94 155 456<br />
13 9 5 13 9 5<br />
WIND ERRORS<br />
LQZ!L4R2Z<br />
o<br />
1 10 15 22<br />
17 13 9 5<br />
TROPIU STORM LUKE (20W)<br />
WRN BFsT TRACK<br />
IYJs NQXUX6MGMXNQ<br />
91091418 1 16.8N 140.7E 30<br />
91091500 2 17.2N 139.5E 30<br />
91091506 3 17.7N 138.4E 35<br />
91091512 4 18.2N 137.2E 35<br />
91091518 5 18.8N 136.lE 40<br />
91091600 6 19.5N 134.9E 40<br />
91091606 7 20.4N 133.8E 45<br />
91091612 8 21.3N 132.5E 45<br />
91091618 9 22.4N 131.7E 45<br />
91091700 10<br />
91091706 11<br />
91091712 12<br />
91091718 13<br />
91091800 14<br />
91091806 15<br />
91091812 16<br />
91091818 17<br />
91091900 18<br />
91091906 19<br />
91091912 20<br />
23.3N 131.3E<br />
24.ON 131.2E<br />
24.6N 131.OE<br />
25.3N 130.8E<br />
26.ON 130.6E<br />
26.9N 130.7E<br />
27.3N 132.lE<br />
27.6N 134.lE<br />
28.5N 137.OE<br />
31.6N 139.OE<br />
35.3N 141.6E<br />
45 102<br />
50 196<br />
50 209<br />
50 231<br />
50 30<br />
50 30<br />
50 70<br />
45 155<br />
45 39<br />
45 31<br />
45 0<br />
POSITIONERRORS<br />
QQZ4*Z<br />
8 33 119 114<br />
74 118 135 222<br />
80 71 169 306<br />
38 101 126 327<br />
29 122 104 198<br />
34 98 121 293<br />
45 24 26 240<br />
40 52 66 234<br />
21 72 156<br />
286 590 -183 -267<br />
385 723 -43 -458<br />
349 860 166 -407<br />
392 102<br />
166 -152<br />
229 -206<br />
403 -236<br />
X-TRACK A-TRAcK<br />
asi!zaalz<br />
-1 29 -11 -34 -115 -114<br />
-76 -111 -207 92 -77 -81<br />
-31 -22 -34 -65 -168 -304<br />
32 -11 124 -97 -126 -303<br />
42 22 59 -115 -102 -189<br />
39 -22 -154 -90 -120 -250<br />
22 23 -225 12 13 -85<br />
38 -64 -128 36 14 -196<br />
-54 -144 48 -62<br />
-220 -527<br />
-384 -562<br />
-308 -761<br />
-380<br />
-67<br />
-103<br />
-327<br />
WIND ERRms<br />
QQz!lailz<br />
o 0 15 30<br />
0 10 25 35<br />
0 5 20 35<br />
0 5 20 35<br />
0 5 15 35<br />
0 5 15 35<br />
-5 0 15 35<br />
0 10 25 35<br />
0 15 35<br />
0 -5 10<br />
0 5 20<br />
0 10 30<br />
0 15<br />
-5 -lo<br />
-5 -lo<br />
-5 -lo<br />
0<br />
0<br />
0<br />
0<br />
Average 73<br />
# Cases 20<br />
181 266 242 88 131<br />
16 12 8 16 12<br />
117 148 220 190<br />
8 16 12 8<br />
1 8 20 34<br />
20 16 12 8<br />
SUPER TYPHOON MIREILLE (21W)<br />
WRN BEST TRACK<br />
E&la<br />
91091600 1<br />
mum2kuHQ<br />
14.4N 158.8E 45<br />
91091606 2 14.7N 157.6E 55<br />
91091612 3 15.ON 156.7E 65<br />
91091618 4 15.4N 155.9E 75<br />
91091700 5 15.7N 155.lE 75<br />
91091706 6 16.ON 154.3E 75<br />
91091712 7 16.lN 153.6E 70<br />
91091718 8 16.ON 152.9E 70<br />
91091800 9 15.8N 152.2E 70<br />
91091806 10<br />
91091812 11<br />
91091818 12<br />
91091900 13<br />
91091906 14<br />
91091912 15<br />
91091918 16<br />
91092000 17<br />
91092006 18<br />
91092012 19<br />
91092018 20<br />
91092100 21<br />
15.6N 151.6E 70<br />
15.5N 150.8E 75<br />
15.4N 149.9E 80<br />
15.3N 148.8E 80<br />
15.4N 147.5E 80<br />
15.5N 146.2E 80<br />
15.5N 144.7E 85<br />
15.4N 143.2E 85<br />
15.lN 141.9E 85<br />
14.9N 140.5E 85<br />
14.6N 139.3E 85<br />
14.5N 138.2E 90<br />
POSITIONERRORS<br />
QQu.az<br />
29 153 177 202<br />
18 63 143 126<br />
21 42 70 16<br />
8 18 18 87<br />
0 24 69 199<br />
29 143 223 343<br />
18 105 184 353<br />
12 84 236 412<br />
13 39 141 198<br />
5 69 174 232<br />
18 136 237 265<br />
18 160 258 283<br />
6 87 218 314<br />
0 68 314 461<br />
8 145 374 576<br />
6 192 408 574<br />
13 103 273 465<br />
11 85 242 391<br />
6 48 181 324<br />
11 71 207 386<br />
5 62 154 273<br />
201<br />
X-TRACK A-TRACK<br />
a 4 z= lQE<br />
-112 16 54 106 176 195<br />
-29 87 63 57 114 110<br />
-23 20 11 35 68 12<br />
-19 19 10 -1 4 -87<br />
21 65 38 -12 -25 -196<br />
139 219 303 34 49 -162<br />
105 183 289 17 -26 -204<br />
40 86 162 -74 -220 -379<br />
-19 -40 45 -34 -135 -194<br />
0 -23 108 -70 -173 -206<br />
-19 -25 179 -135 -237 -196<br />
-39 -11 221 -156 -258 -177<br />
2 168 312 -88 -141 36<br />
61 314 438 -31 -15 144<br />
138 374 507 -47 20 275<br />
186 378 440 -46 154 370<br />
101 257 385 -22 95 261<br />
75 170 233 41 173 316<br />
46 117 229 13 138 229<br />
14 111 350 70 176 163<br />
-50 -53 166 38 145 218<br />
WIND ERRORS<br />
MM*U<br />
-15 -25 -5 0<br />
-lo 0100<br />
-15 10 10 10<br />
-5 15 10 5<br />
0 15 10 5<br />
0 20 10 5<br />
0 10 10 5<br />
0555<br />
0 5 5 “o<br />
-5 5 5 -5<br />
0 10 5 -lo<br />
05 5 -20<br />
05 0 -25<br />
0 5 -lo -50<br />
0 -lo -35 -75<br />
-5 -15 -50 -70<br />
-5 -lo -35 -50<br />
0 -10 -35 -40<br />
5 -lo -40 -50<br />
0 -20 -40 -50<br />
0 -25 -25 -25
SUPER TYPHOON &UREILLE (21W) (CONTINUED)<br />
WRN BEST TRACK POSITIONERRORS<br />
LlEliik IJSZXQKHINQ sQz43.FL12<br />
91092106 22 14.5N 137.2E 95 8 45 110 260<br />
91092112 23<br />
91092118 24<br />
91092200 25<br />
91092206 26<br />
91092212 27<br />
91092218 28<br />
91092300 29<br />
91092306 30<br />
91092312 31<br />
91092318 32<br />
91092400 33<br />
91092406 34<br />
91092412 35<br />
91092418 36<br />
91092500 37<br />
91092506 38<br />
91092512 39<br />
91092518 40<br />
91092600 41<br />
91092606 42<br />
91092612 43<br />
91092618 44<br />
91092700 45<br />
91092706 46<br />
91092712 47<br />
91092718 48<br />
14.7N 136.2E100<br />
15.ON 135.3E110<br />
15.4N 134.5E115<br />
15.8N 133.8E125<br />
16.3N 133.lE130<br />
16.9N 132.5E130<br />
17J5N 131.9E130<br />
18.ON 131.4E130<br />
18.7N 130.9E130<br />
19.lN 130.2E130<br />
19.5N 129.6E130<br />
19.9N 129.2E130<br />
20.5N 128.8E130<br />
20.9N 128.2E125<br />
21.5N 127.6E125<br />
22.2N 127.lE120<br />
23.ON 126.7E115<br />
23.7N 126.lE115<br />
24.4N 125.8E115<br />
25.4N 125.7E115<br />
26.5N 125.9E115<br />
28.lN 126.4E110<br />
30.ON 127.6E100<br />
32.3N 129.2E 95<br />
35.3N 132.5E 85<br />
38.5N 137.OE 75<br />
0<br />
8<br />
8<br />
8<br />
5<br />
12<br />
20<br />
8<br />
17<br />
8<br />
0<br />
11<br />
6<br />
11<br />
5<br />
5<br />
12<br />
5<br />
6<br />
8<br />
6<br />
13<br />
0<br />
18<br />
11<br />
33<br />
11<br />
46<br />
40<br />
36<br />
23<br />
75<br />
103<br />
96<br />
77<br />
55<br />
17<br />
29<br />
92<br />
84<br />
40<br />
32<br />
81<br />
13<br />
173<br />
198<br />
281<br />
314<br />
34<br />
98<br />
102<br />
114<br />
114<br />
169<br />
208<br />
192<br />
166<br />
128<br />
48<br />
84<br />
220<br />
145<br />
42<br />
117<br />
160<br />
445<br />
186<br />
228<br />
236<br />
254<br />
240<br />
249<br />
263<br />
222<br />
245<br />
121<br />
69<br />
83<br />
139<br />
336<br />
X-TRACK A-TRACK<br />
24 SZ24S22<br />
-45 -47 147 -6 100 216<br />
-9 -25 111 -8 23 149<br />
-29 70 186 36 69 133<br />
-26 74 177 31 70 157<br />
-17 81 159 32 80 199<br />
-12 79 159 20 83 180<br />
68 168 229 -31 24 99<br />
100 192 148 25 81 218<br />
86 165 121 44 99 187<br />
67 134 125 39 99 211<br />
35 114 0 43 61 121<br />
-9 -5 -51 15 48 47<br />
-2 -5 -84 29 84 -8<br />
24 42 -118 90 216 -75<br />
52 -30 -134 66 142 -308<br />
27 -21 -30 36<br />
27 -27 -18 -114<br />
69 -7 42 -160<br />
00 -13 -446<br />
-51 -166<br />
-60 -190<br />
-3 -281<br />
-23 -314<br />
WINO ERRORS<br />
QQZA4Q2Z<br />
5 -25 -25 -25<br />
0 -30 -25 -25<br />
0 -lo -20 -20<br />
0 0 -5 -5<br />
50-50<br />
00-55<br />
0005<br />
0005<br />
0055<br />
-5 -lo 5 5<br />
-5 -5 5 10<br />
-5 -5 -5 0<br />
-5 0 -lo 0<br />
-5 5 -15 5<br />
0 5 -lo 15<br />
0 5 -lo<br />
0 -15 -15<br />
0 -15 -5<br />
0 -lo 5<br />
00<br />
00<br />
0 10<br />
0 10<br />
0<br />
0<br />
0<br />
0<br />
Average<br />
# Cases<br />
10 88 175 267<br />
48 44 40 36<br />
47 100 180 61 114 178<br />
44 40 36 44 40 36<br />
2 9 13 18<br />
48 44 40 36<br />
TYPHOON NAT<br />
WRN<br />
mm<br />
91091600 1<br />
91091606 2<br />
91091612 3<br />
91091618 4<br />
91091700 5<br />
91091706 6<br />
91091712 7<br />
91091718 8<br />
91091800 9<br />
91091806 10<br />
91091812 11<br />
91091818 12<br />
91091900 13<br />
91091906 14<br />
91091912 15<br />
91091918 16<br />
91092000 17<br />
91092006 18<br />
91092012 19<br />
91092018 20<br />
91092100 21<br />
91092106 22<br />
(22W)<br />
BEST TRACK<br />
IlixxQKkuEIR<br />
20.5N 121.3E 25<br />
20.6N 120.4E 30<br />
20.6N 119.6E 35<br />
20.5N 119.OE 40<br />
20.3N 118.6E 40<br />
20.ON 118.4E 40<br />
19.7N 118.5E 35<br />
19.5N 118.7E 35<br />
19.4N 119.lE 35<br />
19.5N 119.6E 40<br />
19.7N 120.lE 40<br />
19.9N 120.6E 40<br />
20.lN 121.2E 40<br />
20.3N 121.8E 35<br />
20.5N 122.5E 35<br />
20.7N 123.2E 35<br />
20.9N 123.8E 40<br />
21.ON 124.3E 45<br />
21.lN 124.7E 50<br />
21.2N 125.OE 55<br />
21.3N 125.3E 60<br />
21.4N 125.6E 70<br />
POSITIONERRORS<br />
!2Qfi&lz<br />
73 102<br />
52 98 127 153<br />
18 46 159 295<br />
57 154 299 480<br />
28 130 293 489<br />
38 134 254 371<br />
51 141 242 304<br />
68 158 261 304<br />
32 80 186 242<br />
40 122 221 267<br />
16 61 122 253<br />
17 45 119 296<br />
12 37 89 329<br />
69 180 312<br />
12 44 186<br />
30 29 147<br />
33 32 145<br />
32 69 256<br />
17 76 255<br />
24 60 233<br />
8 87 266<br />
8 121 296<br />
X–TRACK A–TRACK<br />
z49&lza<br />
82 62<br />
Bz2<br />
-50 -127 -70 -84 -10 -137<br />
39 -79 -56 -24 -138 -290<br />
146 -136 -106 -49 -267 -469<br />
-49 -112 -98 -121 -271 -480<br />
-82 -57 -25 -107 -248 -370<br />
-61 -21 -18 -127 -242 -304<br />
-51 -15 -27 -150 -261 -303<br />
-9 19 4 -80 -185 -242<br />
11 40 20 -122 -218 -266<br />
53 81 22 31 92 -252<br />
45 77 24 4 91 -295<br />
32 57 87 -20 69 -318<br />
585 -149<br />
469 -18<br />
461 -28<br />
362 -24<br />
479 6<br />
445 -lo<br />
377 30<br />
354 -8<br />
353 -27<br />
-168 397 102 264 -432<br />
105 180 41 -155 -433<br />
63 161 -7 -133 -433<br />
-38 82 21 -140 -353<br />
49 155 69 -252 -454<br />
-17 96 -76 -255 -435<br />
49 33 -53 -229 -376<br />
0 -111 -87 -267 -337<br />
31 -190 -119 -295 -298<br />
WINDERRORS<br />
Q!2244f!lz<br />
o -15<br />
0 -5 0 10<br />
05 0 10<br />
-5 5 0 10<br />
-5 5 0 5<br />
-5 0 5 0<br />
505-5<br />
00 5 -lo<br />
00 0 -20<br />
-5 0 -5 -30<br />
-5 5 -10 -45<br />
-5 5 -15 -55<br />
-5 5 -15 -60<br />
0 -5 -20 -45<br />
5 -lo -35 -50<br />
5 -15 -45 -45<br />
0 -15 -50 -40<br />
-5 -20 -50 –20<br />
-10 -35 -50 0<br />
-lo -45 –45 10<br />
-5 -30 -30 20<br />
-5 -15 10 50<br />
202
TxlltWN NAT (ZZW) (CONTINUED)<br />
WRN BEST TRACK<br />
IYE21KL<br />
91092112 23<br />
91092118 24<br />
91092200 25<br />
91092206 26<br />
91092212 27<br />
91092218 28<br />
91092300 29<br />
91092306 30<br />
91092312 31<br />
91092318 32<br />
91092400 33<br />
91092406 34<br />
91092412 35<br />
91092418 36<br />
91092500 37<br />
91092506 38<br />
91092512 39<br />
91092518 40<br />
91092600 41<br />
91092612 42<br />
91092700 43<br />
91092712 44<br />
91092800 45<br />
91092806 46<br />
91092812 47<br />
91092818 48<br />
91092900 49<br />
91092906 50<br />
91092912 51<br />
91092918 52<br />
91093000 53<br />
91093006 54<br />
91093012 55<br />
91093018 56<br />
91100100 57<br />
91100106 58<br />
91100112 59<br />
91100118 60<br />
91100200 61<br />
XUKKIXND<br />
21.5N 125.2E 85<br />
21.5N 124.7E 95<br />
21.6N 124.lE105<br />
21.7N 123.5E110<br />
21.8N 122.6E110<br />
21.9N 121.6E105<br />
22.lN 120.7E105<br />
22.3N 120.OE 90<br />
22.5N 119.5E 70<br />
22.6N 119.OE 60<br />
22.6N 118.6E 55<br />
22.5N 118.lE 50<br />
22.ON 117.6E 45<br />
20.9N 117.lE 45<br />
19.9N 116.8E 45<br />
19.2N 116.6E 45<br />
18.8N 116.4E 40<br />
18.2N 116.lE 40<br />
17.6N 116.OE 35<br />
16.3N 116.2E 30<br />
15.7N 117.OE 30<br />
15.9N 117.5E 30<br />
16.3N 117.5E 35<br />
16.4N 117.3E 40<br />
16.5N 116.9E 40<br />
16.6N 116.6E 45<br />
16.9N 116.5E 50<br />
17.2N 116.5E 50<br />
17.5N 116.5E 55<br />
18.2N 116.6E 55<br />
18.9N 117.OE 55<br />
19.6N 117.3E 60<br />
20.4N 117.5E 60<br />
21.3N 117.7E 60<br />
22.lN 117.6E 60<br />
22.8N 117.5E 65<br />
23.6N 117.3E 65<br />
24.2N 117.OE 50<br />
25.ON 116.7E 35<br />
POSITIONERRORS<br />
QQz!lslz<br />
17 176 362 463<br />
6 61 95 98<br />
0 80 141 253<br />
12 62 129 253<br />
8 83 154 253<br />
16 49 121 255<br />
0 53 147 278<br />
8 45 235 358<br />
26 126 306 433<br />
6 94 261 394<br />
12 159 378 605<br />
8 189 420 588<br />
8 122 311 403<br />
24 72 228 287<br />
23 164 241 240<br />
18 140 175 188<br />
18 142 125 178<br />
37 46 60 88<br />
94 136<br />
34 49<br />
16 36<br />
49 40<br />
46 30 122 283<br />
8 34 106 259<br />
31 67 132 241<br />
42 92 233 337<br />
43 139 294 405<br />
49 160 275 363<br />
31 161 293<br />
17 118 172<br />
22 58 151<br />
20 122 173<br />
24 89<br />
26 141<br />
13 118<br />
8 131<br />
26<br />
20<br />
12<br />
X-TRKX A-TRACK<br />
2!i41i!2244&22<br />
-15 64 -435 -176 -357 -160<br />
-25 -32 69 -92 -93 -96<br />
-16 -77 -241 -79 -119 -81<br />
12 -77 -206 -61 -104 -146<br />
-9 -150 -219 -83 -39 -129<br />
-32 -82 -168 -37 -89 -194<br />
-43 -112 -173 -31 -97 -218<br />
11 -105 -139 -44 -211 -331<br />
-29 -104 -77 -124 -289 -426<br />
-34 -162 -390 -88 -206 -56<br />
-111 -284 -555 -115 -251 242<br />
-123 -295 409 -145 -299 424<br />
22 -118 201 -120 -289 350<br />
-11 -212 146 -72 -85 247<br />
-148 -230 182 -73 74 158<br />
-102 68 114 -97 162 151<br />
-132 97 107 -55 78 -143<br />
30 -58 80 -35 18 36<br />
-22 135<br />
12 48<br />
35 12<br />
-4 40<br />
6 8 -131 -30 -123 -251<br />
34 -57 -125 6 -90 -227<br />
63 6 -28 -24 -132 -240<br />
23 -51 -152 -90 -228 -301<br />
16 -86 -195 -139 -282 -356<br />
-57 -80 -316 -150 -264 -180<br />
-108 -130 -119 -263<br />
-118 -172 -11 -13<br />
-50 -130 -30 -78<br />
-121 -170 19 36<br />
82 36<br />
140 -17<br />
-9 -118<br />
-61 -117<br />
WIND ERRW<br />
QQ249.QU<br />
O -5 40 65<br />
-5 0 50 65<br />
-15 0 55 65<br />
0 10 50 55<br />
0 35 55 55<br />
5 15 30 45<br />
10 45 50 50<br />
10 35 35 40<br />
5555<br />
10 5 5 5<br />
-5 -5 0 0<br />
0 -5 0 0<br />
0 -5 0 0<br />
0 -5 0 0<br />
-lo -5 0 -5<br />
-lo -5 0 -lo<br />
-5 5105<br />
-5 5100<br />
-5 0<br />
00<br />
0 -5<br />
0 -lo<br />
0 -15 -15 -15<br />
-5 -5 -lo -5<br />
0055<br />
-5 0 0 15<br />
05 5 40<br />
00 0 50<br />
000<br />
5 10 20<br />
5 10 20<br />
0 0 15<br />
0 -5<br />
05<br />
0 35<br />
0 45<br />
0<br />
5<br />
0<br />
Average<br />
# Cases<br />
26 96 210 337<br />
61 58 49 45<br />
49 92 150 72 172 275<br />
58 49 45 58 49 45<br />
4 10 18 25<br />
61 58 49 45<br />
TYPHOON OR( XiID<br />
WRN<br />
(23w)<br />
BEST TRACK<br />
IXGEQL<br />
91100400 1<br />
xAzxQKkxNQ<br />
19.lN 139.OE 35<br />
91100406 2 19.lN 137.3E 40<br />
91100412 3 19.lN 137.3E 40<br />
91100418 4 19.lN 136.7E 45<br />
91100500 5 19.2N 136.2E 50<br />
91100506 6 19.2N 135.7E 55<br />
91100512 7 19.2N 135.lE 60<br />
91100518 8 19.lN 134.3E 65<br />
91100600 9 19.ON 133.6E 70<br />
91100606 10 18.9N 133.OE 80<br />
POSITIONERRORS<br />
QQ24*22<br />
41 116 180 280<br />
22 144 194 265<br />
34 130 180 297<br />
20 41 75 191<br />
20 64 71 94<br />
16 90 120 110<br />
24 96 134 193<br />
12 34 129 287<br />
12 23 118 331<br />
13 30 124 359<br />
X-TRACK A-TRACK<br />
2A4B122t<br />
111 173 180 33<br />
AQz2<br />
50 215<br />
31 66 -121 141 183 237<br />
2 6 -292 -130 180 59<br />
-25 28 -191 33 70 14<br />
8 71 -61 -64 -11 72<br />
76 118 -77 -49 24 78<br />
81 -61 -176 52 120 80<br />
-1 -129 -216 35 7 -190<br />
-4 -118 -260 23 13 -206<br />
-4 -123 -223 30 -17 -283<br />
WIND ERRCRS<br />
QQz$l.<br />
-5 15<br />
ulz<br />
10 -30<br />
-lo 10 0 -35<br />
-5 5 -10 -25<br />
0 10 -15 -25<br />
0 5 -25 -25<br />
0 -5 -25 -15<br />
0 -lo -20 -15<br />
-5 -20 -20 -lo<br />
-5 -25 -15 0<br />
-5 -15 10 20<br />
203
TYPHOON ORCHID (23W) (CONTINUED)<br />
WRN BEST TRACK POSITIONERRORS<br />
DIE I& Uu ul!KimNQQQ x m z<br />
91100612 11 19.ON 132.4E 90 12 50 177 429<br />
91100618 12 19.lN 131.9E100 5 71 212 408<br />
91100700 13 19.3N 131.4E110 11 86 269 442<br />
91100706 14 19.5N 131.OE115 13 111 317 459<br />
91100712 15 19.8N 130.7E110 6 55 232 331<br />
91100718 16 20.3N 130.6E110 11 78 193 173<br />
01100800 17 20.8N 130.4E110 0 92 144 189<br />
91100806 18 21.4N 130.5E105 5 119 145 188<br />
91100812 19 22.2N 130.7E105 20 142 135 121<br />
91100818 20 23.lN 131.lE100 26 68 31 209<br />
91100900 21 24.lN 131.8E100 8 55 208 448<br />
91100906 22 25.ON 132.5E 95 0 112 330 546<br />
91100912 23 25.8N 133.2E 90 5 71 276 535<br />
91100918 24 26.5N 134.lE 85 8 55 225<br />
91101000 25 27.lN 134.8E 80 13 52 201<br />
91101006 26 27.7N 135.5E 80 10 52 78<br />
91101012 27 28.2N 136.OE 75 7 82 84<br />
91101018 28 28.8N 136.4E 75 5 99 242<br />
91101100 29 29.4N 136.6E 70 15 70 16<br />
91101106 30 30.ON 136.8E 70 15 141<br />
91101112 31 30.5N 137.lE 65 19 61<br />
91101118 32 30.9N 137.6E 65 11 87<br />
91101200 33 31.3N 138.2E 60 5 20<br />
91101206 34 31.7N 138.9E 60 16<br />
91101212 35 32.lN 139.8E 55 19<br />
91101218 36 32.7N 141.OE 55 23<br />
91101300 37 33.6N 142.7E 55 19<br />
X-TRACK A-TFACK<br />
2441 Z2244.Q22<br />
-51 -173 -255 0 -40 -345<br />
-62 -135 -211 -36 -164 -350<br />
-62 -122 -237 -60 -241 -374<br />
-73 -122 -256 -84 -293 -382<br />
-50 -105 -254 -24 -208 -213<br />
-60 -139 -140 -50 -135 104<br />
-46 -110 35 -80 -94 186<br />
-60 -118 55 -103 -85 180<br />
-43 -94 8 -136 –98 122<br />
-4 -lo 7 -68 30 210<br />
-31 143 -48 45 152 446<br />
-29 240 -145 108 228 527<br />
24 144 -25 67 236 535<br />
52 65 18 216<br />
52 -lo 0 201<br />
52 25 -6 74<br />
65 13 52 84<br />
48 -16 87 242<br />
-16 -3 69 -16<br />
-85 113<br />
-62 -4<br />
-87 8<br />
-6 -20<br />
WIND ERRORS<br />
QQaM!.lz<br />
o 10 20 30<br />
0 15 15 25<br />
5 20 30 45<br />
5 25 35 45<br />
5 15 25 30<br />
5 15 20 15<br />
0 10 25 25<br />
5 15 25 20<br />
0055<br />
0555<br />
0 10 10 5<br />
-5 -5 -5 -15<br />
-5 -lo -lo -5<br />
-5 -10 -10<br />
0 -lo -lo<br />
-5 -lo -lo<br />
0 -5 -5<br />
-5 -5 -5<br />
-5 -5 -5<br />
-5 -5<br />
-lo -5<br />
-lo -5<br />
-lo -5<br />
-lo<br />
-5<br />
-lo<br />
-lo<br />
Average 14 79 167 299 44 92 151 55 121 235 4 10 15 20<br />
# Ceses 37 33 29 23 33 29 23 33 29 23 37 33 29 23<br />
TYPHOON PAT (24w)<br />
WRN BEST TRACK<br />
m m N KKku,m<br />
91100512 1 15.3N 156.7E 35<br />
91100518 2 15.4N 155.6E 40<br />
91100600 3 15.4N 154.6E 45<br />
91100606 4 15.6N 153.5E 50<br />
91100612 5 15.7N 152.6E 55<br />
91100618 6 16.ON 152.lE 60<br />
91100700 7 16.2N 151.9E 70<br />
91100706 8 16.5N 151.6E 80<br />
91100712 9 16.9N 151.4E 95<br />
91100718 10 17.4N 151.2E110<br />
91100800 11 17.9N 151.2E120<br />
91100806 12 18.4N 151.2E125<br />
91100812 13 19.ON 151.lE125<br />
91100818 14 19.6N 150.9E120<br />
91100900 15 20.2N 150.6E115<br />
91100906 16 20.8N 150.3E110<br />
91100912 17 21.3N 150.OE105<br />
91100918 18 21.8N 149.8E100<br />
91101000 19 22.3N 149.7E100<br />
91101006 20 22.8N 149.7E 95<br />
91101012 21 23.5N 149.9E 90<br />
POSITIONERRORS X-TRACK<br />
QQ 244 u2!l * 22<br />
16 34 93 249 24 -92 -229<br />
29 69 199 357 -47 -195 -332<br />
5 102 247 369 -98 -241 -366<br />
6 116 280 386 -115 -275 -378<br />
8 160 359 477 -161 -359 -455<br />
18 137 305 407 -137 -301 -399<br />
21 140 256 353 -121 -256 -316<br />
18 127 226 331 -109 -226 -303<br />
20 112 190 309 -108 -190 -290<br />
11 67 112 225 -68 -112 -201<br />
5 32 48 137 -23 -6 -58<br />
11 71 58 148 6 22 -40<br />
0 17 27 195 12 -28 -177<br />
08 76 262 6 -68 -214<br />
5 8 102 329 6 -81 -224<br />
5 24 147 386 -6 -128 -190<br />
0 44 168 362 -44 -150 -20<br />
5 83 194 459 -71 -149 -13<br />
12 104 317 693 -69 -161 -32<br />
12 109 235 -95 -96<br />
8 93 261 -80 -21<br />
A-TRACK<br />
24s22<br />
-24 -18 -100<br />
51 -40 -133<br />
-30 -57 50<br />
-17 -57 -79<br />
1 -30 146<br />
-5 -50 -81<br />
-71 -11 -157<br />
-65 -11 -133<br />
-29 16 -109<br />
0 -11 -101<br />
-22 -48 -125<br />
-72 -54 -143<br />
-13 0 -82<br />
6 35 -153<br />
6 63 -242<br />
24 73 -337<br />
-6 -76 -362<br />
-43 -124 -460<br />
-78 -274 -693<br />
-54 -216<br />
-48 -261<br />
WIND ERRORS<br />
QQ2.4m2z<br />
-10 -15 -45 -60<br />
-15 -20 -60 -55<br />
-lo -20 -45 -15<br />
-15 -25 -45 -10<br />
-lo -35 -40 0<br />
-10 -35 -25 10<br />
-lo -35 -lo 10<br />
-10 -30 -5 15<br />
-5 -10 15 25<br />
-5 0 20 30<br />
0 20 35 45<br />
-5 0 5 15<br />
-5 5 10 15<br />
-5 5 10 20<br />
0 5 15 25<br />
0 5 15 20<br />
0 5 10 15<br />
0 5 10 15<br />
0 10 15 15<br />
0 10 10<br />
0 10 15<br />
204
TYPHOON PAT (24w) (CONTINUED)<br />
WRN BEST TRACK POSITIONERRORS X-TRACX A-TRACK<br />
m Ii!& IlmlQB4imNQQQiu&! Xz!luzau!lz<br />
91101018 22 24.2N 150.2E 85 12 93 210 -42 -5 -84 -211<br />
91101100 23 25.lN 150.6E 80 24 133 227 21 39 -132 -224<br />
91101106 24 26.3N 151.2E 75 5 190 180 61<br />
91101112 25 27.7N 151.5E 75 8 104 30 100<br />
91101118 26 29.5N 151.5E 70 0 120 -44 112<br />
91101200 27 31.5N 151.6E 65 13 146 -109 98<br />
91101206 28 33.7N 152.OE 65 0<br />
91101212 29 35.8N 152.8E 60 7<br />
91101218 30 38.ON 153.9E 55 24<br />
91101300 31 40.3N 155.4E 55 27<br />
WIND ERRORS<br />
QQz$l Mzz<br />
o 5 10<br />
000<br />
00<br />
-5 0<br />
05<br />
05<br />
0<br />
0<br />
5<br />
-5<br />
Average 11 90 189 339 67 139 223 46 85 194 4 12 20 22<br />
# Cases 31 27 23 19 27 23 19 27 23 19 31 27 23 19<br />
SUPER TYPHOON RUTH (25W)<br />
WRN BEST TRACK POSITIONERRORS X-TRACK A-TRACX WINO ERRQU3<br />
m NQ!. Xi9x u2KHmR!2Q a * lz 24. a 2 u a lz S!!22!LSZ2<br />
91102018<br />
91102100<br />
91102106<br />
91102112<br />
91102118<br />
91102200<br />
91102206<br />
91102212<br />
91102218<br />
91102300<br />
91102306<br />
91102312<br />
91102318<br />
91102400<br />
91102406<br />
91102412<br />
91102418<br />
91102500<br />
91102506<br />
91102512<br />
91102518<br />
91102600<br />
91102606<br />
91102612<br />
91102618<br />
91102700<br />
91102706<br />
91102712<br />
91102718<br />
91102800<br />
91102806<br />
91102812<br />
91102818<br />
91102900<br />
91102906<br />
91102912<br />
91102918<br />
91103000<br />
91103012<br />
1<br />
2<br />
3<br />
4<br />
5<br />
6<br />
7<br />
8<br />
9<br />
10<br />
11<br />
12<br />
13<br />
14<br />
15<br />
16<br />
17<br />
18<br />
19<br />
20<br />
21<br />
22<br />
23<br />
24<br />
25<br />
26<br />
27<br />
28<br />
29<br />
30<br />
31<br />
32<br />
33<br />
34<br />
35<br />
36<br />
37<br />
38<br />
39<br />
10.4N 143.5E 30 104 122 130 227 119 90 152 -30 -95 -169 -5 -lo -30 -70<br />
10.9N 143.lE 35 75 11 21 70 9 -15 53 -7 -15 -47 -5 -lo -30 -40<br />
11.3N 142.7E 40 48 66 47 79 -39 14 80 54 45 5 -5 -lo -40 -35<br />
11.7N 142.4E 45 18 81 41 34 -77 -33 26 27 26 -22 -5 -lo -45 -30<br />
12.ON 142.OE 50 5 78 34 60 -78 -28 35 -lo -21 -50 -5 -15 -50 -20<br />
12.4N 141.6E 55 26 71 59 106 -70 -6 17 -16 -59 -105 0 -15 -25 -10<br />
12.9N 141.2E 60 29 47 112 128 -14 54 12 -45 -99 -128 0 -20 -25 -10<br />
13.4N 140.7E 70 0 59 70 46 51 61 29 -30 -35 -37 -5 -25 -20 -10<br />
13.8N 139.9E 80 8 116 120 68 92 106 35 -71 -57 -59 -10 -25 -10 -5<br />
14.ON 139.OE 95 5 41 60 66 2 -38 -64 41 47 17 -15 -25 -10 -10<br />
14.2N 138.lE110 5 25 43 50 12 34 -49 22 28 14 -15 -20 -lo -5<br />
14.3N 137.2E125 6 25 29 70 12 12 -65 22 27 27 -lo -lo -lo -5<br />
14.4N 136.3E135 5 26 11 55 18 -6 -54 -18 10 13 -10 -5 -5 0<br />
14.5N 135.3E140 8 17 40 120 7 14 -41 -16 -38 -114 -5 5 -5 0<br />
14.7N 134.3E145 8 34 70 110 -20 -29 i’ -28 -64 -110 -5 5 0 5<br />
15.ON 133.3E145 8 26 72 165 -15 -2 67 -22 -73 -151 -5 10 5 10<br />
15.3N 132.3E140 0 .54 120 214 -3 20 73 -55 -119 -202 0 10 5 25<br />
15.7N 131.3E140 0 12 120 325 0 32 279 -13 -116 -168 0 0 10 40<br />
16.ON 130.3E140 5 16 206 533 -8 74 512 -15 -193 -148 0 5 15 45<br />
16.5N 129.4E135 6 51 251 584 21 129 578 -47 -216 88 0 5 20 50<br />
17.ON 128.5E130 8 92 331 673 60 149 411 -70 -296 535 0 5 30 55<br />
17.5N 127.6E130 12 170 491 836 108 447 505 -131 -205 669 0 5 40 60<br />
17.9N 126.6E125 6 199 568 905 124 544 577 -156 -165 701 0 15 45 55<br />
18.2N 125.6E120 11 223 611 912 168 606 -56 -146 85 910 5 20 50 60<br />
18.5N 124.6E115 8 116 177 156 113 56 -36 -28 168 152 -5 5 30 45<br />
18.5N 123.6E110 16 118 103 57 106 17 -54 55 102 -21 -10 10 20 35<br />
18.2N 122.8E105 21 83 59 257 46 -56 -44 70 18 -254 -15 5 15 20<br />
18.ON 122.lE100 8 58 102 367 13 -69 -104 58 -76 -352 -lo 10 30 40<br />
17.8N 121.5E 85 16 57 144 462 -45 -79 -158 36 -121 -435 0 15 35 40<br />
17.8N 121.lE 70 13 113 305 809 -69 59 -70 -90 -300 -807 0 10 20 10<br />
17.9N 120.7E 65 21 154 416 937 -97 104 346 -120 -403 -872 -10 10 15 5<br />
18.lN 120.3E 60 23 163 456 13 31 -163 -455 -5 20 20<br />
18.5N 120.lE 55 8 53 261 -53 -180 -2 -190 5 30 25<br />
18.9N 120.OE 50 5 84 372 -38 -146 -76 -343 5 20 10<br />
19.4N 120.OE 45 5 140 459 -43 39 -134 -458 5105<br />
19.8N 120.3E 40 5 117<br />
-65<br />
-98<br />
55<br />
20.2N 120.7E 35 13 130<br />
-1oo<br />
-85<br />
50<br />
20.6N 121.3E 30 30 222<br />
-75<br />
-209<br />
00<br />
21.5N 123.6E 30 28<br />
0
SUPER TYPHOON RUTH (25W) (C!oNTINuED)<br />
m BEST TRACK POSITIONERRORS x-TRAcx A-TRAcK WIND ERRORS<br />
m & N x&2N!2mNR QQ a Mlz 24 s i!2 24 * 12 QQ24fi12<br />
91103100 40 23.2N 126.2E 25 26 5<br />
Average<br />
# Cases<br />
16 86 186 306 52 96 148 60 136 238 5 11 22 27<br />
40 38 35 31 38 35 31 38 35 31 40 38 35 31<br />
SUPER TYPHO(<br />
WRN<br />
L%GMGL<br />
91110100 1<br />
91110106 2<br />
91110112 3<br />
91110118 4<br />
91110200 5<br />
91110206 6<br />
91110212 7<br />
91110218 8<br />
91110300 9<br />
91110306 10<br />
91110312 11<br />
91110318 12<br />
91110400 13<br />
91110406 14<br />
91110412 15<br />
91110418 16<br />
91110500 17<br />
91110506 18<br />
91110512 19<br />
91110518 20<br />
91110600 21<br />
91110606 22<br />
91110612 23<br />
91110618 24<br />
91110700 25<br />
91110706 26<br />
91110712 27<br />
91110718 28<br />
91110800 29<br />
91110806 30<br />
91110812 31<br />
91110818 32<br />
91110900 33<br />
91110906 34<br />
91110912 35<br />
91110918 36<br />
91111000 37<br />
91111006 38<br />
91111012 39<br />
91111018 40<br />
91111100 41<br />
91111106 42<br />
91111112 43<br />
91111118 44<br />
91111200 45<br />
91111206 46<br />
91111212 47<br />
91111218 48<br />
DN SETH (26W)<br />
BEST TRAcK<br />
Luuws!um<br />
8.ON 157.8E 35<br />
8.5N 156.6E 40<br />
9.3N 155.3E 45<br />
10.2N 154.2E 50<br />
11.ON 153.OE 55<br />
11.9N 151.8E 60<br />
12.7N 150.61z65<br />
13.4N 149.4E 75<br />
14.lN 148.3E 90<br />
14.7N 147.3E105<br />
15.3N 146.3E120<br />
15.9N 145.2E130<br />
16.4N 144.2E130<br />
16.9N 143.2E130<br />
17.4N 142.2E125<br />
17.8N 141.4E120<br />
18.3N 140.8E120<br />
18.7N 140.3E115<br />
19.lN 140.OE115<br />
19.4N 139.7E110<br />
19.5N 139.5E105<br />
19.6N 139.2E100<br />
19.6N 139.OE100<br />
19.6N 138.7E 95<br />
19.5N 138.2E 95<br />
19.4N 137.6E 95<br />
19.4N 136.9E 95<br />
19.4N 136.4E100<br />
19.5N 135.8E100<br />
19.5N 135.2E105<br />
19.4N 134.5E110<br />
19.2N 133.9E115<br />
19.ON 133.2E115<br />
18.7N 132.5E115<br />
18.5N 131.7E110<br />
18.4N 130.8E110<br />
18.3N 130.OE105<br />
18.2N 129.3E105<br />
18.lN 128.5E100<br />
18.ON 127.9E100<br />
17.8N 127.3E 95<br />
17.7N 126.8E 95<br />
17.6N 126.3E 95<br />
17.6N 125.7E 85<br />
17.6N 125.lE 75<br />
17.8N 124.4E 65<br />
18.lN 123.6E 60<br />
18.5N 122.7E 55<br />
POSITIONERRORS X-TFAC2( A-TRACK<br />
4)!2 U*n<br />
61 189 321 403<br />
M m Z M *U<br />
-86 -170 -268 -169 -273 -301<br />
16 184 306 384 -120 -221 -302 -141 -213 -238<br />
30 164 250 310 -122 -184 -227 -111 -170 -213<br />
11 80 114 129 -44 -95 -121 -67 -63 -45<br />
29 83 102 75 -48 -85 -75 -68 -57 -3<br />
42 72 117 153 –58 -117 -141 -43 4 62<br />
38 74 88 164 -70 -88 -141 -23 12 86<br />
0 45 92 255 -43 -60 -95 17 70 237<br />
8 49 118 270 -37 -32 -205 33 114 177<br />
13 31 62 251 -24 0 -49 20 62 246<br />
8 51 49 228 29 37 5 -43 33 -228<br />
8 50 133 306 50 109 302 12 77 -52<br />
0 17 119 306 -11 -62 303 13 102 -44<br />
17 58 111 227 -52 -90 226 27 66 25<br />
0 79 142 225 -68 129 222 41 -61 41<br />
0 73 135 287 -34 105 282 65 85 -55<br />
0 94 186 364 -73 186 363 60 14 -37<br />
13 117 216 393 -67 217 363 96 -7 -152<br />
8 107 260 507 34 253 342 -102 -63 -375<br />
5 78 224 449 77 210 300 -13 -77 -335<br />
6 117 346 772 106 331 512 -50 -103 -580<br />
11 110 283 606 69 198 309 -87 -203 -522<br />
18 135 271 475 98 108 255 -94 -249 -402<br />
20 102 237 482 72 111 298 -73 -210 -380<br />
25 98 218 459 38 85 250 -92 -201 -386<br />
13 56 205 468 53 62 245 -21 -196 -399<br />
8 45 200 468 -18 70 216 -42 -187 -416<br />
8 75 233 445 -5 66 154 -76 -224 -418<br />
8 42 191 410 39 87 147 -18 -171 -383<br />
11 60 174 271 39 50 39 -47 -167 -269<br />
12 95 197 290 62 51 100 -72 -191 -273<br />
12 97 203 318 38 46 148 -90 -198 -282<br />
12 67 121 159 15 10 43 -65 -121 -154<br />
8 29 118 211 2 7 95 -29 -118 -190<br />
6 29 62 161 -26 -39 -54 -13 -49 -153<br />
0 24 62 208 -23 -60 -106 10 -17 -180<br />
0 33 68 197 10 6 -12 -32 -69 -197<br />
8 24 29 178 25 -8 -47 0 -28 -172<br />
13 36 58 177 36 14 -97 -2 -57 -149<br />
12 18 101 187 18 -11 -187 -6 -101 5<br />
13 20 141 170 -12 -90 -151 17 -109 79<br />
16 75 207 145 -59 -133 -96 -47 -159 110<br />
12 101 225 95 -51 -171 -95 -88 -148 -9<br />
16 103 191 142 -58 -189 -67 -86 30 -126<br />
18 119 141 167 -58 -110 17 -105 89 -167<br />
32 146 69 -78 -55 -124 44<br />
32 120 29 -103 -lo -62 -27<br />
21 58 198 -59 42 6 -194<br />
WIND ERRORS<br />
QQaslz<br />
-10 -10 -25 -45<br />
-lo -lo -35 -40<br />
-lo -20 -55 -35<br />
-10 -15 -50 -20<br />
-10 -25 -40 -15<br />
-5 -15 -15 5<br />
-5 -25 0 10<br />
-lo -30 5 15<br />
-15 0 5 15<br />
-lo 0 10 10<br />
0 -5 -lo -lo<br />
-5 -5 -lo -lo<br />
0 -5 -5 -lo<br />
00 0 -lo<br />
0 -lo -5 -15<br />
0 -lo -lo -30<br />
0 -5 -10-30<br />
0 -lo -15 -40<br />
0 -lo -15 -45<br />
5 5 -10 -40<br />
5 -5 -25 -55<br />
0 -15 -40 -65<br />
-5 -20 -50 -65<br />
-5 -25 -55 -65<br />
-15 -40 -65 -65<br />
-15 -40 -65 -65<br />
-10 -35 -50 -50<br />
-lo -40 -50 -50<br />
-5 -25 -25 -25<br />
-10 -25 -25 -25<br />
-10 -20 -20 -25<br />
-15 -20 -25 -20<br />
-15 -15 -20 -lo<br />
0 -5 -5 15<br />
50 -5 20<br />
0 -5 0 25<br />
0 -5 5 25<br />
0 -5 15 30<br />
0 -5 20 30<br />
0 5 25 30<br />
5 10 25 30<br />
-5 15 25 30<br />
-5 5 20 15<br />
0 5 15 10<br />
05 5 10<br />
05-5<br />
050<br />
000<br />
206
SUPHR TYPHOON SETH (26ti#) (CONTINUED)<br />
WRN BEST TRACK POSITIONERRORS x-mm A-TRACX<br />
Qm lK2L117Sl xQKkuNRQQz4AQ U&lfl&lz MA, Qu<br />
91111300 49 18.9N 121.9E 50 18 69 249 65 188 23 -164<br />
91111306 50 19.3N 121.2E 45 22 120 94 -76<br />
91111312 51 19.5N 120.6E 40 28 166 129 -105<br />
91111318 52 19.4N 120.2E 40 30 204 138 -151<br />
91111400 53 18.9N 119.9E 35 23 237 132 -197<br />
91111406 54 18.2N 119.4E 30 5<br />
91111412 55 17.2N 118.8E 25 11<br />
91111418 56 16.ON 117.7E 25 5<br />
Average 15 85 163 297 56 99 179 59 111 207<br />
# Cases 56 53 49 45 53 49 45 53 49 45<br />
TROPICAL STORM THELMA (27w)<br />
WRN BEST ‘IRACX POSITIONERRORS<br />
m m ldu Im2mlu2!2Q 24 AQlz<br />
91110112 1 12.9N 134.OE 30 16 84 181 340<br />
91110118 2 13.2N 133.3E 30 43 160 305 516<br />
91110200 3 13.3N 132.5E 30 53 194<br />
91110212 4 13.2N 130.8E 30 48 55<br />
91110300 5 13.lN 129.7E 30 12 57<br />
91110312 6 13.ON 128.8E 30 11 115<br />
91110400 7 12.7N 127.7E 35 13 96 287 522<br />
91110406 8 12.4N 127.lE 40 21 121 343 589<br />
91110412 9 12.lN 126.4E 45 0 122 294 500<br />
91110418 10 11.7N 125.6E 45 17 185 418 671<br />
91110500 11 11.2N 124.7E 40 34 206 453 700<br />
91110506 12 10.8N 123.7E 35 39 213 488 768<br />
91110512 13 10.4N 122.6E 35 16 188 407 648<br />
91110518 14 10.2N 121.4E 35 16 143 343<br />
91110600 15 10.3N 120.lE 35 18 114 267<br />
91110606 16 10.4N 118.7E 35 24 71 195<br />
91110612 17 10.6N 117.4E 35 88 83 87<br />
91110618 18 10.8N 116.lE 35 100 94<br />
91110700 19 11.ON 114.8E 35 21 121<br />
91110706 20 11.lN 113.5E 35 5 81<br />
91110712 21 11.lN 112.2E 30 47 138<br />
91110800 22 10.9N 109.4E 30 44<br />
91110812 23 10.4N 106.8E 25 192<br />
X-TRACK A-TRACK<br />
24slz24a12<br />
61 151 248 -58 -101 -233<br />
146 283 358 -66 -116 -372<br />
155 -117<br />
20 -52<br />
-44 -37<br />
5 -116<br />
56 147 159 -78 -248 -498<br />
47 132 70 -113 -317 -585<br />
42 108 -10 -115 -274 –500<br />
78 93 -28 -168 -408 -671<br />
64 82 -33 -196 -446 -700<br />
5 -40 -176 -213 -487 -748<br />
-49 -139 -153 -182 -384 -630<br />
-71 -145 -125 -311<br />
-57 -84 -99 -255<br />
-52 -51 -49 -188<br />
17 31 81 -82<br />
92 23<br />
84 -89<br />
55 -60<br />
55 127<br />
Aver;ge 38 126 313 584 59 114 137 103 278 548<br />
#Cases 23 21 13 9 21 13 9 21 13 9<br />
TROPICAL STORM VERNE (28W)<br />
WRN SEST ‘lRACX POSITIONERRORS<br />
m n Lax UBGHINQQQ a B z<br />
91110518 1 10.1N 161.5E 25 34 125 157 126<br />
91110600 2 10.8N 159.9E 25 37 162 199 240<br />
91110606 3 11.4N 158.5E 30 35 75 116 203<br />
91110612 4 12.ON 157.2E 30 95 142 233 296<br />
91110618 5 12.7N 156.OE 30 134 144 216 244<br />
91110700 6 13.3N 154.9E 30 18 11 78 199<br />
91110706 7 13.9N 153.8E 35 25 130 227 293<br />
91110712 8 14.4N 152.6E 35 32 117 235 348<br />
91110718 9 14.9N 151.7E 40 8 42 111 159<br />
91110800 10 15.2N 150.9E 45 52 59 126 213<br />
91110806 11 15.6N 150.IE 45 6 5 64 187<br />
X-TRACX A-TRACK<br />
24 Blz 24 Ulz<br />
-60 -86 -111 -111 -132 -60<br />
-39 -45 -59 158 195 233<br />
-34 -42 -32 68 108 201<br />
-31 -47 84 139 229 284<br />
1 27 63 -144 215 237<br />
-11 15 92 -5 77 177<br />
96 204 270 88 102 116<br />
114 220 321 29 83 135<br />
36 106 138 22 34 -79<br />
53 121 176 -28 -37 -121<br />
3 17 135 -5 -62 -131<br />
WIND ERRORS<br />
QQamu<br />
-5 0 5<br />
-5 5<br />
05<br />
05<br />
05<br />
0<br />
0<br />
0<br />
5 12 21 29<br />
56 53 49 45<br />
WIND ERRORS<br />
QQaaz<br />
o 10 30 30<br />
0 10 25 25<br />
00<br />
0 -5<br />
0 -lo<br />
0 -20<br />
0550<br />
01050<br />
01055<br />
-5 5 0 0<br />
0500<br />
0 -5 -lo -5<br />
0 -5 -5 0<br />
0 -5 -5<br />
005<br />
0 0 10<br />
0 15 20<br />
05<br />
00<br />
00<br />
0 -5<br />
0<br />
5<br />
0 6107<br />
23 21 13 9<br />
WIND ERRORS<br />
QQz$kfl. kix<br />
5 15 25 35<br />
5 15 20 35<br />
0 10 20 35<br />
0 10 15 35<br />
0 5 10 35<br />
0 -5 0 20<br />
-5 0 10 30<br />
0 0 15 40<br />
0 5 25 45<br />
0 10 30 45<br />
0 0 20 45<br />
207
TROPICAL STORM vE= (28w) (CONTINum)<br />
WAN BEST TRACK POSITIONERRORS x-mm<br />
A-TRACK<br />
mlKL. LZWXQNGHINR s!Q29. fi12 244Q22244QZ2<br />
91110812 12 16.ON 149.3E 50 5 17 111 187 8 25 177 -15 -109 -61<br />
91110818 13 16.4N 148.6E 55 12 45 107 180 43 53 148 15 -93 -104<br />
91110900 14 16.8N 147.9E 55 12 37 106 230 8 61 65 37 -87 -221<br />
91110906 15<br />
91110912 16<br />
17.lN 147.3E 55<br />
17.4N 146.7E 55<br />
34<br />
34<br />
45<br />
91<br />
157<br />
186<br />
490<br />
627<br />
-46<br />
-47<br />
22<br />
126<br />
51<br />
-1<br />
-4 -156 -488<br />
-79 -137 -627<br />
91110918 17 17.9N 146.OE 55 13 89 52 64 31 -63 -43<br />
91111000 18<br />
91111006 19<br />
18.6N 145.lE 55<br />
19.3N 144.3E 55<br />
13<br />
11<br />
73<br />
61<br />
162<br />
149<br />
18<br />
61<br />
-66<br />
-86<br />
-71 -149<br />
-6 -123<br />
91111012 20<br />
91111018 21<br />
91111100 22<br />
91111106 23<br />
91111112 24<br />
91111118 25<br />
91111200 26<br />
91111206 27<br />
91111212 28<br />
20.IN 143.5E 50<br />
21.ON 142.6E 50<br />
22.ON 141.9E 50<br />
23.lN 141.5E 50<br />
24.2N 142.OE 45<br />
25.2N 143.7E 45<br />
26.3N 145.8E 40<br />
27.6N 148.4E 40<br />
28.8N 151.3E 35<br />
30<br />
50<br />
16<br />
43<br />
36<br />
76<br />
60<br />
46<br />
19<br />
97<br />
65<br />
105<br />
151<br />
274<br />
157 45 -142<br />
4<br />
-92<br />
-148<br />
-229<br />
87<br />
-65<br />
-52<br />
-35<br />
-152<br />
-67<br />
WIND ERRORS<br />
QQ244Q22<br />
o 0 15 30<br />
0 0 15 30<br />
0 5 15 35<br />
0 10 20 35<br />
0 15 25 40<br />
0 15 25<br />
0 15 30<br />
0 0 10<br />
0-50<br />
0 –5<br />
00<br />
00<br />
05<br />
-5<br />
0<br />
0<br />
5<br />
Average<br />
# Cases<br />
35 90 148 264<br />
28 24 20 16<br />
53 77 120 61 111 204<br />
24 20 16 24 20 16<br />
1 6 17 36<br />
28 24 20 16<br />
TROPICAL STORM WIIJ)A (29w)<br />
WRN BEST TRACK<br />
m NQ&<br />
91111418 1<br />
Ilu 142wkum<br />
10.3N 129.9E 30<br />
91111500 2 10.5N 128.7E 35<br />
91111506 3 10.9N 127.8E 35<br />
91111512 4 11.3N 126.9E 35<br />
91111518 5 11.9N 126.OE 40<br />
91111600 6 12.7N 125.2E 45<br />
91111606 7 13.3N 124.2E 45<br />
91111612 8 13.4N 123.OE 45<br />
91111618 9 13.5N 121.9E 45<br />
91111700 10 13.8N 121.OE 45<br />
91111706 11 14.2N 120.2E 45<br />
91111712 12 15.ON 119.7E 45<br />
91111718 13 15.7N 119.3E 45<br />
91111800 14 16.4N 118.8E 45<br />
91111806 15 16.8N 118.4E 45<br />
91111812 16 17.2N 118.OE 45<br />
91111818 17 17.6N 1}7.5E 45<br />
91111900 18 17.9N 116.9E 45<br />
91111906 19 17.7N 116.3E 40<br />
91111912 20 17.3N 115.7E 35<br />
91111918 21 16.7N 114.8E 30<br />
91112000 22 16.lN 113.lE 25<br />
POSITIONERRORS<br />
QQz!lmlz<br />
50 143<br />
29 59 75 237<br />
24 80 97 178<br />
21 96 167 226<br />
5 54 138 222<br />
21 21 135 253<br />
24 24 112 154<br />
24 6 116 124<br />
16 123 245 201<br />
6 133 221 80<br />
18 141 186<br />
11 88 64<br />
13 50 35<br />
6 42 199<br />
0 51<br />
8 64<br />
5 103<br />
16 155<br />
8<br />
18<br />
44<br />
8<br />
X-TRACK A-TRACK<br />
2A4Q12z!L&lz<br />
-63 -129<br />
-59 -75 -209 -8 -6 -113<br />
-55 10 -156 -60 -97 -87<br />
-59 53 -loo -76 -158 -204<br />
-32 -32 -187 -44 -134 -121<br />
-12 -116 -245 -18 -71 66<br />
22 -112 -52 11 7 146<br />
-3 -116 3 -5 -4 125<br />
123 -242 -22 -3 40 200<br />
111 -213 -50 -74 64 63<br />
136 -91 -38 -163<br />
-87<br />
-48<br />
-16<br />
31<br />
-16<br />
15<br />
62<br />
-18<br />
41<br />
-26<br />
-17<br />
53<br />
95<br />
77 -11 -184<br />
-44<br />
-62<br />
-89<br />
-124<br />
WIND ERRORS<br />
QQzlalz<br />
-5 -lo<br />
0005<br />
5 15 10 10<br />
5 15 10 10<br />
0 10 10 10<br />
-5 10 10 10<br />
5 10 10 20<br />
5 5 10 25<br />
5 10 15 35<br />
5 15 20 45<br />
5 15 30<br />
10 15 35<br />
10 10 20<br />
10 -5 5<br />
50<br />
55<br />
5 10<br />
0 10<br />
0<br />
0<br />
5<br />
20<br />
Average<br />
# Cases<br />
17 80 138 186<br />
22 18 13 9<br />
57<br />
18<br />
91 113 45<br />
13 9 18<br />
77 125<br />
13 9<br />
5 9 14 19<br />
22 18 13 9<br />
SUPER TYPHOON YURI (30W)<br />
WRN BEST TRACX<br />
Qm NQ& m IQmm.m<br />
91112300 1 4.9N 166.4E 30<br />
91112306 2 5.2N 166.OE 30<br />
POSITIONERRORS<br />
QQamzz<br />
59 77 114 269<br />
46 36 162 335<br />
208<br />
X-TRACX A-TRACK<br />
24 fi1224AR12<br />
-78 -65 -92 -5 -95 -253<br />
-31 1 -19 -19 -162 -335<br />
WIND ERRORS<br />
Q,!22!IQZ<br />
-5 -15 -30 -50<br />
-5 -15 -30 -45
SUPER TYPHOON<br />
WRN<br />
mGNQL<br />
91112312 3<br />
91112318 4<br />
91112400 5<br />
91112406 6<br />
91112412 7<br />
91112418 8<br />
91112500 9<br />
91112506 10<br />
91112512 11<br />
91112518 12<br />
91112600 13<br />
91112606 14<br />
91112612 15<br />
91112618 16<br />
91112700 17<br />
91112706 18<br />
91112712 19<br />
91112718 20<br />
91112800 21<br />
91112806 22<br />
91112812 23<br />
91112818 24<br />
91112900 25<br />
91112906 26<br />
91112912 27<br />
91112918 28<br />
91113000 29<br />
91113006 30<br />
91113012 31<br />
91113018 32<br />
91120100 33<br />
91120106 34<br />
91120112 35<br />
91120118 36<br />
MIFtI (30W) (CONTINUED)<br />
BEST TRACK<br />
IIMI!QNGMMR<br />
5.5N 165.6E 35<br />
5.7N 165.lE 40<br />
6.ON 164.5E 45<br />
6.3N 163.8E 50<br />
6.5N 162.7E 55<br />
6.8N 161.3E 65<br />
7.2N 159.7E 75<br />
7.7N 158.lE 85<br />
8.2N 156.4E 95<br />
8.7N 154.8E105<br />
9.lN 153.lE115<br />
9.4N 151.3E120<br />
9.7N 149.6E125<br />
10.2N 148.lE135<br />
10.8N 146.7E145<br />
11.6N 145.5E150<br />
12.5N 144.OE150<br />
13.3N 142.7E150<br />
14.2N 141.5E145<br />
15.ON 140.5E140<br />
15.9N 139.7E140<br />
16.8N 139.2E135<br />
17.7N 138.9E135<br />
18.6N 138.9E130<br />
19.5N 139.2E120<br />
20.4N 139.9E110<br />
21.3N 140.9E105<br />
22.4N 142.4E100<br />
23.7N 144.4E 95<br />
25.4N 146.9E 90<br />
27.3N 149.4E 85<br />
29.5N 151.8E 75<br />
31.6N 154.2E 70<br />
33.6N 156.6E 70<br />
POSITIONERRORS X-TRACK A-TRACK<br />
QQ<br />
43<br />
aAQ12a<br />
72 250 400 -18<br />
*<br />
-5<br />
22<br />
-31<br />
a %2<br />
-70 -250 -399<br />
51 137 320 434 18 38 83 -136 -318 -426<br />
51 203 399 479 36 -2 120 -201 -399 -464<br />
30 179 361 401 37 -2 121 -175 -362 -383<br />
17 147 270 373 7 -21 -3 -147 -270 -373<br />
29 130 226 298 -16 7 -28 -129 -227 -298<br />
13 58 93 186 -14 -13 -135 -57 -93 -129<br />
16 75 109 216 -12 -29 -168 -74 -106 -137<br />
18 71 107 223 7 -45 -150 -71 -98 -166<br />
13 47 77 207 38 -43 -137 -30 -65 -157<br />
5 34 79 228 29 -51 -134 -18 -62 -185<br />
13 13 104 241 -13 -101 -190 -2 -24 -148<br />
8 75 161 306 -74 -153 -127 16 -52 -279<br />
5 83 187 350 -81 -157 -96 -19 -102 -338<br />
13 60 122 299 -44 -23 -34 -42 -120 -298<br />
8 26 115 363 -25 -86 -108 -8 -78 -347<br />
60 82 396 0 -33 -100 0 -76 -383<br />
13 33 120 544 -19 -59 -161 28 -105 -521<br />
17 116 239 523 -108 -189 -279 43 -146 -443<br />
8 41 148 394 -40 -58 -38 -12 -137 -393<br />
6 59 170 417 -59 -96 -128 -8 -141 -397<br />
6 78 274 505 -60 -120 -104 -51 -247 -495<br />
8 123 433 -84 -253 -90 -352<br />
5 105 341 -68 -125 -81 -318<br />
8 203 343 -105 -116 -174 -323<br />
16 179 310 -109 -49 -142 -307<br />
12 141 -44 -135<br />
28 201 14 -201<br />
28 144 94 -110<br />
28 172 172 -11<br />
42<br />
52<br />
53<br />
20<br />
WINDERRORS<br />
QQZ4SW2Z<br />
o -lo -30 -40<br />
-5 -15 -40 -50<br />
-10 -25 -50 -75<br />
-5 -25 -55 -80<br />
-5 -35 -55 -70<br />
-5 -35 -55 -60<br />
-5 -15 -15 -15<br />
-5 -5 -20 -lo<br />
-5 0 -15 -lo<br />
-lo -20 -30 -20<br />
-lo -20 -20 -20<br />
-10 -25 -15 -15<br />
-10 -25 -15 -5<br />
-10 -20 -10 5<br />
-15 0 5 25<br />
-5 5 10 30<br />
-5 0 15 30<br />
-5 0 15 25<br />
0 0 20 25<br />
5 0 15 20<br />
5 10 20 25<br />
5 20 15 20<br />
-10 -lo 0<br />
-15 -lo 0<br />
-lo -15 -5<br />
-5 -15 -5<br />
-5 –lo<br />
-5 -5<br />
-5 0<br />
-5 -5<br />
-lo<br />
-5<br />
-5<br />
-5<br />
Average<br />
# Cases<br />
22 97 204 349 48 69 107 72 179 322<br />
36 32 28 24 32 28 24 32 28 24<br />
7 13 22 32<br />
36 32 28 24<br />
TYPHOON ZEIDA (31W)<br />
WRN BEST TRACK<br />
U& m<br />
91112718 1<br />
x XQM2kum<br />
6.9N 173.5E 30<br />
91112800 2 7.2N 172.7E 35<br />
91112806 3 7.4N 171.8E 40<br />
91112812 4 7.7N 170.8E 45<br />
91112818 5 8.ON 169.7E 50<br />
91112900 6 8.2N 168.5E 55<br />
91112906 7 8.5N 167.lE 60<br />
91112912 8 8.9N 165.6E 65<br />
91112918 9 9.3N 164.OE 70<br />
91113000 10 9.8N 162.4E 70<br />
91113006 11 10.4N 160.9E 75<br />
91113012 12 11.2N 159.5E 80<br />
91113018 13 12.lN 158.lE 80<br />
91120100 14 13.ON 157.OE 80<br />
91120106 15 14.lN 156.3E 75<br />
POSITIONERRORS X-!rmm A-TRACK<br />
u!<br />
29<br />
Ma<br />
50 140<br />
2224<br />
233 -5<br />
U<br />
-1<br />
u<br />
-11<br />
24 a Z<br />
-51 -141 -233<br />
8 11 90 171 2 -7 -63 -12 -90 -159<br />
12 17 82 186 4 -7 -57 -17 -82 -177<br />
8 108 199 294 9 8 18 -108 -199 -294<br />
34 189 233 289 59 51 113 -180 -228 -266<br />
24 161 288 385 29 44 200 -159 -286 -330<br />
5 64 192 445 -33 -54 -7 -56 -185 -446<br />
21 89 267 636 -87 -188 -172 -21 -191 -612<br />
18 102 305 652 -88 -118 -203 -51 -282 -620<br />
13 112 249 528 -28 31 -129 -109 -248 -513<br />
26 90 322 591 -22 -60 -147 -88 -317 -573<br />
5 125 439 708 -93 -132 -256 -84 -419 -661<br />
13 203 515 758 -147 -197 -416 -141 -477 -636<br />
5 164 402 468 -78 -150 -310 -145 -374 -351<br />
0 172 331 306 -101 -135 -305 -140 -302 -30<br />
WIND ERRORS<br />
QQ2us12<br />
-5 -15 -15 0<br />
-lo -20 -15 0<br />
-lo -20 -15 10<br />
-20 -25 -20 10<br />
-25 -30 -20 15<br />
-30 20 10 20<br />
0 5 15 20<br />
0 0 15 25<br />
0 10 20 30<br />
0 10 20 35<br />
0 15 20 40<br />
0 15 20 25<br />
0 20 25 30<br />
00 5 15<br />
0 0 10 15<br />
209
TYPHOON ZEIDA (31W) (CONTINUED)<br />
WRN BEST TRACK POSITIONERRORS<br />
m & I&z ZQN!3HXNQQQ 2A M 12<br />
91120112 16 15.3N 156.2E 75 5 123 245 141<br />
91120118 17 16.4N 156.6E 70 18 65 145 367<br />
91120200 18 17.3N 157.3E 70 18 133 228<br />
91120206 19 18.2N 158.3E 70 11 130 337<br />
91120212 20 19.ON 159.4E 65 23 118 418<br />
91120218 21 19.7N 160.5E 60 50 203 544<br />
91120300 22 20.4N 161.7E 55 6 137<br />
91120306 23 21.ON 162.9E 50 30 224<br />
91120312 24 21.5N 164.OE 45 37 266<br />
91120318 25 21.9N 164.8E 40 35 262<br />
91120400 26 22.3N 165.3E 35 24<br />
91120406 27 22.8N 165.5E 30 20<br />
91120418 28 23.9N 165.lE 25 66<br />
X-TRACX A-TRACX<br />
Uailz<br />
24s22<br />
-44 -113 -137 -115 -218 37<br />
-63 -146 359<br />
121 -154<br />
-20<br />
-56<br />
-3<br />
168<br />
75<br />
-32 269 127 203<br />
-44 353 110 225<br />
-36 539 200 -74<br />
-17<br />
92<br />
188<br />
247<br />
137<br />
205<br />
189<br />
-89<br />
WIND EllUIS<br />
QQ2!IUU<br />
o 5 15 15<br />
0 -5 10 20<br />
-5 0 10<br />
-lo 0 10<br />
-5 5 10<br />
-5 5 15<br />
-lo 0<br />
-5 5<br />
-5 0<br />
-5 5<br />
-5<br />
0<br />
0<br />
Average 20 133 284 421<br />
# Cases 28 25 21 17<br />
66 131 170<br />
25 21 17<br />
104 224 353<br />
25 21 17<br />
6 9 15 19<br />
28 25 21 17<br />
210
. NORTH INDIAN OCEAN Ocean during 1991. Pre- and post- warning best<br />
This section includes verification track positions are not printed, but are available<br />
statistics for each warning in the North Indian on floppy diskettes upon request.<br />
JTUC FORXCAST TRACK AND INTENSITY BRRORS<br />
BY WMtNING<br />
TROPICAL CYCLONB OIA<br />
WRN BEST TRACK POSITIONERRORS X-TRACK<br />
rrGML Lxr 162NGMNQQQ 24 4B22244Q<br />
91011706 1 3.9N 76.lE 30 51 212 248 273 78 34<br />
91011712 2 3.7N 75.5E 35 84 210 222 -30 2!5<br />
91011718 3 3.6N 75.OE 35 144 258 223 -36 79<br />
91011800 4 3.6N 74.5E 35 183 307 364 25 133<br />
91011806 5 3.6N 74.OE 35 56 45 48 -41 -42<br />
91011812 6 3.9N 73.3E 35 43 155<br />
-60<br />
91011818 7 4.5N 72.3E 35 45 150<br />
-60<br />
91011900 8 4.9N 71.2E 35 85 229<br />
-59<br />
91011906 9 5.lN 69.8E 30 71 92<br />
24<br />
91011912 10 5.lN 68.4E 30 33<br />
91011918 11 5.lN 67.2E 30 38<br />
91012000 12 5.lN 66.OE 30 32<br />
91012006 13 5.3N 65.3E 25 0<br />
2224<br />
97 197<br />
208<br />
257<br />
307<br />
-19<br />
-144<br />
-138<br />
-221<br />
-90<br />
A-TRACX WINO ERRORS<br />
a 2zQQ2.4fl.!i22<br />
246 256 -5 0 15 35<br />
221 -5 5 20<br />
209 0 10 25<br />
339 5 15 25<br />
-24 0 10 25<br />
0 10<br />
00<br />
00<br />
55<br />
0<br />
0<br />
0<br />
0<br />
Average 67<br />
# Cases 13<br />
184<br />
9<br />
221 273 45 62<br />
5195<br />
97 175<br />
19<br />
207<br />
5<br />
256 2 6 22 35<br />
1 13 9 5 1<br />
TROPICAL CYCLONE 02B<br />
WRN<br />
mGNcL<br />
91042418 1<br />
91042500 2<br />
91042506 3<br />
91042512 4<br />
91042518 5<br />
91042600 6<br />
91042606 7<br />
91042612 8<br />
91042618 9<br />
91042700 10<br />
91042706 11<br />
91042712 12<br />
91042718 13<br />
91042800<br />
91042806<br />
91042812<br />
91042818<br />
91042900<br />
91042906<br />
91042912<br />
91042918<br />
91043000<br />
91043006<br />
91043012<br />
91043018<br />
14<br />
15<br />
16<br />
17<br />
18<br />
19<br />
20<br />
21<br />
22<br />
23<br />
24<br />
25<br />
BEST TRACK<br />
IAXU2NQ$.!UNQ<br />
10.2N 89.lE 35<br />
10.7N 88.8E 35<br />
11.ON 88.4E 40<br />
11.2N 88.OE 40<br />
11.3N 87.7E 45<br />
11.4N 87.4E 50<br />
11.6N 87.2E 50<br />
11.9N 87.3E 55<br />
12.2N 87.4E 60<br />
12.7N 87.!jE65<br />
13.3N 87.4E 75<br />
13.9N 87.4E 80<br />
14.5N 87.4E 85<br />
15.ON<br />
15.6N<br />
16.4N<br />
17.3N<br />
18.3N<br />
19.4N<br />
20.6N<br />
21.9N<br />
23.2N<br />
24.2N<br />
25.ON<br />
25.7N<br />
87.6E 90<br />
87.9E 95<br />
88.4E 100<br />
88.9E 110<br />
89.4E 120<br />
89.9E 130<br />
90.7E 140<br />
91.6E135<br />
93.OE110<br />
94.8E 85<br />
97.OE 60<br />
99.7E 40<br />
POSITIONERRORS X-TRACK A-TRACX<br />
Q!224a1229.4i12<br />
Z&z<br />
48 131 120 197 65 -12 -129 -114 -120 -149<br />
26 18 82 168 18 -82 -168 6 -6 7<br />
42 163 306 348 -123 -242 -348 109 189 -4<br />
75 259 333 359 -174 -223 -350 193 248 83<br />
25 119 189 303 -99 -185 -277 66 37 -124<br />
21 106 217 422 -105 -198 -293 -18 -89 -305<br />
29 149 287 511 -135 -147 -335 -65 -247 -387<br />
36 125 267 .533 -53 -62 -148 -114 -260 -513<br />
41 136 304 574 -64 -87 -92 -120 -292 -568<br />
60 164 364 683 -53 -68 75 -156 -359 -679<br />
11 96 323 722 -15 -121 175 -95 -300 -701<br />
33 135 298 609 -134 -189 1 -19 -230 -610<br />
23 127 274 601 -105 -136 10 -73 -238 -602<br />
26 165 409 -71 9 -150 -409<br />
18 99 315 -68 52 -73 -311<br />
8 79 246 10 53 -79 -241<br />
0 58 213 13 43 -57 -209<br />
8 “ 88<br />
-20<br />
-86<br />
5 169<br />
-4<br />
-170<br />
16 202<br />
-3<br />
-202<br />
20 277<br />
-50<br />
-273<br />
35<br />
48<br />
54<br />
65<br />
WIND ERRORS<br />
M244Q12<br />
-5 0 0 -20<br />
-5 -5 -5 -25<br />
-5 0 -lo -45<br />
05 0 -60<br />
0500<br />
-5 0 0 -35<br />
-5 -lo -5 -45<br />
-5 -lo -lo -40<br />
-5 -10 -15 -25<br />
-5 -15 -25 0<br />
-15 -20 -40 15<br />
-lo -lo -50 10<br />
0 -lo -45 40<br />
0 -30 -25<br />
-5 -35 5<br />
-5 -50 0<br />
0 -30 0<br />
-5 10<br />
0 20<br />
0 45<br />
0 45<br />
20<br />
25<br />
20<br />
10<br />
Average<br />
# Cases<br />
31 136<br />
25 21<br />
267<br />
17<br />
2<br />
464 65 112 184 106 222 364 6 17 14 28<br />
13 21 17 13 21 17 13 25 21 17 13<br />
1
TROPICAL CYCMm 03B<br />
WRN BEST TRACK POSITIONERRORS<br />
mu N& W JQNrz MIQQQ a u lz<br />
91053112 1 16.lN 88.8E 25 29 103 162<br />
91053118 2 16.9N 89.lE 30 52 73 171<br />
91060100 3 17.8N 89.4E 30 29 40 221<br />
91060106 4 18.7N 89.7E 35 33 126<br />
91060112 5 19.8N 90.lE 40 17 108<br />
91060118 6 20.9N 90.5E 4!5 8 55<br />
91060200 7 22.lN 91.OE 50 0 132<br />
91060206 8 23.5N 91.8E 45 12<br />
91060212 9 24.8N 92.9E 35 28<br />
91060218 10 25.7N 94.5E 30 0<br />
Average 21 91 184<br />
# Cases 10 7 3<br />
X-TRACX A-TRACK<br />
aalzz!laz<br />
-91 -17 -49 -161<br />
-67 -11 -29 -171<br />
-32 -20 -26 -221<br />
28 -123<br />
46 -99<br />
28 -48<br />
-21 -131<br />
44 16 72 184<br />
73 73<br />
WIND ERRORS<br />
QQa4i12<br />
o 0 15<br />
-5 0 20<br />
0 0 10<br />
0 10<br />
0 15<br />
0 10<br />
0 10<br />
0<br />
5<br />
0<br />
1 6 15<br />
10 7 3<br />
TROPICAL CYCLONE 04B<br />
WRN BEST TRACK POSITIONERRORS<br />
m m<br />
91111406 1<br />
x xQN.!3mN129Q<br />
11.lN 81.4E 35 24<br />
24<br />
21<br />
*<br />
43<br />
X<br />
91111412 2 11.ON 80.9E 35 76 93 114<br />
91111418 3 11.ON 80.3E 40 21 61<br />
91111500 4 11.lN 79.6E 40 29 96<br />
91111506 5 11.4N 78.9E 35 11 61<br />
91111512 6 11.7N 78.2E 25 5 34<br />
91111518 7 12.ON 77.7E 20 21<br />
91111600 8 12.3N 77.lE 20 108<br />
x-mm<br />
24%22<br />
4 -32<br />
-63 -114<br />
-32<br />
-64<br />
-48<br />
-13<br />
A-TRACK<br />
Z&lz<br />
21 -30<br />
69 2<br />
-52<br />
-72<br />
-38<br />
-32<br />
WIND ERRORS<br />
QQZ.4SZ<br />
o 0 15<br />
0 0 10<br />
-5 5<br />
-5 5<br />
0 10<br />
10 10<br />
15<br />
10<br />
Average 37 61 78<br />
#Cases 8 6 2<br />
37 73 47 16 6 5 13<br />
62 62 862<br />
212
c. SOUTHERN HEMISPHERE<br />
This section includes verification 1990 to 30 June 1991. Pre- and post- warning<br />
statistics for each warning in the South Indian best track positions are not printed, but are<br />
and western South Pacilic Oceans from 1 July available on floppy diskettes upon request.<br />
<strong>JTWC</strong>FOR3ZAST TRUK AND INTEWSITY ERRORS BY WARNING<br />
TROPICAL CYCLONE 01S<br />
WRN BEST TRACK<br />
m NQ U& mm<br />
90092100 1 6.5S 71.3E 30<br />
90092112 2 7.2S 70.lE 30<br />
90092200 3 7.9S 68.7E 30<br />
90092212 4 8.5S 66.9E 30<br />
90092300 5 8.8S 65.4E 30<br />
90092312 6 8.5S 63.9E 30<br />
90092400 7 8.6S 61.9E 30<br />
90092412 8 8.7S 60.2E 30<br />
90092500 9 8.7S 58.7E 30<br />
90092512 10 8.7S 57.2E 25<br />
POSITIONERRORS<br />
Q2us12<br />
29 131 207<br />
16 29 37<br />
0 48 128<br />
13 78 134<br />
38 115 200<br />
29 42 128<br />
23 36<br />
16 98<br />
18<br />
5<br />
X-TRACK<br />
as<br />
77 151<br />
17 -4<br />
-13 -89<br />
-75 -126<br />
-92 -180<br />
-42 -114<br />
-36<br />
-96<br />
A-TRAC2(<br />
12z!i &12<br />
-107 -142<br />
-25 -37<br />
-47 -93<br />
-22 -47<br />
70 88<br />
-6 59<br />
0<br />
24<br />
WIND ERRORS<br />
QQ2flflQ12<br />
055<br />
055<br />
055<br />
055<br />
055<br />
0 5 10<br />
05<br />
05<br />
0<br />
0<br />
Average<br />
# Cases<br />
19 72 139<br />
10 8 6<br />
TROPICAL CYCLONE 02S<br />
WRN BEST TRACK POSITIONENORS<br />
m n<br />
90101806 1<br />
Uixb lQkKiklxNQ QQM*ZZ<br />
7.0S 71.OE 30 60 218 307<br />
90101818 2 6.8S 70.4E 30 17 48<br />
90101906 3 6.7S 69.8E 25 6 81<br />
90101918 4 6.9S 69.2E 25 30<br />
90102006 5 7.2S 68.5E 20 0<br />
56 110 37 77<br />
86 86<br />
X-TRACK A-TRACK<br />
24*2224%22<br />
208 77 67 297<br />
42 24<br />
59 56<br />
056<br />
10 8 6<br />
WIND ERRORS<br />
QQaalz<br />
o 10 15<br />
0 10<br />
55<br />
5<br />
5<br />
Average<br />
# Cases<br />
23 115 307<br />
531<br />
103 77 49 297<br />
31 31<br />
3 8 15<br />
531<br />
TROPICAL CYCLONB 03P (SINA)<br />
WRN SEST TRACK POSITIONERRORS<br />
12113 IIQ m zQNCal!lmR QQz4*lz<br />
90112412 1 10.3S 174.OE 30 17 55 80<br />
90112500 2 11.0S 173.2E 35 41 201 426<br />
90112512 3 12.1S 173.OE 45 11 111 294<br />
90112600 4 13.4S 173.OE 65 0 100 318<br />
90112612 5 15.1S 173.8E100 0 69 309<br />
90112700 6 16.6S 174.8E125 18 184 415<br />
90112712 7 18.1S 176.7E125 0 108 254<br />
90112800 8 18.8S 179.3E115 8 46<br />
X-TRACK A-TRACK<br />
Z4axiz!lfiz<br />
-12 81 54 -8<br />
199 294 -35 -309<br />
89 93 -67 -279<br />
68 86 -75 -307<br />
41 172 -56 -257<br />
122 217 -138 -355<br />
84 129 -68 -219<br />
15 -44<br />
WIND ERRORS<br />
QQ2!13,Q22<br />
o 0 -40<br />
0 -15 -60<br />
0 -35 -50<br />
0 -40 -20<br />
-20 -35 -1.0<br />
-40 -20 5<br />
-5 10 25<br />
-5 15<br />
Average<br />
# Cases<br />
12 109 299<br />
887<br />
77 153 67 247<br />
87 87<br />
9 21 30<br />
887<br />
TROPICAL CYCLONE 04S<br />
wm BEST TRACK<br />
U& muuuml!um<br />
90120300 1 14.2S 78.3E 50<br />
POSITIONERRORS<br />
QQ2.4ti12<br />
8 155<br />
X-TRKX A-TRACK<br />
24* 12 24 4Q12<br />
-73 138<br />
WIND ERRCRS<br />
4s!24 -22<br />
-15 -lo<br />
213
TROPICAL CYCLONE O4S (CONTINUED)<br />
WRN BEST TRACK POSITIONERRORS x-mm A-TRACK WIND ERRORS<br />
Dl!2 m u 3,Qw I!uNDQQ 2A * 224 a 22 z * lz Q!2Z9,4.QU<br />
90120312 2 15.4S 79.9E 55 29 -lo<br />
90120400 3 16.3S 80.7E 35 49 0<br />
Average 29 155 73 138 8 10<br />
# Cases 3 1 1 1 31<br />
TROPICAL CYCLONE 05S (LAURliNCE)<br />
WAN BEST TRACK POSITIONERRORS X-TRAC2( A-TRACX WIND ERR(RS<br />
II& N& x l&mluN12QQ 29.s 22 2.4 * 12 % M Z 9Qa&12<br />
90121100 1 13.3S 128.7E 30 18 25 15 20 0 10<br />
90121112 2 13.8S 128.2E 30 8 72 -61 -40 0 -5<br />
90121200 3 13.9S 127.6E 35 26 0<br />
90121212 4 13.2s 126.9E 30 26 -5<br />
Average 19 49 38 30 18<br />
# Cases 4 2 2 2 42<br />
TROPICAL CYCLONE 06P (JOY)<br />
WRN BEST TRACK<br />
Izl12 NQ&uSzl&lx2J!uM!<br />
90121818 1 12.8S 154.9E 30<br />
90121906 2 12.5S 152.7E 30<br />
90121918 3 12.3s 151.3E 40<br />
90122006 4 12.2S 150.2E 50<br />
90122018 5 12.9S 149.4E 55<br />
90122118 6 14.6S 147.7E 60<br />
90122206 7 15.3s 147.2E 70<br />
90122218 8 15.8S 146.8E 85<br />
90122306 9 16.1s 146.6E 90<br />
90122318 10 16.3S 146.7E 90<br />
90122406 11 16.6s 146.9E 80<br />
90122418 12 16.9S 147.3E 70<br />
90122506 13 17.2s 147.7E 55<br />
90122518 14 17.7s 148.OE 45<br />
90122606 15 18.8s 147.5E 45<br />
90122618 16 19.5s 146.5E 35<br />
POSITIONERRORS X-TRACK<br />
QQaulzaax<br />
46 173 186 -140 -131<br />
21 50 157 -19 129<br />
21 42 152 39 134<br />
29 74 146 44 76<br />
29 122 178 76 151<br />
18 77 176 75 172<br />
8 66 161 60<br />
5 61 161 11 40<br />
13 64 175 34 68<br />
11 64 177 57 136<br />
6 53 74 40 2<br />
16 65 38 63 18<br />
24 74 82 -74 -67<br />
18 149 -120<br />
28 103 -101<br />
37<br />
A-TRACK<br />
2448X<br />
-103 133<br />
47 91<br />
18 -71<br />
-59 -126<br />
-96 -95<br />
18 37<br />
66 -162<br />
60 156<br />
54 162<br />
30 115<br />
36 74<br />
18 -18<br />
-10 48<br />
-89<br />
25<br />
WINO ERRORS<br />
QQz!i M22<br />
o 5 20<br />
0 -lo 0<br />
5 10 20<br />
0 20 15<br />
5 15 -5<br />
0 -lo -40<br />
-5 -20 -25<br />
00-5<br />
0 -5 -5<br />
055<br />
0155<br />
5 15 10<br />
0 0 15<br />
00<br />
00<br />
0<br />
Average 21 82 143 59 87 48 99 1 9 13<br />
# Cases 16 15 13 15 13 15 13 16 15 13<br />
TROPICAL CYCLONE 07S (ALISON)<br />
WFN BEST TRACK POSITIONERRORS<br />
Dm u m Ii21KumRQQ A mu<br />
91011206 1 10.3S 82.8E 25 21 71 164<br />
91011212 2 10.7S 82.7E 25 45 84 208<br />
91011218 3 11.0S 82.3E 25 8 42 153<br />
91011300 4 11.3s 81.9E 30 18 21 168<br />
91011306 5 11.4S 81.4E 30 11 152 399<br />
91011312 6 11.4S 81.2E 30 35 173 416<br />
91011318 7 11.5s 81.lE 35 8 132 402<br />
91011400 8 11.6s 80.9E 45 8 148 396<br />
91011406 9 11.9s 80.8E 45 18 200 442<br />
91011412 10 12.4S 80.9E 45 32 197 423<br />
91011418 11 12.9s 81.lE 55 29 60 170<br />
91011500 12 13.4S 81.3E 65 29 56 111<br />
91011512 13 15.4S 82.OE 65 11 105 207<br />
X-TRACX A-TRACK<br />
z!l%lza~lz<br />
16 164 70 1<br />
82 206 -18 -35<br />
23 152 36 -17<br />
18 152 12 -71<br />
153 322 -5 -237<br />
170 375 -35 -182<br />
112 317 -72 -249<br />
123 275 -84 -286<br />
95 292 -177 -333<br />
129 227 -149 -358<br />
57 -167 18 32<br />
52 -90 -24 -66<br />
-91 -188 -54 -88<br />
214<br />
WIND FRR-<br />
QQafiz<br />
055<br />
055<br />
00-5<br />
0 -5 -lo<br />
050<br />
050<br />
-5 -5 0<br />
-lo -15 0<br />
0 -5 0<br />
0 -5 5<br />
-lo -lo -lo<br />
-15 0 -5<br />
0 15 30
TROPICAL CYCLONE 07S (ALISON) (CONTINUED)<br />
WRN BEST TRACK POSITIONERRORS X-TRACK<br />
U& NQ&uXEsQNGluNQQQz* 12z44ul12<br />
91011600 14 17.4S 82.2E 65 23 112 173 -95 -170<br />
91011612 15 19.9S 82.lE 60 32 88 –28<br />
91011700 16 22.1S 82.OE 50 89 229 –104<br />
91011712 17 24.2S 82.3E 40 16<br />
91011800 18 26.3S 83.8E 30 44<br />
Average 26 117 274 84 221<br />
# Cases 18 16 14 16 14<br />
A-TRACK<br />
214il.2<br />
-59 -36<br />
-84<br />
204<br />
68 142<br />
16 14<br />
WIND ERRORS<br />
Q!2au12<br />
o 10 15<br />
5 10<br />
5 15<br />
0<br />
0<br />
376<br />
18 16 14<br />
TROPICAL CYCLONE 08S (BELLA)<br />
m BEST TRACK POSITIONERRORS x-ma<br />
QTGNQA<br />
XQKEXNQ9Q 24% 3.ZZA*22ZA4Q<br />
91012000 1 9.9s 81.8E 30 26 262 394 224 244<br />
91012012 2 11.1s 81.9E 30 8 105 70 82 24<br />
91012100 3 12.6S 82.5E 30 46 16 62 14 -57<br />
91012112 4 13.9s 82.6E 30 18 183 321 -114 -244<br />
91012200 5 14.4s 81.8E 30 54 82 62 1 -61<br />
91012212 6 14.5s 80.7E 30 43 58 72 -56 -68<br />
91012300 7 14.4s 79.7E 35 11 70 162 -8 -37<br />
91012312 8 14.2S 78.lE 35 36 147 255 -38 -79<br />
91012400 9 14.1s 76.OE 40 8 39 84 11 71<br />
91012412 10<br />
91012500 11<br />
91012512 12<br />
91012600 13<br />
14.2S<br />
14.5s<br />
15.0s<br />
15.6S<br />
73.7E 45<br />
71.5E 45<br />
69.3E 40<br />
67.6E 40<br />
34<br />
69<br />
134<br />
154<br />
88<br />
188<br />
330<br />
312<br />
74<br />
245<br />
555<br />
412<br />
12<br />
-155<br />
329<br />
311<br />
-17<br />
193<br />
163<br />
412<br />
91012612 14<br />
91012700 15<br />
91012712 16<br />
91012800 17<br />
16.3S<br />
16.8s<br />
17.2S<br />
17.4s<br />
66.9E 40<br />
66.5E 45<br />
65.9E 55<br />
65.2E 65<br />
69<br />
52<br />
13<br />
20<br />
79<br />
91<br />
132<br />
124<br />
219<br />
232<br />
270<br />
170<br />
-69 -205<br />
-17 -229<br />
-109 -267<br />
-89 -136<br />
91012812 18<br />
91012900 19<br />
91012912 20<br />
91013000 21<br />
91013012 22<br />
91013100 23<br />
91013112 24<br />
91020100 25<br />
17.3s<br />
17.2S<br />
17.4s<br />
18.0s<br />
18.5S<br />
19.4s<br />
20.9S<br />
22.4s<br />
64.5E 75<br />
63.3E 95<br />
62.2E 120<br />
61.7E 130<br />
61.8E 120<br />
62.9E 110<br />
63.5E 85<br />
63.5E 65<br />
18<br />
13<br />
11<br />
28<br />
34<br />
12<br />
8<br />
8<br />
23<br />
50<br />
98<br />
211<br />
216<br />
72<br />
48<br />
38<br />
135<br />
279<br />
328<br />
389<br />
302<br />
141<br />
168<br />
141<br />
2<br />
40<br />
24<br />
165<br />
198<br />
11<br />
49<br />
-37<br />
47<br />
183<br />
312<br />
381<br />
302<br />
34<br />
98<br />
-64<br />
91020112 26 23.8S 63.OE 55 27 103 223 -102 -157<br />
91020200 27<br />
91020212 28<br />
91020300 29<br />
91020312 30<br />
91020400 31<br />
25.1S<br />
26.9s<br />
29.4S<br />
32.1S<br />
34.1s<br />
62.IE 50<br />
61.3E 45<br />
60.8E 45<br />
60.7E 40<br />
62.6E 35<br />
21<br />
28<br />
31<br />
6<br />
7<br />
104<br />
156<br />
61<br />
75<br />
262<br />
197<br />
-21<br />
-72<br />
-5<br />
5<br />
-77<br />
-73<br />
A-TRACK WIND ERRORS<br />
2ZJQ2.4MZ2<br />
-137 310 o 10 20<br />
-66 67 005<br />
9 -25 000<br />
-143 -210 055<br />
-82 13 00!5<br />
17 -23 055<br />
-70 -158 -5 -5 -5<br />
-142 -243 -5 -lo 0<br />
-38 -47 0 S 25<br />
-88 -72 -5 5 10<br />
106 152 -5 -5 -lo<br />
-32 532 -5 -5 -20<br />
-32 14 0 -lo -30<br />
41 -77 -5 -25 -50<br />
90 -40 0 –20 -60<br />
-76 -45 0 -25 -80<br />
-87 103 0 -45 -90<br />
24 -127 0 -45 -55<br />
-30 -212 -15 -55 -45<br />
-95 -103 10 10 45<br />
-131 -82 5 15 50<br />
-88 -lo 10 35 60<br />
-72 -138 5 25 25<br />
-2 -137 5155<br />
-12 -126 0 -5 -lo<br />
-17 -160 0 -5 -lo<br />
-102 -251 -5 -lo -5<br />
-139 -184 0 -5 0<br />
61<br />
00<br />
75<br />
55<br />
0<br />
Average 34 119 222<br />
# Ceses 31 30 28<br />
79 146<br />
30 28<br />
70 129<br />
30 28<br />
3 13 25<br />
31 30 28<br />
TROPICAL CYCLONE 09s {CHRIS)<br />
WRN BEST TRACK POSITIONERRORS x-mm<br />
A-TRACK WIND ERRORS<br />
QTG m I&r. u2tiGlmQQQ 24. *Z 24 a 22 24 u lz 9.Q2!LAQ22<br />
91021612 1 15.2S 120.8E 30 34 127 150 127 -39 - 0 146 550<br />
91021700 2 15.4S 121.OE 35 26 62 116 -46 -68 -42 -95 005<br />
91021712 3 15.6S 121.OE 40 21 67 269 -60 -150 -31 -224 0 0 10<br />
91021800 4 15.5s 120.6E 45 6 169 285 -17 -138 -168 -250 0 5 20<br />
91021812 5 15.5S 119.6E 50 21 162 144 -40 -36 -157 -140 0 15 30<br />
91021900 6 15.7S 116.9E 50 29 53 110 29 -2 45 110 0 5 25<br />
215
TROPICAL CYCLONE 09S (CHRIS) (CONTINUED)<br />
WRN BEST TRACK POSITIONERRORS<br />
IuG NQUU. UUGH. UU2QQZ4*<br />
91021912 7 15.6S 115.OE 50 39 74 88<br />
lz<br />
91022000 8 16.0S 113.4E !50 29 136 227<br />
91022012 9 16.3S 112.3E 40 40 54 93<br />
91022100 10 16.4S 111.lE 35 5 75 271<br />
91022112 11 16.2S 109.9E 30 0 132<br />
91022206 12 16.3S 109.4E 30 5 175<br />
91022218 13 16.6S 109.5E 30 6<br />
91022312 14 17.0S 111.7E 20 6<br />
X-TWKX<br />
2!i4a12<br />
74 –81<br />
-53 -200<br />
46 80<br />
-69 89<br />
132<br />
-8<br />
A-TRACK<br />
24fM22<br />
6 36<br />
126 -110<br />
-30 48<br />
-30 -257<br />
7<br />
-175<br />
WIND ERRORS<br />
QQzAm12<br />
-5 15 35<br />
0 25 40<br />
5 15 15<br />
555<br />
0 -5<br />
0 10<br />
0<br />
0<br />
Average 19 98 175 58 88 68 141<br />
# Cases 14 12 10 12 10 12 10<br />
TROPICAL CYCLONE 10S (CYNTHIA)<br />
WRN BEST TRACK POSITIONERRORS x-ma A-TRACK<br />
QIG m m IQNGUNQQQ 24 s 2224 a 22 u a 2<br />
91021618 1 18.0S 42.2E 35 12 90 76 -48<br />
91021706 2 19.1S 43.6E 45 28 94 73 -60<br />
91021718 3 20.5S 44.7E 45 21<br />
Average 20 92 75 54<br />
# Cases 3 2 2 2<br />
TROPICAL CYCLONE 11S (DAPHNE)<br />
WRN BEST TRACK POSITIONERRORS x-mm A-TRACK<br />
MG ML m ZQNGHZM2QQ 24 fix 24 a 22 B &x<br />
91022200 1 18.5s 122.OE 30 8 73 85 67 84 -32 -17<br />
91022212 2 19.2s 119.8E 35 5 54 126 -38 -39 -39 -120<br />
91022300 3 19.7S 117.4E 50 5 67 156 -6 -6 -67 -156<br />
91022312 4 20.4S 114.8E 55 6 168 461 6 -101 -168 451<br />
91022318 5 20.5S 113.8E 60 24 240 500 -16 -354 -240 354<br />
91022400 6 20.5S 113.OE 60 28 169 218 -139 4 -97 219<br />
91022412 7 20.5S 112.2E 50 0 79 45 79 45 12 6<br />
91022500 8 20.1S 112.3E 40 0 79 281 2 22 -80 -280<br />
91022512 9 20.6S 112.4E 35 17 109 -19 -108<br />
91022600 10 21.7S 111.7E 35 13 173 0 -174<br />
91022612 11 23.4S 11O.7E 30 40<br />
91022700 12 25.3S 108.7E 25 28<br />
Average 14 121 234 37 81 101 200<br />
# Cases 12 10 8 10 8 10 8<br />
TROPICIU CYCLONE 12S (DEBRA)<br />
m BEST TRACK POSITIONERRORS X-TRACK A-TRACK<br />
IzzG NI& m U!NGUNQQQ 24 % lzzfl & lz 2.4 * Z<br />
91022406 1 25.1S 35.7E 40 0 105 243 87 54 -60 -238<br />
91022418 2 25.3S 35.5E 55 17 135 293 -4 -51 -135 -289<br />
91022506 3 25.6S 35.9E 65 49 175 325 -52 -244 -168 -215<br />
91022518 4 25.8S 36.8E 80 26 150 272 90 -116 -121 247<br />
91022606 5 25.5S 37.8E 90 26 140 220 48 -154 -132 158<br />
91022618 6 24.8S 38.6E 90 18 141 228 -125 -202 67 105<br />
91022706 7 24.2S 38.8E 85 26 127 191 -17 44 -126 -186<br />
91022718 8 24.4S 38.4E 75 21 124 171 124 171 -5 -4<br />
91022806 9 25.1S 38.4E 65 12 12 69 -11 21 -6 -66<br />
91022818 10 25.7S 38.4E 55 13 39 66 16 -62 36 24<br />
91030106 11 26.3S 38.4E 55 30 26 160 -11 -89 24 -133<br />
91030118 12 27.1S 38.4E 55 23 68 421 -68 -176 -6 -383<br />
216<br />
1 9 19<br />
14 12 10<br />
WIND ERRORS<br />
L!QM*2Z<br />
00<br />
-5 5<br />
-15<br />
73<br />
32<br />
WIND ERRORS<br />
QQaslz<br />
o -lo -lo<br />
-5 -20 -10<br />
0 5 30<br />
0 15 20<br />
0 25 20<br />
0 20 20<br />
055<br />
0 0 10<br />
00<br />
0 10<br />
0<br />
5<br />
1 11 16<br />
12 10 8<br />
WIND ERRORS<br />
QQ2,4MZ<br />
-5 -30 -50<br />
0 -5 0<br />
000<br />
-5 0 5<br />
0 0 10<br />
0 5 15<br />
5 10 10<br />
-5 15 10<br />
5 15 15<br />
0 -lo -15<br />
0 -5 -15<br />
-5 -lo -15
TROPICAL CYCLONE 12S (DEBRA) (CONTINUED)<br />
WRN EEST TRACK POSITIONERRORS x-ma A-TRACK<br />
m EKLuzu2NG luN12QQfi* Ua*lzz!l*z<br />
91030206 13 27.9S 38.OE 50 12 192 701 -48 -278 -186 -644<br />
91030218 14 29.6S 37.5E 50 35 132 -51 -122<br />
91030306 15 33.2s 37.7E 50 36 386 -212 -324<br />
91030318 16 38.3S 40.4E 50 40<br />
91030406 17 42.9S 46.9E 50 0<br />
Average 22 130 258 64 127 101 207<br />
# Cases 17 15 13 15 13 15 13<br />
TROPICAL CYCLONE 13P (KELVIN)<br />
m BEST TRACX POSITIONERRORS x-mm A-TRACX<br />
RTG a<br />
91022506 1<br />
m uMGkuNQ!2Q<br />
15.3S 149.lE 45 16<br />
z<br />
216<br />
tii!z<br />
584<br />
a M<br />
-217 363<br />
2.Z a &z<br />
4 –458<br />
91022518 2 16.5S 150.5E 55 11 50 203 50 -50 -204<br />
91022606 3 17.3S 150.8E 45 39 278 398 39 106 -276 385<br />
91022618 4 17.9s 150.OE 50 16 205 301 -166 -123 -121 275<br />
91022706 5 15.9S 150.2E 45 8 68 76 64 -75 -24 -12<br />
91022718 6 15.5S 150.5E 45 18 86 132 42 62 75 -118<br />
91022806 7 15.5S 150.8E 45 11 71 35 70 28 18 -590<br />
91022818 8 15.5S 150.4E 35 34 23 41 5 -29 24 -30<br />
91030106 9 15.3S 149.7E 35 53 232 385 232 -382 -22 -54<br />
91030118 10 15.0s 150.OE 35 151 313 -313 8<br />
91030206 11 15.3S 150.lE 40 11 79 145 -58 -104 -54 -102<br />
91030218 12 14.9S 149.8E 40 18 88 141 -52 -98 -72 -102<br />
91030306 13 14.5S 150.2E 45 8 37 108 -29 -75 -24 -78<br />
91030318 14 14.2S 150.3E 45 34 83 90 58 88 -60 -21<br />
91030406 15 14.0S 149.9E 45 13 54 150 -6 79 -54 -128<br />
91030418 16 13.8S 149.5E 35 25 79 54 -58<br />
91030506 17 13.4s 149.4E 35 25 86 42 -76<br />
91030518 18 13.2S 149.8E 35 48<br />
91030606 19 13.2S 150.7E 30 0<br />
Average 28 121 199 86 115 58 136<br />
# Cases 19 17 14 17 14 17 14<br />
WIND ERRORS<br />
QQ2AU22<br />
o -lo -20<br />
-5 -20<br />
0 -5<br />
0<br />
0<br />
2 9 14<br />
17 15 13<br />
WIND EWRXS<br />
QQas12<br />
-lo 0 15<br />
-15 -5 5<br />
0 10 -5<br />
000<br />
0 -5 0<br />
-5 5 0<br />
050<br />
550<br />
5 0 -15<br />
0 -5<br />
-5 -lo -5<br />
-5 -lo 5<br />
005<br />
0 10 10<br />
0 10 15<br />
10 10<br />
05<br />
0<br />
0<br />
365<br />
19 17 14<br />
TROPICAL CYCLONE 14S (ELMA)<br />
WRN BEST TRACX POSITIONERRORS X-TRKK<br />
NQk IAz XQ,NGkuN!J!2Q x * 22 M * 22<br />
91022700 1 13.1S 88.9E 40 11 179 178 -162 -86<br />
91022712 2 14.7S 88.3E 45 18 51 12 45 4<br />
91022800 3 16.1S 87.8E 60 23 82 122 57 28<br />
91022812 4 17.6S 88.2E 60 30 38 50 37 42<br />
91030100 5 19.0s 88.8E 55 12 84 191 76 175<br />
91030112 6 20.2S 89.3E 50 36 118 257 112 199<br />
91030200 7 21.4S 90.3E 45 8 60 102 41 -98<br />
91030212 8 22.5S 91.OE 45 18 119 103<br />
91030300 9 23.5S 92.lE 40 8 132 131<br />
91030312 10 25.0S 93.7E 35 29<br />
A-TRACX<br />
2.44s22<br />
-77 -156<br />
-25 -12<br />
-60 -120<br />
-10 -28<br />
-37 -78<br />
-39 -164<br />
44 -30<br />
-61<br />
-24<br />
WIND ERRORS<br />
QQamz<br />
-5 -5 25<br />
0 5 35<br />
5 35 60<br />
-5 5 10<br />
00-5<br />
0 -5 0<br />
0 -5 -5<br />
-5 -5<br />
0<br />
0<br />
Average 19 96 130 85 90 42 84<br />
# Cases 10 9 7 97 97<br />
2 7 20<br />
10 9 7<br />
217
TROPICAL CYCLONE 15P<br />
WRN MST TRACK POSITIONERRORS X-TRACK A-TRACK WINO ERRORS<br />
RIQ NQ USl IQNGHINQQQ 24 * 12 u m lz 24 S 12 QQUAQ22<br />
91030618 1 18.9S 154.OE 30 8 5<br />
91030706 2 20.1S 153.7E 25 16 10<br />
Average 12 8<br />
# Cases 2 2<br />
TROPICAL CYCLONE 16P<br />
WRN BEST TRACK POSITIONERRORS x-mm’ A-TRACK WIND ERRORS<br />
m m Uu U2NGkumu! 24 %2 a a a z s Z QQzflfilz<br />
91031800 1 16.0S 163.8E 30 11 61 35 -44 9 -43 –35 o 0 10<br />
91031812 2 17.4S 164.lE 30 18 86 82 79 -77 -36 -28 0 0 10<br />
91031900 3 18.9S 164.9E 30 5 54 195 -54 -159 0 -114 5 5 10<br />
91031912 4 19.9S 165.6E 30 43 373 -309 -209 05<br />
91032000 5 20.2S 164.2E 25 91 293 -109 -273 0 -5<br />
Average 34 1-73 104 119 81 112 59 1 3 10<br />
#Cases 5 5 3 53 53 553<br />
TROPICAII CYCLONE 17S (FATIMA)<br />
WRN BEST TRACK POSITIONERRORS x-mm A-TRACK<br />
12TG m Z7u X&!NGNm12QQ 24 4.8 22 24 & z a * 12<br />
91032218 1 7.1S 88.OE 35 18 33 84 -9 22 32 82<br />
91032306 2 7.7S 87.lE 35 29 60 183 20 78 57 166<br />
91032318 3 8.3S 86.OE 40 13 73 157 49 122 55 99<br />
91032406 4 8.9S 85.OE 50 25 41 87 20 76 36 43<br />
91032418 5 9.4S 84.OE 50 11 45 114 22 12 -40 -114<br />
91032506 6 10.0S 82.9E 55 5 63 218 63 159 9 -149<br />
91032518 7 10.7S 81.9E 65 11 89 274 88 268 -18 -57<br />
91032606 8 11.4S 81.OE 80 31 135 363 129 256 -41 -258<br />
91032618 9 12.4S 80.3E 90 18 119 337 116 334 -29 -43<br />
91032706 10 13.6S 80.2E 90 13 116 143 88 67 -77 127<br />
91032718 11 14.8S 80.6E 90 23 32 80 11 -80 30 -2<br />
91032806 12 15.8S 81.3E 90 18 49 147 -34 -50 36 138<br />
91032818 13 16.9S 81.9E 85 38 230 518 -160 -516 -167 51<br />
91032906 14 17.9S 81.7E 85 59 263 493 -260 -484 46 96<br />
91032918 15 18.5S 80.7E 85 24 32 60 22 -2 24 -60<br />
91033006 16 19.0S 79.9E 80 8 202 660 69 129 -190 -648<br />
91033018 17 20.1S 79.6E 75 6 192 716 2 -108 -192 -708<br />
91033106 18 22.3S 79.8E 70 26 232 -16 -232<br />
91033118 19 25.0S 81.2E 65 37 254 -163 -196<br />
91040106 20 28.8S 83.8E 55 7<br />
91040118 21 33.4S 90.OE 45 93<br />
WIND ERRORS<br />
Q!2244.BZ2<br />
o 10 15<br />
10 5 15<br />
555<br />
0 5 -lo<br />
0 -5 -20<br />
-5 -20 -20<br />
-5 -20 -lo<br />
-lo -15 -5<br />
-5 0 0<br />
0 -5 0<br />
000<br />
005<br />
0 -lo -lo<br />
-5 -lo -15<br />
-5 -5 -lo<br />
-15 -15 -15<br />
-15 -lo 0<br />
05<br />
0 10<br />
0<br />
0<br />
Average 24 119 272 68 162 78 160 489<br />
# Cases 21 19 17 19 17 19 17 21 19 17<br />
TROPICAL CYCLONE 18s (ERROL)<br />
WRN BEST TRACK POSITIONERRORS<br />
12zG m m 2QNGW.INRQQ A * 22<br />
91032500 1 10.5S 99.OE 45 21 171 354<br />
91032512 2 10.4S 99.6E 90 il 129 314<br />
91032518 3 10.5S 99.9E 110 8 138 240<br />
91032600 4 10.7S 100.2E110 13 160 260<br />
91032612 5 11.3S 101.OE110 6 51 248<br />
91032700 6 12.2S 101.5E105 13 83 347<br />
91032706 7 12.6S 101.7E100 11 141 422<br />
X-TRACK A-TRACK<br />
24 A8Z2Z4.4Q22<br />
93 347 -144 -69<br />
17 236 -129 -209<br />
95 139 -102 197<br />
106 254 -120 58<br />
-18 -134 -48 -209<br />
-80 -179 -26 -298<br />
-95 -161 -106 -390<br />
218<br />
WIND ERRORS<br />
QQzilax<br />
-10 -65 -45<br />
-40 -20 30<br />
-20 20 55<br />
-10 25 65<br />
-5 10 35<br />
0 20 30<br />
0 30 35
TROPICAL CYCLONE 18S (ERROL) (CONTINUED)<br />
WRN BEST TRACX POSITIONERRORS<br />
El& m IlK2 U2NGHINQQQ 24 * 22<br />
91032712 8 13.9S 101.8E 90 54 204 549<br />
91032718 9 13.3S 101.7E 80 26 235 509<br />
91032800 10 13.6S 101.2E 70 83 349 611<br />
91032806 11 13.9s 100.7E 60 25 188 332<br />
91032812 12 14.3S 99.8E 55 84 246<br />
91032818 13 14.6s 98.8E 50 55 125<br />
91032900 14 15.0S 97.8E 45 11<br />
91032906 15 15.3S 97.OE 40 11<br />
91033000 16 16.0S 94.4E 35 75 124<br />
91033006 17 16.3S 93.6E 35 42 134<br />
91033012 18 16.5S 93.OE 30 35 115<br />
91033100 19 17.0S 91.6E 30 6<br />
A-TRACK<br />
x-ma<br />
244s 22 24 *22<br />
-91 -210 -183 -508<br />
-116 -181 -205 -477<br />
-159 -195 -312 -580<br />
31 -20 -186 -332<br />
48 -241<br />
19 -124<br />
87 -90<br />
54 124<br />
91 71<br />
WIND ERRORS<br />
Q.Qz!lmlz<br />
o 15 15<br />
5 15 15<br />
5 15 10<br />
15 25 25<br />
0 -lo<br />
0 -5<br />
-lo<br />
-5<br />
5 20<br />
55<br />
00<br />
0<br />
Average 31 162 380<br />
# Cases 19 16 11<br />
TROPICAL CYCLONE 19S (MARIAN)<br />
WRN BEST TRACX POSITIONERRORS<br />
12TG m<br />
91041018 1<br />
IAX u2mkmiQQ2<br />
10.0S 126.2E 30 13<br />
am<br />
29 42<br />
n<br />
91041106 2 10.7S 124.8E 35 5 8 58<br />
91041112 3 11.1S 124.2E 45 6 23 113<br />
91041200 4 11.7S 122.9E 65 18 41 66<br />
91041212 5 12.5S 121.2E 75 5 138 281<br />
91041300 6 13.4S 120.3E 85 0 62 191<br />
91041312 7 14.0S 120.lE 90 13 132 200<br />
91041400 8 13.9s 119.5E 95 12 141 128<br />
91041412 9 13.6s 120.OE 85 5 30 148<br />
91041500 10 13.9S 120.5E 70 11 134 236<br />
91041512 11 14.2S 119.5E 60 96 293 446<br />
91041600 12 14.2S 117.8E 50 0 16 8<br />
91041612 13 14.6S 116.2E 45 31 126 119<br />
91041700 14 15.1S 114.8E 45 6 59 220<br />
91041712 15 15.8S 113.6E 40 32 181<br />
91041800 16 16.7S 112.6E 35 20 142<br />
91041812 17 19.1S 111.lE 30 18<br />
91041900 18 22.1S 109.7E 25 35<br />
Average 18 97 161<br />
# Cases 18 16 14<br />
TROPICAL CYCLONE 20S (FIFI)<br />
m BEST TRACK POSITIONERRORS<br />
QzG m IllSl xQNGNIN12QQ 2.4 *U<br />
91041600 1 12.4s 102.2E 30 8 5 133<br />
91041612 2 12.5S 102.1E 30 26 90 188<br />
91041700 3 12.8S 102.1E 35 11 150 305<br />
91041712 4 14.2s 102.2E 45 8 5 100<br />
91041800 5 15.7s 102.3E 55 8 74 300<br />
91041812 6 17.3S 102.8E 55 0 73 256<br />
91041900 7 19.5S 103.6E 55 0 92<br />
91041912 8 22.3S 105.2E 50 17 39<br />
91042000 9 26.2S 107.1E 45 49 275<br />
Average 14 89 214<br />
#Cases 9 9 6<br />
75 186 138 302<br />
16 11 16 11<br />
X-TRACK A-TRACK<br />
244ai!2 24 M 22<br />
6 -24 -29 -36<br />
-3 58 -8 0<br />
22 105 -10 -42<br />
-41 -55 6 -37<br />
134 53 -35 -276<br />
-59 133 -19 139<br />
124 -198 -48 33<br />
128 -106 61 73<br />
-29 -98 -9 -112<br />
-71 -156 -114 -177<br />
-36 -194 -292 -403<br />
58 -16 -1<br />
46 110 118 47<br />
59 46 7 -216<br />
99 -152<br />
-34 -138<br />
56 96 66 113<br />
16 14 16 14<br />
X-TRACK A-TRACK<br />
2.4a 12z!l Aa22<br />
o 18 -6 -132<br />
87 105 -24 -156<br />
0 -81 -150 -295<br />
5 18 -2 -99<br />
22 35 -71 -298<br />
4 -71 -74 -246<br />
-18 -91<br />
-34 -19<br />
-15 275<br />
20 54 79 204<br />
96 96<br />
7 19 33<br />
19 16 11<br />
WIND ERRORS<br />
QQM*E<br />
o -5 -15<br />
0 -15 -15<br />
-5 -lo 0<br />
10 20 25<br />
005<br />
5 5 40<br />
0 0 15<br />
-5 10 15<br />
055<br />
15 15 5<br />
15 20 10<br />
0 -5 -5<br />
0 -5 -5<br />
0 -5 0<br />
00<br />
00<br />
0<br />
0<br />
3 8 11<br />
18 16 14<br />
WIND ERRORS<br />
QQzfilz<br />
o 5 -lo<br />
0 -5 -lo<br />
5 0 -lo<br />
-5 0 -5<br />
0 10 10<br />
5100<br />
0 -5<br />
0 -15<br />
0 10<br />
278<br />
996
TROPICAL CYCLONE 21P (LISA)<br />
m BEST TRACK POSITIONERRORS x-TRACK A-TRACK WIND ERRORS<br />
QTG nxluz&kKi kuliQQQa3f! zz24. *12iM412s!Q afi 12.<br />
91050712<br />
91050800<br />
91050812<br />
91050900<br />
91050912<br />
91051000<br />
91051012<br />
91051100<br />
91051112<br />
91051200<br />
91051212<br />
1<br />
2<br />
3<br />
4<br />
5<br />
6<br />
7<br />
8<br />
9<br />
10<br />
11<br />
8.3S 155.OE<br />
9.7s K54.4E<br />
11.1S 153.9E<br />
12.4s 154.2E<br />
13.6S 154.8E<br />
14.8s 155.8E<br />
16.0s 157.2E<br />
17.0S 159.3E<br />
18.1s 161.7E<br />
18.6S 163.9E<br />
19.3S 167.3E<br />
30 17 135 158 -136 ‘-- -139 “--<br />
35 36 86 141 76 141<br />
45 0 106 184 96 138<br />
55 18 107 222 91 172<br />
60 12 46 70 26 25<br />
70 11 83 82 82 74<br />
65 24 120 270 30 17<br />
60 23 83<br />
15<br />
50 128 486<br />
35<br />
40 21 299<br />
-49<br />
30 94<br />
--- _<br />
-lZ 76<br />
42 -5<br />
-45 -123<br />
-56 -140<br />
-38 66<br />
12 37<br />
117 270<br />
82<br />
486<br />
-296<br />
0 -5 0<br />
0 0 -20<br />
0 0 -15<br />
0 -5 -lo<br />
5 -5 -5<br />
505<br />
5 -5 10<br />
55<br />
5 10<br />
0 -5<br />
0<br />
Average 35 155 161<br />
# Cases 11 10 7<br />
63 100 118 102<br />
10 7 10 7<br />
249<br />
11 10 7<br />
TROPICAL CYCLONE 22S (GRITELLE)<br />
WRN BEST TRACK POSITIONERRORS<br />
ME m Uil U2NGWXNR!2Q 24 *U<br />
91060812 1 10.0S 72.4E 30 6 121 205<br />
91060900 2 9.9s 71.3E 30 45 129 247<br />
91060912 3 10.0S 70.5E 35 47 108 175<br />
91061000 4 10.8s 69.3E 40 16 60 171<br />
91061012 5 11.1S 68.6S 35 8 42 143<br />
91061100 6 11.2S 67.7E 35 13 87 200<br />
91061112 7 11.4S 67.lE 35 30 88<br />
91061200 8 11.5S 66.6E 30 31 147<br />
91061212 9 11.5S 66.2E 25 0<br />
X-TRACK<br />
244a12<br />
10 -3<br />
77 15<br />
74 171<br />
20 170<br />
35 111<br />
82 187<br />
88<br />
147<br />
A-TRACX<br />
24%22<br />
122 206<br />
104 247<br />
80 -41<br />
57 19<br />
24 90<br />
30 73<br />
0<br />
13<br />
WIND ERRORS<br />
3K!24AQ22<br />
o 5 15<br />
5 10 35<br />
5 25 40<br />
0 15 30<br />
5 20 15<br />
000<br />
05<br />
00<br />
5<br />
Average 22 98 190 66 109 53 112<br />
#Cases 9 8 6 86 86<br />
2 10 23<br />
986<br />
220
7. TROPICAL CYCLONE SUPPORT SUMMARY<br />
7.1 A TROPICAL CYCLONE WIND<br />
SCALE FOR THE TROPICAL<br />
PACIFIC<br />
LtCol Charles P. Guard<br />
Joint Tj@mon Warning Center, Guam<br />
<strong>JTWC</strong> has developed a tropical cyclone<br />
wind scale for the tropical Pacific fashioned<br />
after the Saffir-Simpson Hurricane Scale ustid<br />
in the Atlantic. The scale relates tropical<br />
depression, tropical storm, typhoon, and super<br />
typhoon wind speeds to potential damage, and<br />
indicates the expected effects of coastal waves<br />
and surf. The scale considers wind effects on<br />
structures and vegetation common to the<br />
tropical Pacific region. It also considers the<br />
effects of coral reefs on storm surge and wave<br />
action. This wind scale is being passed to all<br />
tropical cyclone warning centers and to the<br />
general public throughout Micronesia, so that<br />
the population can better understand the<br />
potential impact of the wind speeds it receives<br />
in tropical cyclone warnings.<br />
7.2 TROPICAL CYCLONE INTENSITY<br />
FORECASTING<br />
Joint Typhoon Warning Center, Guam<br />
Over the last two years, <strong>JTWC</strong> has<br />
placed considerable emphasis on improving<br />
tropical cyclone intensity forecasts. The results<br />
have been very encouraging. Techniques are<br />
based on: (1) the work of Mundell (1990),<br />
which relates the potential for rapid or<br />
explosive deepening to current intensity at a<br />
specific latitude, other location criteria, and<br />
month; (2) locally developed rules-of-thumb<br />
that consider the relationship of a tropical<br />
cyclone to multiple outflow channel<br />
mechanisms, such as a combination of mid-<br />
221<br />
latitude troughs, TUTT-cells, and uppertropospheric<br />
channels to the subtropical jet<br />
strew (3) conditional climatology applications<br />
that allow specific stratification of current<br />
cyclone characteristics to determine the most<br />
likely average, maximum, and minimum<br />
intensity values at various forecast periods; and,<br />
(4) meteorological satellite interpretation of<br />
conditions favorable for intensification or<br />
weakening, such as vertical shear, TUTT-cell<br />
movements, and pixel-counting techniques by<br />
Capt Shoemaker as indicated in section 7.12.<br />
The Naval Research Laboratory at Monterey,<br />
California will adapt the intensity forecast<br />
model used in the Atlantic to the Pacific to help<br />
<strong>JTWC</strong> assess its skill.<br />
73 HYBRID FORECAST AIDS<br />
Capt Dan B. Mundell, USAF.<br />
Joint T~hoon Warning Center, Guam<br />
“Hybrid” forecast aids are defined as a<br />
blend of two or more existing forecast aids, and<br />
may provide better guidance for the tropical<br />
cyclone forecaster than any of the single aids<br />
upon which the hybrid is based. Since it is<br />
often difilcult to determine the “best” aid for<br />
each warning, hybrids help reduce the chances<br />
for very large errors in difficult forecast<br />
situations by weighting the forecast guidance<br />
toward the (historically) best-perfoming aids.<br />
Verification statistics of objective<br />
techniques from 1986 to 1991 were used to<br />
determine the best- and worst-performing aids<br />
in the western North Pacific over a six-year<br />
period. A set of regression equations was<br />
developed, weighted more heavily toward<br />
techniques with the lowest overall forecast<br />
errors.<br />
The fwst hybrid, called BLND, weights<br />
nine separate forecast aids (OTCM, CSUM,
FBAM, CLIP, HPAC, TOTL, RECR, CLIM and<br />
XTRP) relative to their average errors at 24-,<br />
48- and 72-hours. The second termed WGTD,<br />
is biased toward the dynamic aids OTCM,<br />
CSUM and FBAM, which are weighted twice<br />
as much as the climatological aids CLIP, HPAC,<br />
TOTL and RECR.<br />
7.4 EXTENSION OF CONDITIONAL<br />
CLIMATOLOGY DATA BASE<br />
Capt Dan B. Mundell, USAF<br />
Joint T~hoon Warning Center, Guam<br />
The Joint Typhoon Warning Center’s<br />
conditional climatology data base for the<br />
western North Pacific, which is used to identify<br />
climatological analogs and derive long-range<br />
intensity forecasts, has been updattxl to include<br />
best track positions prior to the issuance of the<br />
first warning and extratropical or dissipating<br />
cyclone positions after the fhxd warning. This<br />
allows <strong>JTWC</strong> forecasters to pinpoint suitable<br />
analogs and determine the most likely rate of<br />
intensity change earlier than previously<br />
possible.<br />
In addition, best track intensities have<br />
been adjusted to agree more closely with<br />
dropsonde measurements of minimum sea-level<br />
pressure, when available. This adjustment<br />
provides greater consistency within the data set<br />
because the Atkinson-Holliday (1977) wind and<br />
pressure relationship was applied equally as a<br />
basis for estimates of maximum sustained<br />
winds.<br />
7s LATITUDINAL RELATIONSHIP<br />
OF TROPICAL CYCLONE PEAK<br />
INTENSITY AND PEAKING DAY<br />
Capt Dan B. Mundell, USAF<br />
Joint Typhoon Warning Center, Guam<br />
Two of the most difficult aspects of<br />
tropical cyclone intensity forecasting are the<br />
222<br />
peak intensity and the point in time when the<br />
anticipated peak intensity will be reached. A<br />
high correlation exists between the latitude of<br />
initial upgrade to tropical storm and peak<br />
intensity in the western North Paciiic Ocean<br />
(Figure 7- 1A), and between the latitude of<br />
initial upgrade to typhoon and the peak intensity<br />
attained by the cyclone (Figure 7- lB).<br />
Generally, low-latitude disturbances, which<br />
intensi~ to tropical storm intensity outside the<br />
South China Sea basin, are more likely to<br />
become very intense typhoons because they<br />
spend a longer time in a favorable low shear and<br />
warm sea-surface temperature environment<br />
south of the subtropical ridge axis (Figure 7-2).<br />
Application of this latitudinal<br />
relationship to future warnings is expected to<br />
reduce <strong>JTWC</strong>’S longer range intensity forecast<br />
errors (Refer to section 7.2).<br />
7.6 PROTOTYPE AUTOMATIC<br />
TROPICAL CYCLONE<br />
HANDBOOK (PATCH)<br />
C.R. Sampson, Lt R.A. Jeffries<br />
and Lt S. Askm<br />
Naval Research Laboratory<br />
Monterey, California<br />
Development of the expert system<br />
continues. PATCH is an expert system designed<br />
to provide tropical cyclone forecast guidance<br />
based on synoptic data, pattern recognition,<br />
thumb rules and research results. An automated<br />
procedure has been developed to provide<br />
guidance for tropical cyclone motion in the<br />
western North Pacific. This procedure includes<br />
expertise on synoptic patterns, steering, island<br />
effects and acceleration after recurvature. In the<br />
future, the system will include expertise<br />
regarding objective technique performance,<br />
tropical cyclone formation, binary interaction<br />
and tropical cyclone intensity forecasting.
5 10 15 20 25 30 35<br />
Tropkd Sbrm Latitude~N)<br />
Figure7-1A<br />
s<br />
*<br />
180 Y i<br />
~ ~r =.94 / :<br />
—— [<br />
~Peak Intensity= (-3.22.TY Lat)+ 164.1<br />
g 100, ~ :<br />
! 80.——;<br />
1<br />
“~ “ :<br />
z 40. .<br />
i<br />
-: ;——.-.p.._-. t<br />
1<br />
i<br />
i c ~<br />
<<br />
20, i i 8<br />
~<br />
r<br />
5 10 1s 20 25 30 35<br />
Typhoon Latitude~N)<br />
Figure7-lB<br />
EJ<br />
;.-<br />
4<br />
(s<br />
Tropical Storm Latitude ~N)<br />
Figure 7-2<br />
223
7.7 AUTOMATED TROPICAL<br />
CYCLONE FORECASTING<br />
SYSTEM (ATCF) UPGRADE<br />
D.M. Roesser, R.J. Miller and C.R. Sampson<br />
Naval Research Laboratory (NRL)<br />
Monterey, California<br />
The ATCF has been operational at<br />
<strong>JTWC</strong> since 1988. The system runs on an IBM-<br />
AT compatible machine using the MS-DOS<br />
operating system. Currently NRL is adapting<br />
the ATCF to a UNIX environment. UNIX<br />
advantages include multi-tasking, unlimited<br />
memory, and portability. The new ATCF will<br />
use industry standard X-Windows/Motif for<br />
window management.<br />
7.8 J~C92 MC)DEL<br />
C.J. Neumann and T.L. Tsui<br />
Naval Research Laboratory<br />
Monterey, California<br />
<strong>JTWC</strong>92 is a statistical-dynamical<br />
model for tropical cyclone track forecasting. It<br />
is a modification of the NHC90 model which<br />
has shown significant skill in the Atlantic.<br />
<strong>JTWC</strong>92 is currently undergoing operational<br />
testing and evaluation and is scheduled to<br />
become operational by June 1992. Preliminary<br />
results show that forecast errors for 1990 data<br />
(125 cases) are 81, 15 and 285 nm for 24,48,<br />
and 72 hours respectively. These results were<br />
obtained using operational tropical cyclone<br />
positions for model input and best track<br />
positions for forecast track verification.<br />
7.9 NEURAL NETWORK APPLIED TO<br />
24-HOUR MOTION FORECAST<br />
J.H. Chu, R.L. Bankert, S.K Sengupta,<br />
P. Rabln~ R.J. Miller, J.M. Shelton<br />
and C.R. Sampson<br />
Naval Research Laboratory<br />
Monterey, California<br />
A statistical model for western North<br />
Pacific 24-hour tropical cyclone motion<br />
forecasts has been developed and tested. The<br />
potential predictors of model output are the<br />
tropospheric deep-layer-mean height fields and<br />
the past 12-hour cyclone motion vectors based<br />
on data or derived from data during the period<br />
from 1974 to 1989. A feature selection<br />
procedure was adopted for ranking these<br />
potential predictors according to their<br />
significance in discriminating the output<br />
classes. Top features based on this ranking are<br />
used for training of a probabilistic neural<br />
network. The trained neural network model<br />
was used to test its forecast ability in 1989. The<br />
overall skill score of the statistical model was<br />
comparable to that of <strong>JTWC</strong> forecasts.<br />
7.10 TROPICAL CYCLONE FORE-<br />
CASTER’S REFERENCE GUIDE<br />
Lt R.A. Jeffiies, R.J. Miller, J.H. Chu<br />
and C.R. Sampson<br />
Naval Research Laboratory<br />
Monterey, California<br />
Development of a Tropical Cyclone<br />
Forecaster’s Reference Guide continues. The<br />
reference guide will contain a section covering<br />
general tropical meteorology, formation,<br />
motion, structure, and dissipation of tropical<br />
cyclones. Satellite and numerical model case<br />
studies and descriptions of forecast aids will<br />
224
also be included. When each section of the<br />
reference guide is completed, it is converted to a<br />
computer-based information system stored on<br />
CD-ROM media.<br />
7.11 NOGAPS TROPICAL CYCLONE<br />
FORECAST PERFORMANCE<br />
J.S. Goerss and Lt R.A. Jeffiies<br />
Naval Research Laboratory<br />
Monterey, California<br />
Synthetic observations generated from<br />
the reported positions and intensities of tropical<br />
cyclones have been assimilated into NOGAPS<br />
since June 1990. In June 1991, these<br />
observations were made available to the 72- and<br />
120-hour forecast runs of NOGAPS as well as<br />
to each analysis of the NOGAPS data<br />
assimilation cycle. A complete evaluation of<br />
NOGAPS tropical cyclone forecast performance<br />
in the western North Paci13cwas performed for<br />
1991.<br />
7.12 TECHNIQUE DEVELOPMENT<br />
Capt Daniel N. Shoemaker, USAF<br />
Detachment 1,633 Operations Support<br />
Squadron<br />
Pixel-counting techniques and insights<br />
by Zehr (1987, 1991) are being applied to<br />
satellite infrared signature of tropical cyclones<br />
to improve tropical cyclone analysis and<br />
forecasting. Although the initial sample (11<br />
tropical cyclones) is small, preliminary thumb<br />
rules have been developed and their validity<br />
will continue be tested as the data base is<br />
expanded.<br />
7.13 ARTICLE FOR WEATHER AND<br />
FORECASTING<br />
LtCol C.P. Guard, LtCmdr L.E. Carr, F.H.Wells,<br />
Lt R.A. Jeffries, LtCmdr N.D. Gural<br />
and Lt D.K.Edson<br />
Joint TWhoon Warning Center<br />
The survey article, Joint Tvnhoon<br />
Warning Center and the Challenges of<br />
Multibasin TroDical Cvclone Forecasting, was<br />
written and submitted to the American<br />
Meteorological Society for publication in the<br />
Special Military Edition of <strong>Weather</strong> and<br />
Forecasting. The paper discusses the<br />
challenges to the center as a result of its vast<br />
multibasin area of responsibility, the products<br />
the center produces, its warning philosophy,<br />
observational networks, analysis and<br />
forecasting schemes, and the milhary aspects of<br />
the operation. Also briefly discussed are<br />
<strong>JTWC</strong>’S colorful history, the joint Navy-Air<br />
Force Operations Evaluation to assess the<br />
impact of the loss of aircraft reconnaissance,<br />
and the ONR’S Tropical Cyclone Motion-90<br />
Experiment. Finally, the paper takes a quick<br />
look at JTTVC’Spost analysis program, training,<br />
qualification, and certiilcation program$ and<br />
technique development to improve tropical<br />
cyclone analysis and forecasting.<br />
7.14 CHARACTERISTICS OF<br />
TROPICAL CYCLONES AFFECT-<br />
ING THE PHILIPPINE ISLANDS<br />
Capt Daniel N. Shoemaker, USAF<br />
Detachment 1,633 Operations Support<br />
Squadron<br />
This study updates two earlier papers,<br />
Brand and Blelloch (1972) and Sikora (1976),<br />
225
on tropical cyclones affecting the Philippine<br />
Islands. Forty-five years of data for tropical<br />
cyclones near the Philippine Islands were<br />
examined to determine tropical cyclone<br />
intensity change, track change, occurrence<br />
climatology, and various other parameters.<br />
From a climatological perspective, the study<br />
allows the typhoon forecaster to more<br />
accurately anticipate changes in tropical cyclone<br />
intensity and motion. This study was published<br />
as NOCC/<strong>JTWC</strong> Technical Note 91-1 and is<br />
available from NOCC/<strong>JTWC</strong>, COMNAWR,<br />
PSC 489, BOX12,FPOAP96540-0051.<br />
7.15. TROPICAL CYCLONES AFFECT-<br />
ING GUAM (1671-1990)<br />
Frank H. Wells, Editor<br />
Joint Typhoon Warning Center, Guam<br />
A climatology of tropical cyclones<br />
passing near Guam was presented for the period<br />
1945-1990. A review of all typhoons affecting<br />
Guam was taken back to 1800, and some<br />
noteworthy typhoons of the 1600’s were<br />
included. The survey encompassed the<br />
frequency, behavior, meteorological effects and<br />
descriptive chronicles of Guam tropical<br />
cyclones. The emphasis was on the period<br />
following World War II. This survey was<br />
published as NOCC/<strong>JTWC</strong> Technical Note 91-2<br />
and is available from NOCC/<strong>JTWC</strong>,<br />
COMNAVMAR, PSC 489, BOX 12, FPO AP<br />
96540-0051.<br />
7.16 A COST-BENEFIT ANALYSIS OF<br />
THE USPACOM TROPICAL<br />
CYCLONE WARNING SYSTEM<br />
LtCol Charles P. Guard<br />
Joint Typhoon Warning Centef, Guam<br />
A preliminary cost-benefit analysis was<br />
conducted with regards to the USPACOM<br />
Tropical Cyclone Warning System and indicated<br />
annual savings realized from the warning<br />
service providwl by <strong>JTWC</strong> to be in excess of<br />
$10 million per year. The cost of <strong>JTWC</strong><br />
support was not presented in the preliminary<br />
analysis. These results were presented at the<br />
1992 Annual Tropical Cyclone Conference<br />
where the US CINCPAC representative<br />
requested that a final study be completed by 1<br />
July 1992 and submitted to Environmental<br />
Group USPACOM.<br />
7.17 CONTRIBUTIONS OF THE<br />
OFFICE OF NAVAL RESEARCH<br />
PhD CHAIR AT THE UNIVERSITY<br />
OF GUAM<br />
Dr. Mark A. Lander<br />
University of Guam<br />
In late June of 1991, Dr. Mark A. Lander<br />
accepted a newly created Research Associate<br />
position at the University of Guam supported by<br />
the Office of Naval Research (ONR). His<br />
research efforts include new and continuing<br />
studies of tropical cyclone motion.<br />
Much of the behavior of tropical cyclone<br />
motion can be understood in the context of an<br />
interaction of the cyclone with other vortices in<br />
the cyclone’s environment. When two or more<br />
tropical cyclones are within range to interact,<br />
the position errors of the fonwists of the <strong>JTWC</strong><br />
increase. Lander and Holland (1992) extend the<br />
work of Dong and Neumann (1983) on the<br />
properties of the motion of binary tropical<br />
cyclones and develop a generalized model of<br />
their specific behavior. Companion papers<br />
concerning the theoretical description and<br />
numerical simulation of interacting vortices, by<br />
Holland with other scientists at the Australian<br />
Bureau of Meteorology Research Center, have<br />
been submitted along with Lander and Holland<br />
(1992) to the Quarterly Journal of the Royal<br />
Meteorological Society.<br />
In another paper, Holland and Lander<br />
(1992), convincing evidence is presented to<br />
-OL
show that some of the meandering nature of<br />
tropical cyclone tracks can be attributed to<br />
interactions between tropical cyclones and<br />
mesoscale cloud clusters within the cyclone’s<br />
outer circulation. This paper has been accepted<br />
for publication in the Journal of the<br />
Atmospheric Sciences.<br />
A close scrutiny of the tropical cyclones<br />
Occurnng in the western North Pacific during<br />
1991 has resulted in a new series of research<br />
papers concerning the influence of the monsoon<br />
trough on the structure and motion of tropical<br />
cyclones. The northward-dis~laced. selfsustainimz.<br />
solitarv monsoon g~,thefmtofa<br />
planned series of papers expected to be written<br />
concerning the monsoon trough and its affects<br />
on the motion and structure of tropical cyclones,<br />
is being submitted to <strong>Weather</strong> and Forecasting.<br />
The midpet trmical cvclone has been written in<br />
collaboration with LtCol Guard and is being<br />
submitted to Monthly <strong>Weather</strong> Review.<br />
The close proximity of the Joint<br />
Typhoon Warning Center (<strong>JTWC</strong>) to the<br />
University of Guam provides a special<br />
opportunity to use the assets of the <strong>JTWC</strong> to<br />
monitor tropical cyclones in real time and<br />
capture unique and often perishable data on<br />
interesting phenomena which are important in<br />
research efforts. By virtue of its location in the<br />
world’s most proli.ilc “Typhoon Alley”, Guam<br />
(the island itself, the University of Guam, and<br />
the <strong>JTWC</strong>) provides the tropical research<br />
meteorologist a unique natural laboratory to<br />
study and find answers to existing problems in<br />
tropical meteorology.<br />
227
BIBLIOGRAPHY<br />
Atkinson, G. D. and C. R. Holliday, 1977: Tropical<br />
cycloneminimum sea-levelpressureand maximum<br />
sustained wind relationship for the western North Pacific.<br />
Monthly <strong>Weather</strong> Review, Vol. 105, No. 4, pp 421427<br />
(also Fleet <strong>Weather</strong> Centml/<strong>JTWC</strong> Tcchnieal Note 75-l).<br />
Bern, C. , J. Sniezc& G.M. Mathbor, M.S. Siddiqi, C.<br />
Ronsmans, A.M.R. Choudhury, A.E. Cloudhury, K.<br />
Islam, M. Bennish, E. Noji and R.L Glass Risk factors<br />
for mortality in the Bangladesh Cyclone of 1991.<br />
Manuscript submitted for publication. Funding provided<br />
by United Nations Children’s Fund, Dhaka, Bangladesh,<br />
2 pp.<br />
Brand, S. 1970: Interaction of binary tropical cyclones<br />
of the western North Pacific Ocean. Journal of Applied<br />
Meteorology, Vol. 9, pp 433441.<br />
Brand, S. and J. W. Blelloch, 1973: Changes in the<br />
Characteristics of Typhoons Crossing the Island of<br />
Taiwan. Naval Environmental Prediction Research<br />
Facility Technical Paper No. 8-73,21 pp.<br />
Brand, S. and C. P. Guard, 197& Extratropieal Storm<br />
Evolution horn Tropical Cyclones in the Western North<br />
Pacific Ocean. Naval Environmental Rediction Researeh<br />
Facility Teehnieal <strong>Report</strong> 78-02,24 pp.<br />
Diercks, J. M., R. C. Weir and M. K. Kopper,198%<br />
ForecastVerification and ReconnaissanceData for<br />
SouthernHemisphereTropicalCyclones(July1980<br />
throughJune1982).NOCC/<strong>JTWC</strong> Technical Note82-1,<br />
77pp.<br />
Dong, K. and C. J.Neumann, 1983:On therelative<br />
motion of binary tropical cyclones. Monthly <strong>Weather</strong><br />
Review, Vol. 111, pp 945-953.<br />
Dunnawin, G. M., 1981: Forecasting Intense Tropical<br />
Cyclones Using 700 mb Equivalent Potential<br />
Temperature and Central Sea-Level Pressure.<br />
NOCC/<strong>JTWC</strong> Technieal Note 81-1, 12 pp.<br />
Dvorak, V. F+ 1973: A Technique for the Analysis and<br />
Forecasting of Tropical Cyclone Intensities from Satellite<br />
Pictures. NOAA Technical-Memorandum National<br />
Environmental Satellite Service 45,19 pp.<br />
Fletcher, R., 1955: Computation of maximum winds in<br />
hurricanes. Bulletin of the American Meteorological<br />
society, 36, Pp 247-250.<br />
Gray, W.M., 1979: Tropical Cyclone Origin, Movement<br />
and Intensity Characteristics Based on Data Compositing<br />
Techniques. Naval Environmental Prediction Research<br />
Facility Contractor <strong>Report</strong> 79-06,124 pp.<br />
Guard, C. Pw 1983: A Study of Western North Pacific<br />
Tropical Storms and Typhoons that Intensify after<br />
Recurvature. First <strong>Weather</strong> Wing Technical Note-83~2,<br />
28 pp.<br />
Herbert, P. IL and K. O. Poteat, 1975: A Satellite<br />
Classification Technique for Subtropical Cyclones.<br />
NOM Technieal Memorandum NWS SR-83, 25 pp.<br />
Holland, G. J., 1980: An analytical model of wind and<br />
pressure profiles in hmricanes. iUonthZy<strong>Weather</strong> Review,<br />
Vol. 108, No. 8, pp 1212-1218.<br />
Holland, G.J. and M.A. Lander, 1992: On the<br />
meandering nature of tropical cyclone tracks. Journal of<br />
the Atmospheric Sciences (m press).<br />
Holliday, C. R. and A. H. Thompson, 1979:<br />
Climatological characteristics of rapidly intensifying<br />
typhoons. Monthly <strong>Weather</strong> Review, Vol. 107, pp 1022-<br />
1034.<br />
<strong>JTWC</strong>, 1991: Tropical Cyclones Affecting Guam (1671-<br />
1990). NOCC/<strong>JTWC</strong> Technical Note 91-2,45 pp.<br />
Lander, M.A., 1990: Evolution of the cloud pattern<br />
during the formation of tropical cyclone twins<br />
symmetrical with respeet to the equator. Monthly<br />
<strong>Weather</strong>Review, Vol. 118, No. 5, pp 1194-1202.<br />
Lander, M.A., 1992: The northward-displaced, selfsustaining,<br />
solitary monsoon gyre. Manuscript submitted<br />
for publication in <strong>Weather</strong>& Forecasting.<br />
Lander, M.A. and G.J. Holland, 1992: On the<br />
interaction of tropical-cyclone scale vortices: I.<br />
Observations. Submitted to the Quarterly Journal of the<br />
Royal Meteorological Society.<br />
Dvorak, V. F., 1984: Tropical Cyclone Intensity Analysis<br />
Using Satellite Data. NOM Technical <strong>Report</strong> NESDIS<br />
ll,46pp.<br />
228
Matsumoto, C. R., 1984: A Statistical Method for Oneto<br />
Three-Day Tropical Cyclone Track Prediction.<br />
Colorado State University Department of Atmospheric<br />
Science, Paper 379,201 pp.<br />
Mundell, D.B., 1990: Prediction of Tropical Cyclone<br />
Rapid Intensification Events. Thesis for fulfillment of<br />
Master’s degree submitted to Colorado State University,<br />
186 pp.<br />
Sadler, J. C., 1974: A Role of the Tropical Upper<br />
Tropospheric Trough in Early Season Typhoon<br />
llevelopmen~ Naval Environmental Rediction Research<br />
Facility Technical Paper No. 2-76,104 pp.<br />
Sadler, J. C., 1979: Tropical Cyclone Initiation by the<br />
Upper-Tropospheric Trough. Naval Environmental<br />
Prediction Research Facility Technical Paper No. 2-76,<br />
103 pp.<br />
Shoemaker, D.N., 1991: Characteristics of Tropical<br />
Cyclones Affecting the Philippine Islands. NOCC/<strong>JTWC</strong><br />
T~hnical Note 91-1,35 pp.<br />
Sikora, C. R., 1976 A Reevaluation of the Changes in<br />
Speed and Intensity of Tropical Cyclones Crossing the<br />
Philippines, Fleet <strong>Weather</strong> Central/<strong>JTWC</strong> Technical Note<br />
76-2,11 pp.<br />
Takemura, Y., 1989: Improved Utilization of Satellite<br />
Imagery in Tropical Cyclone Observation. Part I of paper<br />
for Economic and Social Commission for Asia and the<br />
Pacific and the World Meteorological Organization,<br />
Typhoon Committee, Tokyo, pp 1-10.<br />
‘E& T. L. and R. J. Miller, 198& Evaluation of <strong>JTWC</strong><br />
Tropical Cyclone Objective Forecast Aids (1978-85).<br />
Naval Environmental Prediction Research Facility<br />
Tmhnical <strong>Report</strong> 86-05,44 pp.<br />
<strong>Weather</strong>ford, C.L. and W.M. Gray, 1985: Typhoon<br />
Structural Variability. Colorado State University<br />
Department of Atmospheric Science, Paper No. 391,<br />
77 pp.<br />
Wirfel, W. P. and S. A. Sandgathe, 1986: Forecast<br />
Verification and Reconnaissance Data for Southern<br />
Hemisphere Tropical Cyclones (July 1982 through June<br />
1984). NOCC/<strong>JTWC</strong> Technical Note 86-1,102 pp.<br />
Xu, Y. and C. J. Neumann, 1985 A Statistical Model<br />
for the Prediction of Western North Pacific Tropical<br />
Cyclone Motion. NOM Technical Memorandum NWS<br />
NHC 28,30 pp.<br />
Zehr, R.M., 1991: Observational investigation of tropical<br />
cyclogenesis in the western North Pacific. Preprint<br />
Volume of the 19th Conference on Hurricanes and<br />
Tropical Meteorology. May 6-10, 1991, Miami, Fl, pp<br />
235-240<br />
Zehr, R.M., 1987: The diurnal variation of deep<br />
convective clouds and cirrus with tropical cyclones,<br />
Paper presented at the 17th Technical Conference on<br />
Hurricanes and Tropical Meteorology, April 7-10, Miami,<br />
FL, 4 pp.<br />
229
APPENDIX A<br />
DEFINITIONS<br />
BEST TRACK - A subjectively smoothed path,<br />
versus a precise and very erratic fix-to-fix path,<br />
used to represent tropical cyclone movement,<br />
and based on an assessment of all available<br />
data.<br />
CENTER - The vertical axis or core of a<br />
tropicalcyclone. Usually determinedby cloud<br />
vorticity patterns, wind and/or pressure<br />
distribution.<br />
EPHEMERIS<br />
- Positionof a body (satellite) in<br />
space as a functionof time;used for gridding<br />
satellite imagery. Since ephemeris griddingis<br />
based solelyon the predictedpositionof the<br />
satellite, itis susceptibleto errorsfrom vehicle<br />
wobble, orbitaleccentricity, the oblatenessof<br />
theEarth,and variationinvehiclespeed.<br />
EXPLOSIVE DEEPENING - A decrease in<br />
the minimum<br />
sea-levelpressureof a tropical<br />
cycloneof 2.5mb/hr foratleast12 hours or 5.0<br />
mb/hr foratleastsixhours (Dunnavan, 1981).<br />
EXTRATROPICAL<br />
and tropical summaries<br />
-A term used inwarnings<br />
to indicate that a<br />
cyclone has lostits“tropical”characteristics.<br />
The term impliesboth poleward displacement<br />
from<br />
the tropics and the conversion of the<br />
cyclone’s primary energy source from the<br />
release of latent heat of condensation<br />
baroclinicprocesses.Itisimportanttonotethat<br />
cyclones can become<br />
to<br />
extratropicaland still<br />
maintainwinds of typhoon or storm force.<br />
EYE<br />
- The centralarea of a tropicalcyclone<br />
when itis more than halfsurrounded by wall<br />
cloud.<br />
FUJIWHARA EFFECT -A binaryinteraction<br />
where tropicalcyclones within about 750 nm<br />
(1390 km) of each otherbegin torotateabout a<br />
230<br />
common midpoint (Brand, 1970; Dong and<br />
Neumann, 1983).<br />
INTENSITY - The maximum sustained 1-<br />
minute mean surface wind speed, typically<br />
within one degree of the center of a tropical<br />
cyclone.<br />
MAXIMUM SUSTAINED WIND - The<br />
highest surface wind speed averaged over a 1-<br />
minute period of time. (Peak gusts over water<br />
average 20 to 25 percent higher than sustained<br />
winds.)<br />
MONSOON GYRE - A mode of the monsoon<br />
circulation characterized by:<br />
1) a large (diameter on the order of 1000 nm<br />
(2000 km)) nearly circular low-level cyclonic<br />
vortex; 2) nearly circular isobars with the<br />
outermost closed isobar possessing a diameter<br />
of roughly 1000 nm (2000 km); 3) a northward<br />
displacement of the sea-level pressure<br />
minimum with respect to the latitude of the<br />
pressure minimum found along any meridian<br />
passing through the long-term monthly mean<br />
monsoon trough; and 4) lower than average<br />
sea-level pressure throughout most of the<br />
tropical western North Pacific (Lander, 1992).<br />
NORTHWARD-DISPLACED, SELF-<br />
SUSTAINING, SOLITARY (NSS)<br />
MONSOON GYRE - A specific type of<br />
monsoon gyre in the western North Pacific with<br />
some particular characteristics:<br />
1) a relatively long (three-week) lifespan; 2) a<br />
slow westward migration; 3) a cloud band<br />
rimming the southern through eastern periphe~<br />
of the low-level vortex/surface low; 4) for a<br />
least the fust half of its lifespan — a subsident<br />
regime in its core with light winds and scattered<br />
cumulus cloud of little vertical development;<br />
and 5) the large circular vortex cannot be the
esult of the expanding<br />
typhoon (Lander, 1992).<br />
wind field of a large<br />
RAPID DEEPENING - A decrease in the<br />
minimum sea-level pressure of a tropical<br />
cyclone of 1.75 mb/hr or 42 mb for 24-hours<br />
(Holliday and Thompson, 1979).<br />
RECURVATURE - The turning of a tropical<br />
cyclone from an initial path toward the west and<br />
poleward to east and poleward, after moving<br />
poleward of the mid-tropospheric subtropical<br />
ridge axis.<br />
SIGNIFICANT TROPICAL CYCLONE -<br />
A tropical cyclone becomes “signtilcant” with<br />
the issuance of the fmt numbeml warning by<br />
the responsible warning agency.<br />
SIZE - The areal extent of a tropical cyclone,<br />
usually measured radially outward from the<br />
center to the outer-most closed isobar.<br />
STRENGTH - The average wind speed of the<br />
surrounding low-level wind flow, usually<br />
measured within one to three degrees of the<br />
center of a tropical cyclone (<strong>Weather</strong>ford and<br />
Gray, 1985).<br />
SUBTROPICAL CYCLONE - A low<br />
pressure system that forms over the ocean in the<br />
subtropics and has some characteristics of a<br />
tropical circulation, but not a central dense<br />
overcast. Although of upper cold low or lowlevel<br />
baroclinic origins, the system can<br />
transition to a tropical cyclone.<br />
SUPER TYPHOON - A typhoon with<br />
maximum sustained 1-minute mean surface<br />
winds of 130 kt (67 mkc) or greater.<br />
TROPICAL CYCLONE - A non-frontal,<br />
migratory low-pressure system, usually of<br />
synoptic scale, originating over tropical or<br />
subtropical waters and having a definite<br />
231<br />
organized circulation.<br />
TROPICAL DEPRESSION - A tropical<br />
cyclone with maximum sustained 1-minute<br />
mean surface winds of 33 kt (17 m/see) or less.<br />
TROPICAL DISTURBANCE - A discrete<br />
system of apparently organized convection,<br />
generally 100 to 300 nm (185 to 555 km) in<br />
diameter, originating in the tropics or<br />
subtropics, having a non-frontal, migratory<br />
character and having maintained its identity for<br />
12- to 24-hours. It may or may not be<br />
associated with a detectable perturbation of the<br />
low-level wind or pressure field. It is the basic<br />
generic designation which, in successive stages<br />
of development, may be classified as a tropical<br />
depression, tropical storm, typhoon or super<br />
typhoon.<br />
TROPICAL STORM - A tropical cyclone<br />
with maximum l-minute mean sustained<br />
surface winds in the range of 34 to 63 kt (17 to<br />
32 m/see), inclusive.<br />
TROPICAL UPPER-TROPOSPHERIC<br />
TROUGH (TUTT) - A dominant<br />
climatological system and a daily upper-level<br />
synoptic feature of the summer season, over the<br />
tropical North Atlantic, North Pacific and South<br />
Pacific Oceans (Sadler, 1979).<br />
TYPHOON (HURRICANE) - A tropical<br />
cyclone with maximum sustained 1-minute<br />
mean surface winds of 64 to 129 kt (33 to 66<br />
m/see). West of 180 degrees east longitude they<br />
are called typhoons and east of 180 degrees east<br />
longitude hurricanes.<br />
WALL CLOUD - An organized band of deep<br />
cumuliform clouds that immediately surrounds<br />
the central area of a tropical cyclone. The wall<br />
cloud may entirely enclose or partially surround<br />
the center.
APPENDIX<br />
B<br />
NAMES FOR TROPICAL CYCLONES IN THE<br />
WESTERN NORTH PACIFIC AND SOUTH CHINA SEA<br />
column 1 column 2<br />
ANGELA AN-gel-ah ABE ABE<br />
BRIAN BRY-an BECKY BECK-ee<br />
COLLEEN COL-leen CECIL CEE-cil<br />
DAN DAN DOT DOT<br />
ELSIE ELL-see ED ED<br />
FORREST FOR-rest FLO FLO<br />
GAY GAY GENE GEEN<br />
HUNT HUNT HATTIE HAT-ee<br />
IRMA IR-ma IRA EYE-ra<br />
JACK JACK JEANA JEAN-ah<br />
KORYN ko-RIN KYLE KYE-ell<br />
LEWIS LOU-iss LOLA LOW-lab<br />
MARIAN MAH-rian MANNY* MAN-ee<br />
NATHAN ZVAY-&m NELL NELL<br />
OFELIA oh-FEEL-ya OWEN OH-en<br />
PERCY PURR-see PAGE PAGE<br />
ROBYN ROB-in RUSS RUSS<br />
STEVE STEEV SHARON SHAR-on<br />
TASHA TA-sha TIM TIM<br />
column 3 column 4<br />
AMY A-mee AXEL AX-en<br />
13RENDAN BREN-dan BOBBIE BOB-ee<br />
CAITLIN KATE-lin CHUCK CHUCK<br />
DOUG DUG DEANNA dee-AN-na<br />
ELLIE ELL-ee ELI EE-lye<br />
FRED FRED FAYE FAY<br />
GLADYS GLAD-iss GARY GAR-ee<br />
HARRY HAR-ee HELEN HELL-en<br />
IVY EYE-vee IRVING ER-ving<br />
JOEL JOLE JANIS JAN-iss<br />
KINNA KIN-na KENT KENT<br />
LUKE LUKE LOIS LOw-iss<br />
MELISSA* meh-LISS-ah MARK MARK<br />
NAT NAT NINA NEE-nah<br />
ORCHID OR-kid OMAR OH-mar<br />
PAT PAT POLLY PA-lee<br />
RUTH RUTH RYAN RYE-an<br />
SETH SETH SIBYL SIB-ill<br />
TERESA* teh-REE-sah TED TED<br />
VERNON VER-non VANESSA vah-NES-ah VERNE VERN VAL VAIL<br />
WINONA wi-NO-nuh WALT WMT WILDA WILL-dab WARD WMD<br />
YANCY YM-see YUNYA YUNE-yah YURI YOUR-ee YVETTE ee-VET<br />
ZOLA ZO-lah ZEKE ZEEK ZELDA ZELL-dah ZACK ZACK<br />
* Name changes: MANNY replaced MIKE in 1991; MELISSA replaced MIREILLE, and TERESA<br />
replaced THELMA in 1992.<br />
NOTE 1: Names are &signed in rotation and alphabetically. When the last name in Column 4 (ZACK)<br />
has been used, the sequence will begin again with the first name in Column 1 (ANGELA).<br />
NOTE 2: Pronunciation guide for names are italicized.<br />
SOURCE: CINCPACINST 3140. lU<br />
232
A-track<br />
AB<br />
ABw<br />
ABIO<br />
Along-track<br />
Air Base<br />
Air Base Wing<br />
Signifkant Tropical<br />
<strong>Weather</strong> Advisory for<br />
the Indian Ocean<br />
AWDS<br />
AWN<br />
CDO<br />
APPENDIX C<br />
CONTRACTIONS<br />
Automated <strong>Weather</strong><br />
Disrnbution System<br />
Automated <strong>Weather</strong><br />
Network<br />
Combined Confidence<br />
Weighted Forecast<br />
Central Dense Overcast<br />
DMSP<br />
DOD<br />
DSN<br />
DIW<br />
Defense Meteorological<br />
Satellite Program<br />
Department of Defense<br />
Defense Switched<br />
Network<br />
Date Time Group<br />
ABPW<br />
ACFT<br />
ADP<br />
AFGwc<br />
AIREP<br />
Significant Tropical<br />
<strong>Weather</strong> Advisory for<br />
the Western Pacific<br />
ocean<br />
Aircraft<br />
Automated Data<br />
Processing<br />
Air Force Base<br />
Air Force Global<br />
<strong>Weather</strong> Central<br />
Hleld Fixed<br />
Teleeommuncation<br />
Network<br />
Aircraft (<strong>Weather</strong>)<br />
<strong>Report</strong><br />
CI<br />
CINCPAC<br />
CLD<br />
CLIM<br />
CLIP or<br />
CLIPER<br />
CNoc<br />
Current Intensity<br />
Commander-in-Chief<br />
Pacific (AF - Air Force,<br />
FLT - Fleet)<br />
Civilian<br />
cloud<br />
climatology<br />
climatology and<br />
Persistence Technique<br />
Centimeter(s)<br />
Commander Naval<br />
Oceanography<br />
Command<br />
FBAM<br />
FI<br />
FNoc<br />
m<br />
GMT<br />
GOES<br />
GTE/PEM-<br />
West<br />
FNOC Beta Adveetion<br />
Model<br />
Forecast Intensity<br />
(Dvorak)<br />
FIeet Numerical<br />
Oceanography Center<br />
Feet<br />
Greenwich Mean Time<br />
Geostationary<br />
operational<br />
Environmental Satellite<br />
Global Tropospheric<br />
Experiment/Pacifx<br />
Exploratory<br />
Measurements - West<br />
AMos<br />
AOR<br />
ARGOS<br />
ATCF<br />
AUTODIN<br />
Automatic<br />
Meteorological<br />
Observing Station<br />
Area of Responsibility<br />
Automatic piCtlW<br />
Transmission<br />
International Serviee for<br />
Drifting Buoys<br />
Automated Tropical<br />
Cyclone<br />
Forecast ($Wem)<br />
Automated Digital<br />
Network<br />
CPA<br />
CPHC<br />
Csc<br />
CSUM<br />
DDN<br />
DEG<br />
Det<br />
DFS<br />
Closest Point of<br />
Approach<br />
Central Pae~Ic<br />
Hurricane Center<br />
Cloud System Center<br />
Colorado State<br />
University Model<br />
Defense Data Network<br />
Degree(s)<br />
Detachment<br />
Digital Facsimile<br />
System<br />
233<br />
GTS<br />
HPAC<br />
HR<br />
ICAO<br />
Globat Telecommunications<br />
System<br />
Mean of XTRP and<br />
CLIM Techniques<br />
(Half Persistence and<br />
climatology)<br />
Hour(s)<br />
High Resolution<br />
Picture Transmission<br />
International Civil<br />
Aviation<br />
Organization<br />
Initial
INST<br />
IR<br />
JTwc<br />
KT<br />
LAN<br />
LAT<br />
LLcc<br />
Instruction NASA National Aeronautics<br />
and Space<br />
Infrared<br />
Administration<br />
Joint Typhoon Warning<br />
Center<br />
Kilometer(s)<br />
Knot(s)<br />
Local Area Network<br />
Latitude<br />
Low-Level Circulation<br />
Center<br />
NEDN<br />
NEDS<br />
NEPRF<br />
NESDIS<br />
Naval Environmental<br />
Data Network<br />
Naval Environmental<br />
Display Station<br />
Naval Environmental<br />
Prediction Reseamh<br />
Facility<br />
National Environmental<br />
Satellite, ~ and<br />
Information Service<br />
NRPS or<br />
NORAPS<br />
NSDS<br />
NSDS-G<br />
NSS<br />
Naval Research<br />
Laboratory<br />
Navy Operational<br />
Regional Atmospheric<br />
Prediction System<br />
Naval Satellite Display<br />
system<br />
Naval Satellite Display<br />
System - Geostationary<br />
Northward-displaced,<br />
SeIf-sustained, Solitary<br />
(monsoon gyre)<br />
LONG<br />
LUT<br />
LVL<br />
M<br />
Longitude<br />
Local User Terminal<br />
Level<br />
NESN<br />
NEXRAD<br />
Naval Environmental<br />
Satellite Network<br />
Next Genemtion<br />
<strong>Weather</strong> (Doppler)<br />
Radar<br />
NTcc<br />
Nwoc<br />
Naval<br />
Telecommunications<br />
Center<br />
Naval Western<br />
Oceanography Center<br />
Meter(s)<br />
NHc National Hurricane Nws National <strong>Weather</strong><br />
Maximum<br />
Center<br />
Service<br />
m<br />
Millibar(s) Nauticrd Mile(s) OBS<br />
Observations<br />
MCAS<br />
Marine Corps<br />
Air Station<br />
NMc<br />
National Meteorological<br />
Center<br />
OLS<br />
OperationalLmescan<br />
System<br />
MET<br />
IWDDAS<br />
MOVG<br />
MSLP<br />
NARDAC<br />
NAS<br />
Meteorological<br />
Meteorological<br />
Imagery, Data<br />
Display, and Analysis<br />
System<br />
Minimum<br />
Millimeter(s)<br />
Moving<br />
Minimum Sea-level<br />
Plessure<br />
Naval Regional Data<br />
Automation Center<br />
Naval Air Station<br />
NOAA<br />
NOCC<br />
NODDES<br />
NODDS<br />
NOGAPS<br />
NR<br />
National Oceanic and<br />
Atmospheric<br />
Administration<br />
Naval Oceanography<br />
Command Center<br />
Naval Environmental<br />
Data Network<br />
oceanographic Data<br />
DMribution and<br />
Expansion System<br />
Navy/NOAA<br />
oceanographic Data<br />
Distribution System<br />
Navy Operational<br />
Giobd Atmospheric<br />
Prediction System<br />
234<br />
ONR<br />
0ss<br />
OTCM<br />
PACAF<br />
PACDIGS<br />
.PACMEDS<br />
PACOM<br />
Office of Naval<br />
Research<br />
Operations Support<br />
Squadron<br />
One-Way (Interactive)<br />
Tropical Cyclone”Model<br />
Pacific Air Force<br />
Pacific Digital<br />
Information<br />
Graphics System<br />
Pacific Meteorological<br />
Data System<br />
PacificCommand<br />
Position Code Number
PDN Public Data Network STY<br />
PIREP Pilot <strong>Weather</strong> <strong>Report</strong>(s) TAPT<br />
RADOB Radar Observation -I-C<br />
Super Typhoon<br />
Typhoon Acceleration<br />
Prediction Technique<br />
Tropical CycIone<br />
TYMNET Time-Sharing Network<br />
Commen%l wide area<br />
network connecting<br />
micro- and main-frame<br />
computers<br />
RECON<br />
RRDB<br />
RSDB<br />
Reconnaissance<br />
TCFA Tropical Cyclone<br />
Formation Alert<br />
Reference Roster Data<br />
Base ‘ICM-90 Tropical Cyclone<br />
Motion Field<br />
Raw Satellhe Data Base<br />
Experiment -1990<br />
ULcc<br />
us<br />
USAF<br />
Upper-Level Circulation<br />
Center<br />
United States<br />
United States Air Force<br />
SAT<br />
satellite<br />
TD<br />
Tropical Depression<br />
USN<br />
United States Navy<br />
SEC<br />
Second TDA Typhoon Duty Assistant VIS Visual<br />
SDHS<br />
SFC<br />
Satellite Data Handling<br />
System<br />
Surface<br />
TIRos<br />
Typhoon Duty Officer<br />
Television Infrared<br />
Observational Satellite<br />
WESTPAC<br />
WMO<br />
Western (North) Pacific<br />
World Meteorological<br />
Organization<br />
SGDB<br />
Satellite Global Data<br />
Base<br />
TOGA<br />
Tropical Ocean Global<br />
Atmosphem!<br />
WRN or<br />
WRNG<br />
warning(s)<br />
SLP<br />
SSMA<br />
SST<br />
STNRY<br />
ST<br />
SIR<br />
Sea-Level Pressure TQvs TrRosoperational<br />
Vertical Sounder<br />
SpeciaI Sensor<br />
Micmwave&nager TS Tropical Storm<br />
SeaSurface<br />
Temperature<br />
stationary<br />
Subtropical<br />
Subtropical Ridge<br />
TY<br />
TYAN<br />
Tropical Upper-<br />
Tropospheric Trough<br />
Typhoon<br />
Typhoon Analog<br />
m-)<br />
Ws<br />
X-track<br />
XTRP<br />
z<br />
<strong>Weather</strong> Squadron<br />
Cross-track<br />
Extrapolation<br />
Zulu time<br />
(Greenwich Mean<br />
Time/Universal<br />
Coordinated Time)<br />
235
APPENDIX<br />
D<br />
PAST ANNUAL TROPICAL CYCLONE REPORTS<br />
Copies of the past Annual Tropical Cyclone <strong>Report</strong>s for DOD agencies or contractors<br />
can be obtained through:<br />
Defense Technical Information Center<br />
ATI’N:FDAC<br />
Cameron Station<br />
Alexandri% VA 22304-6145<br />
Copies for non-DOD agencies or users can be obtained from:<br />
National Technical Information Service<br />
5285 Port Royal Road<br />
Springfield, VA 22161<br />
Refer to the following numbers when ordering:<br />
YEAR<br />
1959<br />
1960<br />
1961<br />
1962<br />
1963<br />
1964<br />
1965<br />
1966<br />
1967<br />
1968<br />
1969<br />
1970<br />
1971<br />
1972<br />
1973<br />
1974<br />
ACQ UISITIONNUMBER<br />
AD 786147<br />
AD 786148<br />
AD 786149<br />
AD 786128<br />
AD 786208<br />
AD 786209<br />
AD 786210<br />
AD 785891<br />
AD 785344<br />
AD 785251<br />
AD 785178<br />
AD 785252<br />
AD 768333<br />
AD 768334<br />
AD 777093<br />
AD 010271<br />
YEAR<br />
1975<br />
1976<br />
1977<br />
1978<br />
1979<br />
1980<br />
1981<br />
1982<br />
1983<br />
1984<br />
1985<br />
1986<br />
1987<br />
1988<br />
1989<br />
1990<br />
WQU<br />
ISITIONNUMBE~<br />
AD A023601<br />
AD A038484<br />
ADA055512<br />
AD A070904<br />
AD A082071<br />
AD A094668<br />
AD Al 12002<br />
AD Al 24860<br />
AD Al 37836<br />
AD Al 53395<br />
AD A168284<br />
AD A184082<br />
AD A191 883<br />
AD A207206<br />
AD A232469<br />
AD A23991 O<br />
236
APPENDIX<br />
DISTRIBUTION<br />
1 Com<br />
ANALYSIS AND PROCESSINGCENTER,INDONESIA<br />
BARRE’ITCONSULTINGGROUP<br />
BRUNEISHELLPETROLEUMCO<br />
C+WHOLICUNIVERSITYOF AMERICA<br />
CAFWEATHERCENTR& TAIWAN<br />
CENTRALMETOBSERVtLWORY, BEIJING<br />
CENTRALMETEOROLOGICALOFFICE, SEOUL<br />
CHULALONGKORNUNIVERSITY, BANGKOK<br />
CHUNG CHENG INSTHTJTE, TAIWAN<br />
CITIES SERVICES OIL GAS CORP<br />
CITY POLYTECHNIC OF HONG KONG<br />
CIUDAD UNIVERSITARI& MEXICO<br />
CML DEFENSE, BELAU<br />
CML DEFENSE, MAJURO<br />
CML DEFENSE, POHNPEI<br />
CML DEFENSE, SAIPAN<br />
CML DEFENSE, TRUK<br />
CML DEFENSE, YAP<br />
CINCPACFET<br />
CNO (OP-096)<br />
CNo (OP-096T)<br />
CNO (OP-981D)<br />
CNO (OP-943G)<br />
COLORADO STIWE UNIVERSITY LIBRARY<br />
COMMONWEALTH NORTHERN MARIANAS ISLANDS<br />
COMNAVFOR PHILIPPINES<br />
COMNAVMAR<br />
COMNAVOCEANCOM<br />
COMNAVSURFGRU WESTPAC<br />
COMNAVSURFPAC<br />
COMPATRECFOR<br />
COMPHJBGRU ONE<br />
COMSC<br />
COMSEVENTHFET<br />
COMSPAWARSYSCOM<br />
COMSUBGRU SEVEN<br />
COMTHIRDFET<br />
CONGRESSIONAL INFORMATION SERVICE, MD<br />
DCA GUAM<br />
633ABWM<br />
15ABw/wE<br />
180SS/WE<br />
4320SS/WE<br />
603ACCSJWE<br />
DISASTER CONTROL OFFICE, SAIPAN<br />
ECMWF, BERKSHIRE UK<br />
FAIRECONRON ONE<br />
FIJI MFXEOROLOGICAL SERVICE<br />
GEOLOGICAL FLUID DYNAMICS LAB, PRINCETON, NJ<br />
GEOU)GICAL SURVEY, GUAM<br />
GEOPHYSICS LAB/LYS<br />
GIFU METEORO~IC& OFFJCE, JAPAN<br />
GODDARD SPACE FLIGHT CENTER<br />
GUAMCOMMUNTIYCOLLEGE<br />
GUAM PUBLIC LIBRARY<br />
237<br />
E<br />
LIST<br />
HORIZON MARINE, INC<br />
HQ USAF/XOORZ<br />
HUGHES AIRCRAFT CO<br />
INDIAN INSTITUTE OF TROPICAL METEOROLL)GY<br />
INSTITUO DE GEOFISICA, MEXICO<br />
JAPAN AIR LINES<br />
JCS ENV SERVICES DIV (J3(OES))<br />
JET PROPULSION LAB, PASADENA<br />
LISD CAMP SPRINGS CENTER, MD<br />
LOS ANGELES PUBLIC LIBRARY<br />
MAURITIUS METEOROLOGICAL SERVICE<br />
MASS INST OF TECH<br />
MCAS FUTENMA<br />
MCAS IWAKUNI<br />
MCAS KANEOHE BAY HI<br />
METEOROLOGICAL DEPARTMENT, PAKISTAN<br />
METEOROLOGICAL OFFICE, BRACKNELL<br />
METEOROLOGICAL SERVICE, FRENCH POL~IA<br />
METEOROLOGICAL SERVICE, MAURITIUS<br />
METEOROLOGICAL SERVICE, REUNION<br />
METEOROLOGY SOCIETY OF NEW SOUTH WWES, AUST<br />
MJL ASST ENV SCI (R & AT/ E &LS)<br />
MOBIL OIL GUAM, JNC<br />
MONASH UNIVERSITY, AUSTRALIA<br />
MOUNTAIN STA~ WEATHER SERVICES<br />
NASA<br />
NA~ONAL DATA BUOY CENTER<br />
NA~ONAL METEOROLOGICAL CENTER<br />
NATIONAL RESOURCES INSTITUTE, JNC<br />
NA~ONALTAIWAN UNIVERSITY<br />
NA~ONAL TECHNICAL JNFORMA~ON SERVICE<br />
NATIONAL WEAWHERSERVICE, PAPUA NEW GUINEA<br />
NAVAL ACADEMY<br />
NAVAL CIVIL ENG LAB, PORT HUENEME, CA<br />
NAVAL RESEARCH LAB<br />
NAVEASTOCEANCEN NORFOLK<br />
NAVHJSTCEN<br />
NAVOCEANCOMCEN ROTA<br />
NAVOCEANCOMDET AGANA<br />
NAVOCEANCOMDET ALAMEDA<br />
NAVOCEANCOMDET ASHEVILLE<br />
NAVOCEANCOMDET AI’SUGI<br />
NAVOCEANCOMDET BARBERS POINT<br />
NAVOCEANCOMDET KADENA<br />
NAVOCEANCOMDET MONTEREY<br />
NAVOCEAN COMFAC JACKSONVILLE<br />
NAVOCEANCOMFAC YOKOSUKA<br />
NAVOCEANO<br />
NAVAL POST GRADUA~ SCHOOL LIBRARY<br />
NAVPOLAROCEANCEN SUITLAND<br />
NEW ZEALAND MET SERVICE<br />
NOAA/ACQUISITION SECTION, ROCKVILLE, MD<br />
NOAA/AOM~’’HRD, MIAMI, FL<br />
NOMYDROMETEOROLOGY BR, SILVER SPRINGS, MD<br />
NOAA/NESDIS, HONOLULU, HI<br />
WEATHER SERVICE FCST OFFICE REDWOOD CITY, CA
NOAAIPMEL, SEAITLE, WA 2CWIES<br />
NOAA ENVIRONMENTAL RESEARCH LAB<br />
AFGWCfWFMP<br />
NOAA LIBRARY, SEATTLE, WA<br />
AWS TECH LIBRARY<br />
NOARL ATMOSPHERIC DIRECTORATE<br />
BUREAU OF METEOROLOGY, BRISBANE<br />
NOBEL DENTON BUREAU OF METEOROLOGY DARWIN<br />
OCEANO SERVICES INC. LIBRARY<br />
BUREAU OF METEOROLOGY, MELBOURNE<br />
OCEANWEATHER, INC. BUREAU OF METEOROLOGY PEK’IW<br />
OFFICE OF FEDERAL COORDINAI’OR METEOROLOGY BUREAU OF PLANNING, GUAM<br />
OFFICE OF NAVAL RESEARCH CML DEFENSE, GUAM<br />
OFFICE OF THE NAVAL DEPUTY, NOAA<br />
DEFENSE TECHNICAL INFORMAITON CENTER<br />
PACAF/DOW<br />
DEPARTMENT OF COMMERCE<br />
PACAF/WSU<br />
ESCAP LIBRARY BANGKOK<br />
PACIFIC STARS & STRIPES<br />
FLENUMOCEANCEN MONTEREY<br />
PACNAVFACENGCOM FLQRIDA STA~ University<br />
PENNSYLVANIA STA~ University INSTJTUTE OF PHYSICS, TAtWAN<br />
REUNION METEOROLOGICAL SERVICE<br />
MARATHON OIL CO, TX<br />
RUCH WEATHER SERVICE, INC MARINERS WEA~ER LOG<br />
SAINT LOUIS UNIVERSITY<br />
MET RESEARCH INST LIBRARY, ‘1’13KY0<br />
SAT APPL LAB, NOAA,/NESDIS, WASHINGTON, IX MICRONESIA RESEARCH CENTER UOG, GUAM<br />
SHANGHAI TYPHOON INSTITUTE<br />
NATIONAL CLIMATIC DATA CENTER<br />
SRI LANKA METEOROLOGICAL SOCIETY NATIONAL METEOROLOGICAL LIBRARY,<br />
SRI IJBRARY BRACKNEL~ UK<br />
TAO PROJE~ OFFICE NATIONAL WEATHER SERVICE, HONOLULU<br />
TEXAS A & M University<br />
NAVOCEANCOMDET DIEGO GARCIA<br />
UNIVERSITY OF CHICAGO<br />
NAVOCEANCOMDET MISAWA<br />
UNIVERSITY OF GUAM, BIOLOGY DEPT<br />
NAVWES’lT)CEANCEN PEARL HARBOR<br />
UNIVERSITY OF HAWAII LIBRARY<br />
NOAA CORAL GABLES LJBRARY<br />
University OF WASHINGTON NOAA GUAM<br />
USAFETAC/DN<br />
NORA 1570 DALLAS, TX<br />
USCINCPAC<br />
OKINAWA METEOROLOGY OBSERVA~RY<br />
USCINCPAC REP GUAM SAT APPL LAB, NOM/NESDIS, CAMP SPRINGS, MD<br />
USCINCPAC REP FIJJ<br />
TYPHOON COM SECR, MANILA<br />
USNA (OCEANOGRAPHY DEPT/LIBRARY) University OF PHILIPPINES<br />
USS AMERICA (CV 66)<br />
US ARMY, FORT SHAFTER<br />
USS BELLEAU WOOD (LHA 3)<br />
WORLD DATA CENTER ~ NOAA<br />
USS CARL VINSON (CVN 70)<br />
23 AF/HQ<br />
USS CONSTELLM’’ION (CV 64)<br />
73 WEATHER GROUP, ROK AF<br />
USS CORAL SEA (CV 43)<br />
USS EISENHOWER (CVN 69)<br />
3 COWS<br />
USS ENTERPRISE (CVN 65) CENTRAL WEATHER BUREAU, TAIWAN<br />
USS FORRESTAL (CV 59)<br />
INDIA METEOROLOGICAL DEPT<br />
USS INDEPENDENCE (CV 62)<br />
INOSHAC, DDGM (WF)<br />
USS J. F. KENNEDY (CV 67)<br />
JAPAN METEOROLOGICAL AGENCY<br />
USS KITTY HAWK (CV 63)<br />
NATIONAL HURRICANE CENTER, MIAMI<br />
USS LINCOLN (CVN 72)<br />
NAVPGSCOL DEPT OF METEOROLCX2Y<br />
USS NEW ORLEANS (LPH 11) UNIVERSITY OF HAWAII, METEORO~Y DEPT<br />
Uss NIMITz (CVN 68) WEATHER CENTR~ CAP<br />
USS OKINAWA (LPH 3)<br />
USS PELELIU (LHA 5)<br />
4 coP~<br />
USS RANGER (CV 61) COLORADO STA~ University<br />
USS SARA~A (CV 60) METEOROLOGY DEPT, BANGKOK<br />
USS TARAWA (LHA 1)<br />
USS TRIPOLI (IIH 10) 5 Comil<br />
USS T. ROOSEVELT (CVN 71)<br />
PAGASA WEAI’HER BUREAU, RP<br />
VANUATU METEOROLOGICAL SERVICE R & D UNIT, NHC, MIAMI<br />
WORLD DATA CENTER Bl, MOSCOW<br />
ROYAL OBSERVATORY HONG KONG<br />
AFGWC/WFM<br />
3350 TCHTG/XT’MV-S 6 Con%s<br />
NOARL WEST<br />
NA~ONAL WEA~ER ASSOCIAI’ION<br />
238
UNCLASSIFIED<br />
~uRITy CLASSIFICATION OF THIS pAGE<br />
REPORT DOCUMENTATION<br />
PAGE<br />
form Approved<br />
OMBNO. 07&-0188<br />
la. REPORT SECURITY CLASSIFICATION 1b. RESTRICTIVE MARKINGS<br />
UNCLASSIFIED<br />
2& SECURITY CLASSlFlCAT10N AUTHORITY 3. DISTRIBUTION /AVAILABILITY OF REPORT<br />
2b. DECLASSIFICATION/ DOWNGRADING SCHEDULE<br />
AS IT .4H’EAR5 IN TiiZ &POF.T/<br />
DISTR13UTIOX WLIYIT’ED<br />
4. PERFORMING ORGANIZATION REPORT NUMBER(S) S. MONITORING ORGANIZATION REPORT NUMBER(S)<br />
6a. NAME OF PERFORMING ORGANIZATION fib. OFFICE SYMBOL 7a. NAME OF MONITORING ORGANIZATION<br />
(If ●pplicable)<br />
lTAVOCEAllCO:iCE!J/JTt~C<br />
NAVO!XANCCX!C13!/JTVC<br />
B 1<br />
6c. ADDRESS (City, State, ●ndZIP Code) I 7b. ADDRESS (City, State,<br />
andZIPcode)<br />
C~rdAVYW, PSC 439, XE{ 12 ICOXJAV2MR, iSC 489, i30X 12<br />
FPO AP 96540-0051 Fo AP 96540-0051<br />
8a. NAME OF FUNDING ISPONSORING 8b. OFFICE SYMBOL<br />
ORGANIZATION<br />
(If applicable)<br />
lWVOCMNCO}iCEX /JITJC<br />
9.PROCUREMENT INSTRUMENT IDENTIFICATION NUMBER<br />
6c. ADDRESS (City, State, and Z/P Code)<br />
COTAWM, F’SC48!> 3022 12<br />
FPO ALP 96540-0051<br />
11, TIT LE (/nc/ude Secur{ty Classification)<br />
10. SOURCE OF FUNDING NUMBERS<br />
PROGRAM PROJECT TASK WORK UNIT<br />
ELEMENT NO. NO. NO ACCESSION NO.<br />
1991 #NIKM.LTROPICAL CYCLONE &PORT<br />
12. PERSONAL AUTHOR(S)<br />
13a. TYPE OF REPORT 13b. TIME COVERED 14. DATE OF REPORT (Year, Month, flay) 15. PAGE COUNT<br />
Al$sFJAL FROM JAkl91 TO DEC 91 238 plus i tl~ruvi<br />
16.SUPPLEMENTARY NOTATION<br />
I7. COSATI CODES 18. suBJEn TERMs (cOnth7Ud On ftVt~t if #WCMSWy dnd #tnti& by bhCk IMhW)<br />
FIELD GROUP<br />
T~@’ICfi CYCLONES SUE-GROUP<br />
‘XWICAL STox:.s<br />
TROPICAL i)EPRESSIOLIS TYPX)02X / SUPE. TYPHOCH5<br />
nfl<br />
n7<br />
TRW’lCAL CYCLONE RESEARCH MEI’EOXOL9GICAL SATELLITES<br />
19. ABSTRACT (Continue on revefle if Mceuary ●nd identi~ by block number)<br />
ANNUAL PUBLICATION SUMMARIZING TROPICAL CYCLONE ACTIVITY IN THE NESTERN ~lORTH PACIFIC,<br />
BAY OF BENGAL, AMBIAN SEA, l% STEFCY SOUTH PACIFIC AND SOUTH INDIAi’i’ OCEANS. A BEST<br />
TRACK IS PROVIDED FOR EACH SIGNIFICANT TROPICAL CYCLONE. A BRIEF NARRATIVE IS GIVEN<br />
FOR ALL T!lOPICALCYCLONES IN THE VESTERIJNORTH PACIFIC AND ltORTFlINDIAH OCEANS. ALL<br />
FIX DATA USED TO CONSTRUCT THE BEST TRACKS ARE PROVIDED, UPON REQUEST, O}JDISKETTES.<br />
FORECAST VERIFICATION DATA AND STATISTICS FOR THE JOINT TYPHOON lV&HING CENTER (<strong>JTWC</strong>)<br />
AU SUBMITTED.<br />
!0. DISTRIBUTION /AVAILABILITY OF ABSTRACT<br />
~NCLAS51FIEDIUNLIMITED ~SAME AS RPT.<br />
❑ DTICUSERS<br />
21. ABSTRACT SECURITY CLASSIFICATION<br />
UNCiiASSIKtED<br />
‘2a. NAME OF RESPONSIBLE INDIVIDUAL<br />
22b. TELEPHONE (Include Area Code) 22c. OFFICE SYMBOL<br />
FRANK H. 1Ji3LLS<br />
(671\ . . -344-5240 :IOCC/<strong>JTWC</strong><br />
1<br />
I<br />
00 Form 1473, JUN 86 Previous editions are obsolete. SECURITY CLASSIFICATION OF THIS PAGE
UNCLASSIFIED<br />
Pui)zw<br />
AUT(l.fATIC KZTEOROLCGICAL OBSERVING STATIOilS<br />
SYXGPTIC DATA<br />
TP,C)PICAL CYCLOM<br />
3.XTEXSIYi<br />
TROPICAL CYCLONE BEST ‘TRACK DATA<br />
TROPICAL CYCLOEE FORECASTING<br />
TROPICAL CYCLONE RECO:WAISSAHCE<br />
TROPICAL CYCLONE STEERING :1ODELS<br />
OBJECTIVE F6RECAS’TING TXHHIQJES<br />
TROPICAL CYCLONE FIX DATA<br />
~fIcRolJAvE I~jAGEE~7<br />
DRIFTING<br />
BUOYS<br />
UNCLASSITIEK)