Production of baker's yeast by fermentation
Production of baker's yeast by fermentation
Production of baker's yeast by fermentation

You also want an ePaper? Increase the reach of your titles
YUMPU automatically turns print PDFs into web optimized ePapers that Google loves.
<strong>Production</strong> <strong>of</strong> baker’s <strong>yeast</strong> <strong>by</strong> <strong>fermentation</strong><br />
1
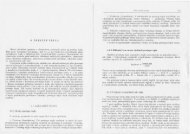
1. THEORY<br />
The primary task <strong>of</strong> bioengineering is to design and operate bioreactors with the best<br />
possible economic effect. Such optimization is not possible without solving material balances<br />
and energetic balances <strong>of</strong> given bioprocess. At design and process control <strong>of</strong> production,<br />
material balances enable optimization <strong>of</strong> effectiveness <strong>of</strong> substrate transformation to products.<br />
Thus, the costs <strong>of</strong> raw materials could be optimized. Similarly, energetic balances help at<br />
optimization <strong>of</strong> stirring costs and <strong>of</strong> costs <strong>of</strong> bioreactor cooling.<br />
Material and enthalpy balances <strong>of</strong> bioreactors might not be formulated without so-called<br />
source terms, which reflect the influence <strong>of</strong> biochemical process on balance <strong>of</strong> components<br />
and energy. At classic chemical reactions, it is relatively straightforward to identify all the<br />
reactions and their stoichiometry. However, the principles <strong>of</strong> classic stoichiometry are rather<br />
hard to apply at biotechnological productions. The reason for this is that thousands <strong>of</strong><br />
reactions take place simultaneously in bioreactors. It is impossible to identify or quantify all<br />
<strong>of</strong> these reactions. Thus, the description <strong>of</strong> stoichiometry and <strong>of</strong> bioprocess kinetics needs to<br />
be simplified. This means that we describe only the transformation <strong>of</strong> key substrates to key<br />
products. The key substrates are especially the sources <strong>of</strong> carbon, nitrogen, oxygen and also<br />
the sources <strong>of</strong> phosphorus and sulfur. Solution <strong>of</strong> such stoichiometric equation is based on<br />
balance <strong>of</strong> atoms <strong>of</strong> carbon, nitrogen, oxygen and hydrogen, which might be replaced <strong>by</strong><br />
balance <strong>of</strong> free electrons. Remaining equations, which are necessary for calculation <strong>of</strong><br />
stoichiometric coefficients, could be obtained from experimental data, such as the respiratory<br />
quotient RQ or yield factors Yx/s, Yp/s, Y O2 /s.<br />
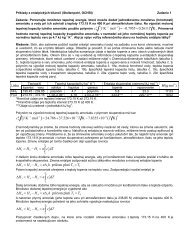
For better illustration, an example is introduced: a stoichiometry <strong>of</strong> aerobic cultivation <strong>of</strong> onecell<br />
proteins from bacteria Methyllococus capsulatus. As a source <strong>of</strong> carbon, methane was<br />
used; ammonia was the source <strong>of</strong> nitrogen and no other product was formed in the liquid<br />
phase. The overall process could be described <strong>by</strong> a simple equation:<br />
s CH 4 + a NH 3 + b O 2 = c CH 1.8 O 0.5 N 0.2 + d CO 2 + e H 2 O (1)<br />
Where the values s, a, b, c, d, e are modified stoichiometric coefficients related to 1 mole <strong>of</strong><br />
consumed substrate Yi/s (mol i/mol s). These are actually the yield factors defined as a ratio<br />
2
<strong>of</strong> reaction rates. In order to solve a stoichiometric equation with 6 unknown stoichiometric<br />
coefficients, six equations are necessary.<br />
These equations are the balances <strong>of</strong> atoms <strong>of</strong> C, N, H, O, s = 1 (modified coefficients related<br />
to 1 mole <strong>of</strong> consumed methane). Another equation is one for calculation <strong>of</strong> average yield<br />
factor Yx/s, which could be calculated from experimental measurement <strong>of</strong> rate <strong>of</strong> substrate<br />
consumption and <strong>of</strong> biomass production (Yx/s = 0.4785).<br />
Balance <strong>of</strong> elements’ atoms comprises a system <strong>of</strong> six algebraic equations, which could be<br />
solved. Thus, it is possible to calculate e.g. the amount <strong>of</strong> oxygen and nitrogen necessary for<br />
preparation <strong>of</strong> given amount <strong>of</strong> biomass.<br />
C :<br />
N :<br />
O :<br />
H :<br />
Y<br />
S:<br />
x/s<br />
:<br />
1s<br />
+ 0 + 0 − 1c<br />
− 1d<br />
+ 0 = 0<br />
0 + 1a + 0 − 0.2c + 0 + 0 = 0<br />
0 +<br />
4s + 3a + 0 −1.8c<br />
+ 0 − 2e = 0<br />
0 + 0 + 0 −1c<br />
+ 0 + 0 = 0.4785<br />
1s +<br />
0 + 2b − 0.5c − 2d −1e<br />
= 0<br />
0 + 0 + 0 + 0 + 0 = 1<br />
2. Aim <strong>of</strong> the work<br />
1. To perform an aerobic cultivation <strong>of</strong> baker’s <strong>yeast</strong> in a laboratory stirred batch<br />
fermentor.<br />
2. To experimentally monitor development <strong>of</strong> concentration <strong>of</strong> substrate, biomass and<br />
oxygen during the process. To calculate average yield factors based on these<br />
measurements.<br />
3. To construct a stoichiometric equation <strong>of</strong> the process. To calculate the values <strong>of</strong><br />
modified stoichiometric coefficients and calculate the total amount <strong>of</strong> consumed<br />
oxygen and produced CO 2 .<br />
3
3. METHODS<br />
3.1 Preparation <strong>of</strong> the inoculum<br />
The composition <strong>of</strong> inoculation medium (in g dm -3 ): d-glucose 25, <strong>yeast</strong> extract (empiric<br />
formula CH 1.91 O 0.56 N 0.23 ) 10, peptone (empiric formula CH 1.795 O 0.5 N 0.2 ) 10, adjust pH to value<br />
<strong>of</strong> 5.8. Dissolve the glucose in 20 cm 3 <strong>of</strong> redistilled water and sterilize separately at 120°C for<br />
20 minutes. Dissolve other components <strong>of</strong> the medium in 60 cm 3 <strong>of</strong> redistilled water, adjust<br />
pH to 5.8 and sterilize at 120 ºC for 20 minutes in a 500 ml Erlenmeyer flask. After the<br />
sterilization, blend both parts <strong>of</strong> the medium aseptically (final volume <strong>of</strong> 80 ml). After<br />
inoculation <strong>by</strong> one eye from inclined agar, which is used for preservation <strong>of</strong> the strain, the<br />
inoculum is cultivated for 15 hours on a rotary shaker at 26 ºC and at stirring <strong>of</strong> 200 rpm.<br />
3.2 Preparation <strong>of</strong> the production medium<br />
3.3<br />
The composition <strong>of</strong> production medium (in g dm -3 ): d-glucose 25, <strong>yeast</strong> extract 10, peptone<br />
10. Dissolve the extract and peptone in 1220 dm 3 <strong>of</strong> redistilled water and pour it into the<br />
reactor. Dissolve glucose in 500 dm 3 <strong>of</strong> redistilled water and pour it into 1000 ml Erlenmeyer<br />
flask. Check the completeness <strong>of</strong> the reactor and test-connect it according to scheme (Fig.1.)<br />
8<br />
7<br />
6<br />
out-gassing<br />
pO<br />
T<br />
air<br />
3<br />
2<br />
5 4 1<br />
pH<br />
FERMENTOR<br />
Fig.1. Scheme <strong>of</strong> connections <strong>of</strong> the fermentor<br />
9<br />
10<br />
B<br />
I<br />
O<br />
S<br />
T<br />
A<br />
T<br />
1 – safety vessel with glass wool, 2 – U-manometer, 3,5,7 – safety vessel, 4,8 – sterile air<br />
micr<strong>of</strong>ilters, 6 – condenser, 9 – storage vessel containing the acid for adjustment <strong>of</strong> pH, 10 –<br />
storage vessel for inoculum.<br />
4
3.4 Fermentation (conditions 28°C, 400 RPM, 1.5 VVM)<br />
• All sensors, except for temperature sensor, are sterilizable and would be sterilized right<br />
inside the reactor. The pH sensor must be calibrated before the sterilization in a<br />
subprogram <strong>of</strong> the main menu CALIBRATION.<br />
• Calibration <strong>of</strong> the pH sensor: use an arrow on the keyboard and set the cursor to second<br />
row and switch the regime from “auto” to “man”. Switching is performed using button<br />
ALTER and the choice is confirmed <strong>by</strong> button ENTER. The cursor relocates to<br />
temperature; manually enter desired temperature. Press ENTER. Immerse the pH sensor<br />
into pH 7 buffer and press ENTER. When the pH value stabilizes, the biostat would<br />
record the value and it will automatically relocate the cursor to following row. Immerse<br />
the electrode into pH 4 buffer and press ENTER. When the pH value stabilizes, the<br />
regime is automatically switched to “auto” and the calibration is successfully finished.<br />
CALIBRATION<br />
pH : 7.2 actual pH value inside reactor<br />
TEMP: 28 C man Temperature at calibration.<br />
- auto: calibration is performed at actual<br />
temperature inside reactor<br />
- man: temperature is set manually<br />
BUFZ: 7.00 pH ok Displaying <strong>of</strong> pH <strong>of</strong> “zero” buffer<br />
Ok – confirmation <strong>of</strong> the calculation <strong>of</strong> zero point.<br />
The cursor automatically skips to row BUFS<br />
BUFS : 4.00 pH ok Displaying <strong>of</strong> pH value for calculation <strong>of</strong> the<br />
slope.<br />
Ok – after confirmation, the cursor skips to second<br />
row and the regime automatically switches to<br />
“auto”.<br />
Connections <strong>of</strong> sensors at the head <strong>of</strong> reactor is displayed on Fig.2.<br />
1 – inlet <strong>of</strong> air<br />
2 – outlet <strong>of</strong> air<br />
3 – condenser<br />
4 – access to temperature sensor<br />
5 – access to oxygen sensor<br />
6 – access to pH sensor<br />
7 – sampling port<br />
8 – inlet <strong>of</strong> acid<br />
9 – inoculum<br />
10 – pouring <strong>of</strong> mediums<br />
Fig.2. Scheme <strong>of</strong> the head <strong>of</strong> bioreactor<br />
5
• The reactor with its accessories is sterilized in a large autoclave. All parts <strong>of</strong> the reactor<br />
might be sterilized with exception <strong>of</strong> the temperature probe, which would be inserted into<br />
the device after sterilization at aseptic conditions. The duplicator must be filled with<br />
water without air bubbles (CONTROL LOOP auto). At sterilization, it is important that<br />
the ends <strong>of</strong> all hoses and all <strong>of</strong> metallic parts would be covered <strong>by</strong> aluminum foil; the<br />
outlet <strong>of</strong> out-gassing from reactor must not be closed. After the sterilization and cooling,<br />
place the reactor into inoculation box and pour inside the glucose solution under aseptic<br />
conditions; insert the temperature probe and connect sterilized air filters to inlet and<br />
outlet <strong>of</strong> air.<br />
• Transport the reactor back to biostat; connect all sensors, cooling water, air supply<br />
according to Fig.1. Turn on the cooling water from central supply and turn on the flow <strong>of</strong><br />
air, also from central supply. Carefully and in parallel, turn on the air supply on the<br />
biostat and simultaneously open the squeezer on the air inlet line. Regulate the flowrate<br />
<strong>of</strong> air using a rotameter, which is an accessory <strong>of</strong> the biostat. Set the value to 3 dm 3 min -1 .<br />
After stabilization <strong>of</strong> temperature, adjust pH to value <strong>of</strong> 5.6 <strong>by</strong> solution <strong>of</strong> H 2 SO 4 .<br />
Turn on the temperature control. In the subprogram CONTROL LOOPS on the first page,<br />
change the regime from “Off” to “Auto”. Set the cursor to respective row, press “ALTER”<br />
and then “ENTER”. Navigate between rows using the arrows in the main keyboard <strong>of</strong> the<br />
biostat.<br />
CONTROL LOOP<br />
TEMP: 30 C<br />
SETP : 28 C<br />
MODE: Off<br />
PARA :<br />
Actual value in the reactor<br />
Set value<br />
Auto: automatic temperature control<br />
Off: the control is turned <strong>of</strong>f<br />
Setting <strong>of</strong> PID controller parameters<br />
Turn on the stirring control: Change the regime from “Off” to “Auto” in the same way.<br />
CONTROL LOOP<br />
STIRR: 250 rpm Actual value in the reactor<br />
SETP : 250 rpm Set value<br />
MODE: Off Auto: automatic control <strong>of</strong> stirring<br />
Off: the control is turned <strong>of</strong>f<br />
PARA :<br />
Setting <strong>of</strong> PID controller parameters<br />
6
Calibration <strong>of</strong> the oxygen sensor: switch air supply to supply <strong>of</strong> nitrogen. Navigate to second<br />
page in subprogram CALIBRATION (navigate between pages using button ENTER). Set<br />
cursor to second row using the arrows on the keyboard and switch regime from “man”<br />
(manual) to “auto”. Switching between regimes is performed using button ALTER; confirm<br />
the choice <strong>by</strong> button ENTER. The cursor relocates to temperature; manually enter desired<br />
temperature. Press ENTER. Navigate the cursor to NITR and press ENTER. When the value<br />
<strong>of</strong> concentration <strong>of</strong> dissolved nitrogen stabilizes at value <strong>of</strong> approximately 0%, navigate the<br />
cursor to NITR and press ENTER. Biostat records a stable value and the cursor automatically<br />
relocates to AIR. Switch the supply <strong>of</strong> nitrogen to supply <strong>of</strong> air and wait until the value <strong>of</strong><br />
concentration <strong>of</strong> dissolved oxygen grows to value <strong>of</strong> approximately 100%. Press ENTER to<br />
record a stable value corresponding to saturation state. The cursor relocates to row TEMP and<br />
the regime switches automatically to “Auto”. The calibration is successfully finished.<br />
CALIBRATION<br />
2 nd page pO 2 : 87.2 % Actual value <strong>of</strong> pO 2 in the reactor<br />
TEMP: 28 C man Temperature at calibration.<br />
- auto: calibration is performed at actual<br />
temperature inside reactor<br />
- man: the temperature is set manually<br />
NITR : 0.0 % ok Displaying <strong>of</strong> “zero” pO 2<br />
Ok – confirmation <strong>of</strong> zero point calculation. The<br />
cursor relocates to row AIR.<br />
AIR : 100 % ok Displaying <strong>of</strong> pO 2 value for calculation <strong>of</strong> the<br />
slope.<br />
Ok – after confirmation, the cursor relocates to the<br />
second row and the regime switches automatically<br />
to “auto”.<br />
After calibration <strong>of</strong> oxygen sensor, disconnect the reactor and place it into inoculation box.<br />
Transfer 80 ml <strong>of</strong> 15-hour (old) inoculum under sterile conditions into separator connected to<br />
bioreactor. Reconnect the reactor to biostat. Turn on the inlet <strong>of</strong> cooling water and air. Turn<br />
on the temperature control and stirring control and, after checking the completeness <strong>of</strong> the<br />
device and connections, inoculate the reactor.<br />
Inoculation: Pump the inoculum aseptically to reactor using a peristaltic pump, or inoculate<br />
the fermentor under flame through nozzle 10 (Fig.2.).<br />
Pump the inoculum to reactor at time zero, turn on the data collection.<br />
7
Turn on the data sampling to computer: turn on the computer and start the program Biostat B<br />
Data Collection. The computer starts to sample the data only after the Biostat relays the signal<br />
to it. The sampling rate could be altered only on Biostat in subprogram MAINTENANCE.<br />
Enter the data sampling rate and then alter the mode <strong>by</strong> “ALTER” and confirm <strong>by</strong> “ENTER”.<br />
MAINTANANCE<br />
2 nd page Printer<br />
CYCLE : 1 min<br />
MODE: Off<br />
PARAM :<br />
Data sampling interval<br />
Start: Data collecting is turned on<br />
Off: Data collection is turned <strong>of</strong>f<br />
Setting <strong>of</strong> parameters<br />
S<strong>of</strong>tware: PROCESS VALUES – it displays the actual values <strong>of</strong> monitored process quantities<br />
TRENDY – it displays the development <strong>of</strong> monitored quantities during<br />
<strong>fermentation</strong> process<br />
PRINTED VALUES – it displays the printing layout<br />
The program continuously stores the data into file printer.txt. For use in program EXCEL, it is<br />
better to export given data to a file in form <strong>of</strong> a database.<br />
Data exporting: Within the window TRENDY, press the icon <strong>of</strong> a diskette located in lower<br />
right corner “Copy to file” and store the data in a file “name.dbf”.<br />
3.5 Sampling<br />
Sample extraction:<br />
1. During cultivation, take an approximately 6 ml sample every hour; during exponential<br />
phase <strong>of</strong> growth, take sample every 45 minutes.<br />
Sample processing:<br />
Use 5 ml <strong>of</strong> sample for measurement <strong>of</strong> optical density.<br />
Centrifuge 0,8 ml <strong>of</strong> sample in an Eppendorf vial (300 rpm, 10 minutes). After centrifugation,<br />
use micropipette to carefully draw clear supernatant into a clean Eppendorf vial and freeze it.<br />
At the end <strong>of</strong> cultivation, all sampled supernatants would be used to determine the<br />
concentration <strong>of</strong> the substrate – the glucose.<br />
8
3.6 Measurement <strong>of</strong> optical density<br />
1. 5 ml <strong>of</strong> sample centrifuge (3000 RPM min -1 , 10 minutes). Wet biomass rinse gradually<br />
3 times with isotonic solution and centrifuge at 3000 RPM min -1 , 10 minutes. Then<br />
add accurately 5 ml <strong>of</strong> isotonic solution, mix well a measure optical density <strong>of</strong> cells<br />
against isotonic solution at wavelength <strong>of</strong> 600 nm. If the sample absorbance is greater<br />
than 0.7, the sample would be properly diluted <strong>by</strong> isotonic solution. The concentration<br />
<strong>of</strong> wet biomass would be determined during growth using a calibration line.<br />
Construction <strong>of</strong> calibration line<br />
1. Prepare 100 ml <strong>of</strong> standard biomass solution <strong>of</strong> concentration <strong>of</strong> 3 g/l in a isotonic<br />
solution. Dilute the standard biomass solution with physiological solution to reach<br />
concentrations <strong>of</strong>: 0.3, 0.15, 0.12, 0.075, 0.06, 0.05 g/l (each solution with volume <strong>of</strong><br />
10 ml). Measure absorbance <strong>of</strong> all solutions in comparison with absorbance <strong>of</strong> isotonic<br />
solution at 600 nm. Using the measurements <strong>of</strong> absorbance <strong>of</strong> standard biomass<br />
solutions, construct a calibration dependence cx = f (A600), calculate the parameters<br />
<strong>of</strong> calibration equation and calculate the regression coefficient.<br />
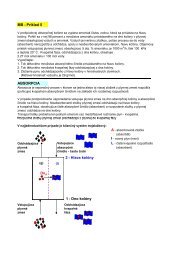
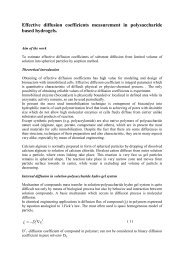
3.6 Determination <strong>of</strong> glucose concentration <strong>by</strong> a glucose test<br />
Principle<br />
The product <strong>of</strong> the enzymatic reaction – the glucose – is quantified using a glucose test GLU<br />
GOD 6 x250. The basis <strong>of</strong> glucose quantification is formation <strong>of</strong> colored complex, whose<br />
absorbance is measured spectrophotometrically. This complex is formed <strong>by</strong> a selective<br />
oxidation <strong>of</strong> glucose to hydrogen peroxide and gluconate using enzyme glucose-oxidase.<br />
Formed hydrogen peroxide is quantified <strong>by</strong> an oxidation reaction with substituted phenol and<br />
4-aminoantipyrine catalyzed <strong>by</strong> enzyme peroxidase; a red colored product is formed.<br />
Principle <strong>of</strong> quantification <strong>of</strong> released glucose:<br />
β − D − glucose + H O + O ⎯⎯⎯⎯⎯→ D − gluconate + H O<br />
(2)<br />
glucose−oxidase<br />
2 2 2 2 2<br />
H O + dye ⎯⎯⎯⎯→ dye + H O<br />
(3)<br />
peroxidase<br />
2 2 reduced<br />
oxidized 2<br />
9
Method<br />
1. Heat the glucose-test solution to 30°C. Transfer 1 ml <strong>of</strong> this solution into each<br />
Eppendorf vial using a micropipette. The number <strong>of</strong> Eppendorf vials is equal to<br />
number <strong>of</strong> glucose standards + 3x the number <strong>of</strong> samples + 1 (blind experiment).<br />
2. Add 10 µl <strong>of</strong> water into the first Eppendorf vial (blind experiment) and add 10 µl <strong>of</strong><br />
glucose standards or samples into the remaining vials. Immediately after addition, stir<br />
the mixture thoroughly.<br />
3. Store the rack with Eppendorf vials in a dark place and let them incubate for 30<br />
minutes.<br />
4. After the end <strong>of</strong> incubation, take the samples and measure absorbance <strong>of</strong> each sample<br />
at absorbance maximum <strong>of</strong> quantified product (500 nm). Use water as a reference<br />
solution.<br />
5. To construct a calibration line, use already prepared standard solutions <strong>of</strong> glucose <strong>of</strong><br />
concentration 0 – 0.02 mol/l.<br />
3.7 Determination <strong>of</strong> cell dry mass<br />
After fifth hour <strong>of</strong> cultivation, take approximately 13 ml sample and use 12 ml to<br />
determine the dry mass. Centrifuge the 12 ml <strong>of</strong> sample and rinse it 3-times <strong>by</strong> isotonic<br />
solution. Dissolve centrifuged biomass in approximately 2 ml <strong>of</strong> isotonic solution and dry<br />
it at 80°C until a constant weight is reached.<br />
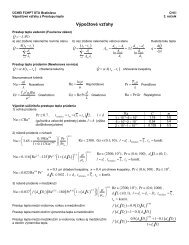
4. EVALUTATION OF EXPERIMENTAL DATA<br />
1. Construct the calibration dependence using measured absorbance <strong>of</strong> standard glucose<br />
solution; calculate the parameters <strong>of</strong> calibration equation and the regression coefficient.<br />
2. Calculate the concentration <strong>of</strong> remaining glucose in samples from <strong>fermentation</strong> using a<br />
calibration line.<br />
10
3. Construct a calibration dependence using the measurement <strong>of</strong> standard solutions <strong>of</strong><br />
biomass; calculate the parameters <strong>of</strong> calibration equation and the regression coefficient.<br />
4. Calculate the concentration <strong>of</strong> wet biomass and <strong>of</strong> dry cells in samples from <strong>fermentation</strong><br />
using the calibration line <strong>of</strong> the biomass.<br />
5. The concentration <strong>of</strong> oxygen in equilibrium with partial pressure <strong>of</strong> oxygen in the gaseous<br />
phase (c O2<br />
*) would be calculated using Henry equation:<br />
O2<br />
*<br />
O2cO2<br />
p = H<br />
(4)<br />
where<br />
p O2 is the partial pressure <strong>of</strong> O 2 in the gaseous phase, H O2 is Henry’s constant<br />
for oxygen,<br />
*<br />
c O2 is the equilibrium concentration <strong>of</strong> oxygen in water ( H O2 = 8,0107*10 4 Pa<br />
m 3 mol -1 at 25ºC; Nielsen: Bioreaction Engineering principles, 2003).<br />
6. Using experimental data (% <strong>of</strong> equilibrium oxygen concentration in water), determine the<br />
molar volumetric concentration <strong>of</strong> oxygen (mol/m 3 ) in water. Use following equation:<br />
1.<br />
c<br />
c (%)<br />
100<br />
O2 *<br />
O2 = ⋅cO2<br />
(5)<br />
7. Visualize graphically the development <strong>of</strong> all monitored parameters during <strong>fermentation</strong>.<br />
8. Describe the cultivation <strong>by</strong> a single total stoichiometric equation; determine the values <strong>of</strong><br />
stoichiometric coefficients and calculate the amount <strong>of</strong> consumed oxygen and produced<br />
CO 2 at <strong>fermentation</strong>.<br />
Note:<br />
- If the top <strong>of</strong> pO 2 probe is replaced, the probe must be activated for 24 hours while<br />
connected to switched-on biostat. If only the electrolyte is being replaced, one-hour<br />
duration is sufficient. It is better to store the probe without electrolyte in a dry state.<br />
- Overpressure in the reactor: 79 mm.<br />
- The pH probe is being screwed tight in place only <strong>by</strong> hand, not <strong>by</strong> a wrench.<br />
11
5. BIOSTAT OPERATIONS MANUAL<br />
5.1 Structure <strong>of</strong> the main menu<br />
Main functions<br />
o PROCESS VALUES<br />
Functions<br />
: it displays the actual values <strong>of</strong> process variables<br />
o CALIBRATION : calibration <strong>of</strong> sensors and pumps (pH, pO 2 , acid, base, anti-foam agent /<br />
substrate 1, level <strong>of</strong> liquid / substrate 2)<br />
o CONTROL LOOPS : control <strong>of</strong> process variables<br />
o MAINTENANCE<br />
: configuration <strong>of</strong> output signals, setting <strong>of</strong> time and date, setting <strong>of</strong> data<br />
sampling interval<br />
5.2 Process values<br />
The menu comprises <strong>of</strong> four pages; the navigation between them is performed <strong>by</strong> arrows. It<br />
displays on-line measured values and their actual values in the reactor.<br />
2 nd page<br />
TEMP : 40.5 ºC<br />
STIRR: 1200 rpm<br />
pH : 10.2 pH<br />
pO 2 : 80.4 %<br />
3 rd page<br />
ACID :<br />
BASE :<br />
AFOAM:<br />
LEVEL :<br />
4 th page<br />
FOAM : <strong>of</strong>f<br />
LEVEL: on<br />
13