Standards with Progressions grades K-HS v. 1.3 - Kentucky ...
Standards with Progressions grades K-HS v. 1.3 - Kentucky ...
Standards with Progressions grades K-HS v. 1.3 - Kentucky ...
- No tags were found...

Create successful ePaper yourself
Turn your PDF publications into a flip-book with our unique Google optimized e-Paper software.
Clusters<br />
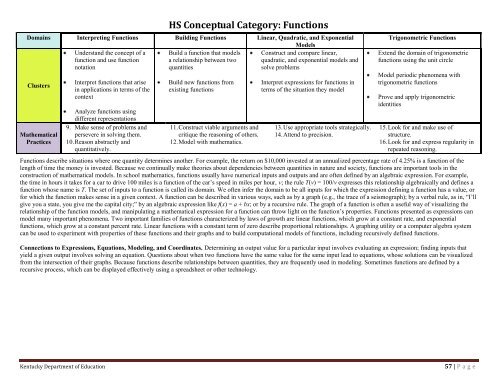
<strong>HS</strong> Conceptual Category: Functions<br />
Domains Interpreting Functions Building Functions Linear, Quadratic, and Exponential<br />
Models<br />
Understand the concept of a Build a function that models Construct and compare linear,<br />
function and use function a relationship between two quadratic, and exponential models and<br />
notation<br />
quantities<br />
solve problems<br />
Mathematical<br />
Practices<br />
Interpret functions that arise<br />
in applications in terms of the<br />
context<br />
Analyze functions using<br />
different representations<br />
9. Make sense of problems and<br />
persevere in solving them.<br />
10. Reason abstractly and<br />
quantitatively.<br />
Build new functions from<br />
existing functions<br />
11. Construct viable arguments and<br />
critique the reasoning of others.<br />
12. Model <strong>with</strong> mathematics.<br />
Interpret expressions for functions in<br />
terms of the situation they model<br />
13. Use appropriate tools strategically.<br />
14. Attend to precision.<br />
Trigonometric Functions<br />
Extend the domain of trigonometric<br />
functions using the unit circle<br />
Model periodic phenomena <strong>with</strong><br />
trigonometric functions<br />
Prove and apply trigonometric<br />
identities<br />
15. Look for and make use of<br />
structure.<br />
16. Look for and express regularity in<br />
repeated reasoning.<br />
Functions describe situations where one quantity determines another. For example, the return on $10,000 invested at an annualized percentage rate of 4.25% is a function of the<br />
length of time the money is invested. Because we continually make theories about dependencies between quantities in nature and society, functions are important tools in the<br />
construction of mathematical models. In school mathematics, functions usually have numerical inputs and outputs and are often defined by an algebraic expression. For example,<br />
the time in hours it takes for a car to drive 100 miles is a function of the car’s speed in miles per hour, v; the rule T(v) = 100/v expresses this relationship algebraically and defines a<br />
function whose name is T. The set of inputs to a function is called its domain. We often infer the domain to be all inputs for which the expression defining a function has a value, or<br />
for which the function makes sense in a given context. A function can be described in various ways, such as by a graph (e.g., the trace of a seismograph); by a verbal rule, as in, ―I’ll<br />
give you a state, you give me the capital city;‖ by an algebraic expression like f(x) = a + bx; or by a recursive rule. The graph of a function is often a useful way of visualizing the<br />
relationship of the function models, and manipulating a mathematical expression for a function can throw light on the function’s properties. Functions presented as expressions can<br />
model many important phenomena. Two important families of functions characterized by laws of growth are linear functions, which grow at a constant rate, and exponential<br />
functions, which grow at a constant percent rate. Linear functions <strong>with</strong> a constant term of zero describe proportional relationships. A graphing utility or a computer algebra system<br />
can be used to experiment <strong>with</strong> properties of these functions and their graphs and to build computational models of functions, including recursively defined functions.<br />
Connections to Expressions, Equations, Modeling, and Coordinates. Determining an output value for a particular input involves evaluating an expression; finding inputs that<br />
yield a given output involves solving an equation. Questions about when two functions have the same value for the same input lead to equations, whose solutions can be visualized<br />
from the intersection of their graphs. Because functions describe relationships between quantities, they are frequently used in modeling. Sometimes functions are defined by a<br />
recursive process, which can be displayed effectively using a spreadsheet or other technology.<br />
<strong>Kentucky</strong> Department of Education<br />
57 | P a g e