Standards with Progressions grades K-HS v. 1.3 - Kentucky ...
Standards with Progressions grades K-HS v. 1.3 - Kentucky ...
Standards with Progressions grades K-HS v. 1.3 - Kentucky ...
- No tags were found...

You also want an ePaper? Increase the reach of your titles
YUMPU automatically turns print PDFs into web optimized ePapers that Google loves.
Domains<br />
Clusters<br />
Mathematical<br />
Practices<br />
Interpreting Categorical and<br />
Quantitative Data<br />
Summarize, represent, and<br />
interpret data on a single<br />
count or measurement<br />
variable<br />
Summarize, represent, and<br />
interpret data on two<br />
categorical and quantitative<br />
variables Interpret linear<br />
models<br />
1. Make sense of problems and<br />
persevere in solving them.<br />
2. Reason abstractly and<br />
quantitatively.<br />
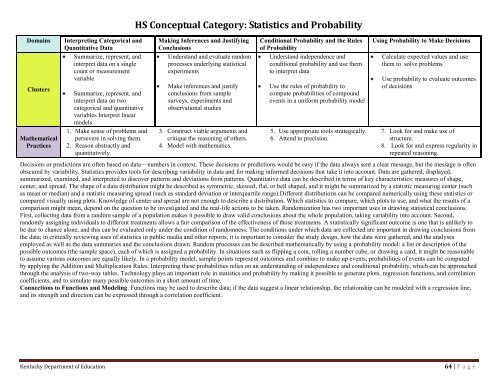
<strong>HS</strong> Conceptual Category: Statistics and Probability<br />
Making Inferences and Justifying<br />
Conclusions<br />
Understand and evaluate random<br />
processes underlying statistical<br />
experiments<br />
Make inferences and justify<br />
conclusions from sample<br />
surveys, experiments and<br />
observational studies<br />
3. Construct viable arguments and<br />
critique the reasoning of others.<br />
4. Model <strong>with</strong> mathematics.<br />
Conditional Probability and the Rules<br />
of Probability<br />
Understand independence and<br />
conditional probability and use them<br />
to interpret data<br />
Use the rules of probability to<br />
compute probabilities of compound<br />
events in a uniform probability model<br />
5. Use appropriate tools strategically.<br />
6. Attend to precision.<br />
Using Probability to Make Decisions<br />
Calculate expected values and use<br />
them to solve problems<br />
Use probability to evaluate outcomes<br />
of decisions<br />
7. Look for and make use of<br />
structure.<br />
8. Look for and express regularity in<br />
repeated reasoning.<br />
Decisions or predictions are often based on data—numbers in context. These decisions or predictions would be easy if the data always sent a clear message, but the message is often<br />
obscured by variability. Statistics provides tools for describing variability in data and for making informed decisions that take it into account. Data are gathered, displayed,<br />
summarized, examined, and interpreted to discover patterns and deviations from patterns. Quantitative data can be described in terms of key characteristics: measures of shape,<br />
center, and spread. The shape of a data distribution might be described as symmetric, skewed, flat, or bell shaped, and it might be summarized by a statistic measuring center (such<br />
as mean or median) and a statistic measuring spread (such as standard deviation or interquartile range).Different distributions can be compared numerically using these statistics or<br />
compared visually using plots. Knowledge of center and spread are not enough to describe a distribution. Which statistics to compare, which plots to use, and what the results of a<br />
comparison might mean, depend on the question to be investigated and the real-life actions to be taken. Randomization has two important uses in drawing statistical conclusions.<br />
First, collecting data from a random sample of a population makes it possible to draw valid conclusions about the whole population, taking variability into account. Second,<br />
randomly assigning individuals to different treatments allows a fair comparison of the effectiveness of those treatments. A statistically significant outcome is one that is unlikely to<br />
be due to chance alone, and this can be evaluated only under the condition of randomness. The conditions under which data are collected are important in drawing conclusions from<br />
the data; in critically reviewing uses of statistics in public media and other reports, it is important to consider the study design, how the data were gathered, and the analyses<br />
employed as well as the data summaries and the conclusions drawn. Random processes can be described mathematically by using a probability model: a list or description of the<br />
possible outcomes (the sample space), each of which is assigned a probability. In situations such as flipping a coin, rolling a number cube, or drawing a card, it might be reasonable<br />
to assume various outcomes are equally likely. In a probability model, sample points represent outcomes and combine to make up events; probabilities of events can be computed<br />
by applying the Addition and Multiplication Rules. Interpreting these probabilities relies on an understanding of independence and conditional probability, which can be approached<br />
through the analysis of two-way tables. Technology plays an important role in statistics and probability by making it possible to generate plots, regression functions, and correlation<br />
coefficients, and to simulate many possible outcomes in a short amount of time.<br />
Connections to Functions and Modeling. Functions may be used to describe data; if the data suggest a linear relationship, the relationship can be modeled <strong>with</strong> a regression line,<br />
and its strength and direction can be expressed through a correlation coefficient.<br />
<strong>Kentucky</strong> Department of Education<br />
64 | P a g e