Standards with Progressions grades K-HS v. 1.3 - Kentucky ...
Standards with Progressions grades K-HS v. 1.3 - Kentucky ...
Standards with Progressions grades K-HS v. 1.3 - Kentucky ...
- No tags were found...

You also want an ePaper? Increase the reach of your titles
YUMPU automatically turns print PDFs into web optimized ePapers that Google loves.
Domains<br />
Clusters<br />
Mathematical<br />
Practices<br />
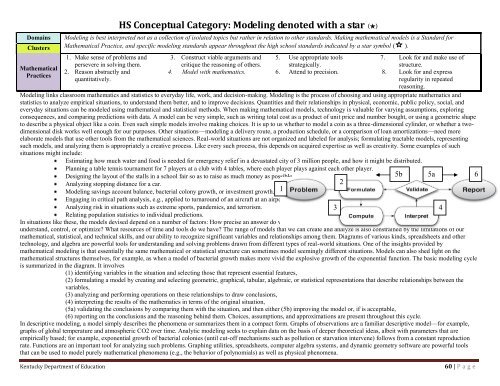
<strong>HS</strong> Conceptual Category: Modeling denoted <strong>with</strong> a star (★)<br />
Modeling is best interpreted not as a collection of isolated topics but rather in relation to other standards. Making mathematical models is a Standard for<br />
Mathematical Practice, and specific modeling standards appear throughout the high school standards indicated by a star symbol ( ).<br />
1. Make sense of problems and<br />
persevere in solving them.<br />
2. Reason abstractly and<br />
quantitatively.<br />
3. Construct viable arguments and<br />
critique the reasoning of others.<br />
4. Model <strong>with</strong> mathematics.<br />
5. Use appropriate tools<br />
strategically.<br />
6. Attend to precision.<br />
7. Look for and make use of<br />
structure.<br />
8. Look for and express<br />
regularity in repeated<br />
reasoning.<br />
Modeling links classroom mathematics and statistics to everyday life, work, and decision-making. Modeling is the process of choosing and using appropriate mathematics and<br />
statistics to analyze empirical situations, to understand them better, and to improve decisions. Quantities and their relationships in physical, economic, public policy, social, and<br />
everyday situations can be modeled using mathematical and statistical methods. When making mathematical models, technology is valuable for varying assumptions, exploring<br />
consequences, and comparing predictions <strong>with</strong> data. A model can be very simple, such as writing total cost as a product of unit price and number bought, or using a geometric shape<br />
to describe a physical object like a coin. Even such simple models involve making choices. It is up to us whether to model a coin as a three-dimensional cylinder, or whether a twodimensional<br />
disk works well enough for our purposes. Other situations—modeling a delivery route, a production schedule, or a comparison of loan amortizations—need more<br />
elaborate models that use other tools from the mathematical sciences. Real-world situations are not organized and labeled for analysis; formulating tractable models, representing<br />
such models, and analyzing them is appropriately a creative process. Like every such process, this depends on acquired expertise as well as creativity. Some examples of such<br />
situations might include:<br />
Estimating how much water and food is needed for emergency relief in a devastated city of 3 million people, and how it might be distributed.<br />
Planning a table tennis tournament for 7 players at a club <strong>with</strong> 4 tables, where each player plays against each other player.<br />
Designing the layout of the stalls in a school fair so as to raise as much money as possible.<br />
Analyzing stopping distance for a car.<br />
Modeling savings account balance, bacterial colony growth, or investment growth. 1<br />
Engaging in critical path analysis, e.g., applied to turnaround of an aircraft at an airport.<br />
Analyzing risk in situations such as extreme sports, pandemics, and terrorism.<br />
Relating population statistics to individual predictions.<br />
In situations like these, the models devised depend on a number of factors: How precise an answer do we want or need What aspects of the situation do we most need to<br />
understand, control, or optimize What resources of time and tools do we have The range of models that we can create and analyze is also constrained by the limitations of our<br />
mathematical, statistical, and technical skills, and our ability to recognize significant variables and relationships among them. Diagrams of various kinds, spreadsheets and other<br />
technology, and algebra are powerful tools for understanding and solving problems drawn from different types of real-world situations. One of the insights provided by<br />
mathematical modeling is that essentially the same mathematical or statistical structure can sometimes model seemingly different situations. Models can also shed light on the<br />
mathematical structures themselves, for example, as when a model of bacterial growth makes more vivid the explosive growth of the exponential function. The basic modeling cycle<br />
is summarized in the diagram. It involves<br />
(1) identifying variables in the situation and selecting those that represent essential features,<br />
(2) formulating a model by creating and selecting geometric, graphical, tabular, algebraic, or statistical representations that describe relationships between the<br />
variables,<br />
(3) analyzing and performing operations on these relationships to draw conclusions,<br />
(4) interpreting the results of the mathematics in terms of the original situation,<br />
(5a) validating the conclusions by comparing them <strong>with</strong> the situation, and then either (5b) improving the model or, if is acceptable,<br />
(6) reporting on the conclusions and the reasoning behind them. Choices, assumptions, and approximations are present throughout this cycle.<br />
In descriptive modeling, a model simply describes the phenomena or summarizes them in a compact form. Graphs of observations are a familiar descriptive model—for example,<br />
graphs of global temperature and atmospheric CO2 over time. Analytic modeling seeks to explain data on the basis of deeper theoretical ideas, albeit <strong>with</strong> parameters that are<br />
empirically based; for example, exponential growth of bacterial colonies (until cut-off mechanisms such as pollution or starvation intervene) follows from a constant reproduction<br />
rate. Functions are an important tool for analyzing such problems. Graphing utilities, spreadsheets, computer algebra systems, and dynamic geometry software are powerful tools<br />
that can be used to model purely mathematical phenomena (e.g., the behavior of polynomials) as well as physical phenomena.<br />
2<br />
5b<br />
3 4<br />
5a 6<br />
<strong>Kentucky</strong> Department of Education<br />
60 | P a g e